Article

Blade Twist Effects on Aerodynamic Performance and Noise Reduction in a Multirotor Propeller

1
Graduate School of Engineering, Chiba University, Chiba 263-8522, Japan
2
Central Research Institute of Electrical Power Industry, Abiko 270-1194, Japan
3
Center for Aerial Intelligent Vehicles, Chiba University, Chiba 263-8522, Japan
4
Japan Aerospace Exploration Agency, Tokyo 181-0015, Japan
*
Author to whom correspondence should be addressed.
Drones 2023, 7(4), 252; https://doi.org/10.3390/drones7040252
Submission received: 9 March 2023 / Revised: 31 March 2023 / Accepted: 3 April 2023 / Published: 6 April 2023

Abstract

:
This paper presents a novel integrated study of the aerodynamic performance and acoustic signature of multirotor propellers with a specific focus on the blade twist angle effect. Experimental measurements and computational fluid dynamic (CFD) simulations were utilized to examine and compare the aerodynamic performance and noise reduction between twisted and untwisted blades. A 2D phase-locked particle image velocimetry (PIV) was employed to visualize flow structures at specific blade locations in terms of tip vortices and trailing edge vortices. Good consistency between the simulations and measurements was observed in aerodynamic and acoustic performance. It is verified that the propellers with twisted blades enable a maximum increase of 9.3% in the figure of merit compared to untwisted blades while achieving the same thrust production and are further capable to reduce overall sound pressure level by a maximum of 4.3 dB. CFD results reveal that the twisted propeller remarkedly reduces far-field loading noise by suppressing trailing-edge vortices, hence mitigating kinetic energy fluctuation at the blade tip, while having minimal impact on thickness noise. This study points to the crucial role of blade twists in altering the aeroacoustic characteristics, indicating that optimal designs could lead to significant improvements in both aerodynamic and acoustic performance.

1. Introduction

The recent development in small-scale unmanned aerial vehicles (UAVs) of rotorcraft has shown remarkable progress for commercial applications due to their affordability, easy operation, and intellectualization [1,2,3]. The optimization of aerodynamic performance is a main subject associated with the development of UAV propulsion systems because it directly alters flight time and endurance; noise reduction turns out to be another crucial aspect in terms of acoustic performance improvement for resolving issues of urban noise pollution [4,5,6] and relevant laws [7].
Many studies of the optimal propeller design [8,9,10,11,12] have been conducted to explore a solution to resolve the aeroacoustic tradeoff between aerodynamic force production and noise reduction and to optimize the drone propeller design to improve the aerodynamic efficiency and suppress noise emission [8,9,13,14,15,16,17]. In the previous studies, while the aeroacoustic characteristics of various propellers have been investigated in terms of the design variables including the twist angle, airfoil, chord length, and add-in structure, due to the complex interactions among the design variables, developing an optimal propeller design always poses a remarked challenge. The twist angle, which refers to the variation in blade angle along the radial direction, is an essential geometric parameter altering the distribution of lift, drag, and torque along blade span [18], thus playing a crucial role in enhancing aeroacoustic and aerodynamic performance. Jiang et al. (2022) [8] proposed a propeller design with a long chord length and higher pitch angles at the tip to improve aerodynamic efficiency and noise emissions. Ning et al. (2018) [9] developed a bio-inspired propeller with a unique feather-like planform shape and twisted angles, which could generate the same thrust while suppressing noise under constant power input. Moreover, various optimization methodologies of genetic algorithms [15,16,17], particle swarm optimization [14], and neural networks [13] have been proposed to identify the optimal design parameters. However, the multi-parameters/objectives of the problem and the complex interplay among design variables are of high challenges, and therefore a comprehensive understanding of the underlying aeroacoustic mechanisms is necessary to explore the correlation between unsteady and complex flow structures and the induced noise emission associated with the propellers.
Particle Image Velocimetry (PIV) techniques [9,19,20,21], computational fluid dynamic (CFD)-based simulations [8,22], and hover stand experiments [10,11,12] are widely utilized in exploring the aeroacoustic characteristics of multirotor’s propellers. The PIV method enables quantifying the velocity field with high spatial and temporal resolutions, thus visualizing the near-and far-field flow structures about the propeller. Additionally, employment of the phase-locked PIV in conjunction with the advanced image processing techniques can capture the highly unsteady flow structures at different phases of the propeller rotation [20,23,24], which is crucial for uncovering how the transient flow field alters the noise generation. Using PIVs, Shukla and Komerath visualized the tip vortices and trailing edge vortices to investigate the wake interaction [19] associated with rotor-to-rotor spacing [21] in terms of the instantaneous and time-averaged rotor downwash velocity profiles. Ning et al. (2017) [25] experimentally investigated the noise reduction in a serrated trailing edge propeller, which was conducted by a combination of the phase-averaged and phase-locked velocity fields, reporting that the vortex dynamics and wake topology are highly altered by the serration geometry. CFD simulations have also been broadly utilized in quantifying both near-blade flow structures and force production, which is capable to correlate the unsteady flow structures with aerodynamic force production for arbitrary propellers with complex geometries under various boundary conditions. In the term of aeroacoustic, the CFD simulation can be further coupled with the Ffowcs–Williams and Hawkings (FW–H) analogy approach to predict the acoustic characteristics due to the aeroacoustic interaction between moving objects/blades and the surrounding flows [26]. Meanwhile, the hover stand experiment as well as indoor [27] or outdoor [28] acoustic test provides a useful method to investigate and evaluate the aerodynamic and acoustic characteristics in specific environments [12,29], thus being widely employed for the validation of CFD simulations. Using CFD simulations and FW-H analogy, Rong et al. [30] reported that the owl-inspired LE serrations of tandem wing models enable remarked improvement in aeroacoustic performance. With CFD simulations and anechoic chamber-based experiments, Jiang et al. [31] proposed a noise prediction model and radiation modes of propeller tonal noise. However, a systematic study of the underlying aeroacoustic mechanisms in association with flow structures, aerodynamics performance, and acoustic signature by combining PIV measurements, CFD simulations and hover stand experiments have not been conducted yet.
In this study, we developed an integrated platform to evaluate the aeroacoustic performance of multirotor propellers by combining the PIV-based flow visualization, the CFD-based prediction of flow structures and aerodynamic force production, and the hover stand experiment-based acoustic measurements. With the platform, we examined the effects of blade twist angle on the aeroacoustic performance to explore the low-noise, high-efficiency propeller design while uncovering the relevant flow physics and the underlying acoustic mechanisms. This paper is structured as follows. In Section 2, we give a brief description of the propeller geometries, the experimental set-ups for both PIV measurements and the hover-stand experiment, the CFD-based modeling, and the numerical methods for far-field acoustic prediction. In Section 3 a comparison between experimental measurements and CFD-based simulations is undertaken in terms of flow structures, aerodynamic forces, and noise sources, with a focus on the aerodynamic and acoustic performance of the twisted and untwisted propellers. In Section 4, we discuss the near-blade flow structures particularly associated with tip vortices and trailing edge vortices. Finally, in Section 5 we summarize the main findings of this study and give an outlook for future tasks.

2. Materials and Methods

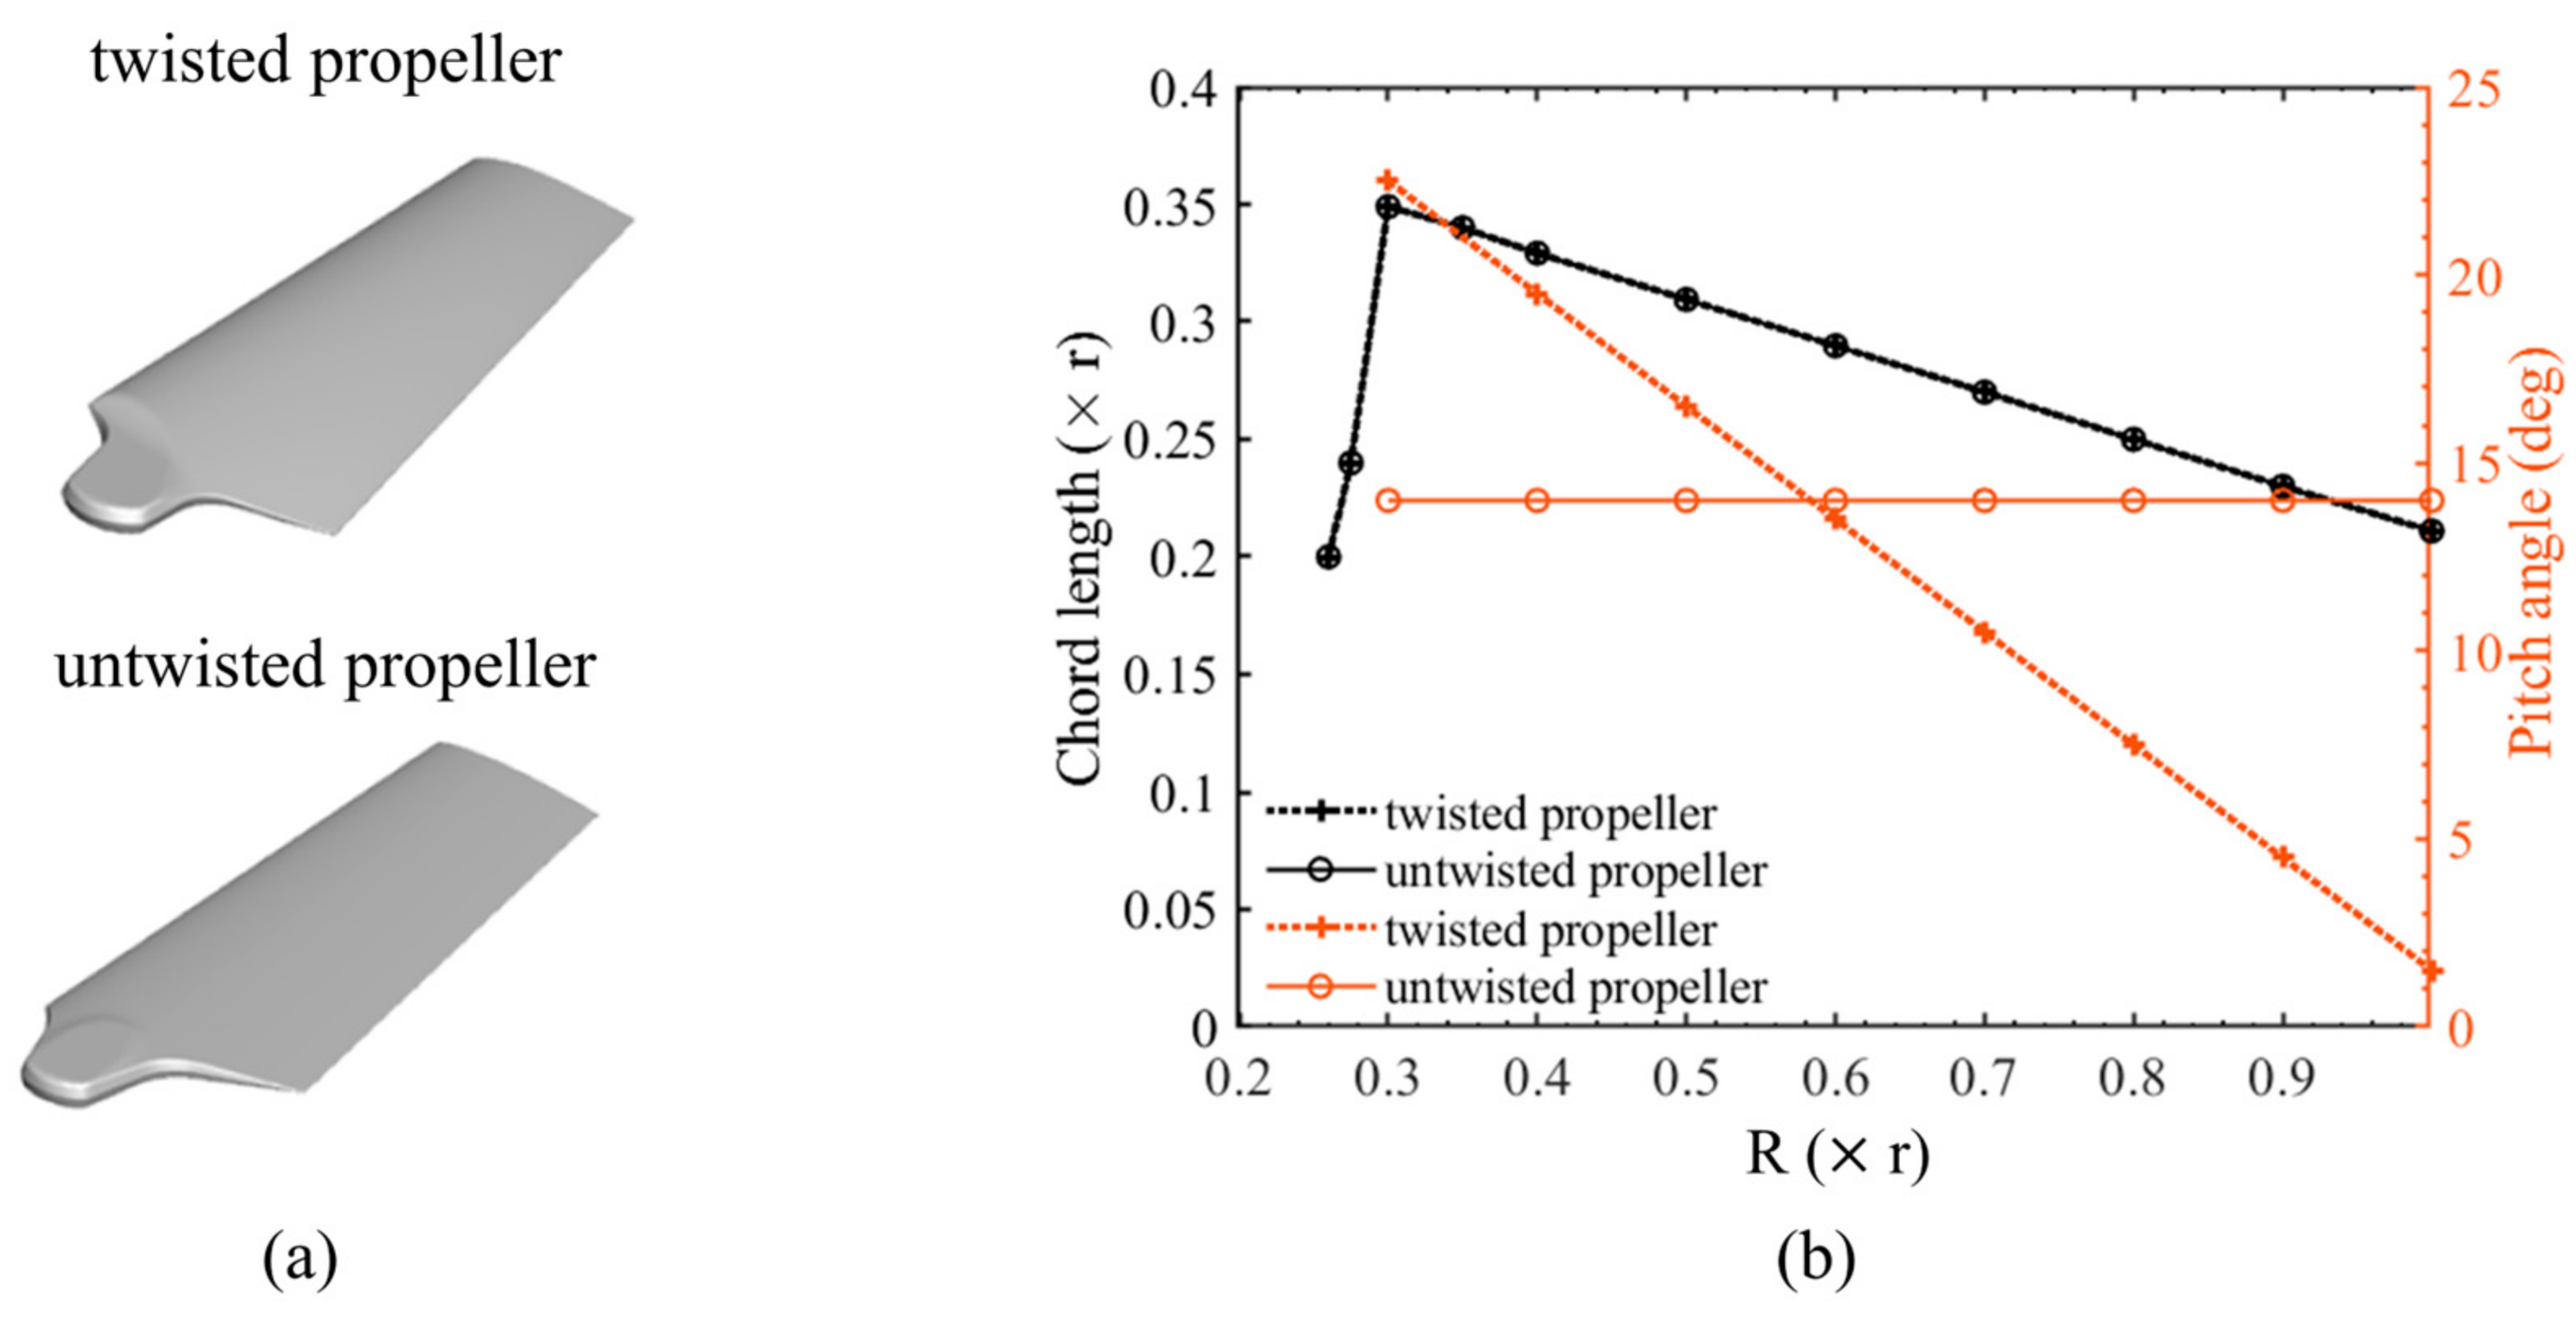
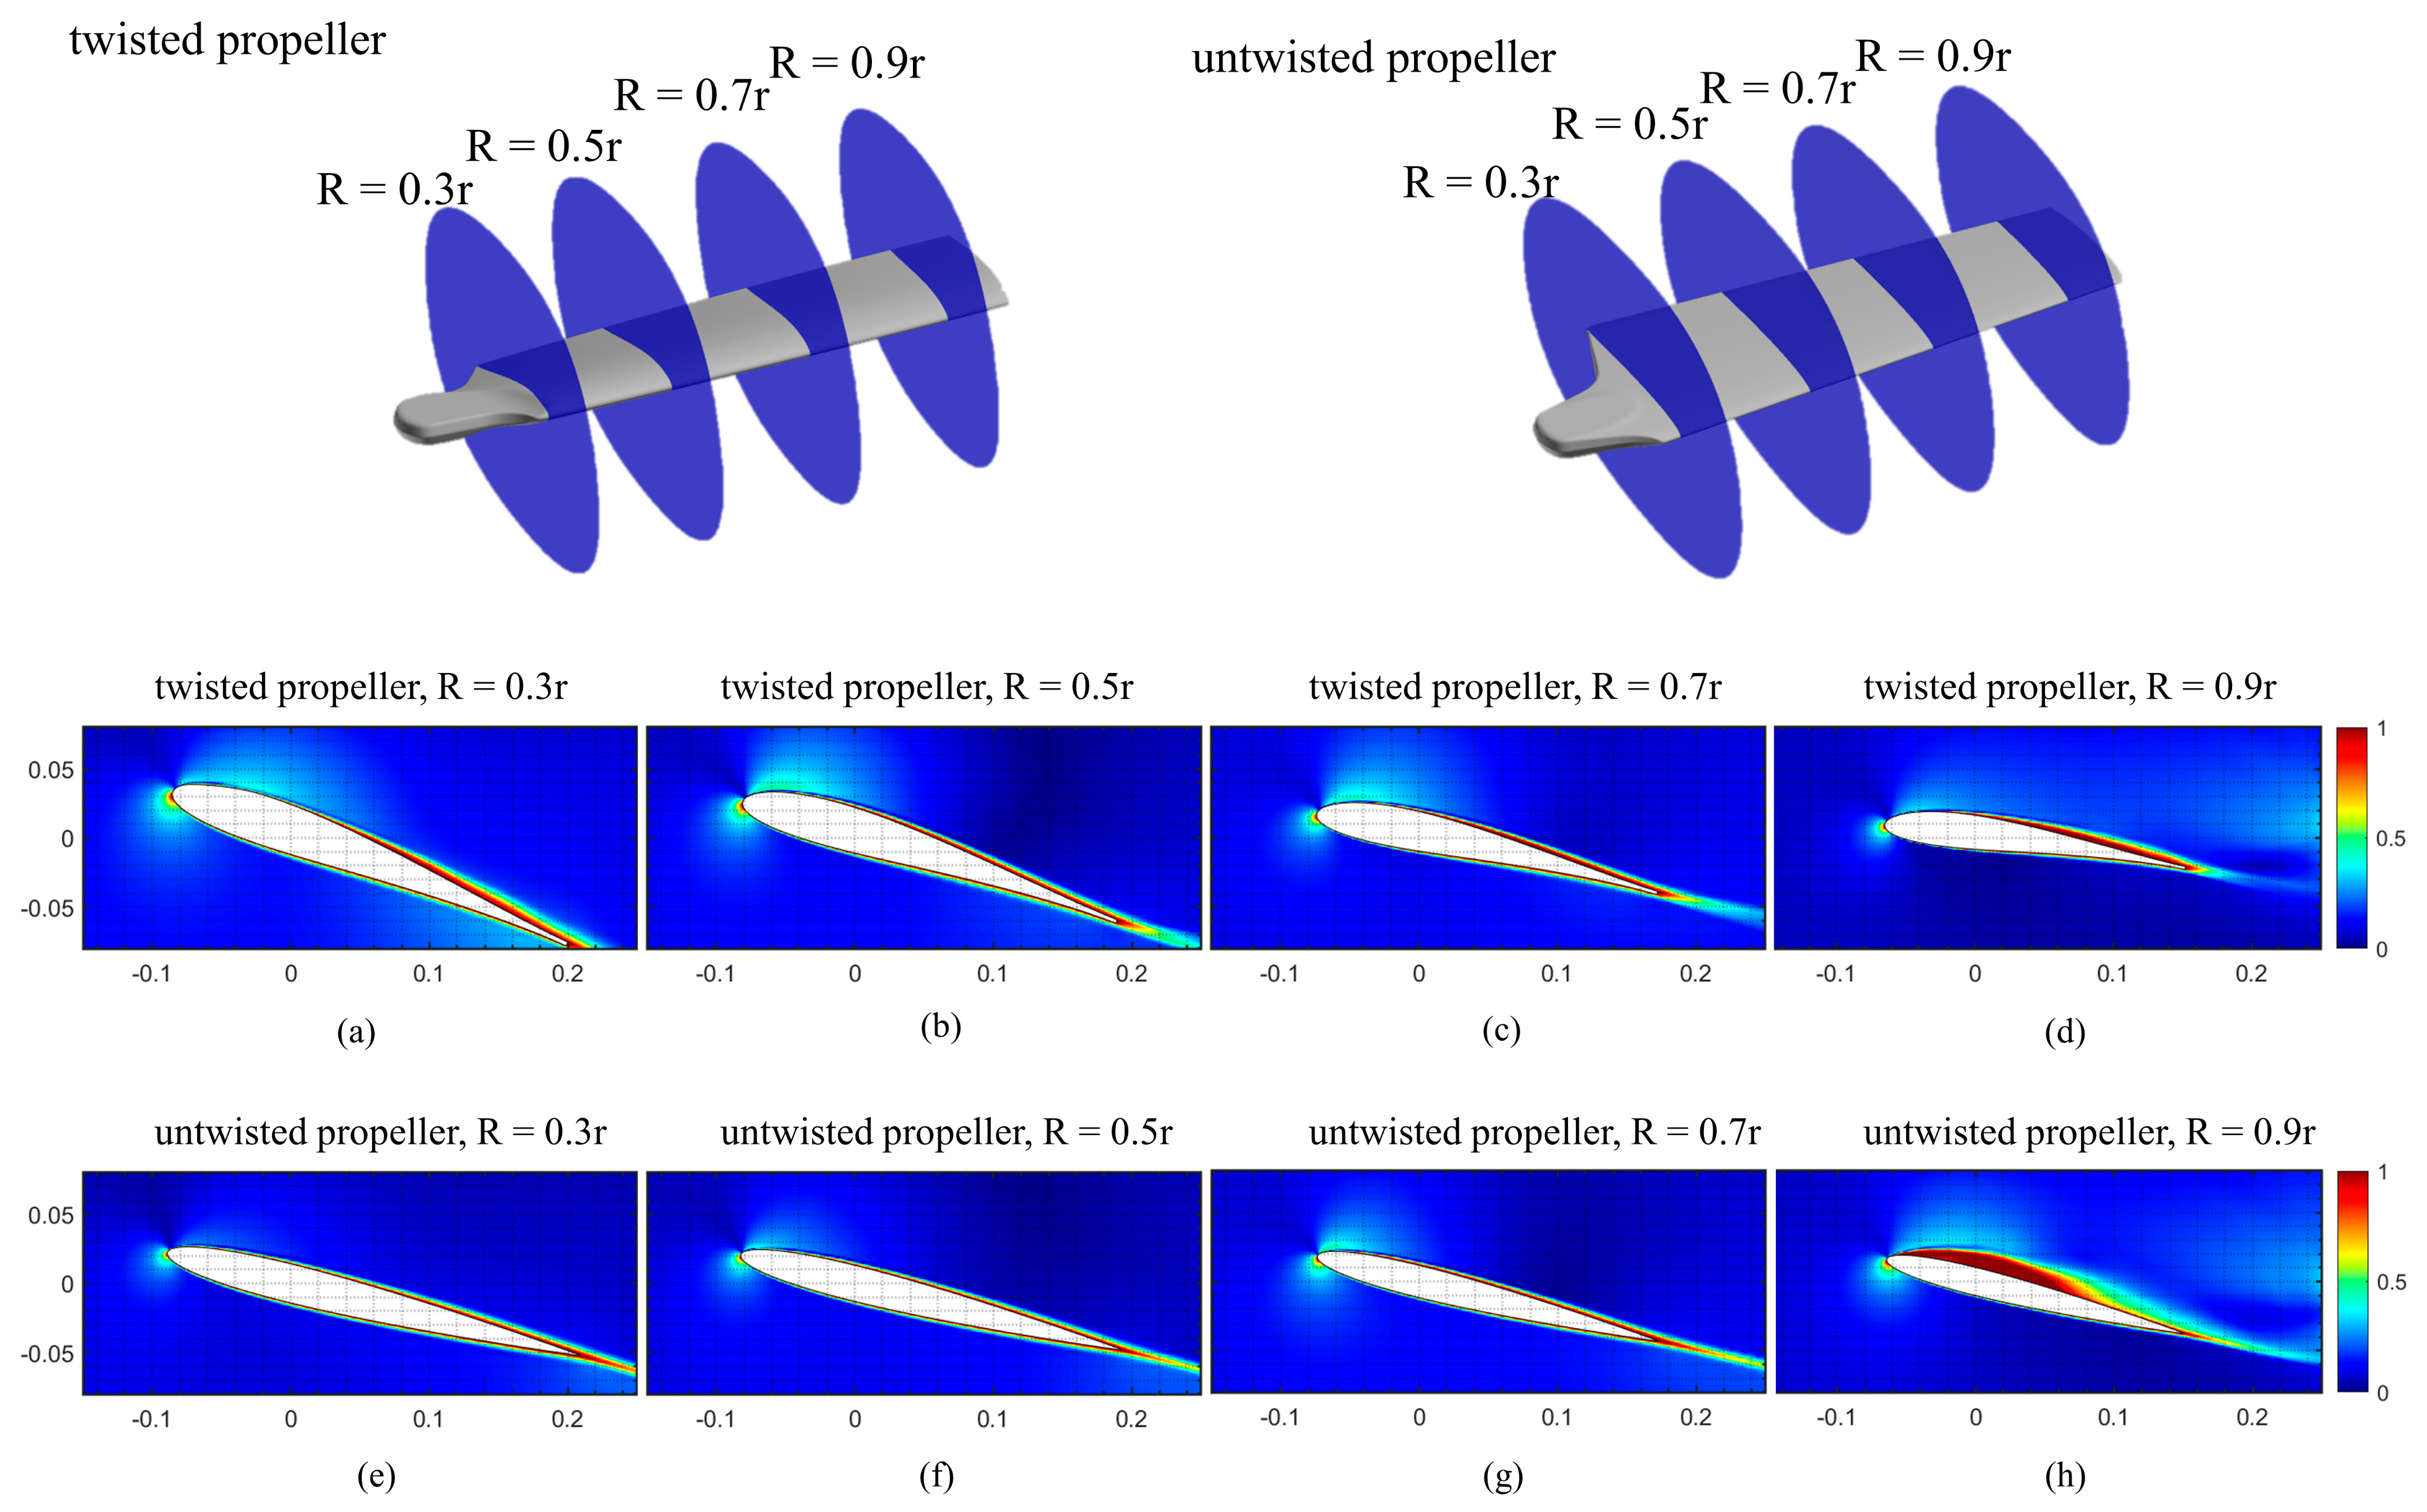
2.1. Propeller Models with Twisted and Untwisted Blades
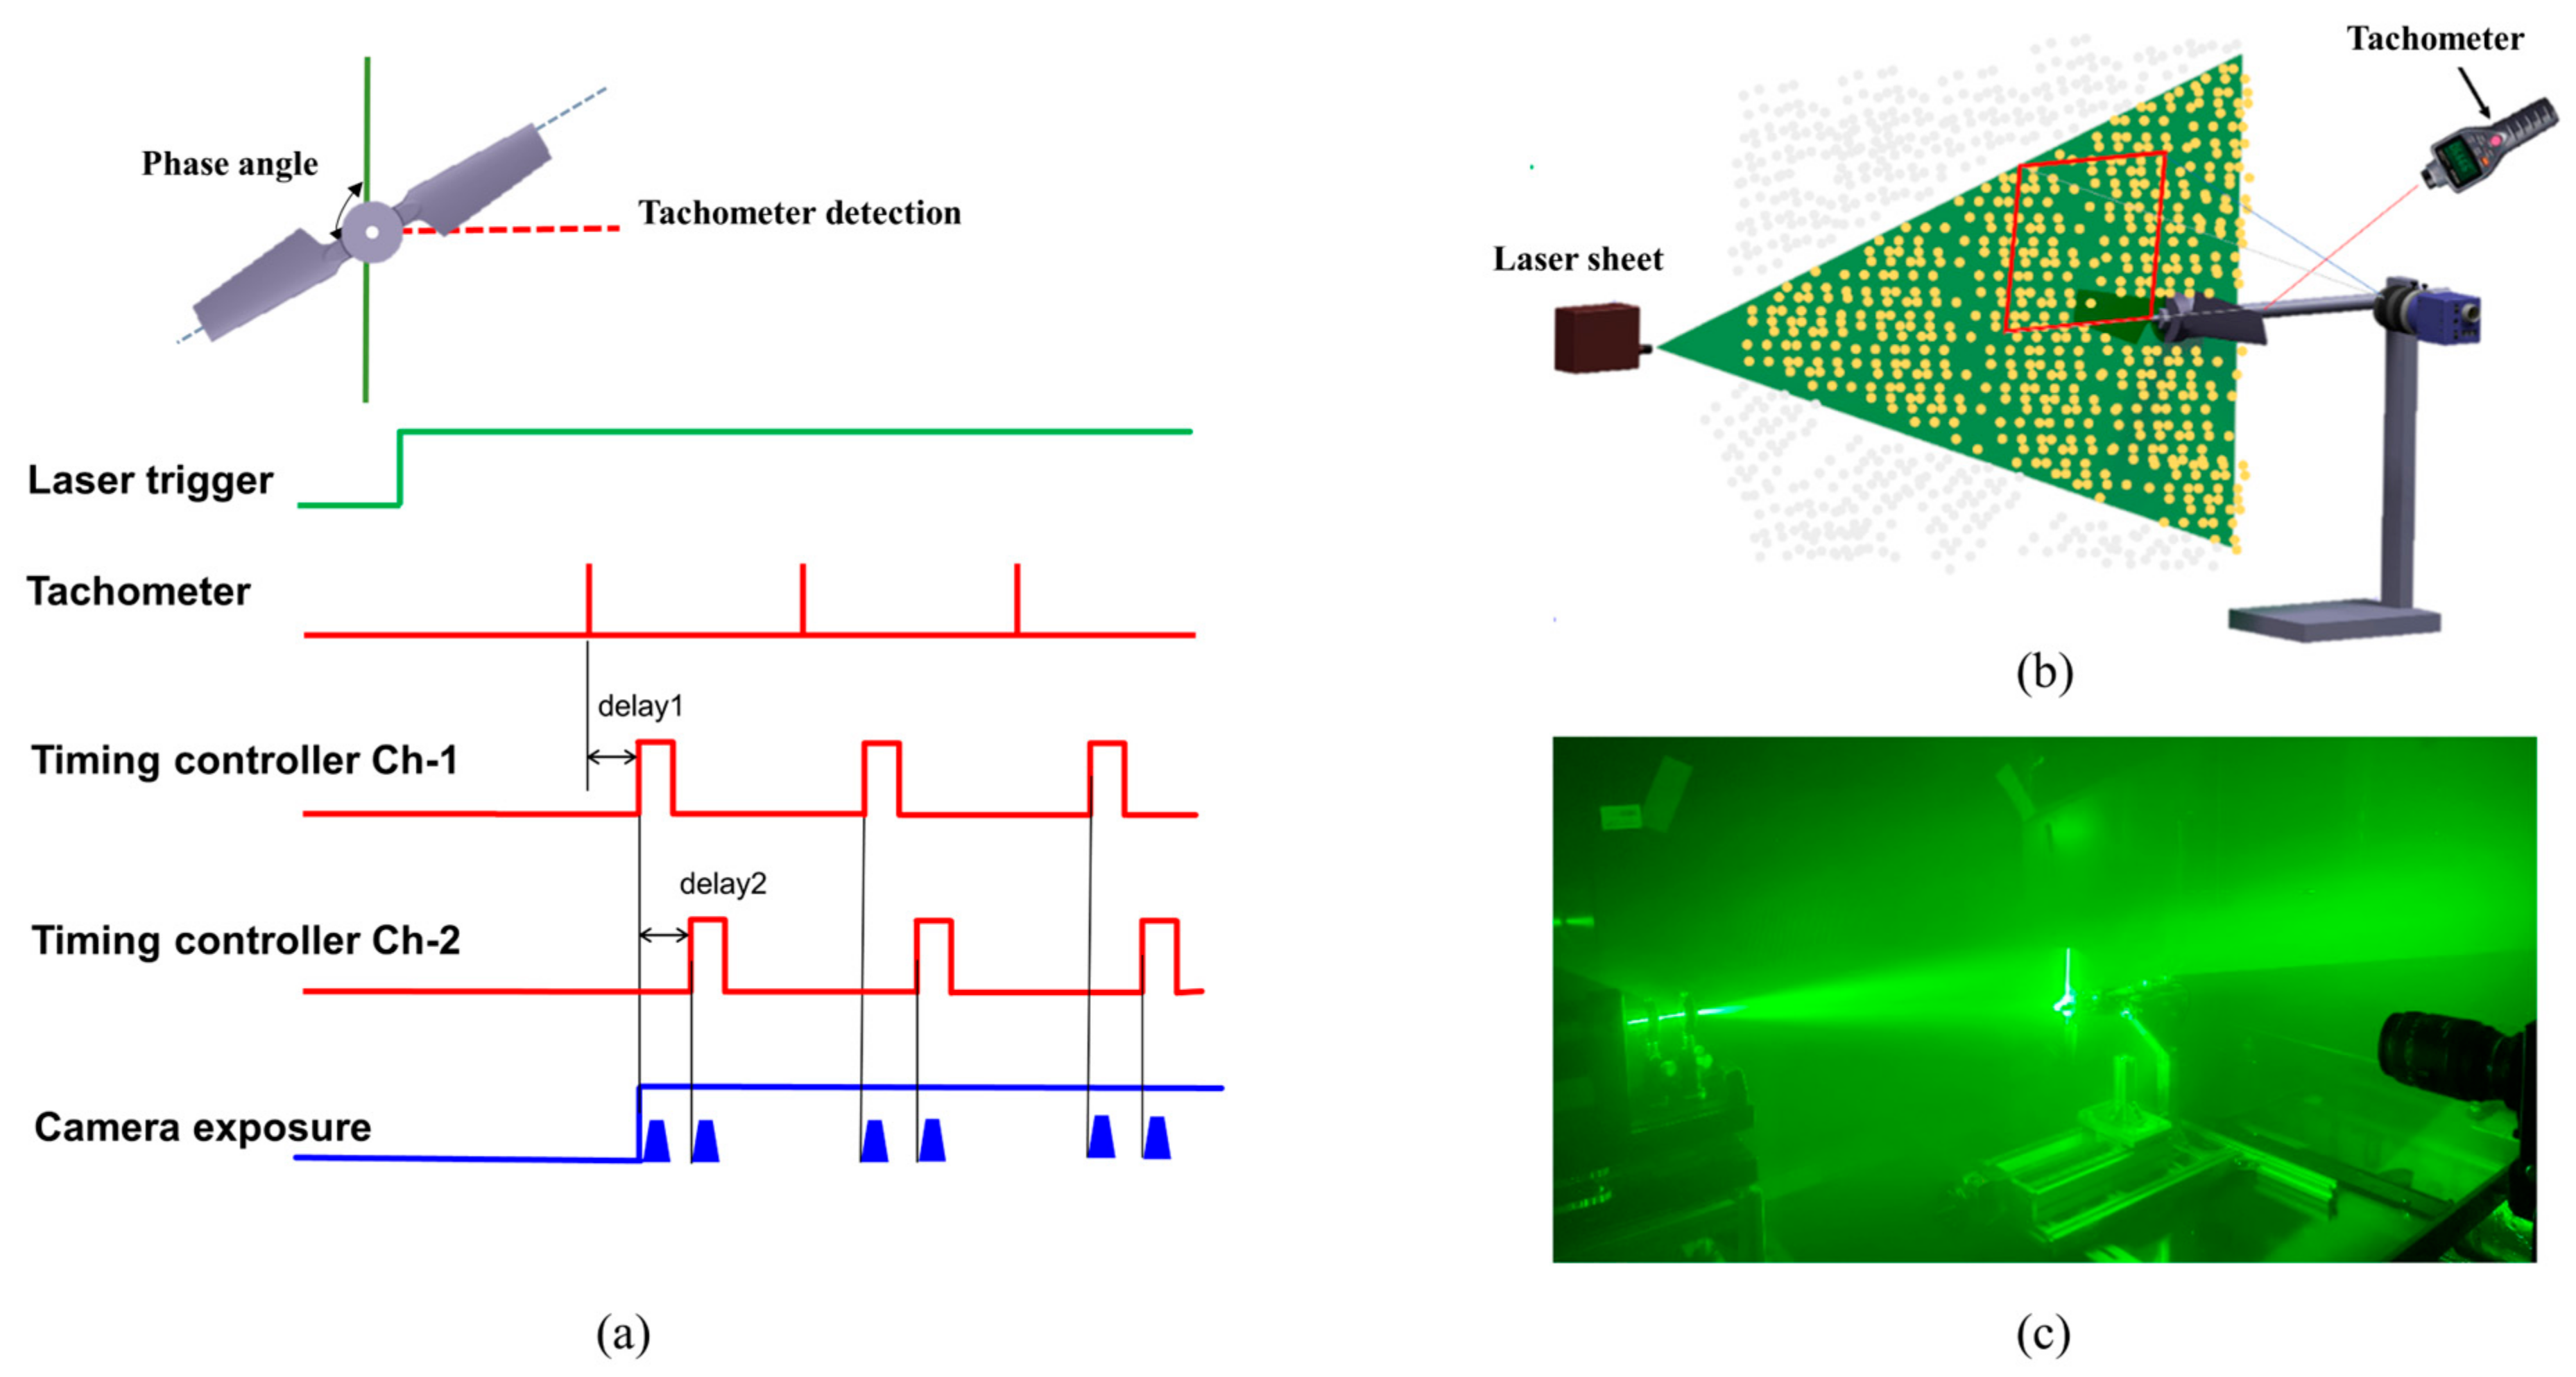
In this study, two propeller models with twisted and untwisted blades were employed to examine the blade twist effects on aerodynamic and aeroacoustic performance. The Japan Aerospace Exploration Agency (JAXA) designed the propellers for a 7.9 kg quad-rotor drone, with the untwisted blade being fitted with a NACA 0009 thin airfoil for fast control response and acrobatic flight demonstrations [32,33]. To enhance the hovering performance of the rotor, the blade design was modified to incorporate a large twist angle and a cambered airfoil (OAF117). Figure 1 illustrates the two propellers with twisted and untwisted blades and shows the definitions of sectional chords and spanwise twist distributions. Both propellers have a diameter of 200 mm, with a root chord length of 34.9 mm and a tip chord length of 21.1 mm. The twisted propeller was designed with a linear spanwise distribution in pitch angle from 22.5° at a 30% radius from the root down to 1.5° at the tip; the untwisted propeller had a constant pitch angle of 14° from root to tip. The propellers were made from a laser-cured plastic material and fabricated using a high-precision stereolithography (SLA) 3D printing process, which was capable of accurately reproducing the 3D blade geometry as designed.

2.2. PIV Experiment

The PIV experiment was performed using a hover-stand experimental set-up in a wind tunnel located at Chiba University’s Nishi Chiba Campus. The wind tunnel had a test section of 2 m in length, 1 m in width, and 1 m in height. The PIV system consisted of a diode-pumped solid-state laser (DSSPL) system (SANZ co., Tokyo, Japan) emitting light at 532 nm with an output power of 10 W, a high-speed camera (Photron Inc., Tokyo, Japan), an 8-channel timing controller (LC800, LabSmith Inc., Livermore, CA, USA), and a pulse output tachometer (HIOKI co., Ueda, Japan). Details can be found in Ikeda et al. (2018) [34].
The flow was seeded with tracer particles with a diameter of 1 μm, produced by a PIVpart14 (PIVTEC–GmbH, Göttingen, Germany), and recirculated in the wind tunnel to ensure uniform mixing. The high-speed camera, with a resolution of 1024 pixels × 596 pixels, captured PIV images at a rate of 4000 frames per second (fps) with a shutter time of 1/10,000 s. The PIV measurements were performed in four passes, starting with an interrogation area of 128 pixels in length with a step of 32 pixels, followed by an area of 64 pixels with a step of 32 pixels in the second pass, 32 pixels in length with a step of 16 pixels in the third pass, and finally, 16 pixels in length with a step of 8 pixels in the fourth pass. The PIV measurements were calculated using the PIVlab software [35], with the Fast Fourier Transform window deformation algorithm, standard correlation robustness, and Gaussian 2 × 3-point estimator for sub-pixel movement.
In this study, we further developed a Phase-Locked Particle Image Velocimetry (PIV) technique to measure the velocity field in a rotational propeller system. Special techniques were developed to overcome the difficulties in the conventional PIV methods for a rotating system, which was achieved by synchronizing with the propeller’s rotational phase, thus enabling a comparatively accurate measurement of the velocity field at a specific locked-phase angle [24]. We used a continuous laser to illuminate the tracer particles while the camera was triggered to capture the particle images of the flow field by each delayed propeller passing pulse. As illustrated in Figure 2a, the first delayed digital signal (delay 1) was utilized to obtain phase-locked PIV measurements at various predetermined phase angles, while the second delayed digital signal (delay 2) was used to introduce a delay between the pairwise PIV images for instantaneous velocity calculations. The instantaneous velocities were measured at the 12 different locked-phase angles ranging from 0° to 330° with a 30° increment through adjusting the delayed time in LC800. The conventional free-run PIV were also conducted to measure the time-averaged velocity fields. The average flow field of the free-run measurements was calculated via 4000 PIV images, and 2000 PIV images were captured for the phase-locked measurements.

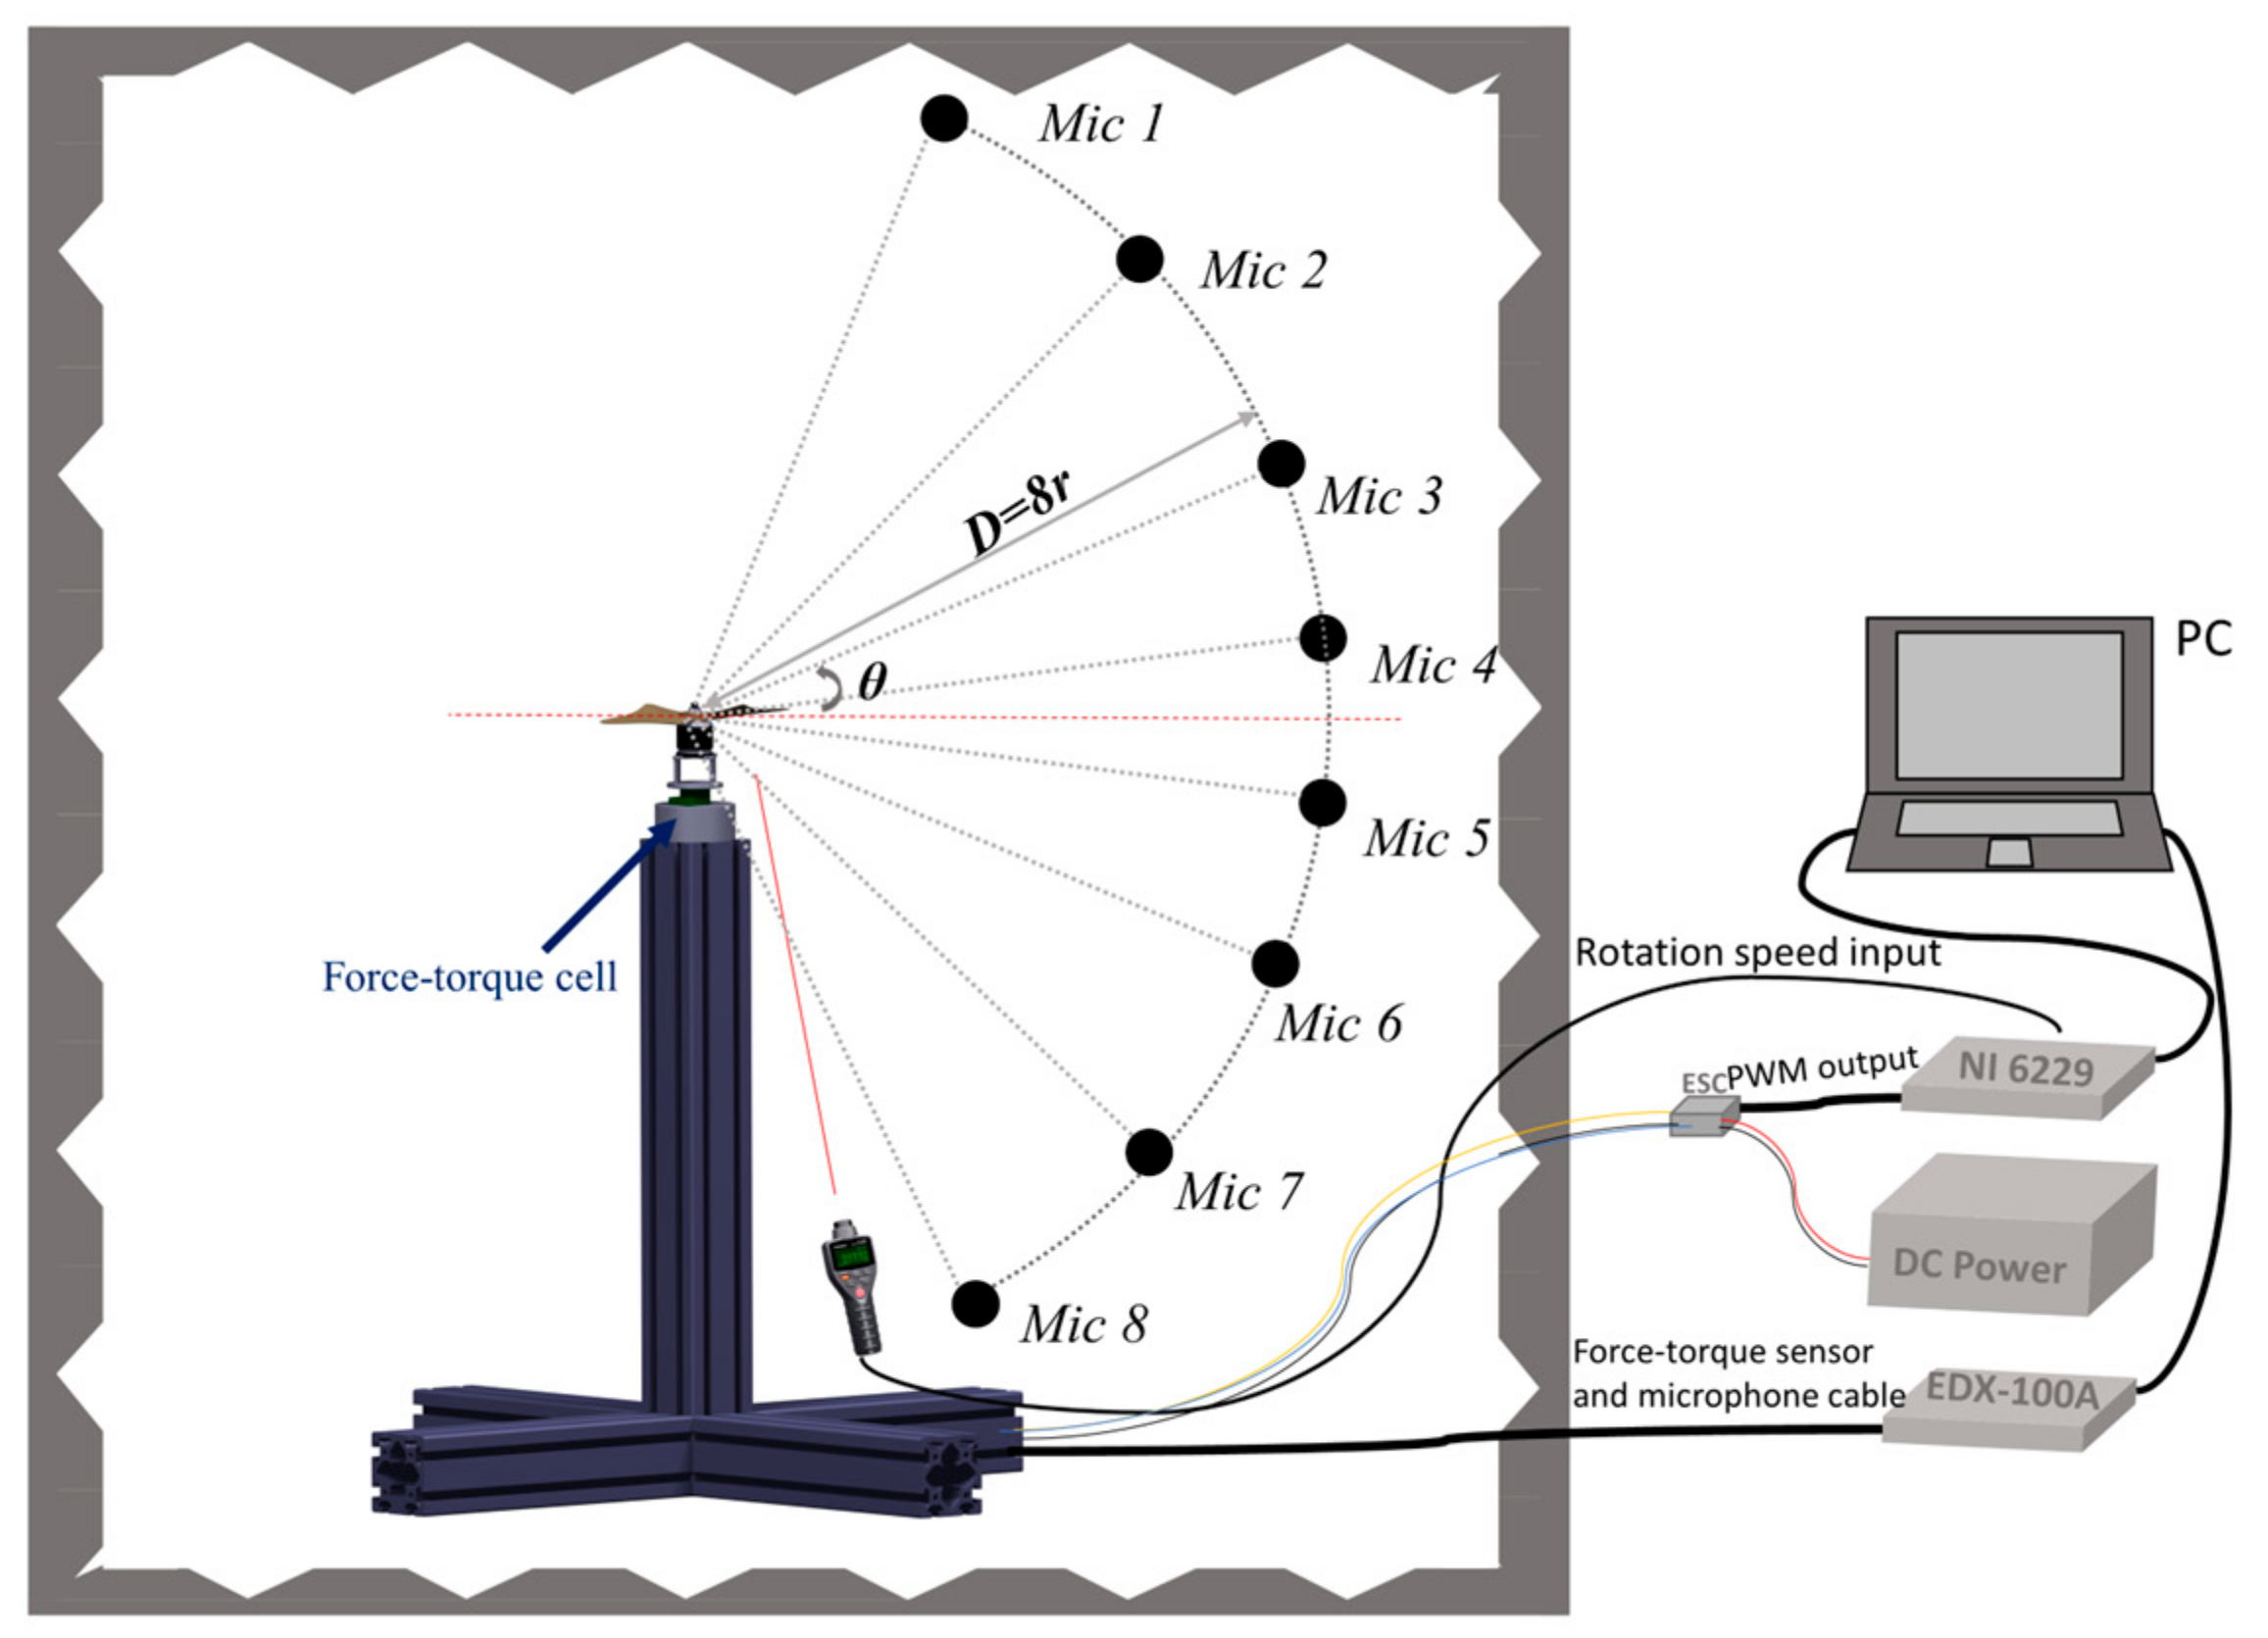
2.3. Measurements of Aerodynamic Force and Sound
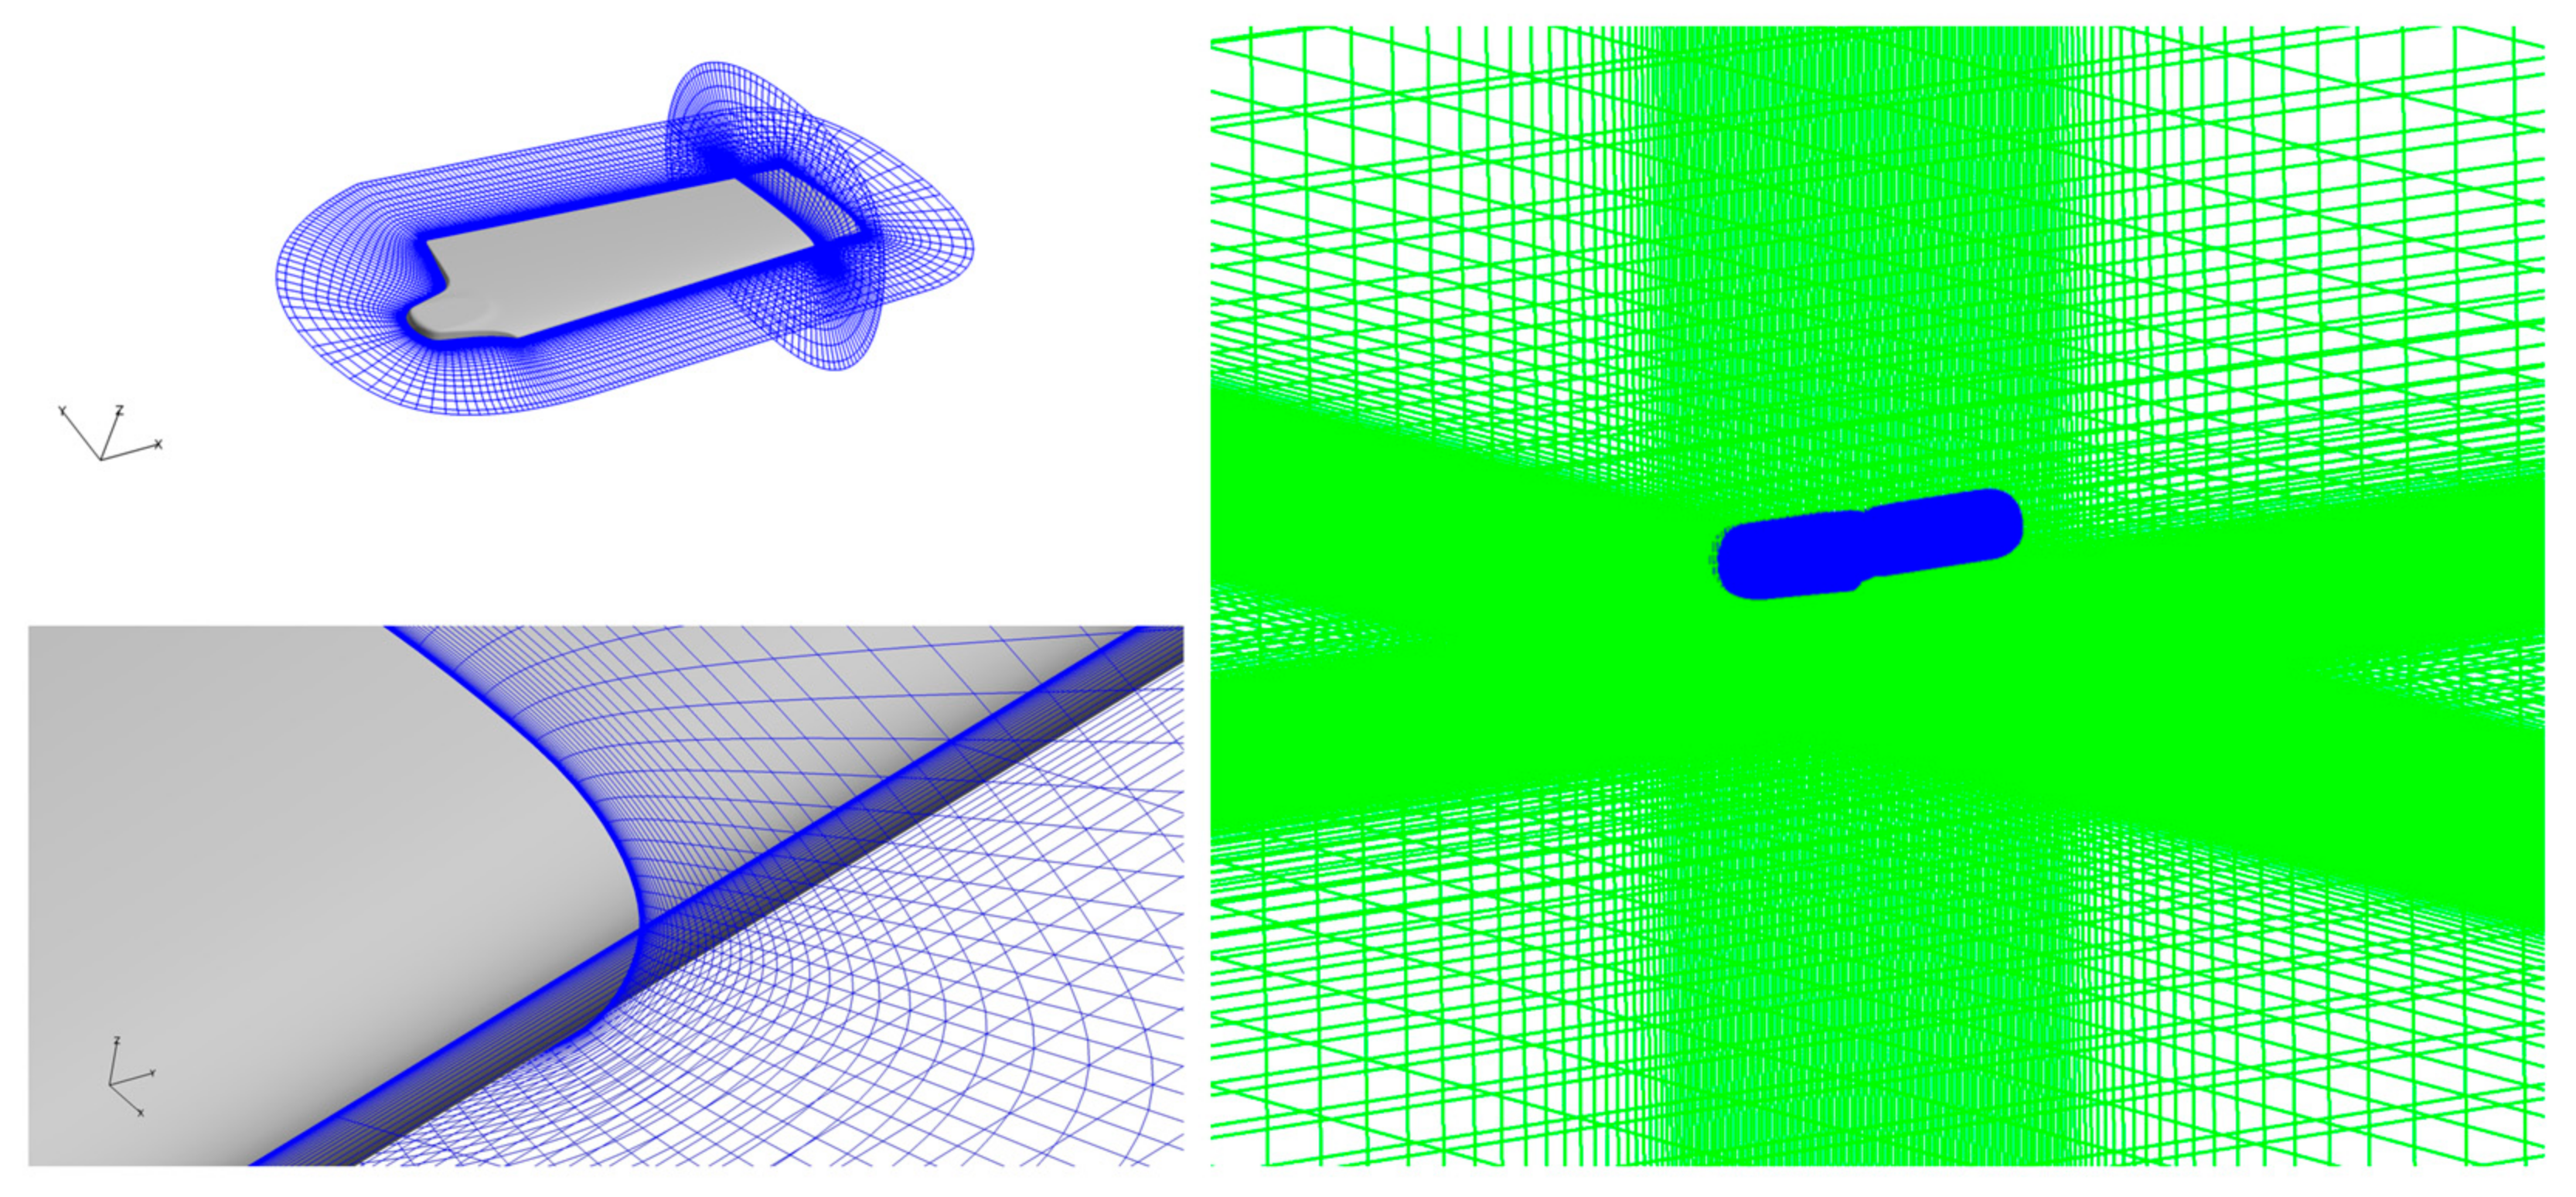
Measurements of aerodynamic forces and sounds were conducted on a hover stand in the anechoic chamber at Chiba University (Nishi Chiba campus), of which interior dimensions measured 3.86 m long, 1.56 m wide, and 2.4 m high. The experimental set-up is illustrated in Figure 3.
A high-resolution six-component load cell (Leptrino PFS 030YA151), supported by a 1 m height aluminum frame, was applied to measure the thrust and torque act on the propeller. The amplified strain signals were digitalized with the sampling rate of 1000 Hz for 30 s by the data logger (EDX-100A, Kyowa, Tokyo, Japan) via which the average value of thrust and torque were calculated. The thrust range of the force-torque cell was ±150 N with a measuring precision of 0.0375 N, and the corresponding torque range was ±1 N m with a measuring precision of 0.00025 N m. The total error of the load torque measurement is root sum square (RSS) of these two sources as 0.12 N and 0.0012 N m with a 68% confidence, respectively [10,12,36].
The electrical system was carefully built up for the isolated propeller hovering test, which consisted of the DC power, brushless direct current (BLDC) motor (AT 2380, T-motor, Nanchang, China), electronic speed controllers (Platinum 40A ESC, Hobbywing, Shenzhen, China), tachometer (FT3406, HIOKI, Ueda, Japan), and data acquisition (USB-6229, National Instrument, Austin, TX, USA). The motor was driven by ESC and powered by a DC power source of 16.8 V. The rotational speed of the propeller was monitored by a tachometer which outputs the pulse signal once at every one revolution. A closed-loop controller programmed by Labview (National Instrument, Austin, TX, USA) was used to adjust the rotational speed of the propeller convergent to a stable speed.
All noise signal measurements were conducted using free-field microphones (1/2″ UC-59, RION CO., Tokyo, Japan), which had a flat frequency response curve ranging from 10 Hz to 20,000 Hz, the sensitivity was −27 dB (ref. 1 V/Pa) and a maximum sound pressure level (SPL) of 148 dB, with a data acquisition system (EDX-100A, Kyowa, Tokyo, Japan) at a sampling rate of 20 kHz. Eight microphones were placed at a location of 800 mm (i.e., 8 r) apart from the rotational center at polar angles of ±5°, ±25°, ±50°, and ±75° to the rotational plane. The aeroacoustic characteristics were analyzed in terms of the location-dependent frequency domain characteristics with Welch’s method for estimating the power spectral density (PSD).

2.4. CFD Modeling

To quantify the near-field flow structures associated with the propeller and predict the aerodynamic forces of thrust and torque, the CFD-based simulations were conducted by solving the Navier–Stokes equations using an in-house CFD solver, rFlow3D, developed by JAXA [37]. This solver was specifically designed for the computation of unsteady flows around rotorcrafts utilizing an overlapping grids approach. The 3D moving grid-compatible all-speed numerical scheme, Simple Low-dissipation AUSM (SLAU), is employed in this study. Its extension, referred to as mSLAU, is particularly suitable for flow calculations around rotary wings, where local flow speeds can range from very low near the root area to high speed at the tip. By combining the SLAU scheme with the Fourth-order Compact MUSCL TVD (FCMT) interpolation scheme, fourth-order spatial accuracy is achieved in shock-free regions. Implicit LU-SGS and Dual-Time-Stepping methods are utilized for time integration on blade grids. Meanwhile, an explicit four-stage Runge–Kutta time integration method is implemented for background grids. Further details of the computational methods can be found in previous studies [38]. Considering the relatively low Reynolds number at 75% r (7.2 × 10⁴), we did not implement a turbulence model, which was deemed adequate for this study based on our previous work [33,38]. The simulations here were conducted under the conditions of a rotational speed of 5400 rpm for the twist and untwist propeller models. The time step employed for these simulations corresponded to 0.1° of rotation. The grid systems depicted in Figure 4 consist of three grids: blade1 grid, blade2 grid, and the background grid. In order to provide sufficient resolution of the unsteady flow around the blade, the center computational domain and the near-wall domain were refined. Each blade was meshed with a spanwise, chordwise, and normal grid resolution of 121 × 143 × 61, while the surrounding background region was gridded at a resolution of 195 × 195 × 147. The resulting mesh comprised approximately 7.7 × 10⁶ cells for all models considered in this study. The computed pressures were nondimensionalized as pressure coefficients ( C p a ), such as:
C p a = p ˜ p 1 2 ρ a 2 ,
where a is the speed of sound, p ˜ is the local pressure of the flow field, p is far-field pressure, and ρ is air density. The time-averaging ( v ^ ) and phase-averaging ( v ¯ ) operations [8] based on instantaneous velocity were calculated by
v ^ = 1 N i = 1 N v t 0 + i   Δ t ,   v ¯ = 1 N i = 1 N v t 0 + i   T ,
where v   is the time-dependent velocity, t 0 is the starting time which depends on the phase angle in phase-averaging operations, N is the number of samples, Δ t is the size of the time step, and T is the period of a propeller revolution. All simulations were performed until the flow fields converged to a stable state.
Furthermore, the Ffowcs-Williams and Hawkings (FW–H)-based acoustic analogy of Farassat Formulation 1 [39] was used, which is an in-house code, rNoise [40], being coupled with the flow solver, rFlow3D, and capable to accurately predict the sound induced by the interaction between moving objects and fluids. The flow-induced noise is thus computed as the superposition of thickness noise P T , far-field loading noise P L F , and near-field loading noise P L N :
p x , t = p T x , t + p L F x , t + p L N x , t
while
4 π p T x , t = f = 0 ρ 0 v ˙ n 1 M r 2 + ρ 0 v n r ^ i M ˙ i r 1 M r 3 r e t d S + f = 0 ρ 0 v n M r M 2 r 2 1 M r 3 r e t d S 4 π p L F x , t = f = 0 p ˙ cos θ c r 1 M r 2 + r ^ i M ˙ i p cos θ r 1 M r 3 r e t d S 4 π p L N x , t = f = 0 p cos θ M i n i r 2 1 M r 2 + M r M 2 p cos θ r 2 1 M r 3 r e t d S
where the near field terms (order 1 / r 2 ) are separated from far-field terms (order 1 / r ) which decrease faster with the distance increasing. Here, ρ 0 and c 0 the density and the speed of sound in the far field, r denotes the ratio distance between the observer and source position, p is the blade the surface pressure, v n is the velocity of a source point on the surface normal directions component, M r is the Mach number of a source point on the radiation directions component.

3. Results

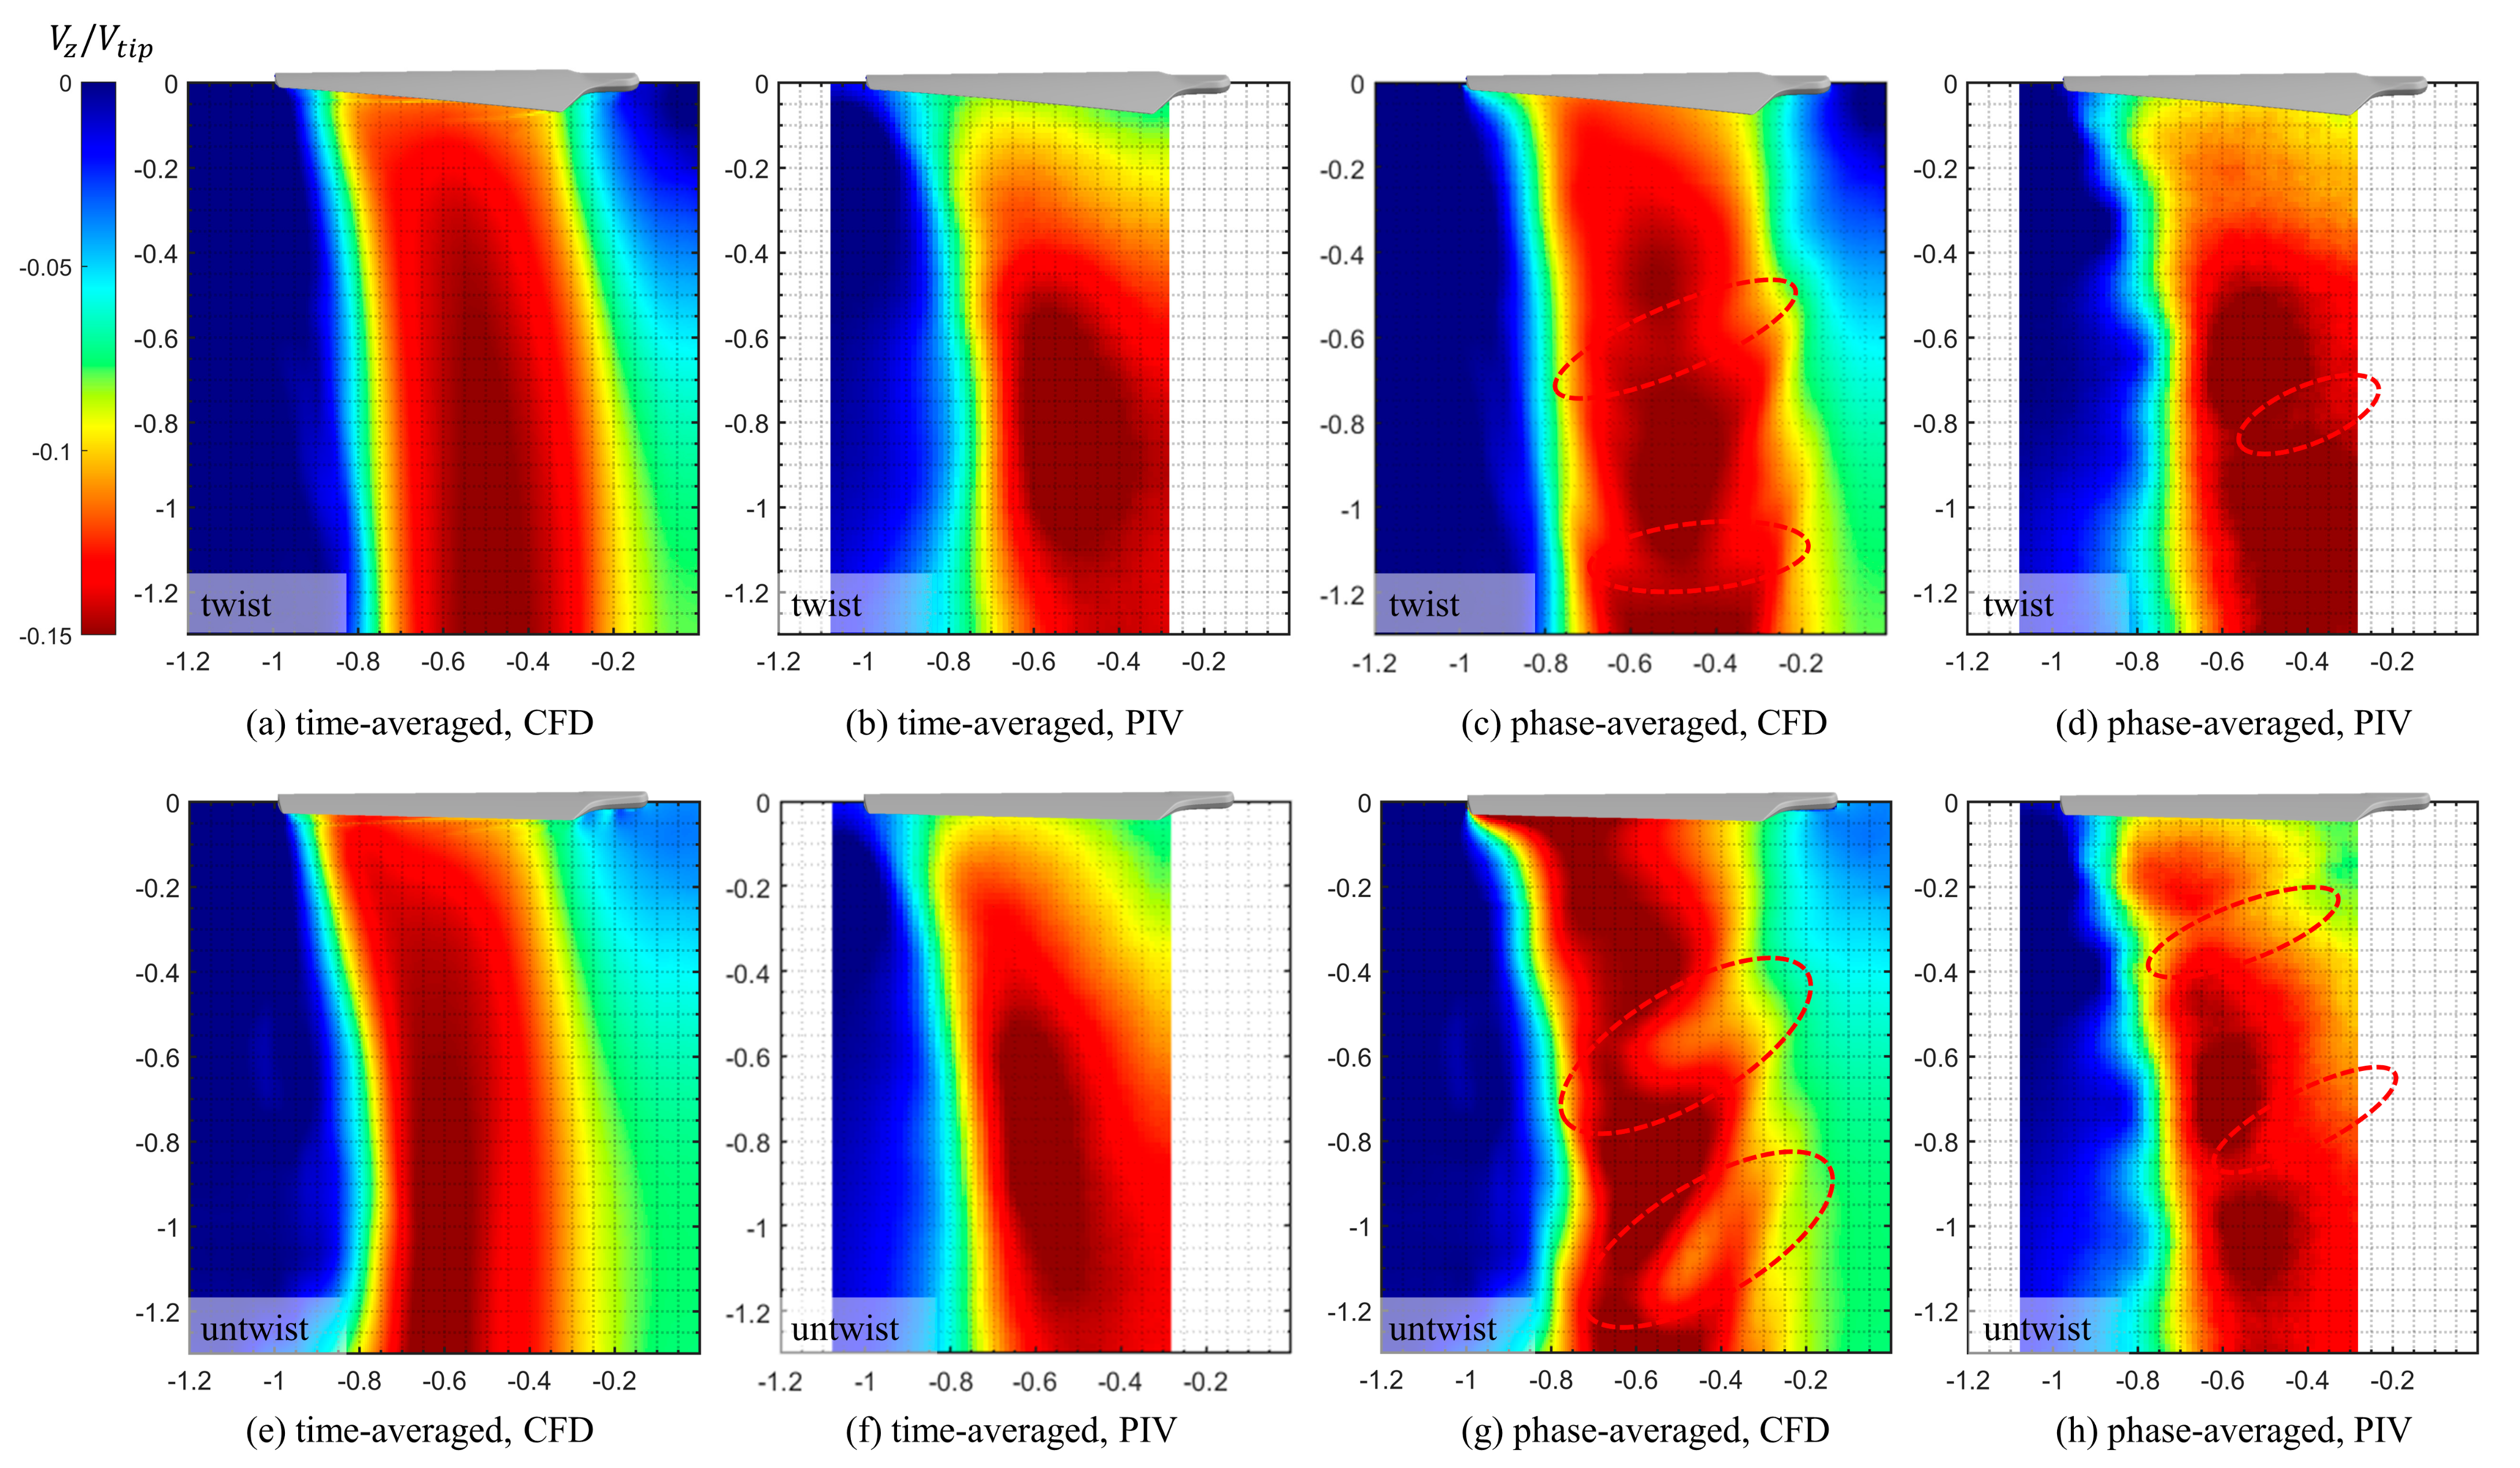
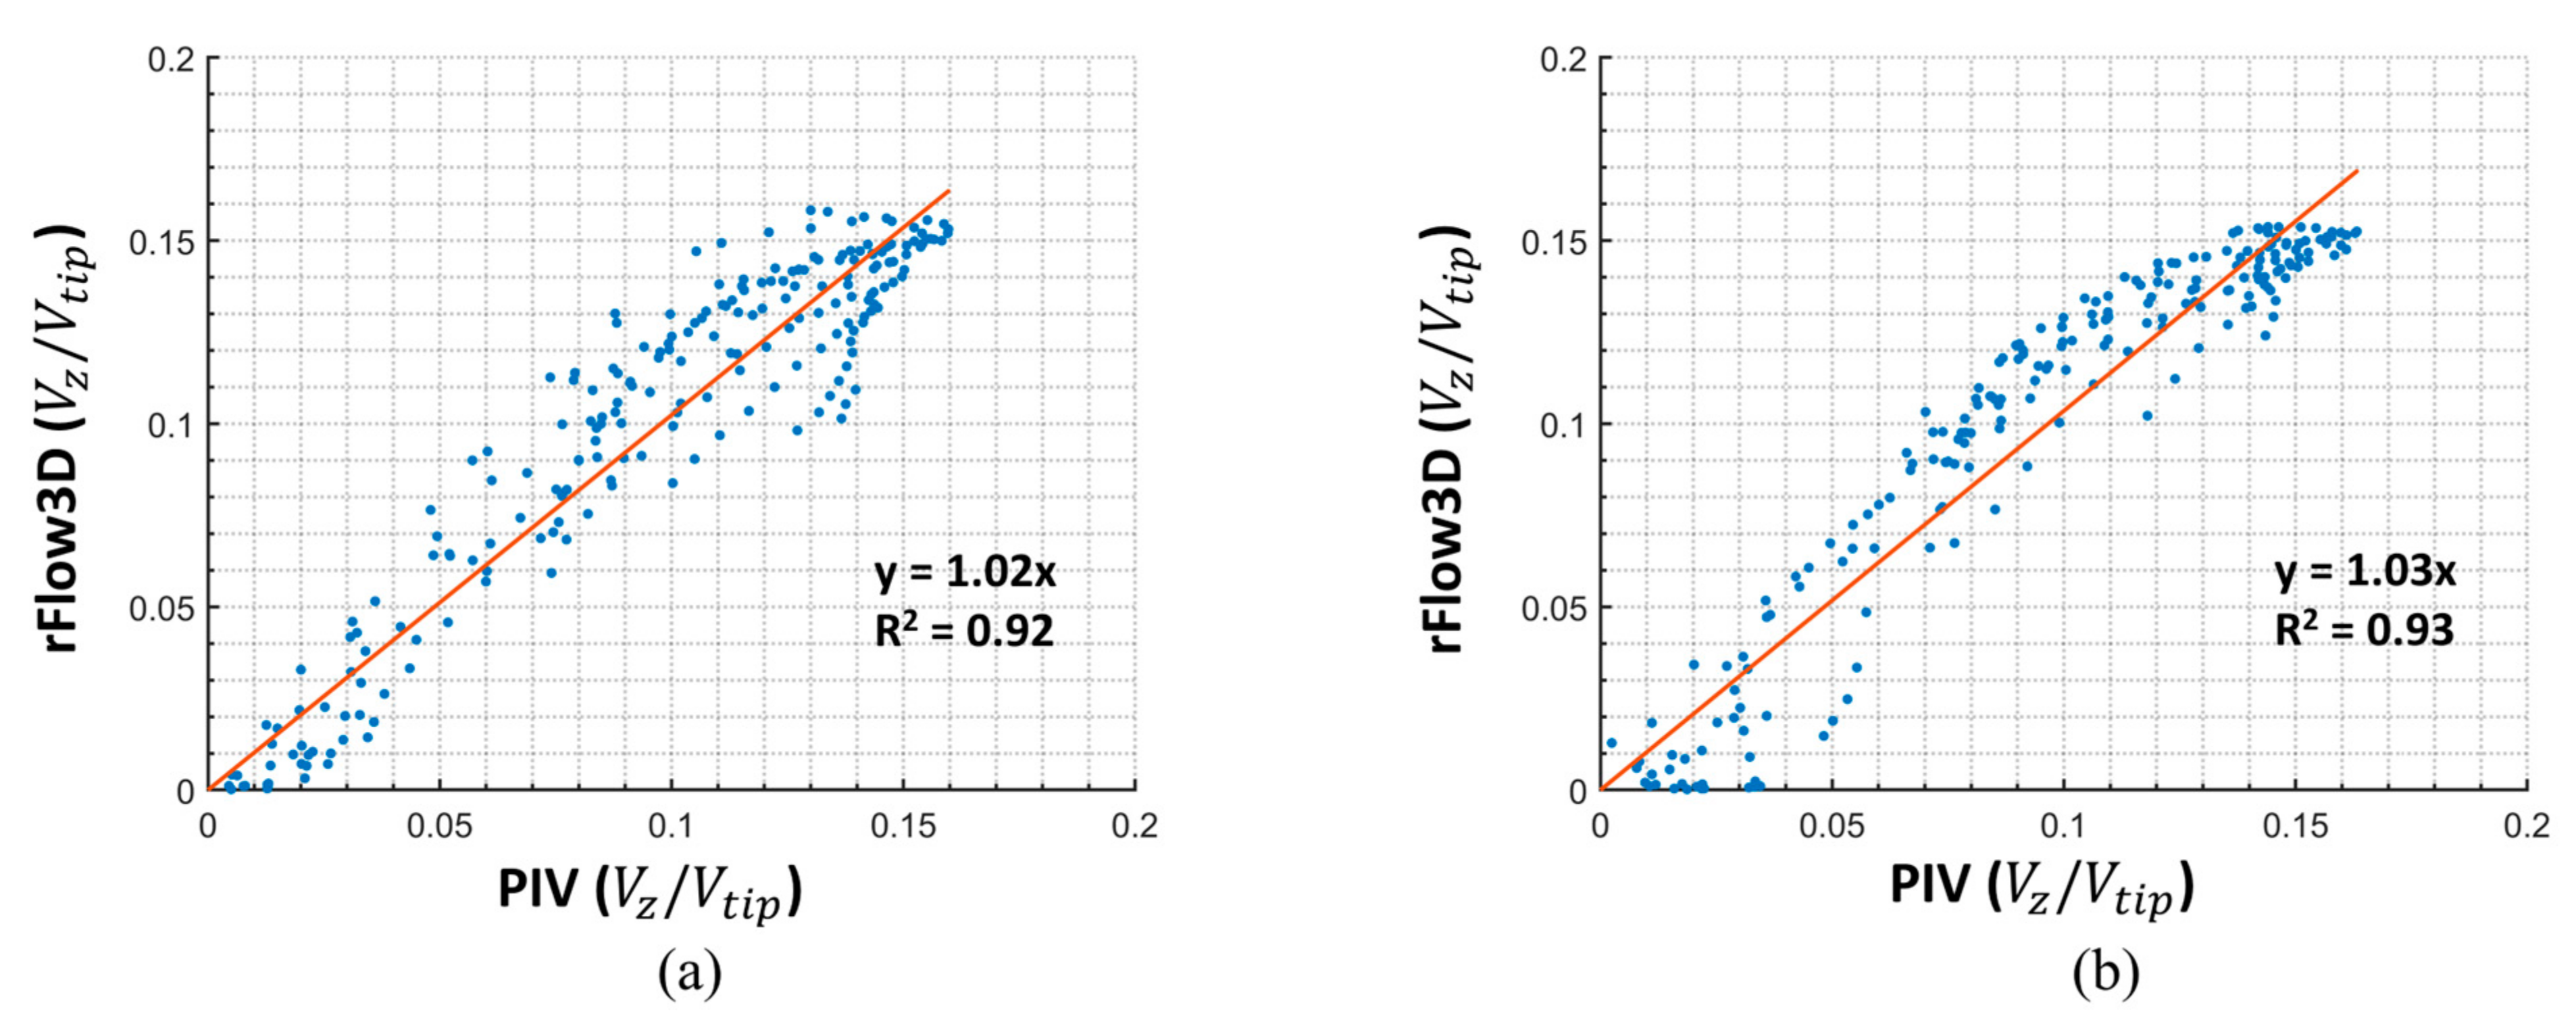
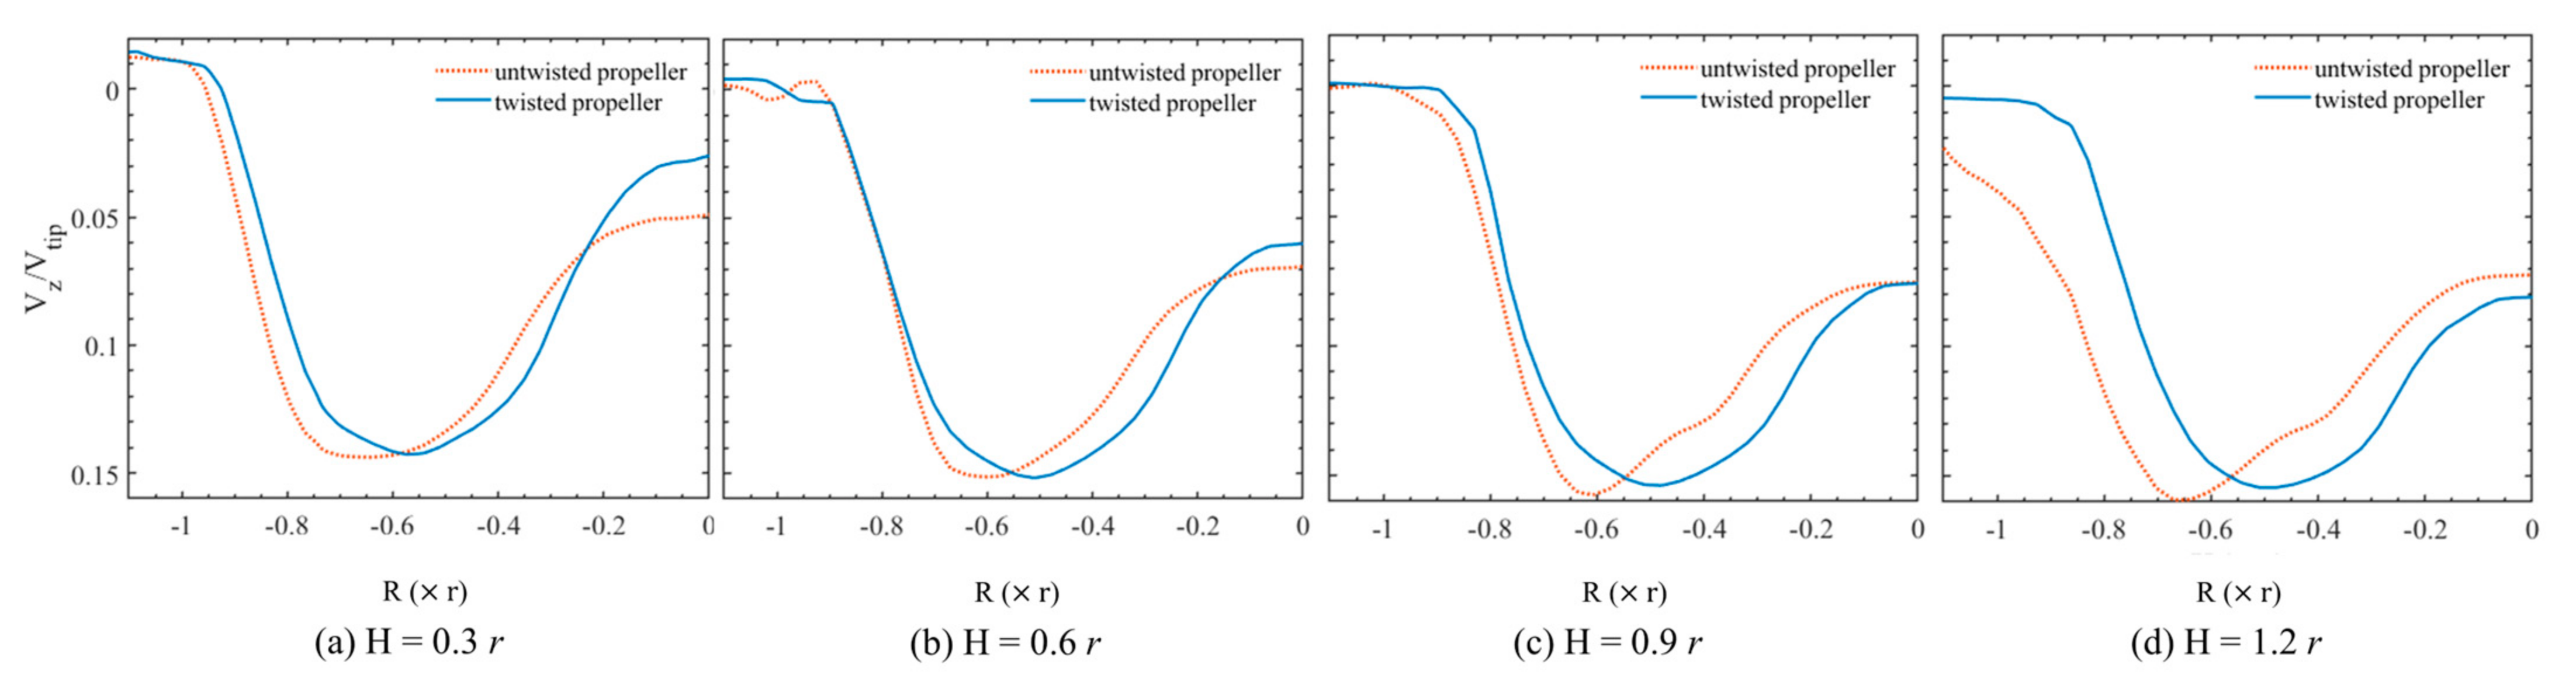
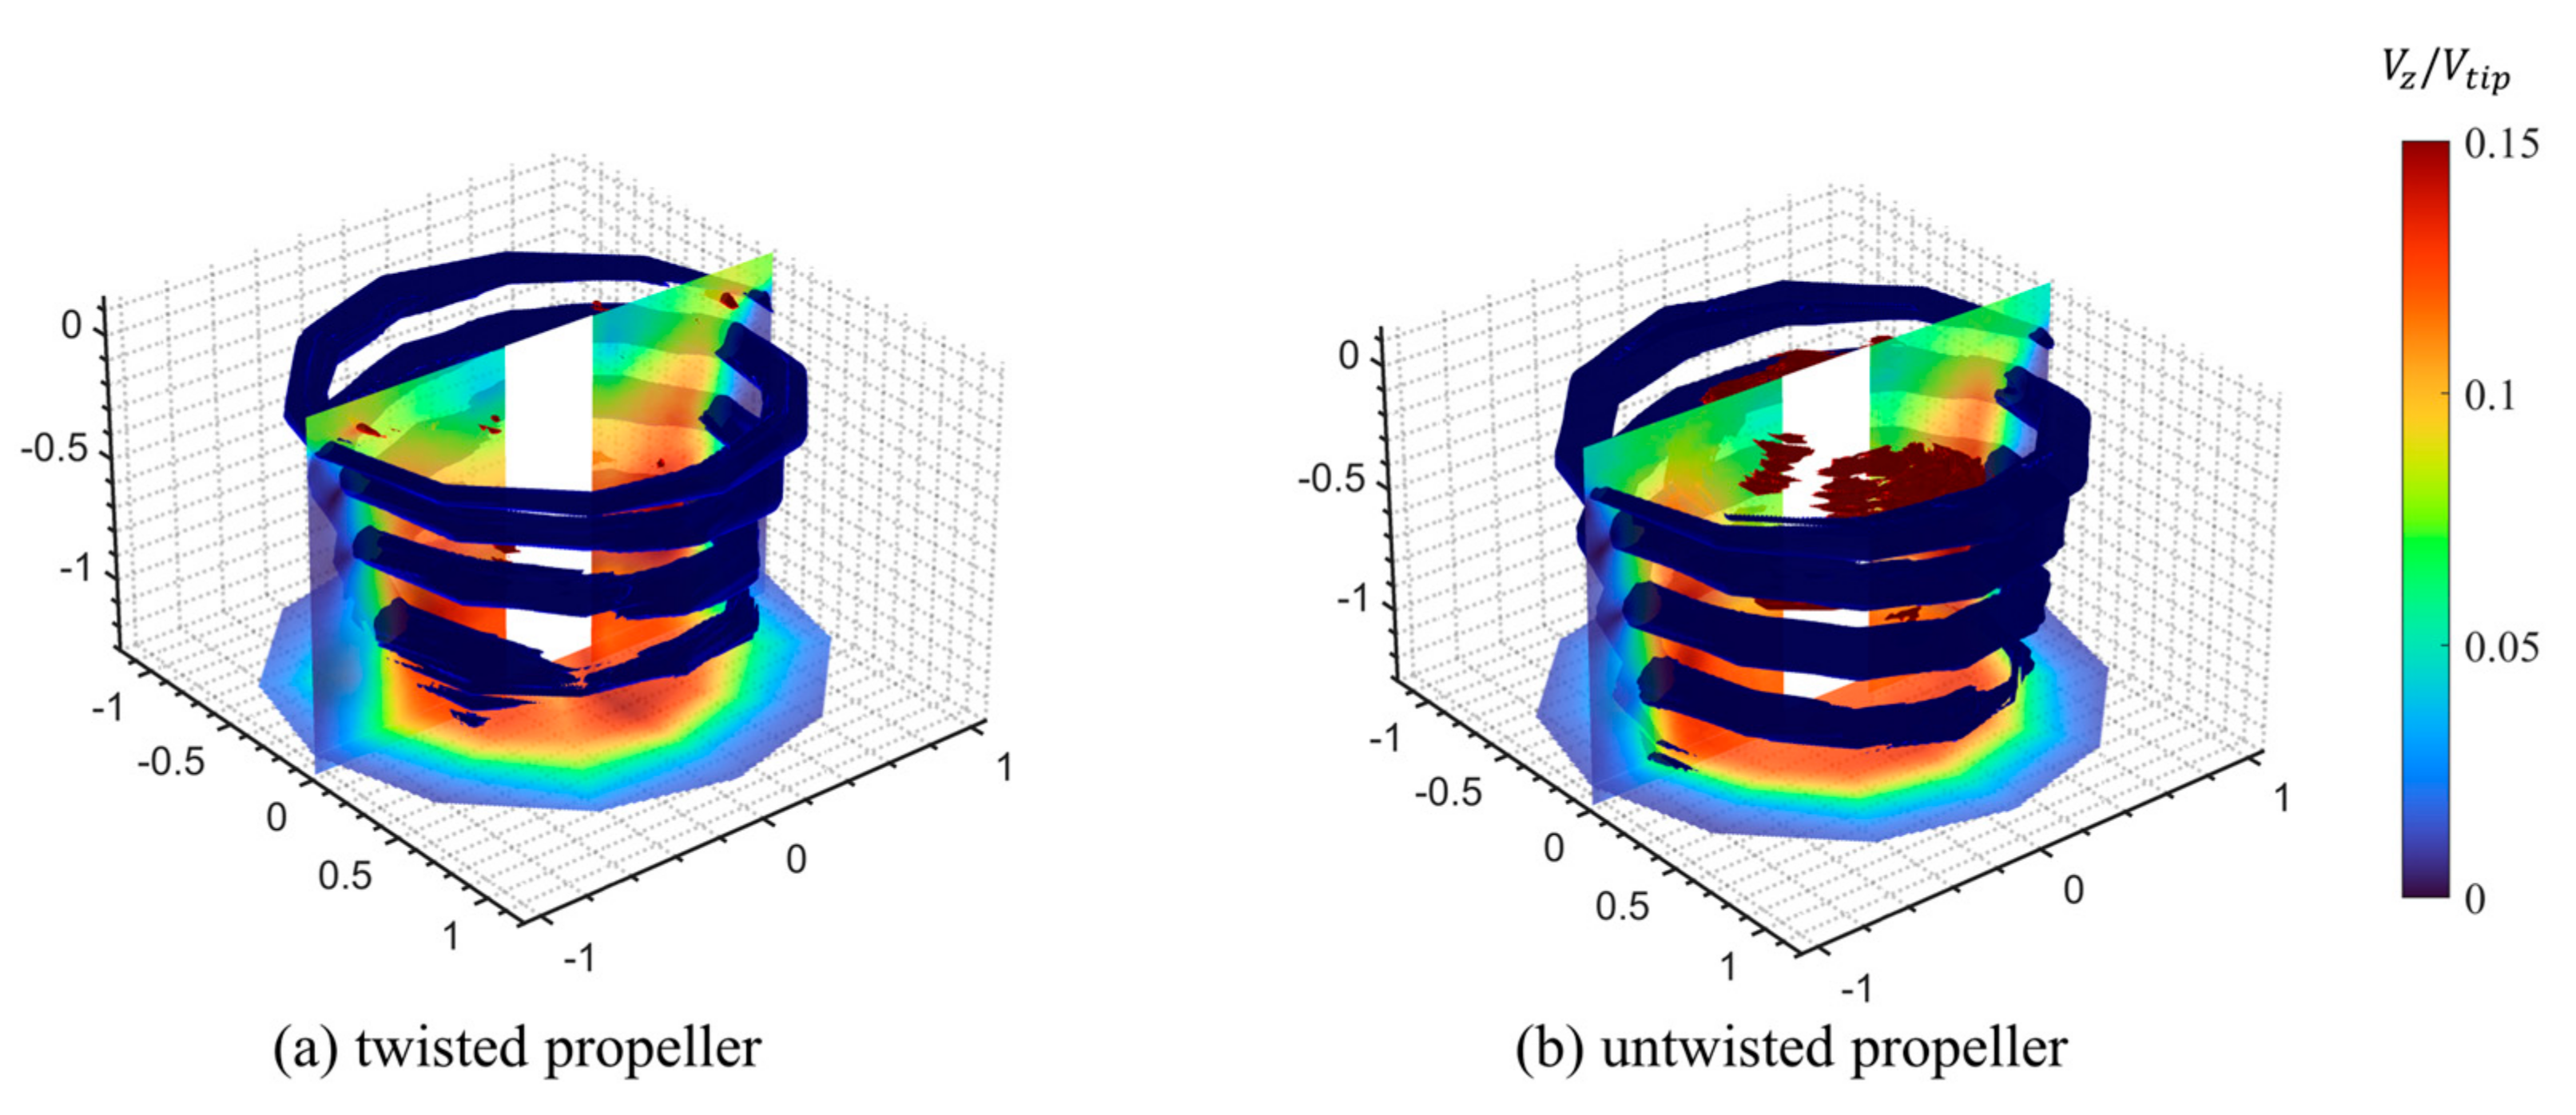
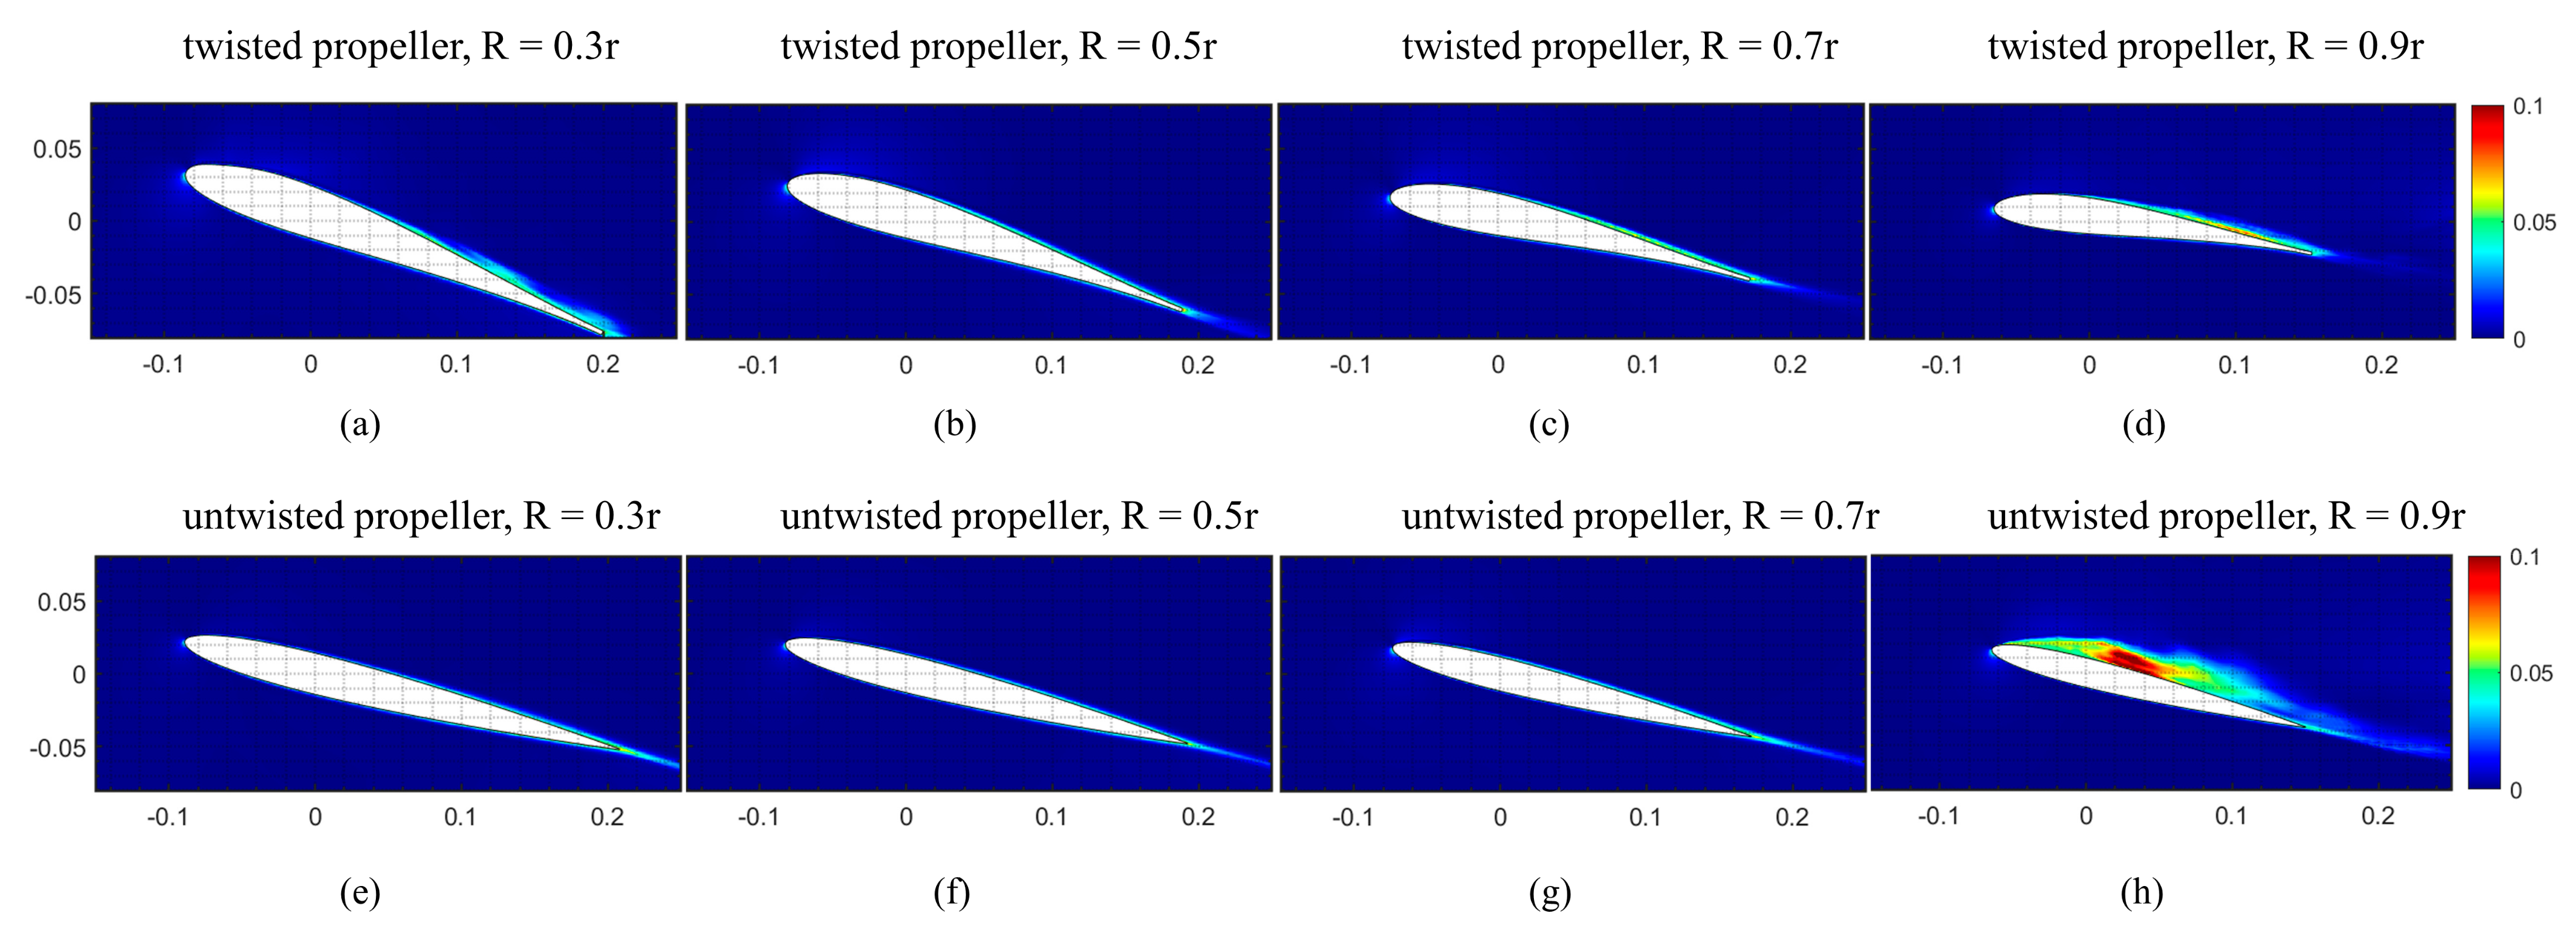
3.1. Flow Structure Visualization

First, the CFD simulations were validated through a comprehensive comparison with the PIV measurements associated with the main flow structures for both twisted and untwisted propellers, in terms of the velocity distributions around the propeller blades. Time/phase averages velocity fields were calculated by Equation (2) of instantaneous velocities based on the CFD results (rFlow3D) and PIV measurements (PIVlab). The velocities were normalized by the tip speed. Z-component contours of the time-averaged and phase-averaged velocities are plotted in Figure 5 for both twisted and untwisted propellers at a rotational speed of 5400 rpm. The x-axis and y-axis represent the coordinates which are normalized by the propeller’s radius. Good agreement is observed in the featured patterns of downwash flow structures between PIV and CFD results.
The 2D-PIV shows a high-resolution velocity field in the region of 0.75 r × 1.3 r, while the CFD can provide detailed information on the flow fields. A noticeable discrepancy is observed however in the near-blade velocities (H < 0.3 r): the 2D-PIV results show somehow comparatively lower velocities compared to those of the CFD results. This discrepancy may be attributed to the essential limitations in the 2D PIV method, which fails to account for the three-dimensional effects of the flow structure, particularly associated with the near-blade flow fields under high-speed rotation. We further made an evaluation of the overall performance of the PIV and CFD results for twisted and untwisted propellers by using the R-squared (coefficient of determination) statistic. The R-squared value was calculated as a measure of the goodness of fit between the simulated results and the experimental data at the same position, representing the proportion of the variance in the dependent variable that is predictable from the independent variables [41]. The R-squared results as shown in Figure 6 shows a strong correlation with a high R-squared value of 0.92 (untwist propeller) and 0.93 (twist propeller), respectively, hence reconfirming the accuracy of both PIV measurements and CFD simulations.
We further investigated the discrepancy in the flow structures between twisted and untwisted propellers. Several “strip shape” low-speed regions of phase-averaged result (denoted by the red color circle) are observed in Figure 5c,d,g,h, which is thought mainly because the propeller blade cut into the measurement plane, which results in forming the trailing edge vortices and hence the periodic velocity variation [8,9]. The strip low-speed region of the untwist propeller is more obvious corresponding to the high fluctuation in velocity (to be discussed extensively in Section 4). We then plotted the velocity distributions of the twisted and untwisted propeller at various downstream locations of 0.3 r, 0.6 r, 0.9 r, and 1.2 r as shown in Figure 7. The slipstream of the twisted propeller shows an increase in the downwash velocity in the middle span, whereas the untwisted propeller generates a higher downwash-velocity peak adjacent to the blade tip. Additionally, in Figure 8, the downwash flow structures are visualized for the twisted and untwisted propellers based on the phase-average PIV results, in terms of the iso-vorticity surfaces of the tip vortex ( ω z = 400   s 1 , blue) and trailing edge vortex ( ω z = 200   s 1 , red) as well as the downwash velocity field. Obviously, the twisted propeller-induced tip vortex is weaker in strength and smaller in size compared to the untwisted propeller, which also supports the result of velocity distributions as shown in Figure 7.

3.2. Aerodynamic Performance

The aerodynamic performance of the propellers was evaluated with the Figure of Merit (FM), a ratio between the ideal power required for hovering and the actual power consumption of the propeller [42]. The hover-stand test-based results as shown in Figure 9 are utilized to examine the aerodynamic performance of twisted and untwisted propellers at various rotational speeds ranging from 2700–5700 rpm with an interval of 300 rpm. Each datum point represents the mean value derived from the 30-s measurement of the load cell, acquired with a sampling frequency of 1000 Hz. The CFD-based results are represented as symbols in Figure 9. The experimental results show that the twisted propeller displays a slight improvement in thrust production and hence in FM at all rotational speeds. The FM of the twisted propeller shows a remarked increase of 9.3% at the rotational speed of 5400 rpm, significantly outperforming the untwisted propeller while sustaining the same thrust production. Moreover, the operating range shows a good agreement between the experimental and numerical results with a deviation of less than 7%, again indicating the validity and efficacy of the CFD-based simulations in accurately predicting the aerodynamic performance. The results thus reconfirm the findings in our previous study [32].

3.3. Acoustic Performance

To further investigate the aeroacoustic performance, we executed a series of experiments and numerical simulations. Both propellers were operated at a constant angular speed of 5400 RPM under hovering conditions. The overall Sound Pressure Level (OASPL) refers to the measure of the total sound pressure produced by a source, expressed in decibels (dB), which is defined as
O A S P L = 10 log 10 20 10 , 000 PSD f   d f P r e f 2 ,
where the PSD f   is the Power Spectral Density representing the amount of power per unit frequency in signal, and the reference sound pressure ( P r e f ) of air is 20 μ Pa . The frequency-domain aeroacoustic characteristics of the twisted/untwisted propeller were analyzed with Welch’s method to examine the PSD. The noise frequency spectra are logarithmized to sound pressure level, which is defined based on PSD results at specific frequency points or band range f L to f H , such as
S P L = 10 log 10 f L f H PSD f   d f P r e f 2 .
In Figure 10, the OASPLs and SPLs at the blade passing frequency (BPF) of the twisted and untwisted propellers are compared at various polar angle locations with a radiation distance of 800 mm at 5400 RPM, where the symbols denote the measured results sampled by the arc microphone array (Figure 3). Apparently, the simulation results are well consistent with the microphone-based measurements, indicating that the twisted propeller is an effective design to significantly reduce the aerodynamic noise. It is seen that the twisted propeller enables a remarked reduction in OASPL by a maximum of 4.3 dB at the polar angle of 75°, and by an average of 2.2 dB at the distance of 8 r. Comparison of the BPF noise directivity between untwisted and twisted propellers, both experimentally and numerically, presents a very similar result to the experimental result by Jiang et al. (2022) [8] and the theoretical analysis by Made et al. (1970) [43]. This phenomenon indicates that the twist variation in the blade shape exerts less impact on the tonal noise emission at the BPF and at lower polar angles. It is worth noting however that the discrepancies are observed between the simulation results for the twist/untwisted propellers at low and high observation angles ( ± 75 ° ), with the lower SPLs at the BPF by 15 dB in the simulation compared to the measurements. Furthermore, the spectrum comparison between the twisted and untwisted propellers at Mic 3 is illustrated in Figure 11, demonstrating that the untwisted propeller enables a noticeable increase in broadband noise within the frequency range of 2000 to 10,000 Hz.
To investigate the acoustic characteristics of twisted and untwisted propellers, we further made a comparison of noise emission patterns. The data were obtained via a fast Fourier transform (FFT) algorithm for the time series sound pressure of 2048 points for one revolution of the propeller. The sound pressures were calculated with an in-house code, rNoise over the region of 16 r × 16 r with a spatial resolution of 0.5 r. The SPL was also converted into the sound pressure level (SPL) from PSD across a frequency at BPF (180 Hz) as shown in Figure 12a,b or over a range of 2000 Hz to 10,000 Hz in Figure 12c,d, respectively. The SPL ranging over 2000 Hz to 10,000 Hz in the far field exhibits a dipole pattern, with greater values at higher polar angles and smaller values at lower polar angles. However, at 1 BPF, the SPL displays a directivity pattern with greater values at lower polar angles and smaller values at higher polar angles. This phenomenon is also observed in a previous study [31,32], indicating that the propeller design with twisted blades enables a pronounced reduction in noise levels, particularly in the high-frequency range (see Figure 12c,d). Furthermore, to examine the various noise components induced by the twisted blade, we separated the noise into thickness noise (PT), near-field loading noise (PLN), and far-field loading noise (PLF), as defined in Equation (3). The variation in Sound Pressure Level (∆SPL) as depicted in Figure 13c,f,i represents the noise reduction due to the twisted blades, indicating that the thickness noise is marginal and negligible. On the other hand, the near-field loading noise and SPL at lower polar angles are observed almost unchanged, whereas the noise levels at higher polar angles are obviously largely reduced, with the maximum reduction at 90°. Moreover, the far-field loading noise is also reduced significantly almost over the entire field.

4. Discussion

4.1. Near-Blade Flow Fields

Here, we explore how the twisted blade alters the near-blade flow fields in terms of flow separation, pressure distribution, and kinetic energy fluctuation (k). Figure 14 shows the phase-averaged chordwise velocity fields based on the CFD simulations for both twisted and untwisted propellers at various radial locations. The velocities were normalized by the local rotational speed, which is proportional to the radial distance from the rotational center. For the twisted propeller, the blade section in the near-hub region (0.3 r) rotates at a relatively high pitch angle with a lower incoming flow speed, whereas the blade section in the near-tip region (0.9 r) rotates at a relatively lower angle of attack with a higher inflow. Such spanwise variation in the angle of attack owing to the blade twist obviously enables enhancing the high-velocity zone at the leading-edge (Figure 14a–c) while effectively suppressing the flow separation in the vicinity of the blade tip (Figure 14d), compared to the untwist propeller (Figure 14e–h). These featured flow structures support our results of the thrust forces and FMs as shown in Figure 9, that the twisted propeller can remarkedly enhance the aerodynamic performance.
We further examine the blade twist effect on noise reduction by investigating the near-blade kinetic energy fluctuation (k), which refers to a measure of the magnitude of fluid motion fluctuation energy around the blades and is related to the level of noise emissions from a propeller. As depicted in Figure 15, the normalized k is defined as
k = 1 2 v s 2 ¯ + v c 2 ¯ + w 2 ¯ / V t i p 2 ,  
where v s is the spanwise velocity fluctuations, v c is the chordwise velocity fluctuations, and w is the downwash velocity fluctuations. Clearly, the flow separation at the blade tip in the untwisted blade (Figure 14h and Figure 15h) is observed showing very high-level velocity fluctuations at the location of 0.9 r, implying the presence of noise sources.
This can be further verified with the spanwise distribution of pressure coefficient standard deviation ( C p a s t d ), which is broadly used as a metric to evaluate broadband noise sources [8,30], defined as
C p a s t d = C p a i C p a m e a n 2 N ,  
where N is the number of samples, C p a is the pressure coefficient. The spanwise pressure fluctuations on the span sectional plane were visualized in terms of the C p a s t d as depicted in Figure 16. The pressure coefficient standard deviation presents a highly intense region with higher fluctuations clustered to the blade tip in the untwisted propeller but is significantly altered to a flattened distribution with the pressure fluctuations significantly reduced in the twisted propeller. This indicates that the primary noise source originating from the flow separation-induced high-pressure fluctuations in the blade tip region can be effectively suppressed with appropriate blade twist design.
It’s worth noting that this study focuses on a specific design of twisted and untwisted blades for drone propellers. While our results demonstrate the potential and feasibility that twisted blades enable reducing flow separation-induced pressure and velocity fluctuations in the high-inflow speed region, future studies are expected to examine some optimal twisted blade design in terms of aeroacoustic performance of various propellers for practical applications in multirotor drones. Nonetheless, our study underscores the importance of blade twist design in reducing noise emissions and enhancing propeller efficiency.

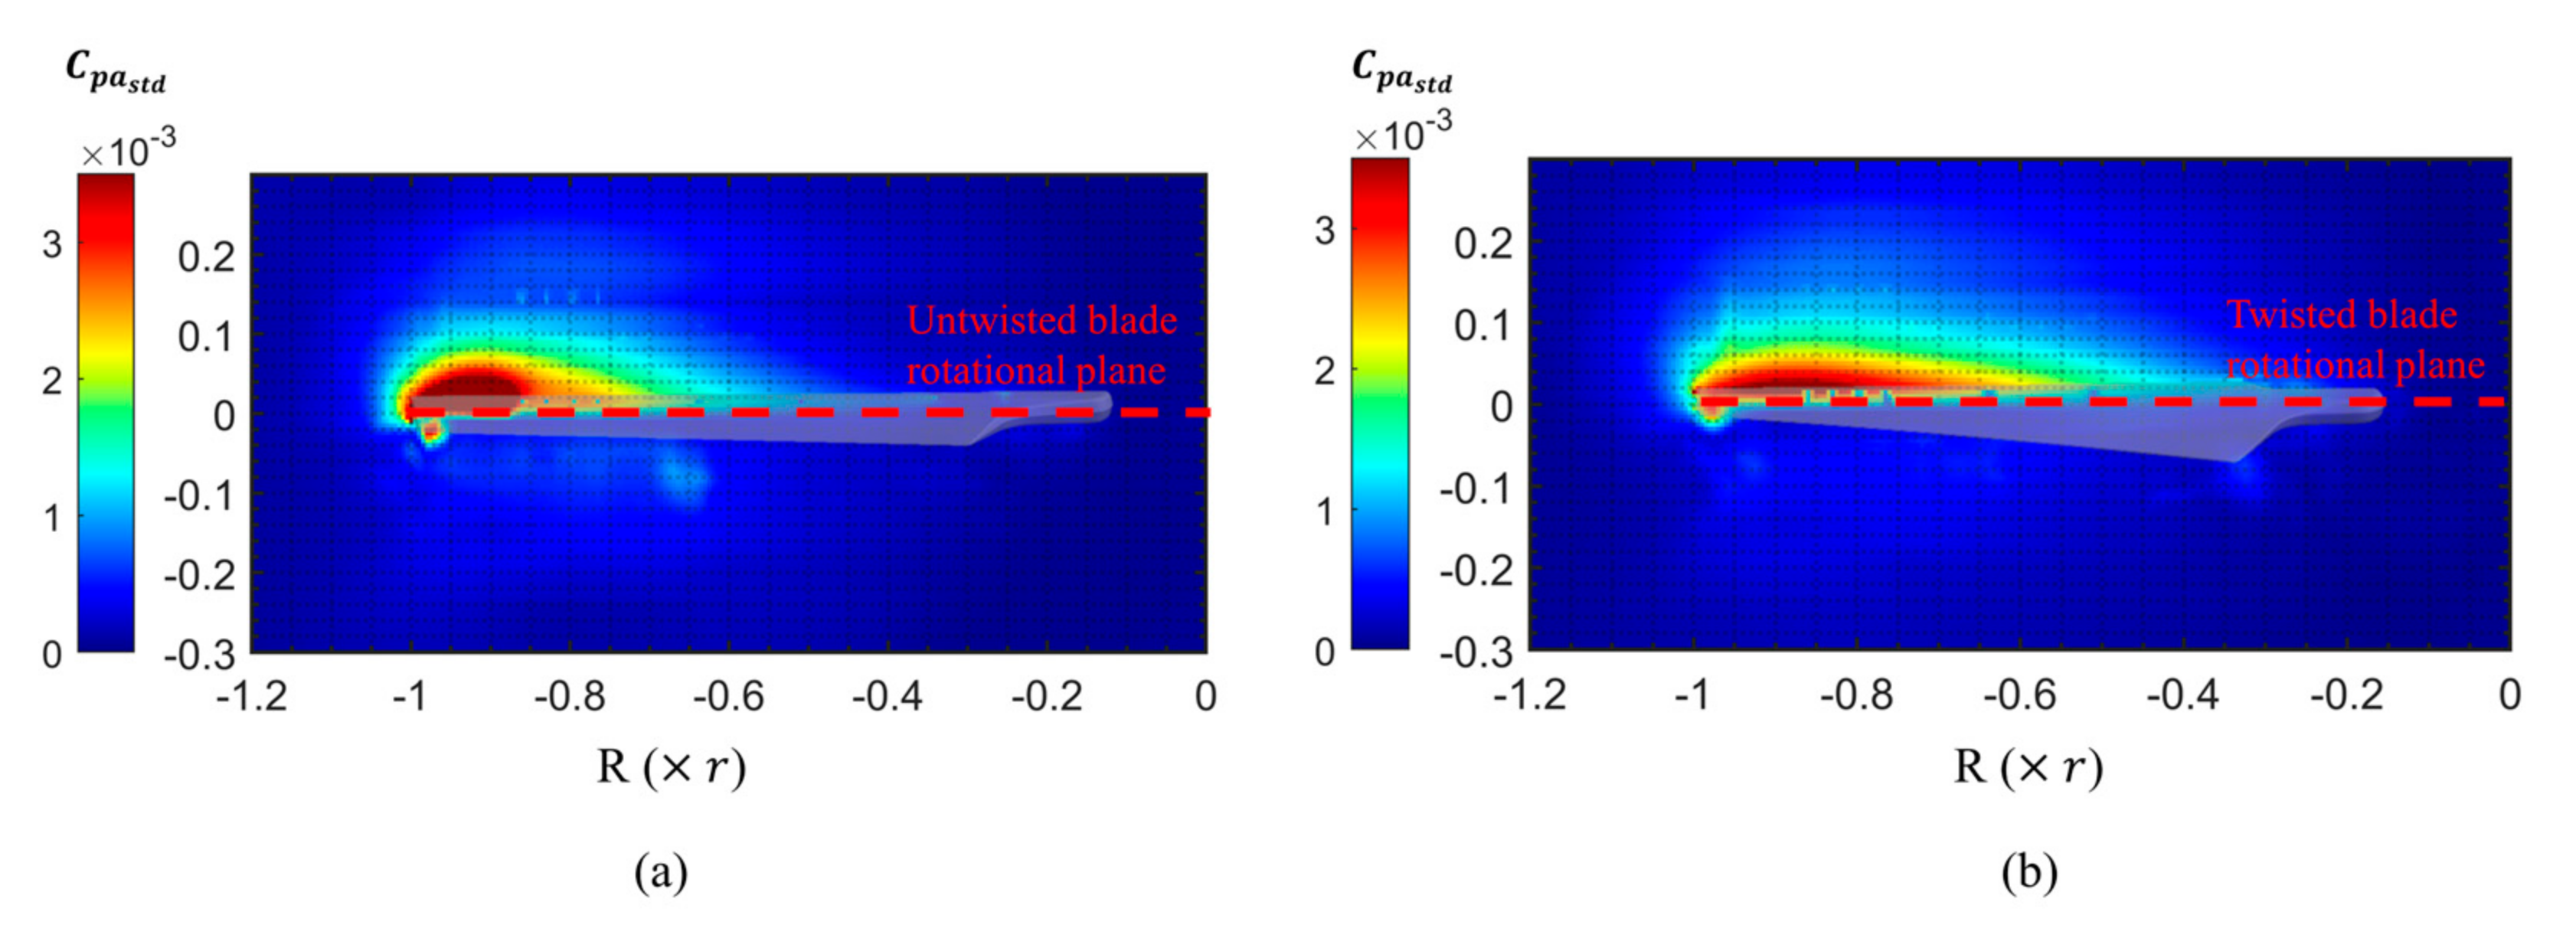
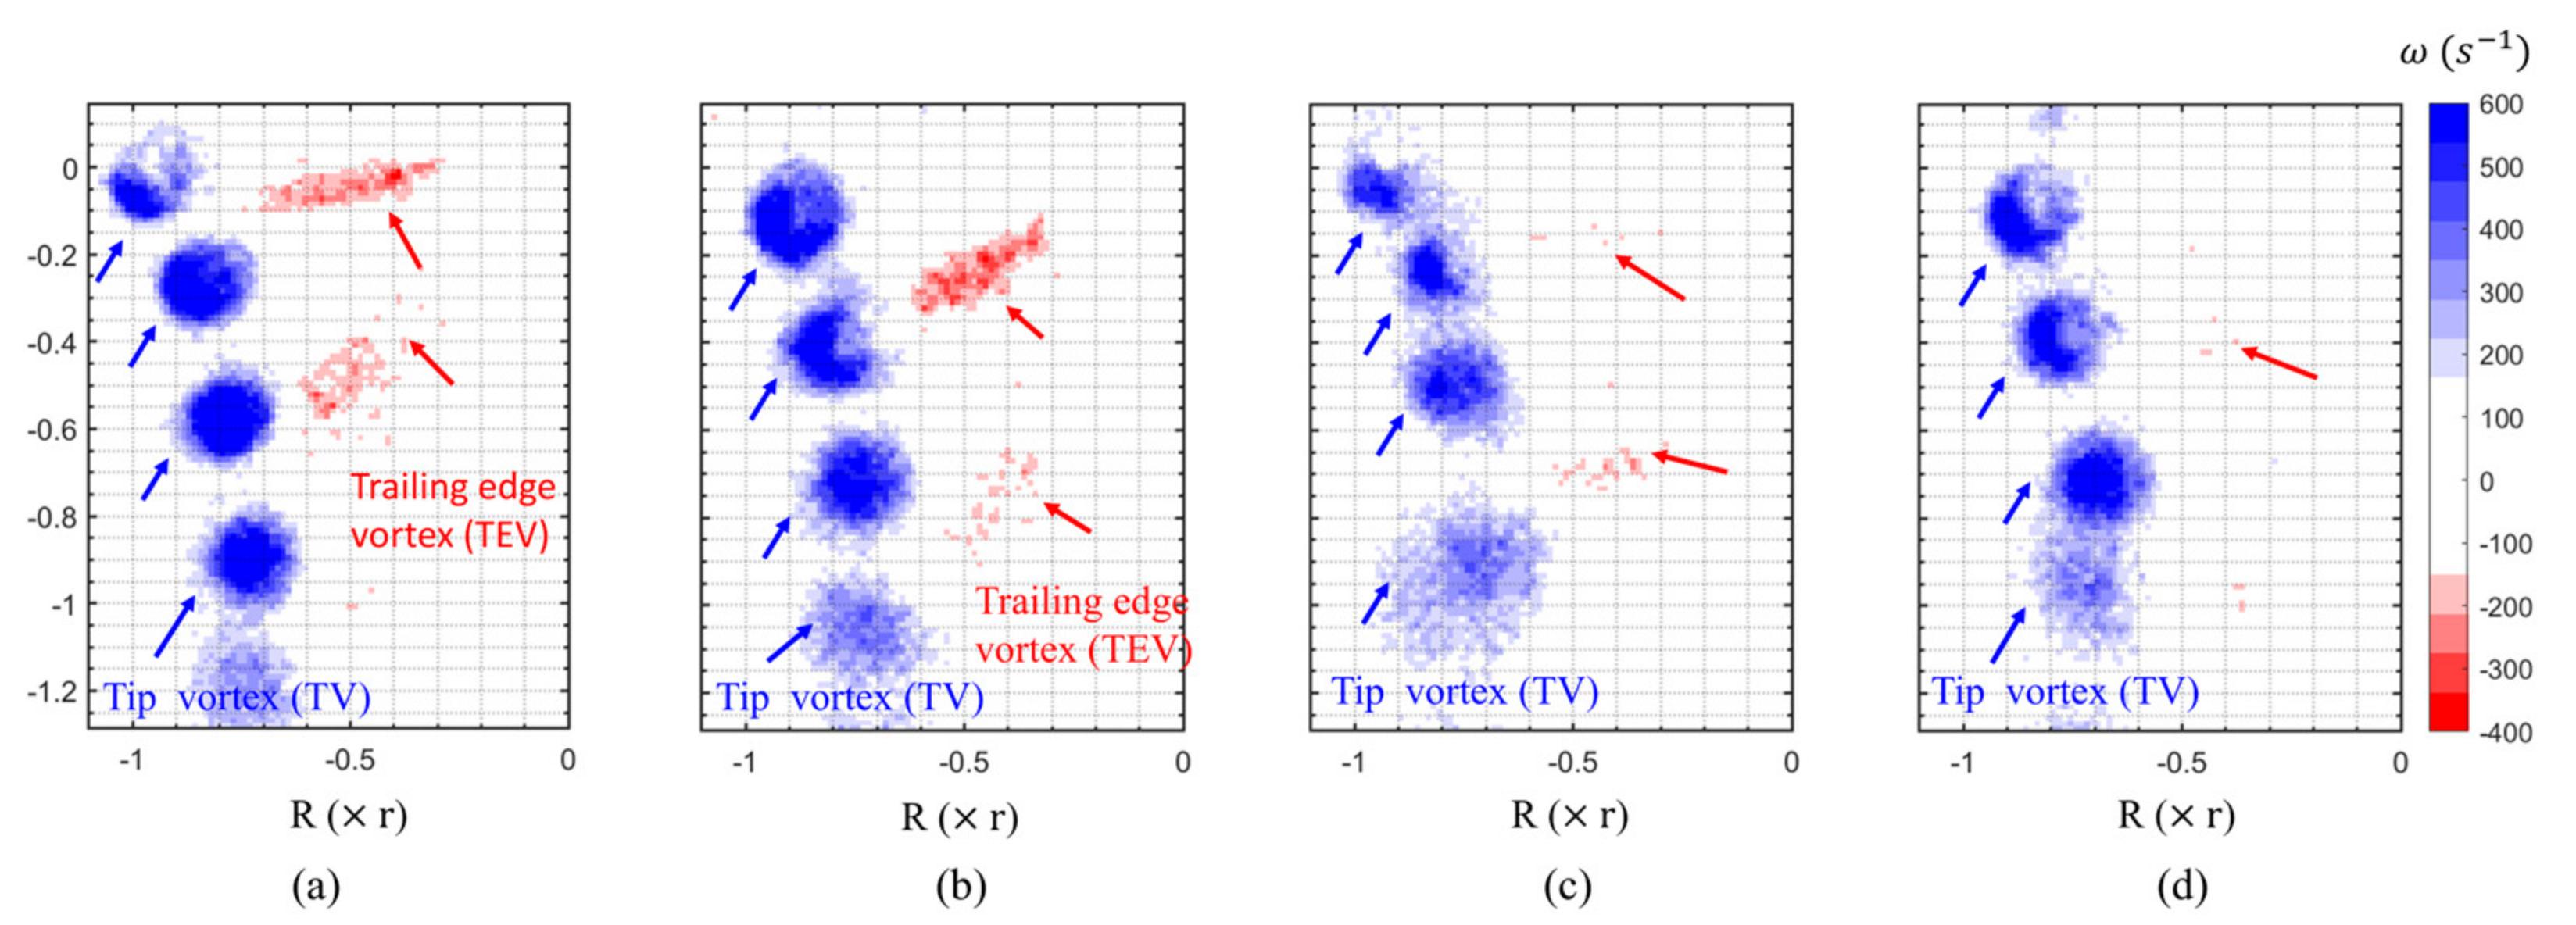
4.2. Tip Vortex and Trailing Edge Vortex

Furthermore, we give a discussion on the impact of blade twist on the characteristics of tip vortices (TV) and trailing edge vortices (TEV), and how this is associated with the aeroacoustic performance of the propellers.
The PIV measurements (Figure 8) reveal that the twisted and untwisted propellers exhibit different TV and TEV characteristics: the twisted propeller shows a remarked reduction in the size of TVs and the absence of TEVs compared to the untwisted propeller. Visualization of phase-averaged vorticities as shown in Figure 17 further shows that TVs are noticeably featured by the positive vorticity (blue) and TEVs by the negative vorticity (red), respectively, which is consistent with the findings in the previous study [9,21]. Apparently, it is observed of an intense downwash with larger and stronger TVs in the untwisted propeller, corresponded to the downward velocity distributions in Figure 7. Moreover, the TEVs are present in the horizontal range of 0.3 r to 0.6 r in the untwisted propeller (Figure 16a,b), but greatly decay to a marginal in the twisted propeller (Figure 16c,d).
Thus, the twisted blade can diminish the size and strength of TV and TEV, resulting in producing less turbulent kinetic, hence reducing the aerodynamic noise. Moreover, the phase-averaged results shown in Figure 5c,d,g,h exhibit a flow pattern consisting of several “strip shape” low-speed regions (denoted by the red color circle), which are considerably caused by the TEVs, leaving in the wake of velocity fluctuations in the slipstream. The low-speed regions about the twisted propeller are notably smaller than those about the untwisted propeller with a comparatively uniform slipstream. This could be attributed to the fact that the twisted propeller has a lower pitch angle towards the tip region, which leads to a smaller TV.

5. Conclusions

In this study, a comprehensive study was undertaken to investigate the blade twist effects on aerodynamic performance and noise reduction in association with a multirotor propeller. It is verified that a twisted blade design for the propeller with varying twist angles and a cambered airfoil outperforms the twist blade design, capable of achieving high efficiency and low noise. The integration of PIV-based flow visualization, CFD-based simulations of flow structures, and hover stand test-based aerodynamic force and noise measurements have demonstrated the ability to accurately predict the aeroacoustic characteristics of multirotor drone propellers in terms of both near- and far-blade flow structures, as well as their corresponding aerodynamic and acoustic performance. These findings provide further validation for the accuracy of the rFlow3d and rNoise solvers applied in the aeroacoustic study of drone multirotor propellers. The main findings may be summarized as follows:
(1)
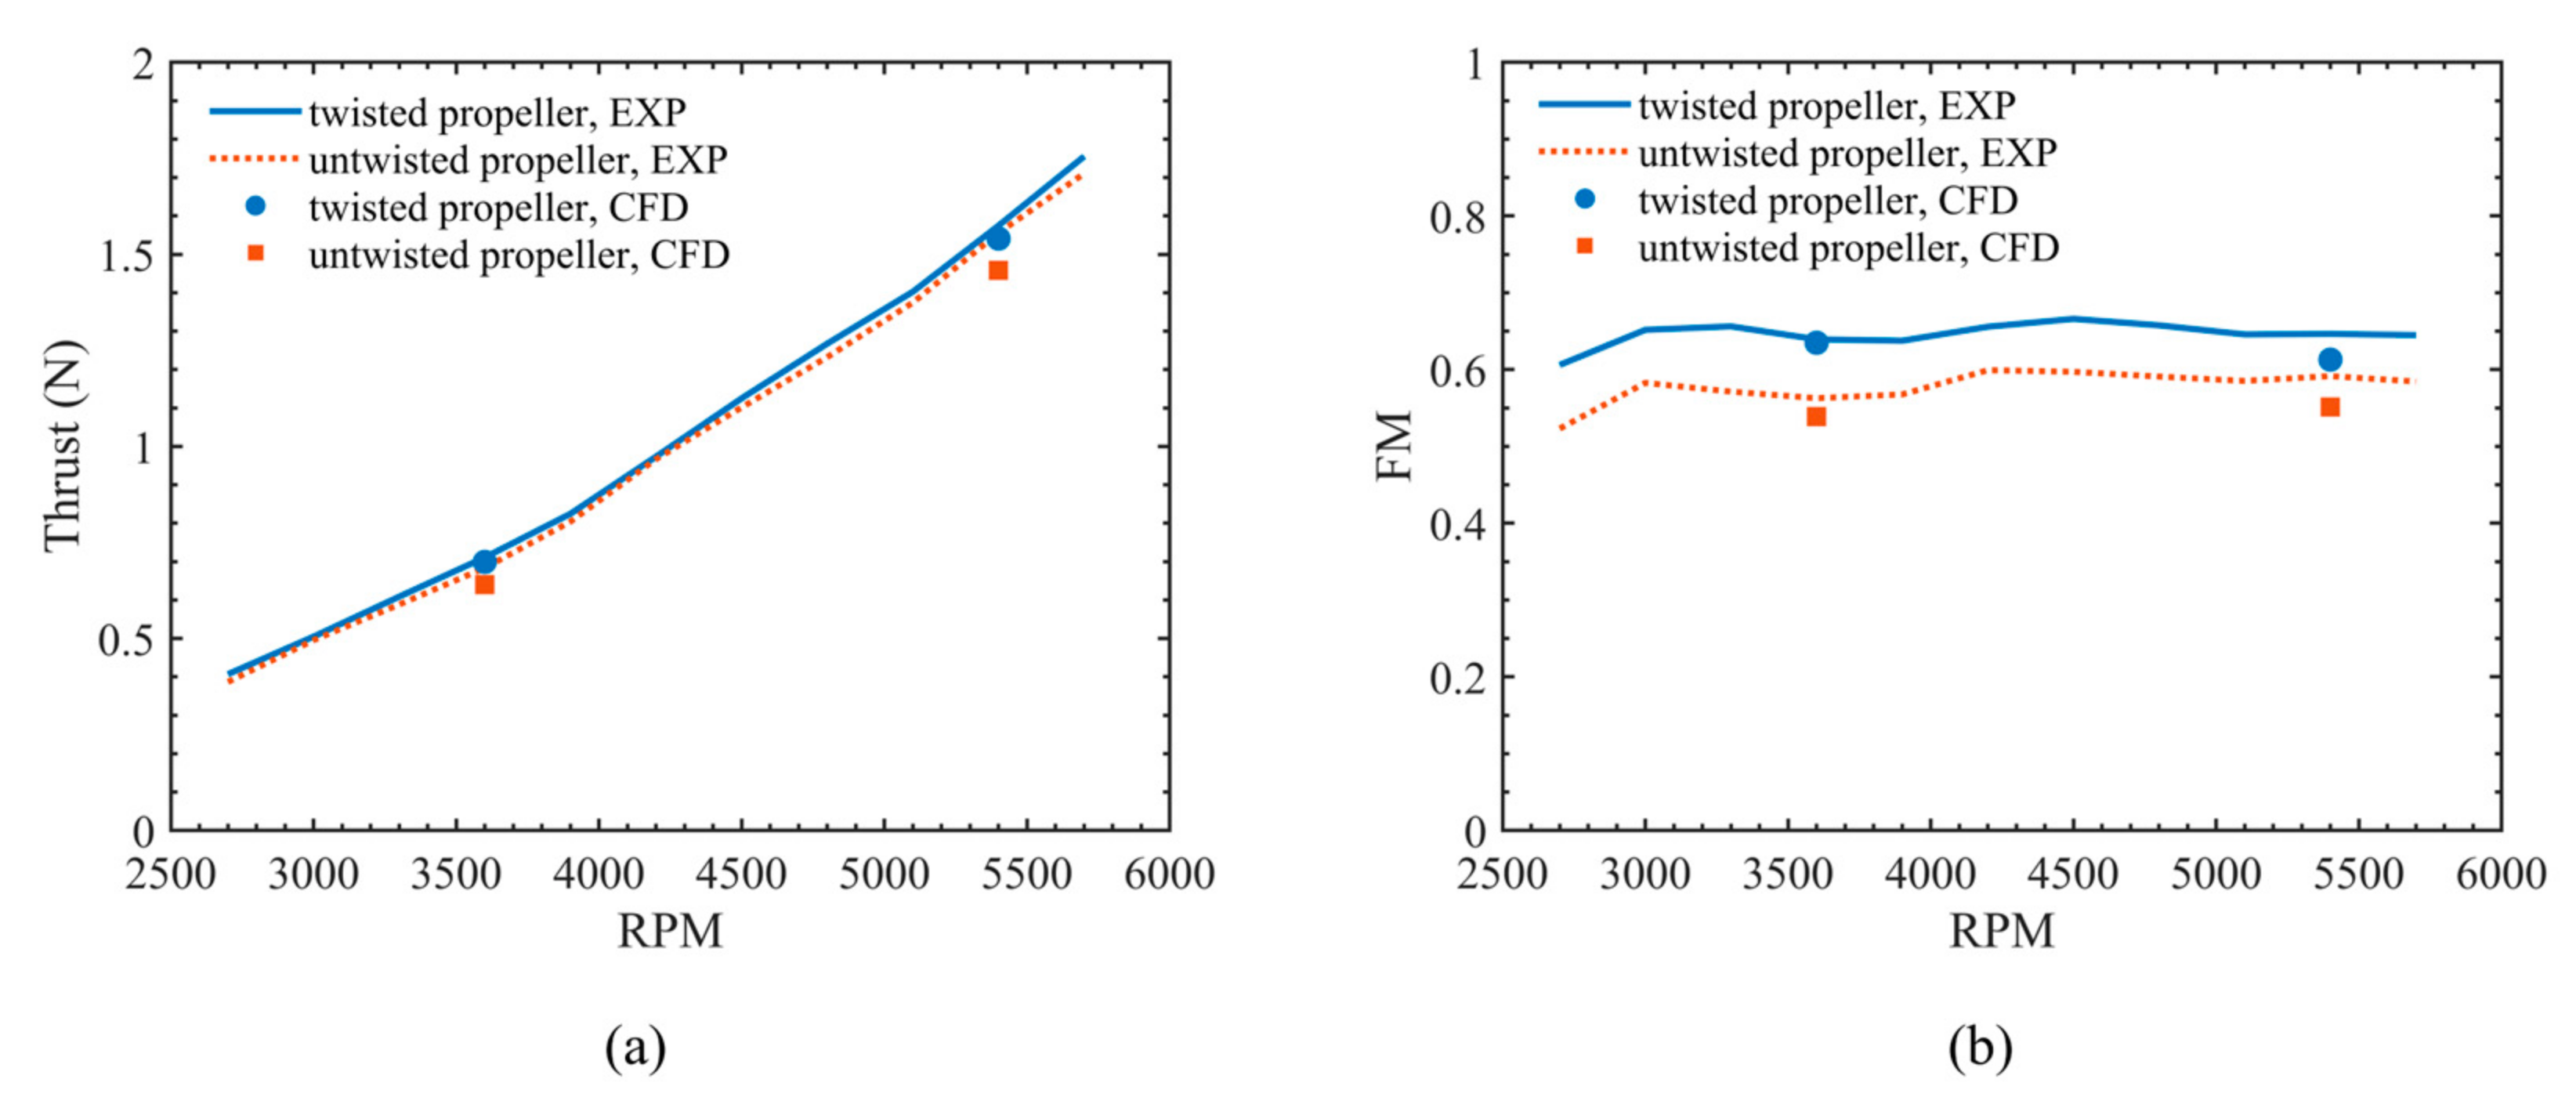
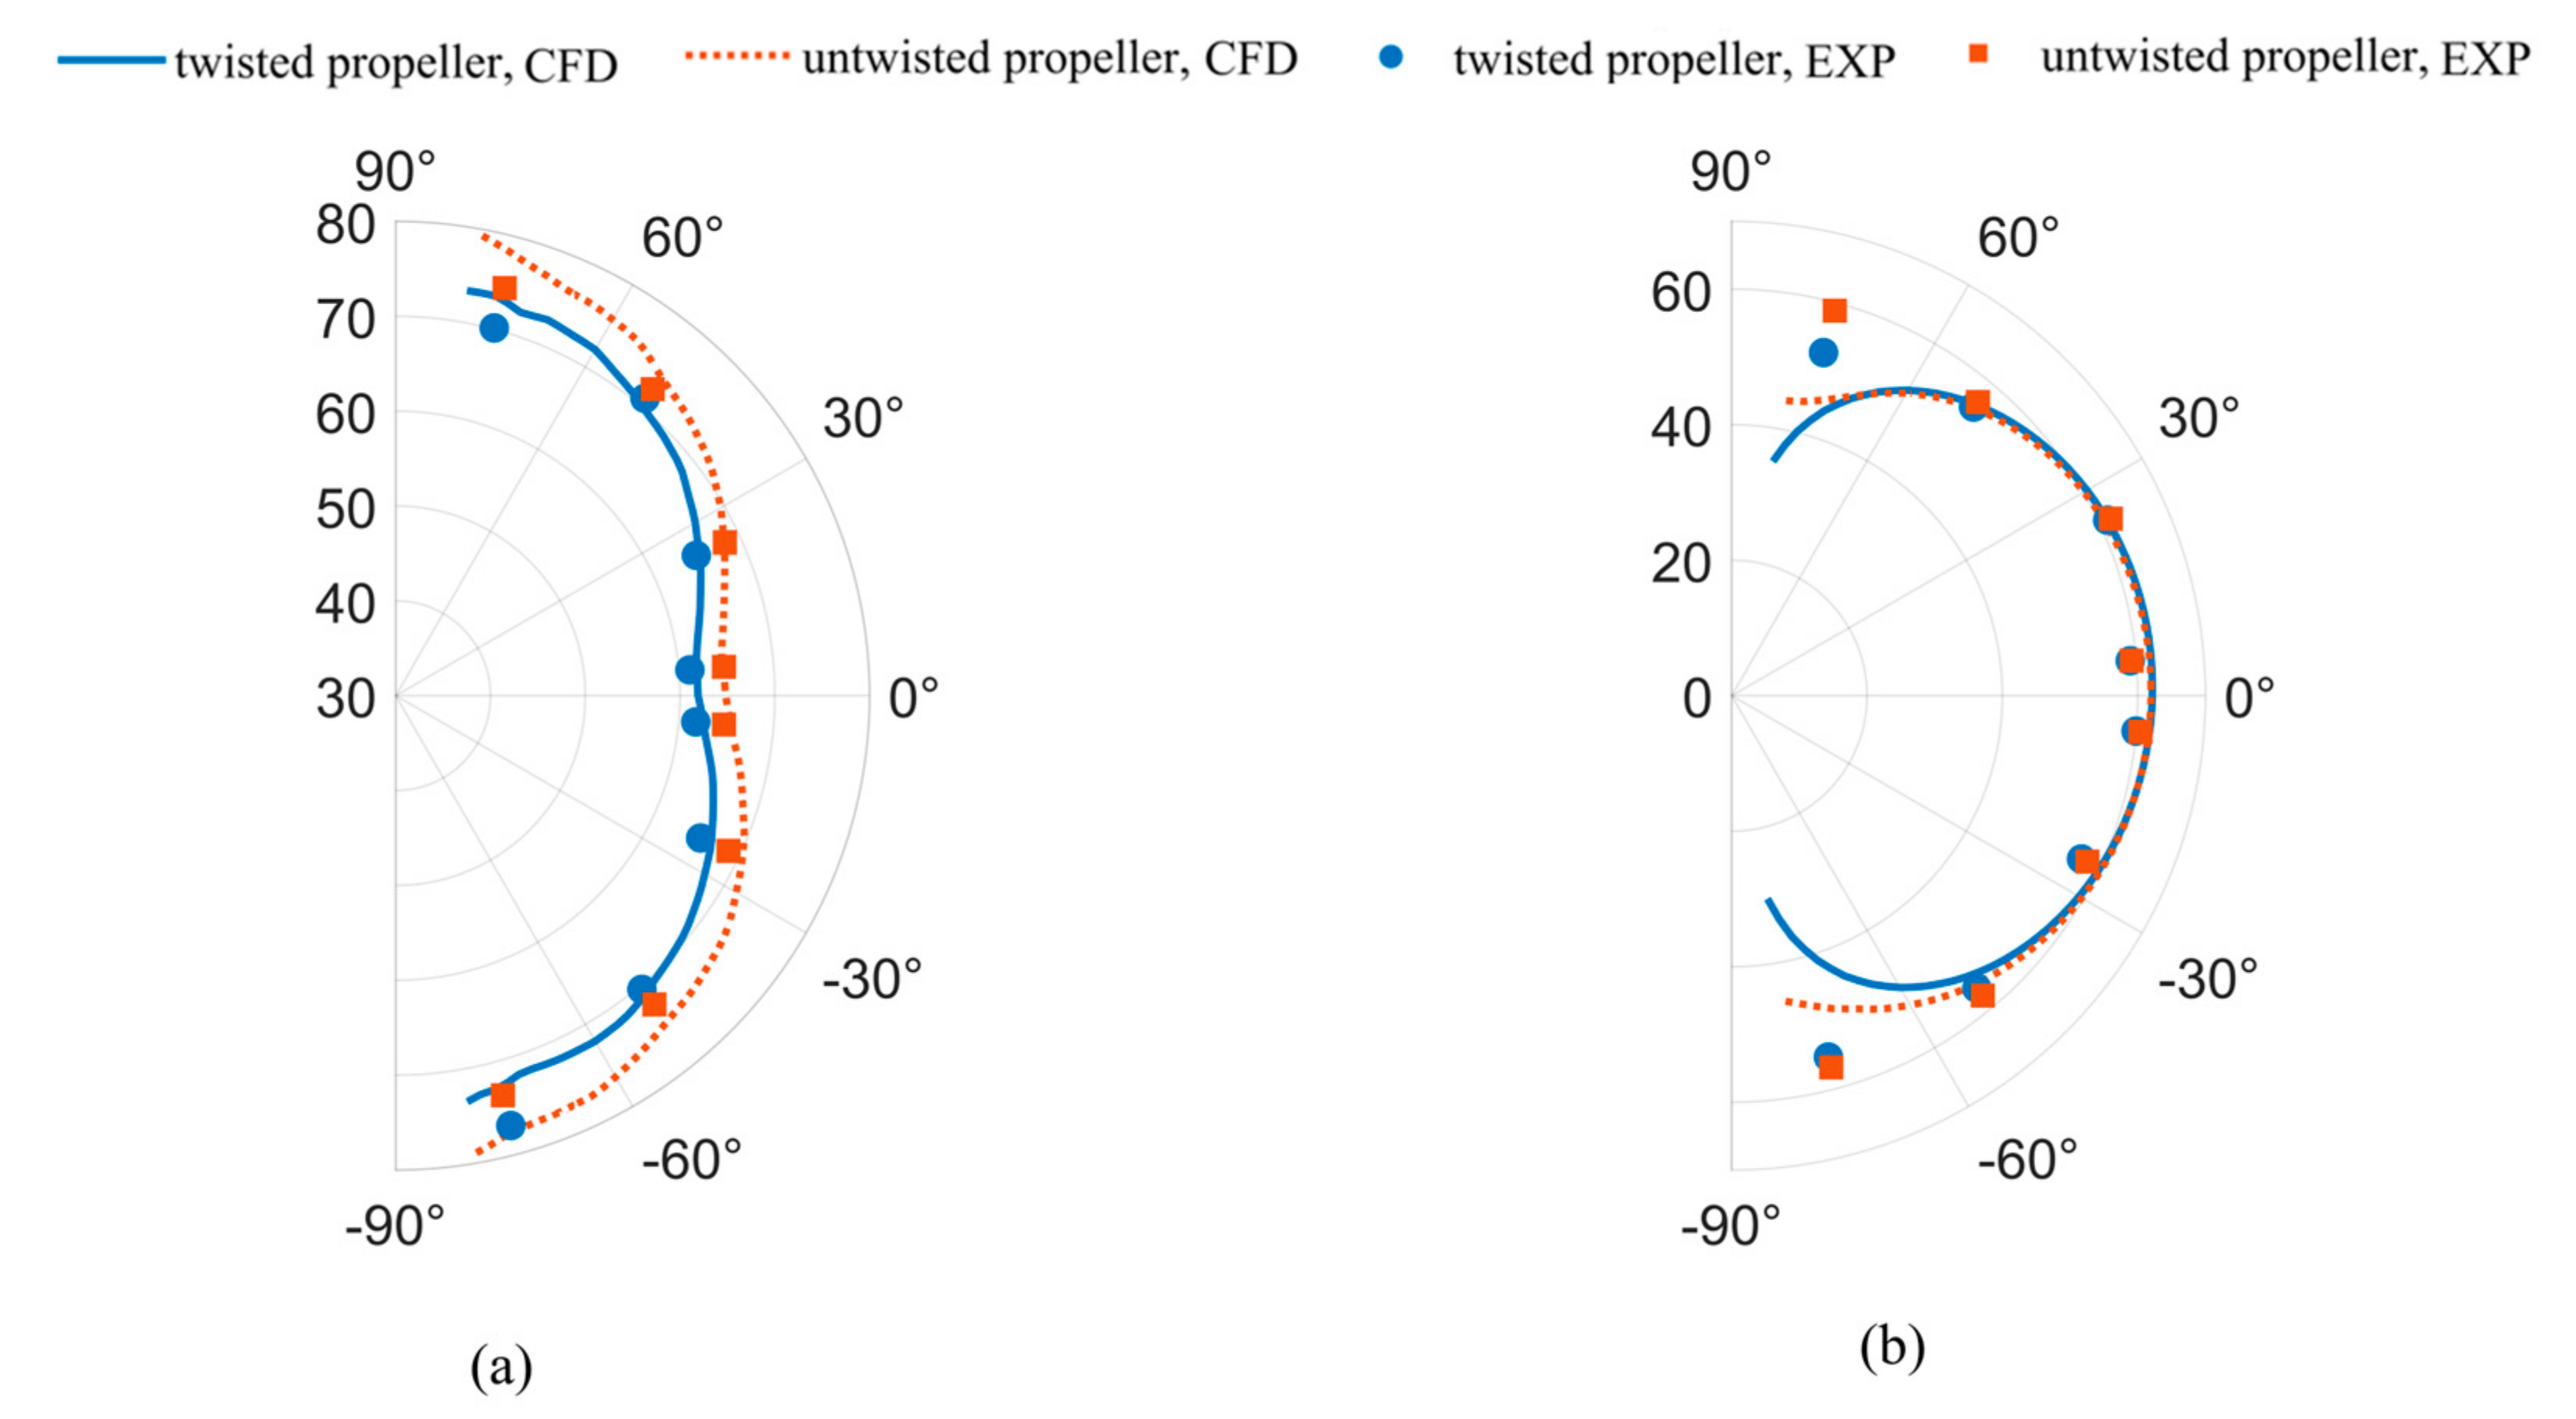
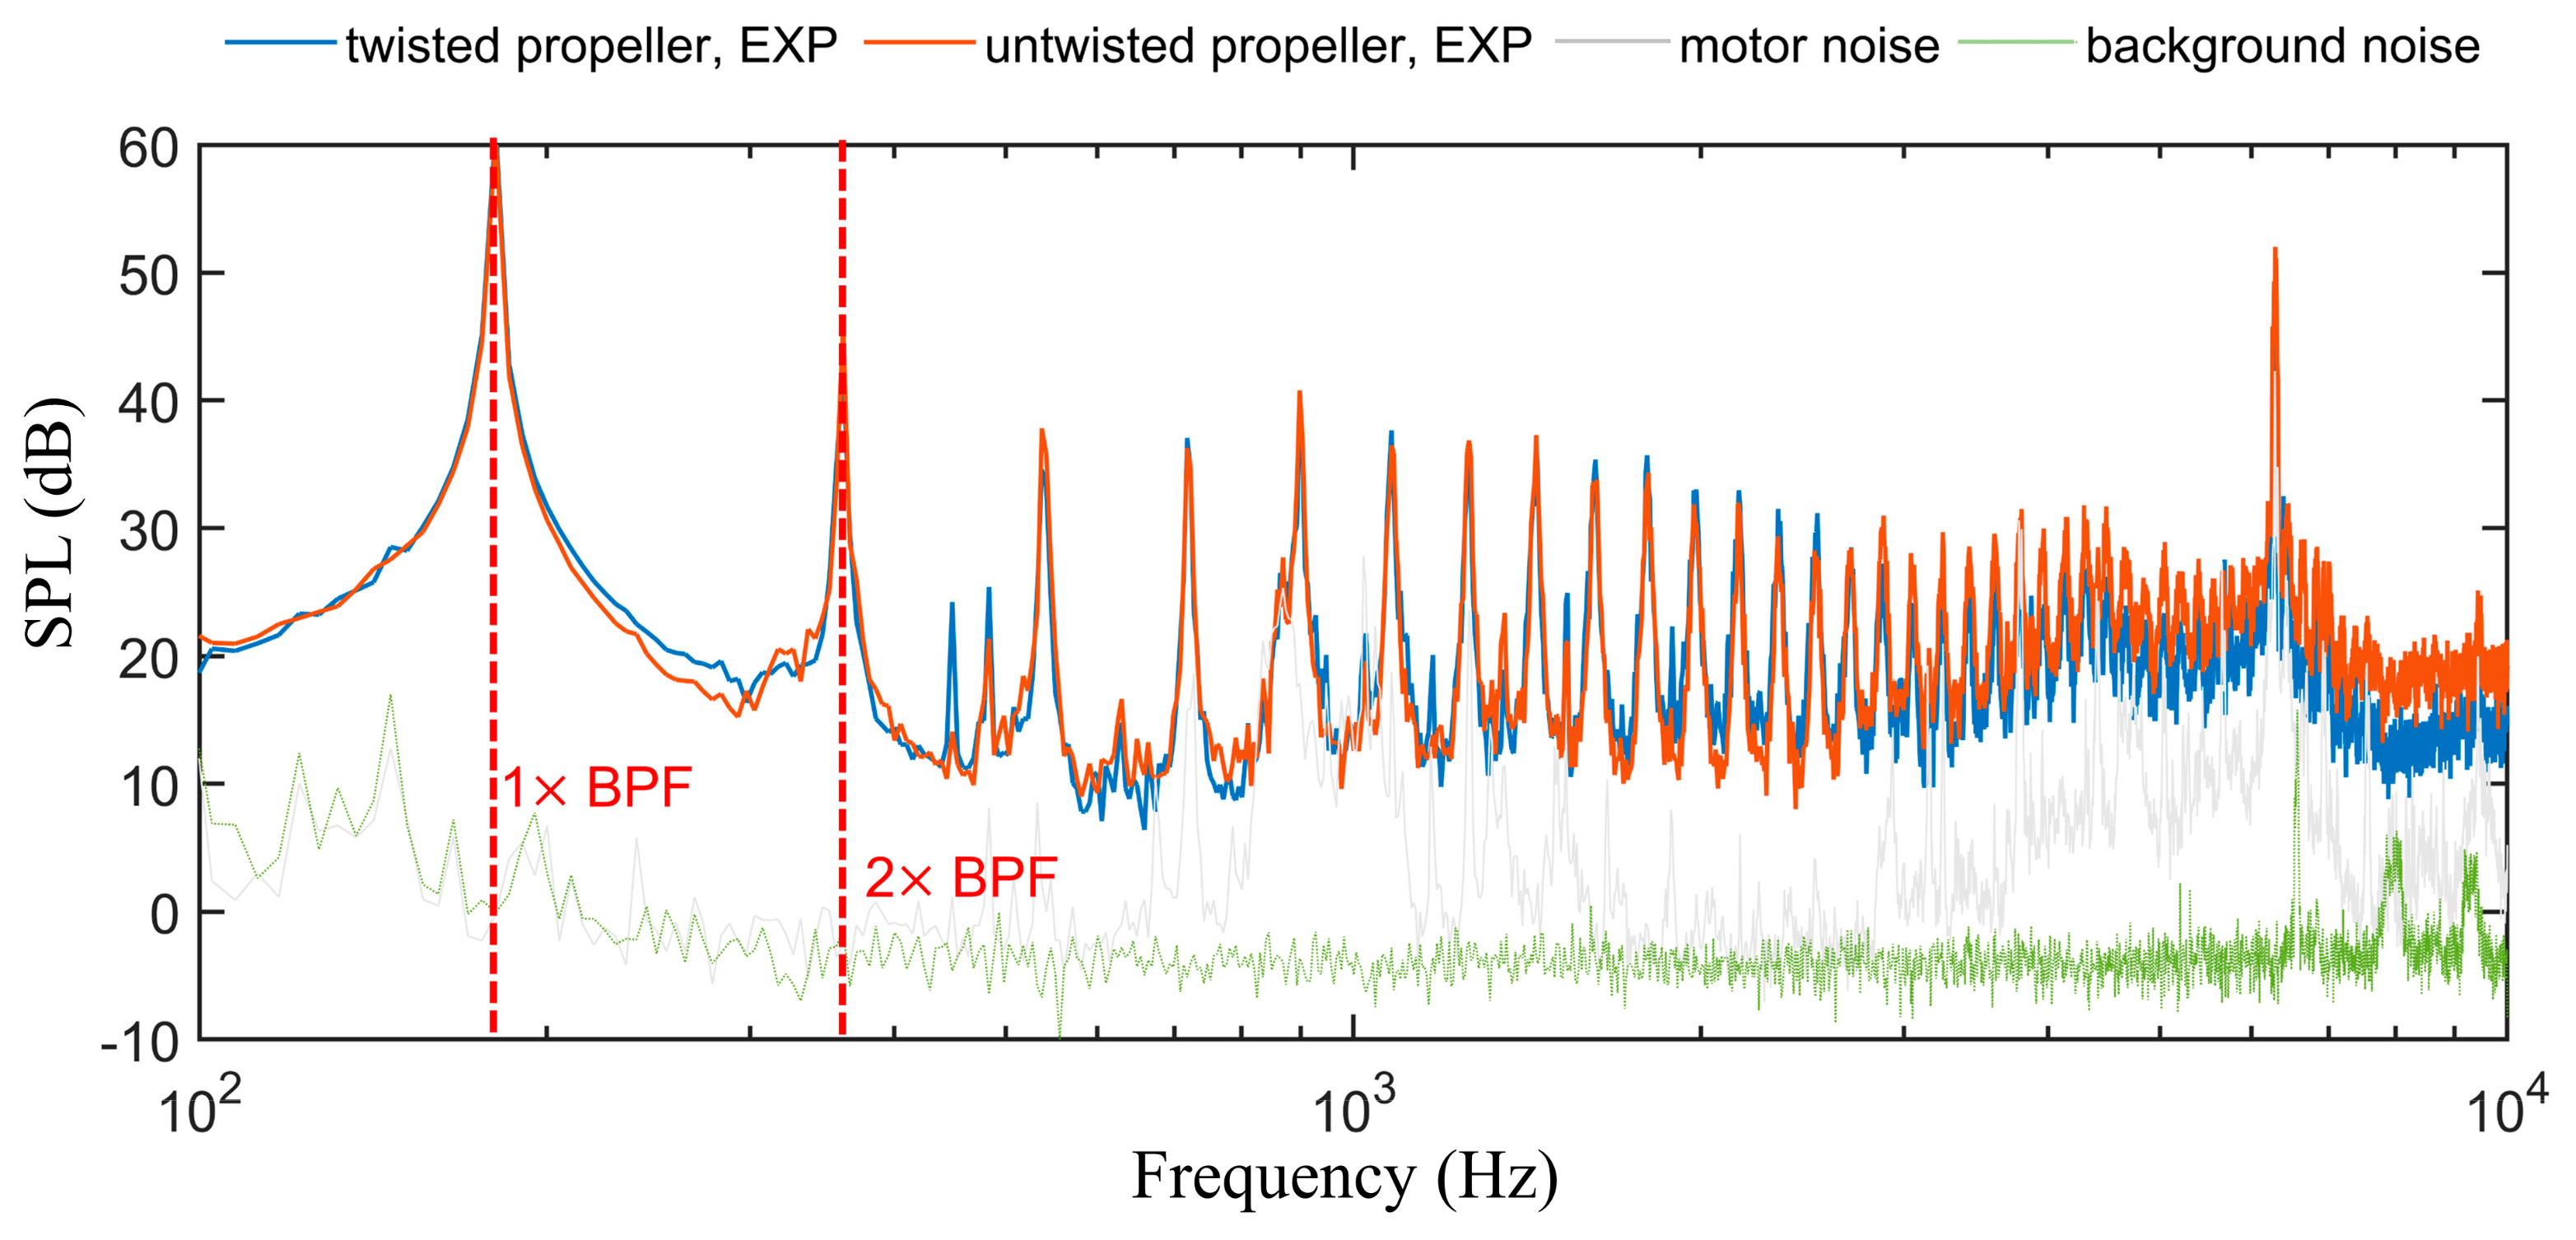
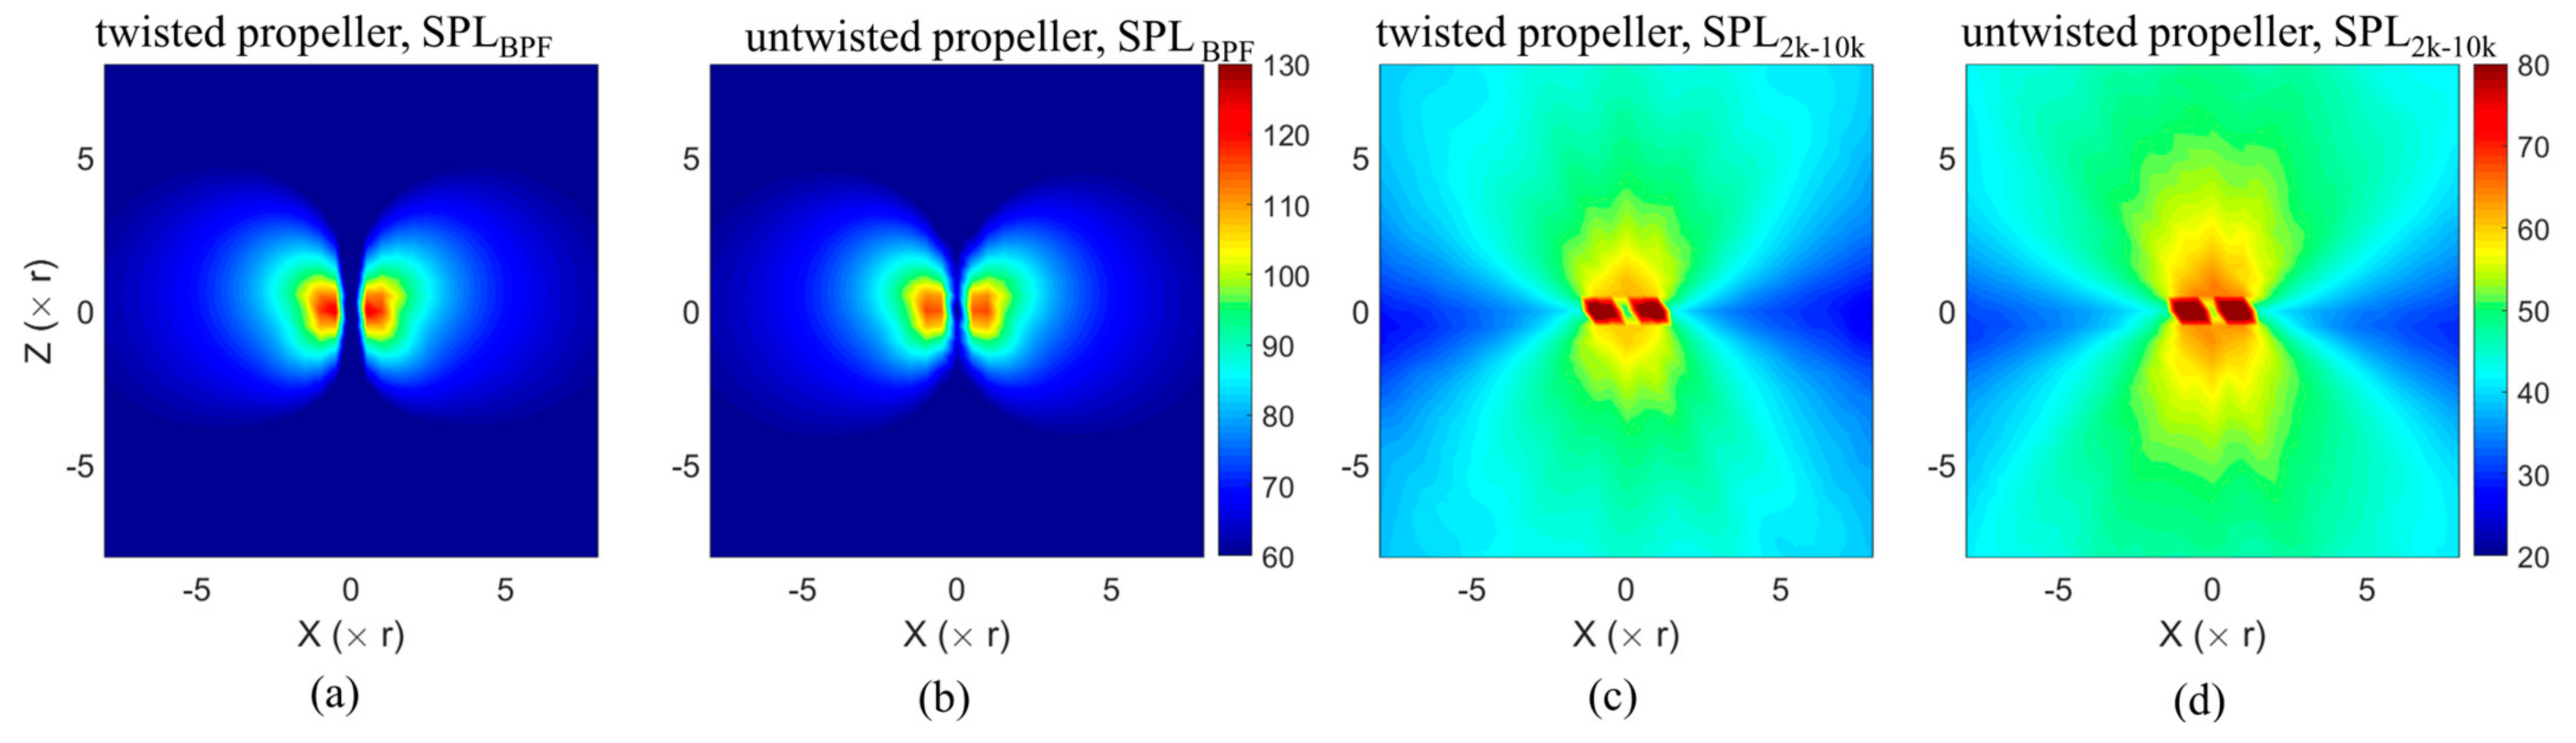
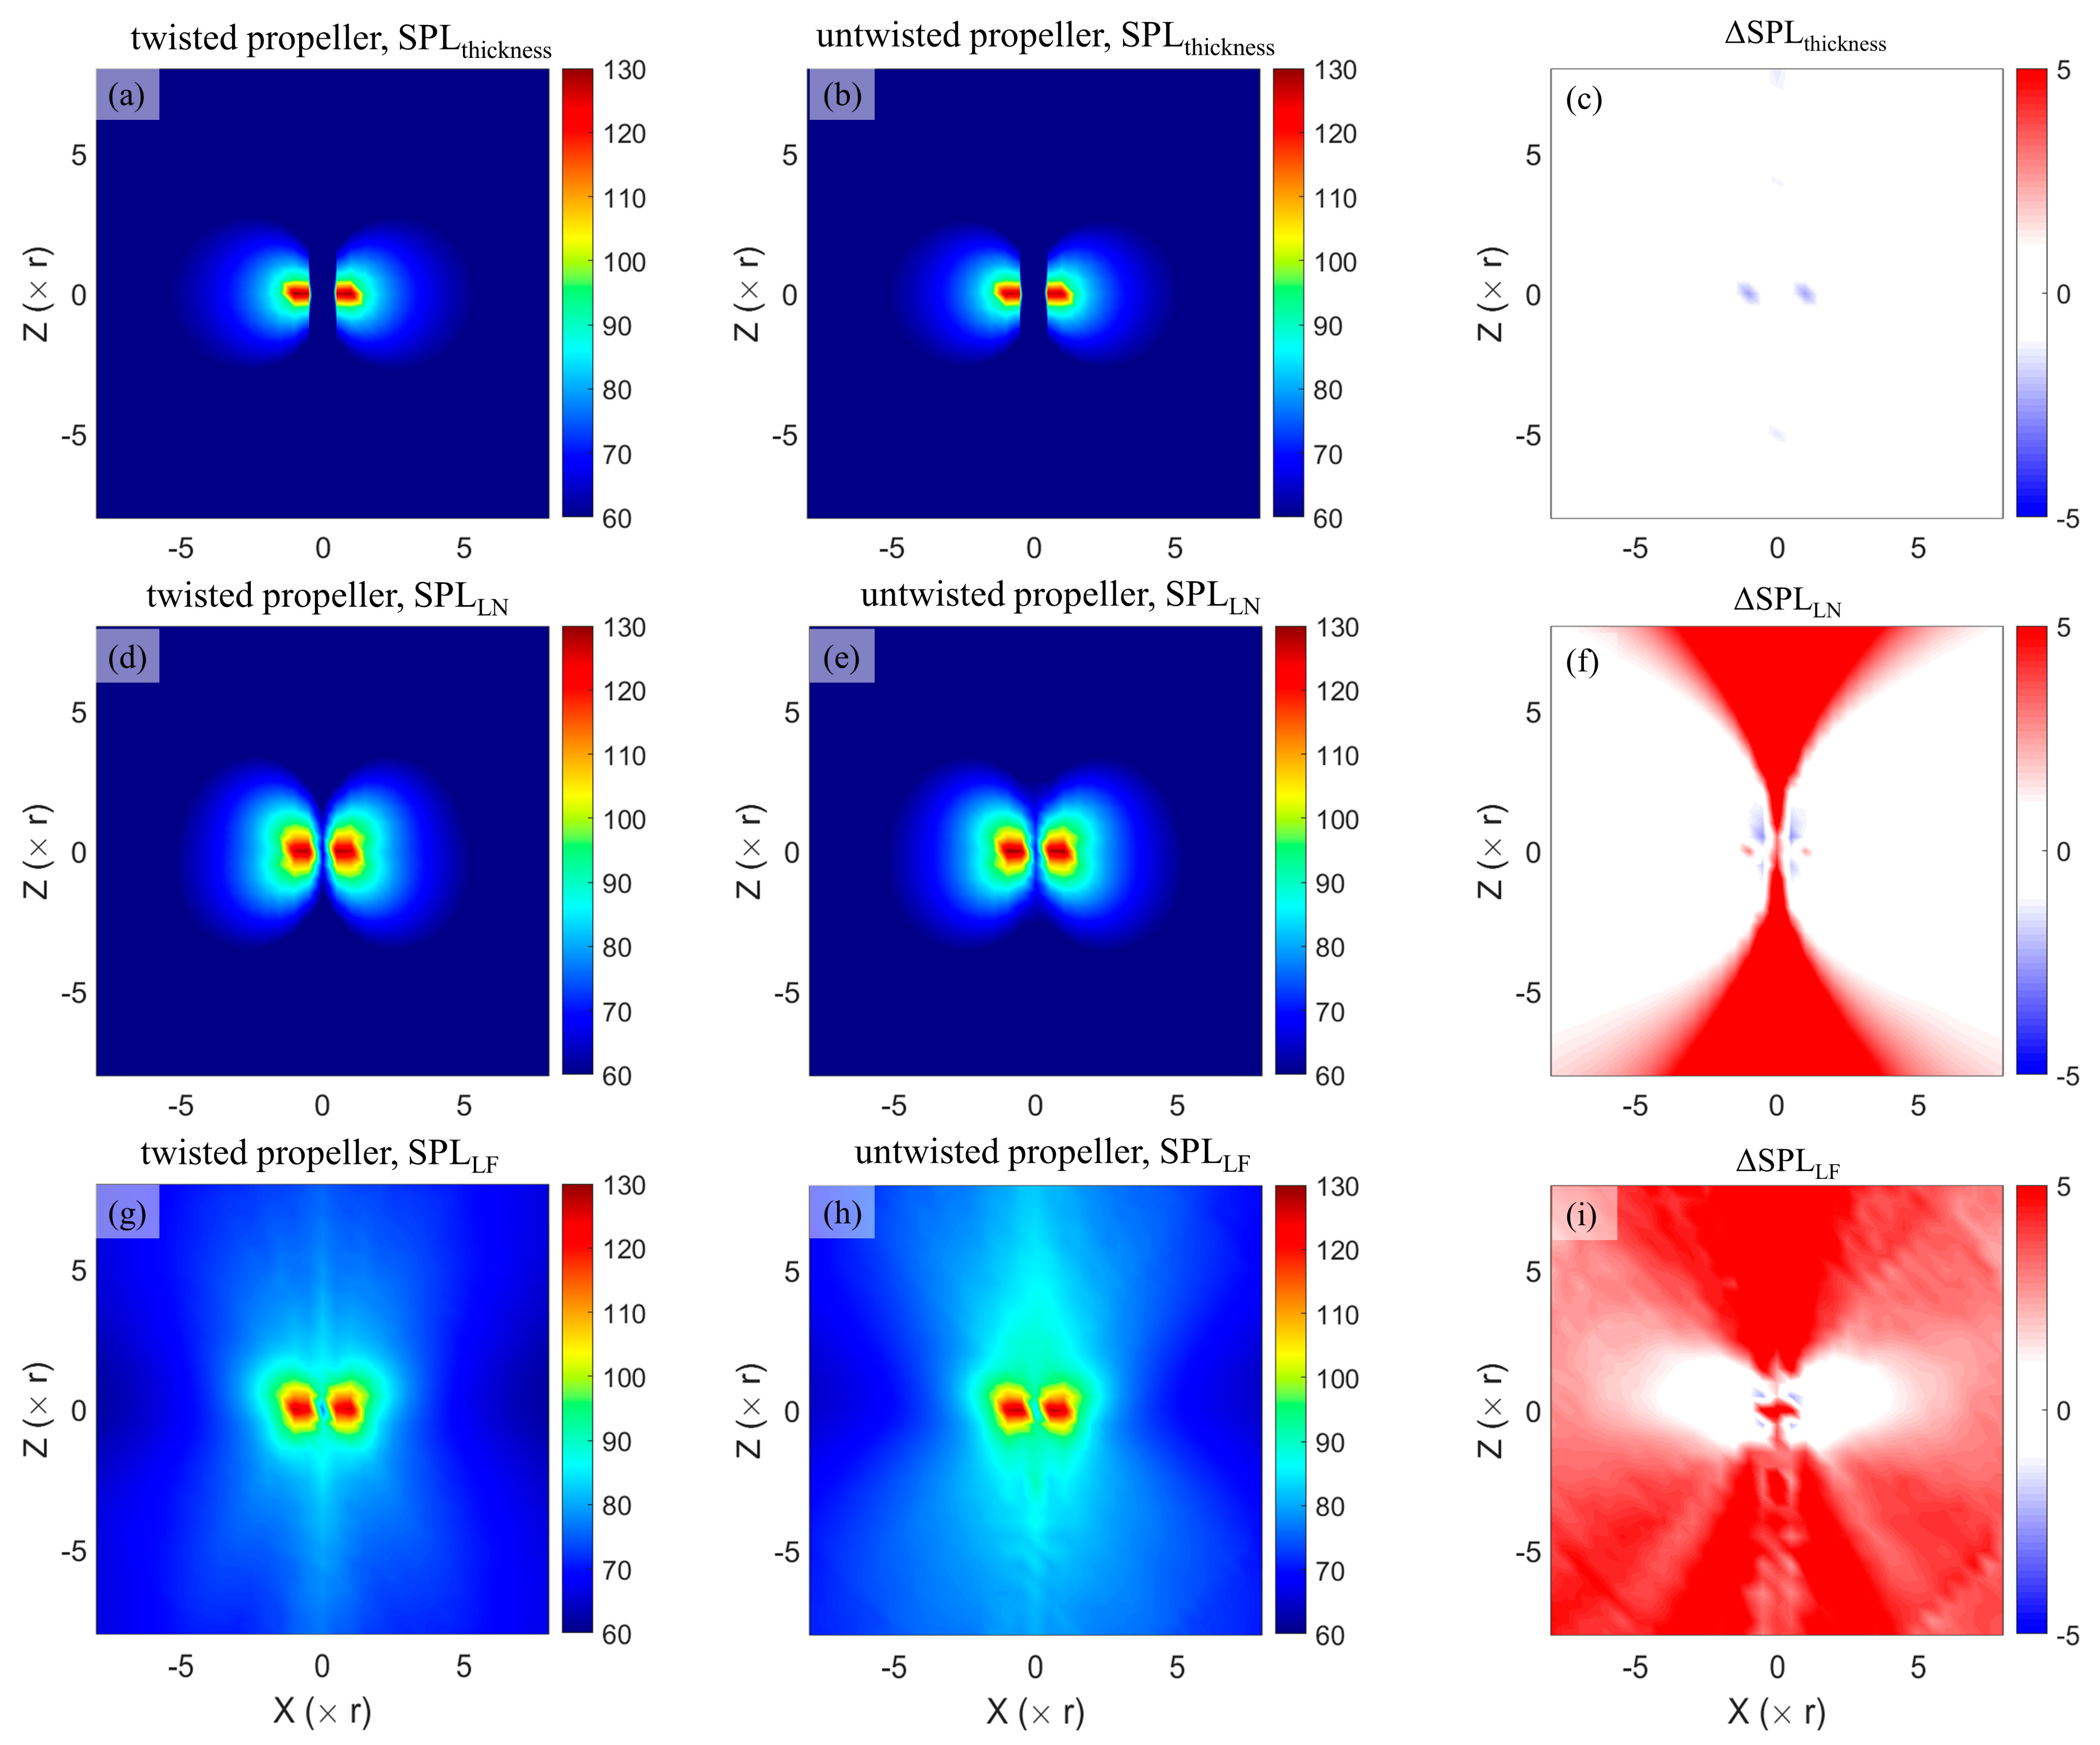
The hover-stand experiments in an anechoic chamber show that the twisted blade enables achieving a remarked increase in figure of merit (FM) by 9.3% compared to the untwisted blade at the same thrust coefficient. In terms of acoustic performance, the twisted propeller blade is capable to reduce the overall sound pressure level (OASPL) by up to 4.3 dB at a polar angle of 75°. and by an average of 2.2 dB at a distance of 8 r apart from the rotational center.
(2)
The 2D phase-locked PIV method combined with the visualizations of both kinetic energy fluctuation (k) and pressure fluctuations reveal that the twisted propeller blade can mitigate kinetic energy fluctuations in the vicinity of the blade tip, suppressing the trailing edge vortices, hence reducing the OASPL in terms of broadband noise in the high-frequency range (2 kHz to 10 kHz).
(3)
Our results point to the possibility of optimal twisted blade design in significantly improving both aerodynamic and acoustic performance in multirotor propellers, which is of importance for the development of high-efficiency and low-noise drones.

Author Contributions

J.S.: Conceptualization, Methodology, Hardware, Formal Analysis, Investigation, Writing—original draft. K.Y.: Writing—review. Y.T.: Methodology, Writing—review. H.S.: Methodology, Writing—review. H.L.: Conceptualization, Writing—review and editing, Supervision. All authors have read and agreed to the published version of the manuscript.

Funding

This work is partially supported by the Grant-in-Aid for Scientific Research of KAKENHI No. 19H00750, JSPS, and the Centre for Aerial Intelligent Vehicle (CAIV), Graduate School of Engineering, Chiba University.

Data Availability Statement

The data will be available on request to the corresponding author’s email with appropriate justification.

Conflicts of Interest

The authors declare no conflict of interest.

Abbreviations

AbbreviationsDefinitions
CFDcomputational fluid dynamic
PIVparticle image velocimetry
FMfigure of merit
OASPLoverall sound pressure level
fpsframes per second
SPLsound pressure level
PSDpower spectral density
BPFblade passing frequency
TVtip vortices
TEVtrailing edge vortices

References

  1. Floreano, D.; Wood, R.J. Science, technology and the future of small autonomous drones. Nature 2015, 521, 460–466. [Google Scholar] [CrossRef] [PubMed] [Green Version]
  2. Song, B.D.; Park, K.; Kim, J. Persistent UAV delivery logistics: MILP formulation and efficient heuristic. Comput. Ind. Eng. 2018, 120, 418–428. [Google Scholar] [CrossRef]
  3. Otto, A.; Agatz, N.; Campbell, J.; Golden, B.; Pesch, E. Optimization approaches for civil applications of unmanned aerial vehicles (UAVs) or aerial drones: A survey. Networks 2018, 72, 411–458. [Google Scholar] [CrossRef]
  4. Christian, A.W.; Cabell, R. Initial Investigation into the Psychoacoustic Properties of Small Unmanned Aerial System Noise. In Proceedings of the 23rd AIAA/CEAS Aeroacoustics Conference, AIAA AVIATION Forum, Denver, CO, USA, 5–9 June 2017; American Institute of Aeronautics and Astronautics: Reston, VA, USA, 2017. [Google Scholar]
  5. Sun, J.; Yonezawa, K.; Shima, E.; Liu, H. Integrated Evaluation of the Aeroacoustics and Psychoacoustics of a Single Propeller. Int. J. Environ. Res. Public Health 2023, 20, 1955. [Google Scholar] [CrossRef]
  6. Torija, A.J.; Li, Z.; Self, R.H. Effects of a hovering unmanned aerial vehicle on urban soundscapes perception. Transp. Res. D Transp. Environ. 2020, 78, 102195. [Google Scholar] [CrossRef]
  7. European Union Aviation Safety Agency. EASA Publishes First Guidelines on Noise Level Measurements for Drones below 600kg; European Union Aviation Safety Agency: Cologne, Germany, 2022. [Google Scholar]
  8. Jiang, H.; Wu, H.; Chen, W.; Zhou, P.; Zhong, S.; Zhang, X.; Zhou, G.; Chen, B. Toward high-efficiency low-noise propellers: A numerical and experimental study. Phys. Fluids 2022, 34, 076116. [Google Scholar] [CrossRef]
  9. Ning, Z.; Hu, H. An Experimental Study on the Aerodynamic and Aeroacoustic Performances of a Bio-Inspired UAV Propeller. In Proceedings of the 35th AIAA Applied Aerodynamics Conference, Denver, CO, USA, 5–9 June 2017; American Institute of Aeronautics and Astronautics: Reston, VA, USA, 2017. [Google Scholar]
  10. Hu, H.; Yang, Y.; Liu, Y.; Liu, X.; Wang, Y. Aerodynamic and aeroacoustic investigations of multi-copter rotors with leading edge serrations during forward flight. Aerosp. Sci. Technol. 2021, 112, 106669. [Google Scholar] [CrossRef]
  11. Yang, Y.; Liu, Y.; Arcondoulis, E.; Wang, Y.; Li, Y. Aerodynamic and Aeroacoustic Performance of an Isolated Multicopter Rotor during Forward Flight. AIAA J. 2020, 58, 1171–1181. [Google Scholar] [CrossRef]
  12. Tinney, C.E.; Sirohi, J. Multirotor Drone Noise at Static Thrust. AIAA J. 2018, 56, 2816–2826. [Google Scholar] [CrossRef]
  13. Lee, H.; Ryu, J.; Ahn, S.; Kwon, O. Aerodynamic design optimization of uav rotor blades using a genetic algorithm and artificial neural networks. J. Comput. Fluids Eng. 2014, 19, 29–36. [Google Scholar] [CrossRef] [Green Version]
  14. Hoyos, J.D.; Jiménez, J.H.; Echavarría, C.; Alvarado, J.P.; Urrea, G. Aircraft Propeller Design through Constrained Aero-Structural Particle Swarm Optimization. Aerospace 2022, 9, 153. [Google Scholar] [CrossRef]
  15. Boutemedjet, A.; Samardžić, M.; Rebhi, L.; Rajić, Z.; Mouada, T. UAV aerodynamic design involving genetic algorithm and artificial neural network for wing preliminary computation. Aerosp. Sci. Technol. 2019, 84, 464–483. [Google Scholar] [CrossRef]
  16. Tang, D.; Tang, B.; Shen, W.; Zhu, K.; Quan, Q.; Deng, Z. On genetic algorithm and artificial neural network combined optimization for a Mars rotorcraft blade. Acta Astronaut. 2023, 203, 78–87. [Google Scholar] [CrossRef]
  17. Burger, C.; Hartfield, R.; Burkhalter, J. Performance and Noise Optimization of a Propeller Using the Vortex Lattice Method and a Genetic Algorithm. In Proceedings of the 48th AIAA/ASME/ASCE/AHS/ASC Structures, Structural Dynamics, and Materials Conference, Honolulu, HI, USA, 23–26 April 2007; American Institute of Aeronautics and Astronautics: Reston, VA, USA, 2007. [Google Scholar]
  18. Liu, X.; Wang, L.; Tang, X. Optimized linearization of chord and twist angle profiles for fixed-pitch fixed-speed wind turbine blades. Renew. Energy 2013, 57, 111–119. [Google Scholar] [CrossRef]
  19. Shukla, D.; Komerath, N. Low Reynolds number multirotor aerodynamic wake interactions. Exp. Fluids 2019, 60, 77. [Google Scholar] [CrossRef]
  20. Lee, S.J.; Paik, B.G.; Yoon, J.H.; Lee, C.M. Three-component velocity field measurements of propeller wake using a stereoscopic PIV technique. Exp. Fluids 2004, 36, 575–585. [Google Scholar] [CrossRef]
  21. Shukla, D.; Komerath, N. Multirotor Drone Aerodynamic Interaction Investigation. Drones 2018, 2, 43. [Google Scholar] [CrossRef] [Green Version]
  22. Li, Y.; Yonezawa, K.; Liu, H. Effect of Ducted Multi-Propeller Configuration on Aerodynamic Performance in Quadrotor Drone. Drones 2021, 5, 101. [Google Scholar] [CrossRef]
  23. Zhang, Z.; Ma, H. Application of Phase-Locked PIV Technique to the Measurements of Flow Field in a Turbine Stage. J. Therm. Sci. 2020, 29, 784–792. [Google Scholar] [CrossRef]
  24. Ragni, D.; van Oudheusden, B.W.; Scarano, F. 3D pressure imaging of an aircraft propeller blade-tip flow by phase-locked stereoscopic PIV. Exp. Fluids 2011, 52, 463–477. [Google Scholar] [CrossRef] [Green Version]
  25. Ning, Z.; Wlezien, R.W.; Hu, H. An Experimental Study on Small UAV Propellers with Serrated Trailing Edges. In Proceedings of the 47th AIAA Fluid Dynamics Conference, Denver, CO, USA, 5–9 June 2017; American Institute of Aeronautics and Astronautics: Reston, VA, USA, 2017. [Google Scholar]
  26. Ffowcs-Williams, J.E.; Hawkings, D.L. Sound generation by turbulence and surfaces in arbitrary motion. Philos. Trans. R. Soc. Lond. Ser. A Math. Phys. Sci. 1969, 264, 321–342. [Google Scholar] [CrossRef]
  27. Iannace, G.; Ciaburro, G.; Trematerra, A. Acoustical unmanned aerial vehicle detection in indoor scenarios using logistic regression model. Build. Acoust. 2020, 28, 77–96. [Google Scholar] [CrossRef]
  28. Whelchel, J.; Alexander, W.N.; Intaratep, N. Propeller Noise in Confined Anechoic and Open Environments. In Proceedings of the AIAA Scitech 2020 Forum, Orlando, FL, USA, 6–10 January 2020; American Institute of Aeronautics and Astronautics: Reston, VA, USA, 2020. [Google Scholar]
  29. Papa, U.; Iannace, G.; Del Core, G.; Giordano, G. Sound power level and sound pressure level characterization of a small unmanned aircraft system during flight operations. Noise Vib. Worldw. 2017, 48, 67–74. [Google Scholar] [CrossRef]
  30. Rong, J.; Liu, H. Effects of owl-inspired leading-edge serrations on tandem wing aeroacoustics. AIP Adv. 2022, 12, 115103. [Google Scholar] [CrossRef]
  31. Jiang, H.; Zhong, S.; Wu, H.; Zhang, X.; Huang, X.; Zhou, G.; Chen, B. Radiation Modes of Propeller Tonal Noise. J. Vib. Acoust. 2022, 144, 021009. [Google Scholar] [CrossRef]
  32. Tanabe, Y.; Sugawara, H.; Yonezawa, K.; Sunada, S.; Tokutake, H. Influence of Rotor Blade Twist on the Ducted Rotor Performance. In Proceedings of the 8th Asian/Australian Rotorcraft Forum 2019 (ARF), Ankara, Turkey, 30 October–2 November 2019. [Google Scholar]
  33. Tanabe, Y.; Sugawara, H.; Sunada, S.; Yonezawa, K.; Tokutake, H. Quadrotor Drone Hovering in Ground Effect. J. Robot. Mechatron. 2021, 33, 339–347. [Google Scholar] [CrossRef]
  34. Ikeda, T.; Ueda, T.; Nakata, T.; Noda, R.; Tanaka, H.; Fujii, T.; Liu, H. Morphology Effects of Leading-edge Serrations on Aerodynamic Force Production: An Integrated Study Using PIV and Force Measurements. J. Bionic Eng. 2018, 15, 661–672. [Google Scholar] [CrossRef]
  35. Thielicke, W.; Sonntag, R. Particle Image Velocimetry for MATLAB: Accuracy and enhanced algorithms in PIVlab. J. Open Res. Softw. 2021, 9, 12. [Google Scholar] [CrossRef]
  36. Bu, H.; Wu, H.; Bertin, C.; Fang, Y.; Zhong, S. Aerodynamic and acoustic measurements of dual small-scale propellers. J. Sound Vib. 2021, 511, 116330. [Google Scholar] [CrossRef]
  37. Sugiura, M.; Tanabe, Y.; Matayoshi, N.; Ishii, H.; Sugawara, H. Numerical Simulations and Measurements of the Helicopter Wake in Ground Effect. J. Aircr. 2017, 54, 209–219. [Google Scholar] [CrossRef]
  38. Tanabe, Y.; Sugiura, M.; Aoyama, T.; Sugawara, H.; Sunada, S.; Yonezawa, K.; Tokutake, H.; Systems, C.R. Multiple Rotors Hovering Near an Upper or a Side Wall. J. Robot. Mechatron. 2018, 30, 344–353. [Google Scholar] [CrossRef]
  39. Farassat, F. Derivation of Formulations 1 and 1A of Farassat; NASA: Hampton, VA, USA, 2007. [Google Scholar]
  40. Tanabe, Y.; Saito, S.; Sugawara, H. Evaluation of Rotor Noise Reduction by Active Devices Using a CFD/CSD Coupling Analysis Tool Chain. In Proceedings of the 1st Asian Australian Rotorcraft Forum and Exhibition, Busan, Republic of Korea, 12–15 February 2012; Volume 2012. [Google Scholar]
  41. Chatila, J.G.; Danageuzian, H.R. PIV and CFD investigation of paddle flocculation hydrodynamics at low rotational speeds. Sci. Rep. 2022, 12, 19742. [Google Scholar] [CrossRef] [PubMed]
  42. Leishman, G.J. Principles of Helicopter Aerodynamics; Cambridge University Press: Cambridge, UK, 2006; ISBN 0521858607. [Google Scholar]
  43. Kurtz, D.W.; Marte, J.E. A Review of Aerodynamic Noise from Propellers, Rotors, and Lift Fans; NASA: Pasadena, CA, USA, 1970. [Google Scholar]
Figure 1. (a) A multirotor propeller with twisted and untwisted blades and (b) the corresponding sectional chord and twist spanwise distributions where R is the radial coordinate measured from the rotational center.
Drones 07 00252 g001
Figure 2. Illustration of the experimental set-up for PIV measurements: (a) Signals of synchronous control of camera and propeller phase angle, (b) Schematic of the set-up for PIV measurement, and (c) Photograph of the set-up for PIV measurement.
Drones 07 00252 g002
Figure 3. Illustration of the experimental set-up for aerodynamic force and sound measurements.
Drones 07 00252 g003
Figure 4. Computational domain and overlapped grid systems about a propeller.
Drones 07 00252 g004
Figure 5. Comparison of time-averaged (a,b,e,f) and phase-averaged (c,d,g,h) velocity contours normalized by tip velocity Vtip between PIV (b,d,f,h) and CFD (a,c,e,g) results of twisted and untwisted propellers.
Drones 07 00252 g005
Figure 6. Goodness-of-fit evaluation of computed velocities and PIV measurements: (a) untwisted propeller and (b) twisted propeller.
Drones 07 00252 g006
Figure 7. Velocity distributions of untwisted and twisted propellers at different downstream locations.
Drones 07 00252 g007
Figure 8. Iso-vorticity surfaces (red: ω = 200   s 1 , blue: ω = 400   s 1 ) based on phase-locked interpolated PIV measurements.
Drones 07 00252 g008
Figure 9. Comparison of (a) thrust force and (b) figure of merit (FM) between CFD simulations and measurements.
Drones 07 00252 g009
Figure 10. Directivity comparison of (a) OASPL and (b) SPL at blade passing frequency (180 Hz) between measurements (symbols) and CFD simulations (lines).
Drones 07 00252 g010
Figure 11. Comparison of sound spectra between twisted and untwisted propellers at Mic 3 with a polar angle of 25°.
Drones 07 00252 g011
Figure 12. SPL fields at BPF (a,b) and 2 k and 10 k (c,d), respectively, on an observation plane of y = 0 for twisted propeller and untwisted propeller.
Drones 07 00252 g012
Figure 13. Aeroacoustic emission patterns with various noise sources: (ac) thickness noise, (df) near-field loading noise, and (gi) far-field loading noise associated with twisted (a,d,g) and untwisted (b,e,h) propellers. Note that the blade twist effect on reducing noise emissions is also illustrated in (c,f,i).
Drones 07 00252 g013
Figure 14. Phase-averaged chordwise velocity field (CFD) at various radial locations (0.3 r, 0.5 r, 0.7 r, 0.9 r) in twisted propeller (ad) and untwisted propeller (eh).
Drones 07 00252 g014
Figure 15. Normalized kinetic energy fluctuation (k) (CFD) at various radial locations (0.3 r, 0.5 r, 0.7 r, 0.9 r) in twisted propeller (ad) and untwisted propeller (eh).
Drones 07 00252 g015
Figure 16. Contours of pressure fluctuations coefficient ( C p a s t d ) around untwisted propeller (a) and twisted propeller (b) where R is the radial coordinate measured from the rotational center.
Drones 07 00252 g016
Figure 17. Vorticity distributions of phase-locked PIV measurements at phase angles of 0° (a,c) and 90° (b,d) in untwisted propeller (a,b) and untwisted propeller (c,d).
Drones 07 00252 g017
Disclaimer/Publisher’s Note: The statements, opinions and data contained in all publications are solely those of the individual author(s) and contributor(s) and not of MDPI and/or the editor(s). MDPI and/or the editor(s) disclaim responsibility for any injury to people or property resulting from any ideas, methods, instructions or products referred to in the content.

