Article

Use of Drone Photogrammetry as An Innovative, Competency-Based Architecture Teaching Process

by
Jordi Rábago
1 and
May Portuguez-Castro
2,*
1
School of Architecture, Art, and Design, Tecnologico de Monterrey, Leon 37190, Mexico
2
Institute for the Future of Education, Tecnologico de Monterrey, Monterrey 64849, Mexico
*
Author to whom correspondence should be addressed.
Drones 2023, 7(3), 187; https://doi.org/10.3390/drones7030187
Submission received: 29 January 2023 / Revised: 27 February 2023 / Accepted: 3 March 2023 / Published: 9 March 2023
(This article belongs to the Special Issue Drones: Opportunities and Challenges)

Abstract

:
The use of drones is becoming increasingly popular in various fields. In the case of education, initiatives have emerged in which they are included as tools to develop student’s knowledge, and their use is becoming more frequent. This research aims to present a case study in which students used drones in an architecture course at a higher education institution in Mexico. It sought to develop transversal competencies in students, such as digital transformation and cutting-edge technologies by studying spaces using photogrammetry with drones. The results showed that students increased their motivation and were able to perform a more detailed analysis of the architectural space in which they conducted the study. Additionally, they were able to capture and analyze information from architectural study processes more quickly. Aerial photogrammetry is a geospatial data collection method that offers several advantages over other methods. These advantages include higher resolution, wide coverage, flexibility, lower costs, and increased safety. Aerial photogrammetry can capture high-resolution images of large areas of land in a single flight, making it an efficient and adaptable tool for a variety of applications and environments. Additionally, it can be more economical and safer than other methods, as it avoids ground contact and reduces risks to personnel and equipment. This study is considered attractive, as it presents an example of the implementation of emerging technologies in architectural education.

1. Introduction

In recent years, unmanned aerial vehicles (UAVs) have become increasingly popular tools, with great acceptance due to their high capacity and flexibility [1]. Within UAVs are drones, flying robots that are controlled remotely, either by humans or through flight plans maintained using software [2]. These UAVs have several applications that allow taking aerial photography, so their use is given in various fields, such as agriculture, security, telecommunications, and entertainment [3]. Recently, due to the possibility of using technologies to create more realistic environments, they are also used for aerial data collection in construction, surveying, and mining [4]. In this sense, photogrammetry has benefited from these developments.
The rise of photogrammetry in recent years is due to the parallel development of commercially available hardware and software for drones. Using photogrammetry, aerial images can be captured, and valuable information can be generated from large amounts of data, allowing changes over time in terrain and properties to be measured [5]. Because of this simplicity and the automation of current solutions, professionals can integrate photogrammetry with drones to map large tracts of land and generate high-resolution three-dimensional models.
Currently, three-dimensional models created by photogrammetry are also used in educational contexts. Their use improves the fidelity in the representation of environments [6], favoring cognitive processes in learning [4] and creating more immersive and realistic experiences [7] capable of generating better retention and performance in students [8]. Unfortunately, more research still needs to be performed on using photogrammetry in education.
When reviewing the literature, we found gaps in using these technologies in education that we can address in this study. The first is related to the use of drones as pedagogical tools. However, some studies mention their potential in the educational field [9], but there is still a need to deepen how faculty can use drones to improve the teaching and learning of specific skills in different academic areas.
Several studies have indicated that, although drones are promoted as tools for educational purposes, there is a need for practical learning activities that can effectively utilize these technologies [10]. There should also be a comprehensive discussion on the potential limitations and challenges that may arise from incorporating drones into educational settings.
In a traditional process of study and analysis of sites and buildings, students usually resort to tools such as Google Earth in order to obtain the necessary information for the development of projects. Google Earth is an online service by Google that offers high-resolution satellite imagery and maps of the Earth. These images are captured from satellites in space and are available for viewing on an online platform. Google Earth also offers a variety of navigation and search tools that allow users to explore the Earth and obtain geographic information.
Google Maps uses satellite data from many sources, which have different resolutions, varying in each location around the world. For this reason, Google does not have the policy to declare the accuracy of Google Maps data with respect to any specific area [11]. On the other hand, aerial photogrammetry is a method of capturing images that uses airplanes or drones to take aerial photographs of the Earth’s surface. These images are processed and analyzed to generate maps, three-dimensional models, and other high-precision geospatial products. Aerial photogrammetry is a tool commonly used in cartography, urban planning, agriculture, natural resource management, and other related applications.
In summary, Google Earth is an online tool for visualizing satellite imagery, while aerial photogrammetry is a method of capturing images used to generate high-precision geospatial products.
Considering the above, the use of quality and low-cost drones can be incorporated into the study of architecture, topography, and engineering topics. This research project sought to integrate both technologies (photogrammetry and drones) in activities that can be used in educational environments and are valuable for different communities and contexts. In addition, through a search of active methodologies, such as challenge-based learning (CBL) and competency-based teaching, students were encouraged to solve challenges they will encounter in the real world. At the same time, they were applying the knowledge acquired during their professional training [12]. The main objective of this study is to measure motivation and the development of transversal skills regarding the use of technologies applied to the discipline, in this particular case the use of aerial photogrammetry to obtain data for the development of architectural and urban projects.
Finally, the results of this research will likely provide a methodology that educational institutions can use. It is important to develop activities highlighting the use of photogrammetry with drones as a new method of measuring buildings that endorse its integration into the processes of architectural design and work in the branches of the built environment.

1.1. Use of Drones in Education

A drone is a UAV that can be operated remotely or autonomously. Although initially developed for military purposes, drones are now widely used for other applications [13]. These include environmental tasks, such as managing national parks and agricultural lands, tracking wildlife in different areas, observing the effects of climate change, and monitoring biodiversity in diverse ecosystems ranging from rainforests to oceans. Drones also recognize and investigate natural disasters, such as fires and avalanches [14]. In addition, they are used for rescue missions, delivering mail and packages, and in educational settings.
The use of drones in education is on the rise. As a technology that is increasingly prevalent in workplaces, it provides a benefit to integrating it into classroom activities to help students develop competencies such as critical thinking and problem-solving [15]. Drones allow students a new learning experience and motivate them to engage in this process more creatively and innovatively [16]. Although using these unmanned vehicles in educational settings is considered to benefit students, research on drones in education still needs to be conducted [17].
The use of UAVs in science, technology, engineering, and mathematics (STEM) education has increased. Various methods have been employed to introduce these devices into the educational process, such as having students conduct final projects involving UAVs, integrating a UAV educational model into an existing course, or creating an entire course dedicated to this technology [18]. According to Bolick et al. [19], the use of these emerging technologies can help students develop essential skills, such as critical thinking, problem-solving, data analysis, research, and data visualization.
However, their use has limitations, such as a lack of familiarity with the subject matter [20], restrictive regulations, or concerns regarding security and privacy [21]. In a study conducted with higher education students at a U.S. university in the use of natural resources, students showed improvement in knowledge retention and interest towards these devices considering specific recommendations related to access to a UAV, familiarity of teachers, age of students, hardware and software needed to carry out the educational experience, among others [19].
A study using drones to improve the teaching and learning process was developed by Féliz-Herrán et al. [22] at a university in Mexico. The research was conducted with engineering students who were given challenges and had to devise innovative solutions as a team by performing a “Drone rally” on an obstacle course organized by them. They used free software to carry out the experience, so the activity had not cost for the students. The students programmed the drones in a team platform and under the guidance of instructors to develop disciplinary competencies in engineering and transversal competencies, such as intellectual curiosity and collaborative work. The results indicated that using UAVs helped to enhance the students’ competencies and enabled them to learn new programming languages. For future studies, it may be necessary to further develop programming skills and incorporate vision systems to improve people’s quality of life in areas, such as building inspection, surveillance, and search and rescue operations in hazardous environments [23].

1.2. Educational Model

The advance in science and technology towards Industry 4.0 makes it necessary for students to develop competencies that allow them to perform correctly in these environments. In this sense, educational institutions are challenged to change paradigms and develop new learning environments [24]. Therefore, universities are increasingly developing new courses of action to respond to social demands, considering that it is not enough to know. However, students must also have the skills to apply them in solving significant real-world problems in their communities [22]. One of the paradigms used is competency-based education (CBE).
CBE implies that the roles of the teacher and the student differ from those of traditional educational models. This implies that universities must adjust their mission and vision to the new demands of society and evaluate how these competencies are achieved through rubrics and levels of mastery [25].
The learning process requires students to learn, perform the assigned tasks, and demonstrate specific skills. Throughout this process, they receive support from teachers through suggestions, comments, and prompts [26]. Receiving feedback from the teacher allows adjusting the student’s behavior to improve their performance, thereby identifying gaps between knowledge and desired competencies, as well as regulating their learning [27]. Through challenges related to real-life problems, students can have the opportunity to demonstrate their knowledge by applying it to existing problems in their environment.
ABR consists of an innovative pedagogy that encourages students to be motivated to solve problems in their environment. This pedagogy starts from experiential learning and incorporates technologies, teamwork, and problem-solving from the classroom to the community [28]. Designed challenges are the means to develop specific competencies and include activities, tasks, and situations that specify a deliberate effort to achieve mastery [29]. In addition, the challenge becomes a stimulus that gives the students a practical meaning to what they are learning [12]. In this sense, solving these challenges makes the educational experience more enriching than traditional classroom tasks.

2. Materials and Methods

This research aims to present a case study in which students used drones in an architecture course at a higher education institution in Mexico. This study followed the methodology employed by Portuguez-Castro and Gómez Zermeño [12], who analyzed the experiences of students and identified the achievement of competencies through the use of active learning methodologies, based on the evidence obtained in a course.

2.1. Participants

The sample consisted of 56 s-semester architecture, urban planning, and civil engineering students of the Tecnológico de Monterrey campus Querétaro. These students took the block “Modeling and Representation of your Campus with Topography,” which was segmented into three different groups (A, B, and C) and distributed as shown in Table 1.
In addition, the groups were made up of students from different majors as shown in Table 2.

2.2. Context

The main objective of the block “Modeling and graphic representation of your campus with topography” is to obtain information from different sources to organize, define and scientifically support topography modeling and graphic representation projects. This block takes as a practical case the university facilities to develop in the student the necessary competencies that allow him to extrapolate this knowledge in any professional project, especially in those that are developed in vulnerable areas where the access to information is complicated or null. This vision is aligned with the strategic plan of the institution in 2030, which has among its main objectives:
  • Promote infrastructure, spaces, and conditions that foster dignified community life and strengthen the interactions of its members.
  • Promote the sustainability and efficiency of cities using shared resources.
  • Integrate intelligence, research, innovation, and cultural centers that promote attractive and healthy cities.
  • To influence the transformation of governments and civil society based on public entrepreneurship and technological innovation [30].

2.2.1. Digital Transformation

Within the block, disciplinary and transversal competencies are defined. Among the transversal competencies is digital transformation. It seeks to make Tecnológico de Monterrey’s professional graduates’ users of cutting-edge digital technologies, capable of solving problems and optimizing the contributions of their professional field, with the awareness and responsibility that are living in the digital era implies.
Digitalization means abrupt changes in the world of employment, both in terms of the disappearance of millions of jobs and the creation of new jobs in different professional roles that are even impossible to visualize now. Digital transformation with the integration of new disruptive technologies, such as big data, cloud, and cybersecurity, all framed in smart cities, is bringing about the advent and deployment of the fourth industrial revolution.
The consideration of digital transformation as a transversal competence present in the student’s formative moments seeks to take them beyond being users to being builders of scenarios where the responsible and intelligent use of technology is encouraged. In terms of the fourth industrial revolution and the framework of the knowledge society, students must intentionally live in their professional preparation and experiences to capitalize on cutting-edge technologies and achieve real transformations of impact.
In this case, there is no difference because the methodology that was used with the students was the same that would be used for real purposes. The objective of this exercise was to teach students how they can use drone photogrammetry to obtain information in real time that helps them understand and analyze environments and buildings more efficiently for the development of projects.

Block Evidence

To successfully develop the competencies, the student must reliably represent by generating reports, plans, and three-dimensional modeling of shared space within the campus, applying basic sciences and general surveying tools.
The course includes concepts that complement the development of the activity, such as the supply of electricity and drinking water, general information about rainwater and wastewater, and the recycling and reuse of solid waste. Students are expected to provide practical solutions to exercises and problems, both individually and collaboratively, to develop the ability to graphically represent private and shared spaces with topography and develop a global and sustainable vision of the services they should have.
The course was five weeks, and it was carried out entirely face-to-face. As already mentioned, during the first week of classes, teams were formed in each group since the activities required collaborative work by the students. Each team freely chose a different campus area to develop the evidence delivered at the block’s end.

Evidence to Be Presented

Evidence A: Sketch of the current state of the campus.
1.
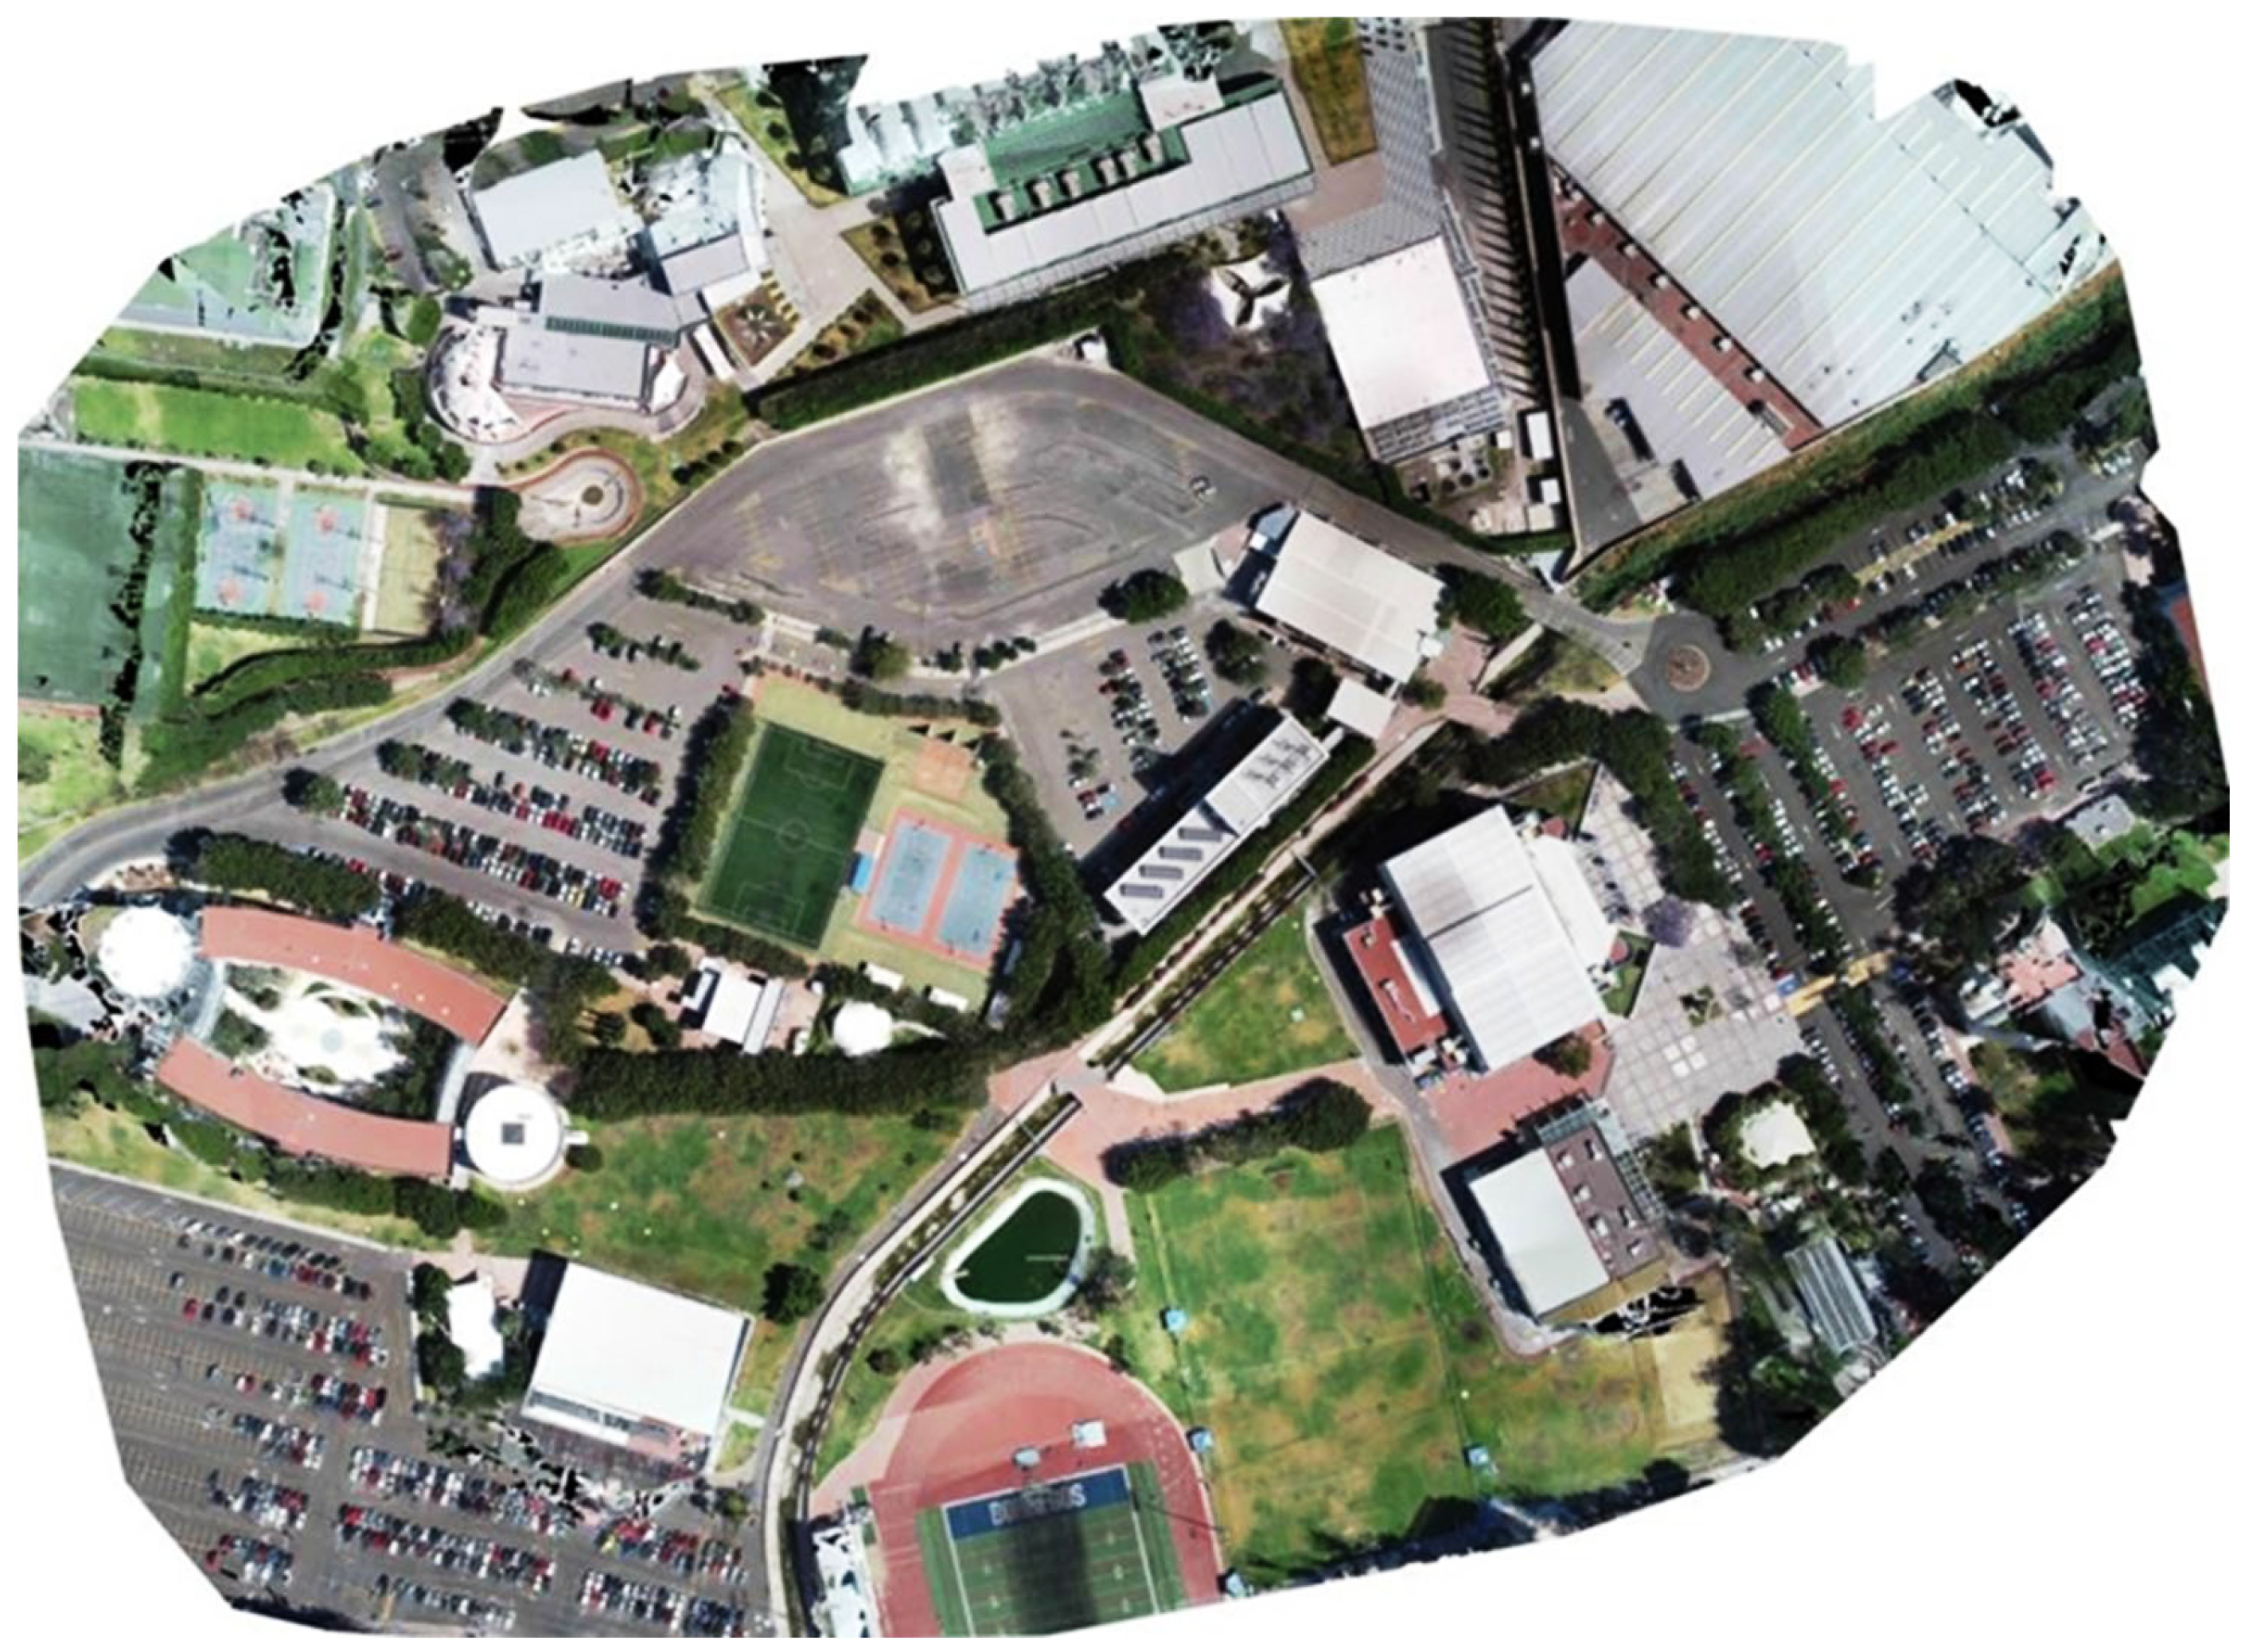
Perform a first reconnaissance of the chosen polygon of the campus. For this purpose, a specific topography drone will also be used to help generate an orthomosaic and a three-dimensional model to visualize the work area. Subsequently, a “preliminary sketch of the survey” will be made, where the area will be delimited according to what has been reviewed with the professor (buildings, surface, and subway infrastructure, parking lots, green areas, sports areas, cultural areas, and main roads within the campus).
2.
In the same way, the location in the sketch of:
  • Hydraulic installations (manholes, valve boxes)
  • Electrical installations (lamps, registers)
  • Sanitary installations (registers)
  • Street furniture
  • Trees
  • Gardens
  • Signage
  • Luminaires
3.
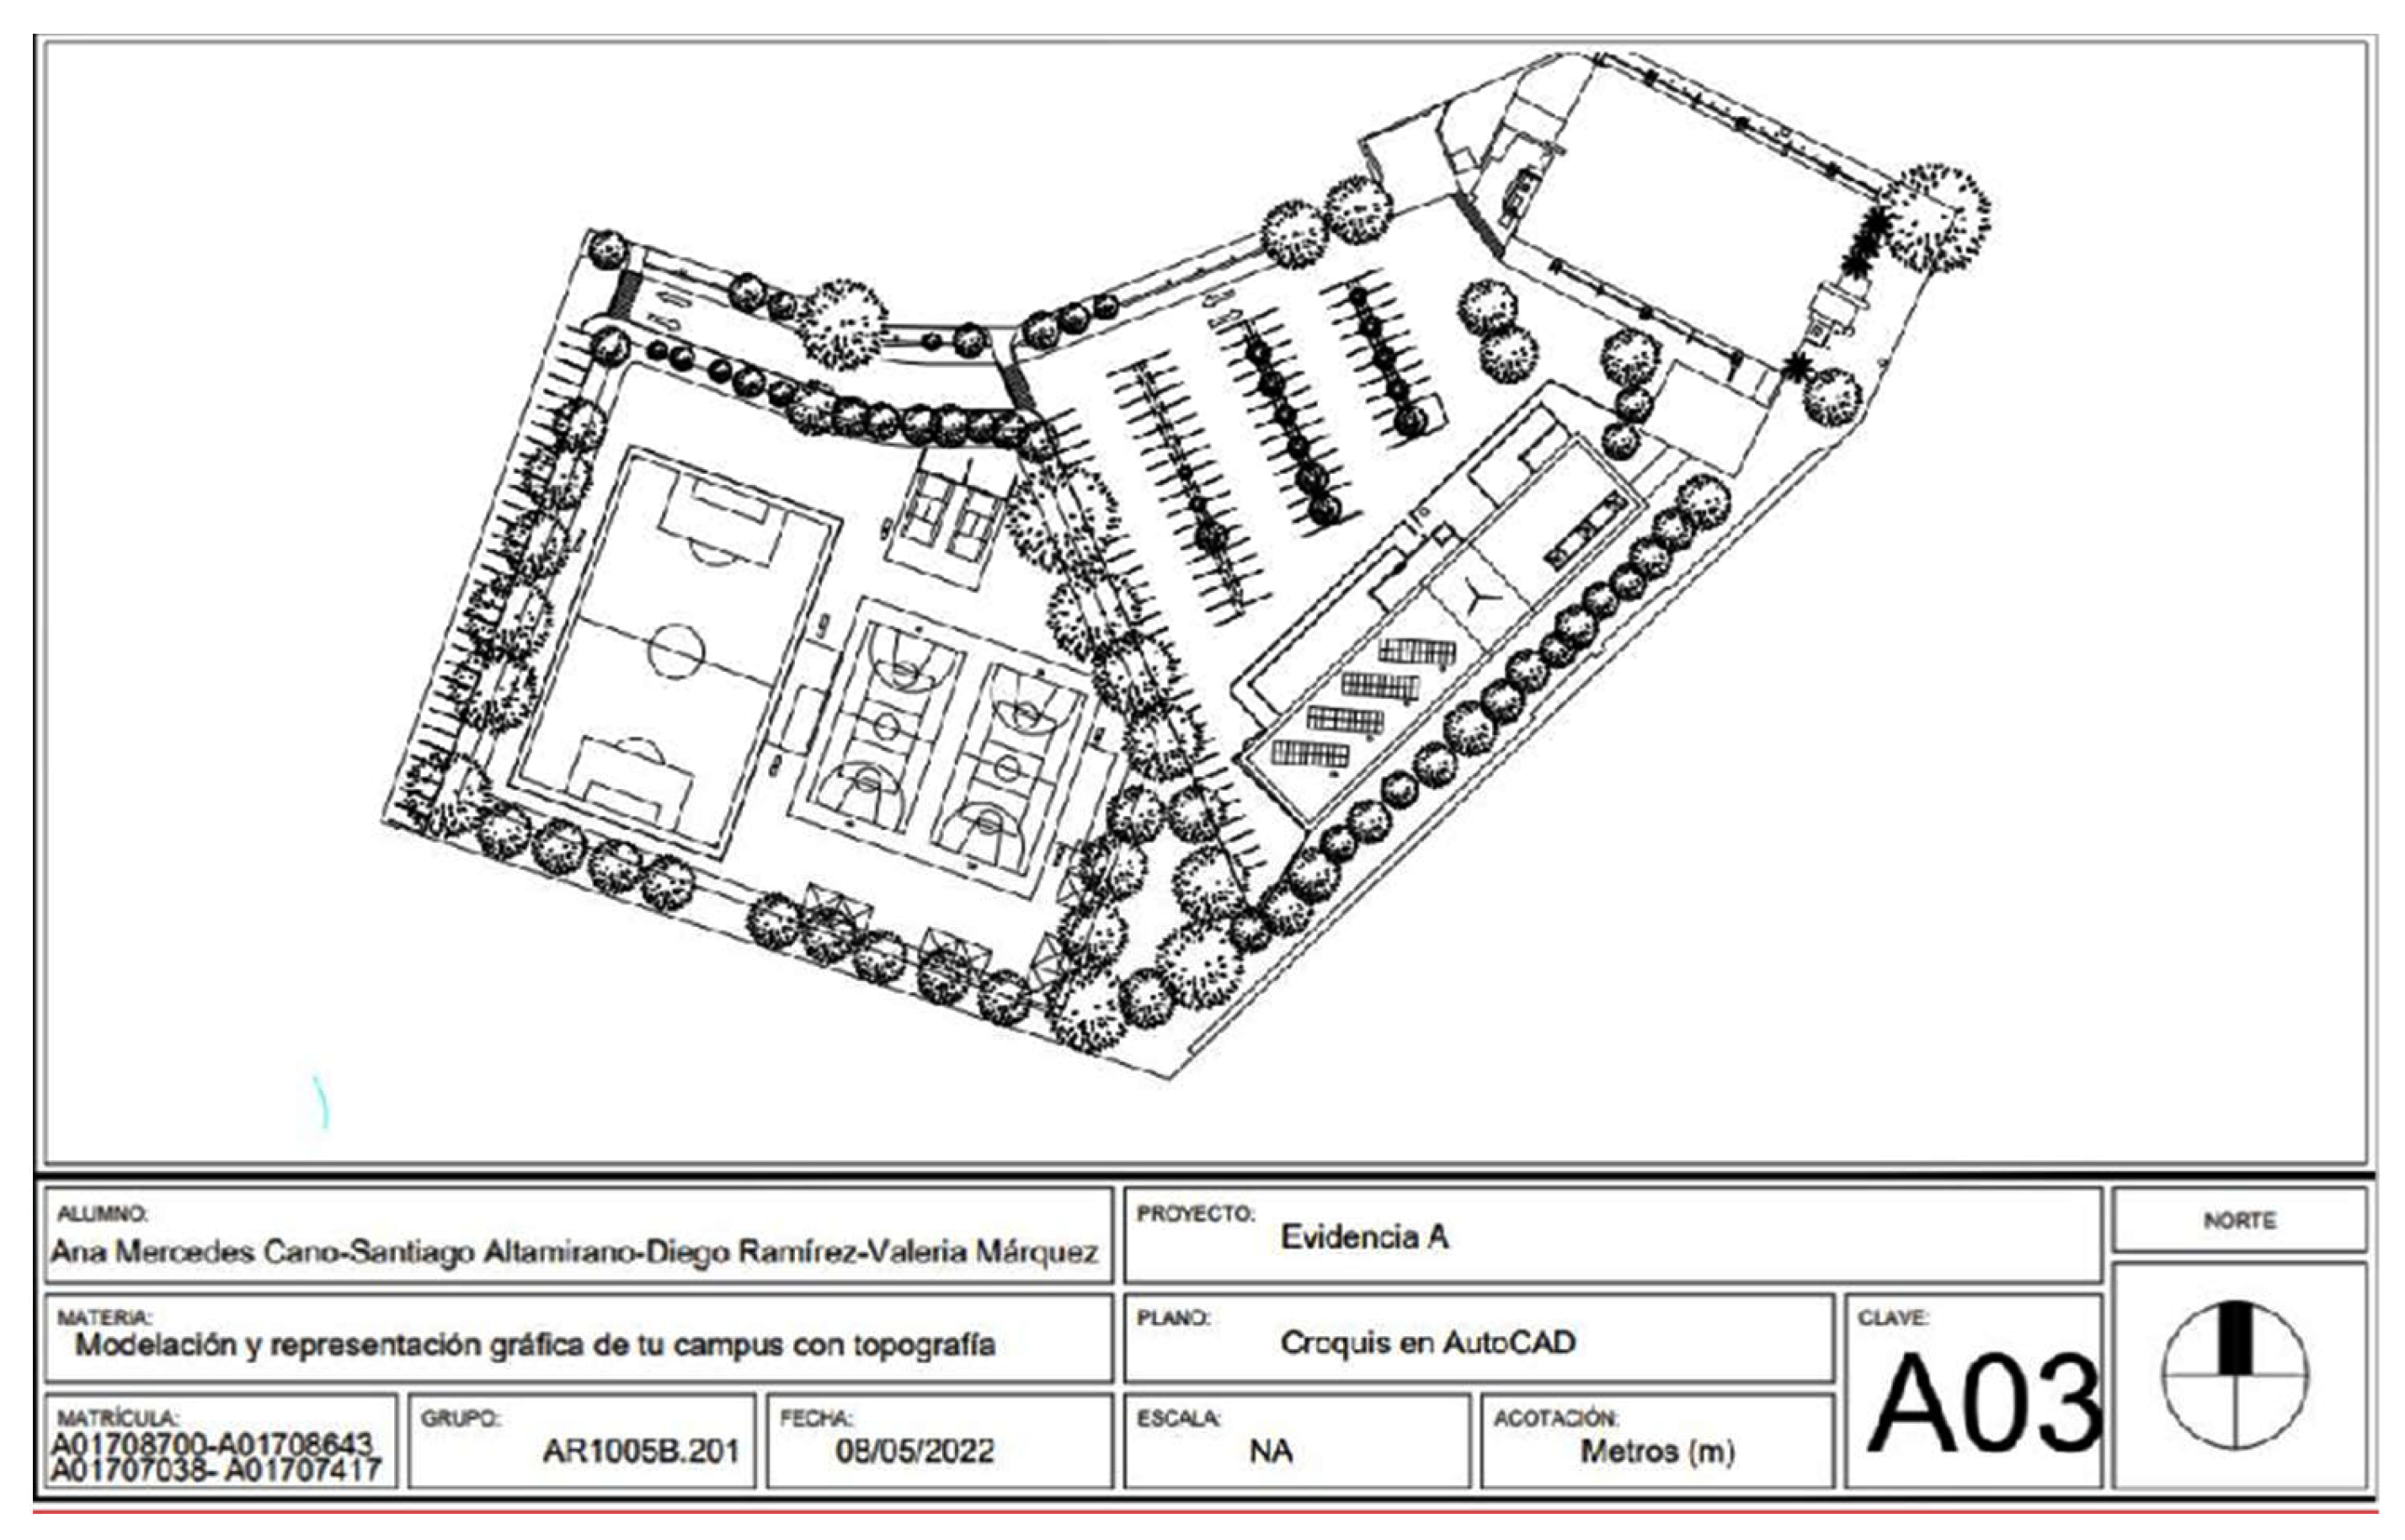
Finally, a descriptive memory of generating the sketch before the topographic survey is prepared individually. The sketch is the basis of the deliverable and represents all the identified infrastructure and its areas. It is important to use the correct colors and symbology. Symbology and annotations should be highlighted and placed on the right side of the deliverable, with a brief description of each symbol used.
Evidence B: Digital Representation of your Campus
Two-dimensional Model
1.
The information generated with the drone should be complemented with the topography equipment (total station, level), and the area of the chosen campus should be graphically represented using specialized drawing software (AUTOCAD and CivilCAD) the existing zones in the study area:
  • Buildings.
  • Parking lots.
  • Green areas.
  • Sports areas.
  • Cultural zones.
  • Main roads.
In this representation, care should be taken in using symbology according to the areas to be delimited, line quality, use of layers, and annotations where appropriate.
2.
Include the auxiliary polygon of the survey and its construction chart, which must contain:
  • Point number (which is also marked on the digital model).
  • Distance (including units in the header).
  • Azimuth (in sexagesimal degrees).
  • Coordinates North, East (indicating the cartographic projection used in the plan).
  • Elevation (in meters above mean sea level and including the vertical reference datum).
  • Vertex.
3.
Represent the hydraulic, electrical, telecommunications, and sanitary installations detected in the walkthrough of Evidence A, as well as the existing ones in the data provided by the teachers.
4.
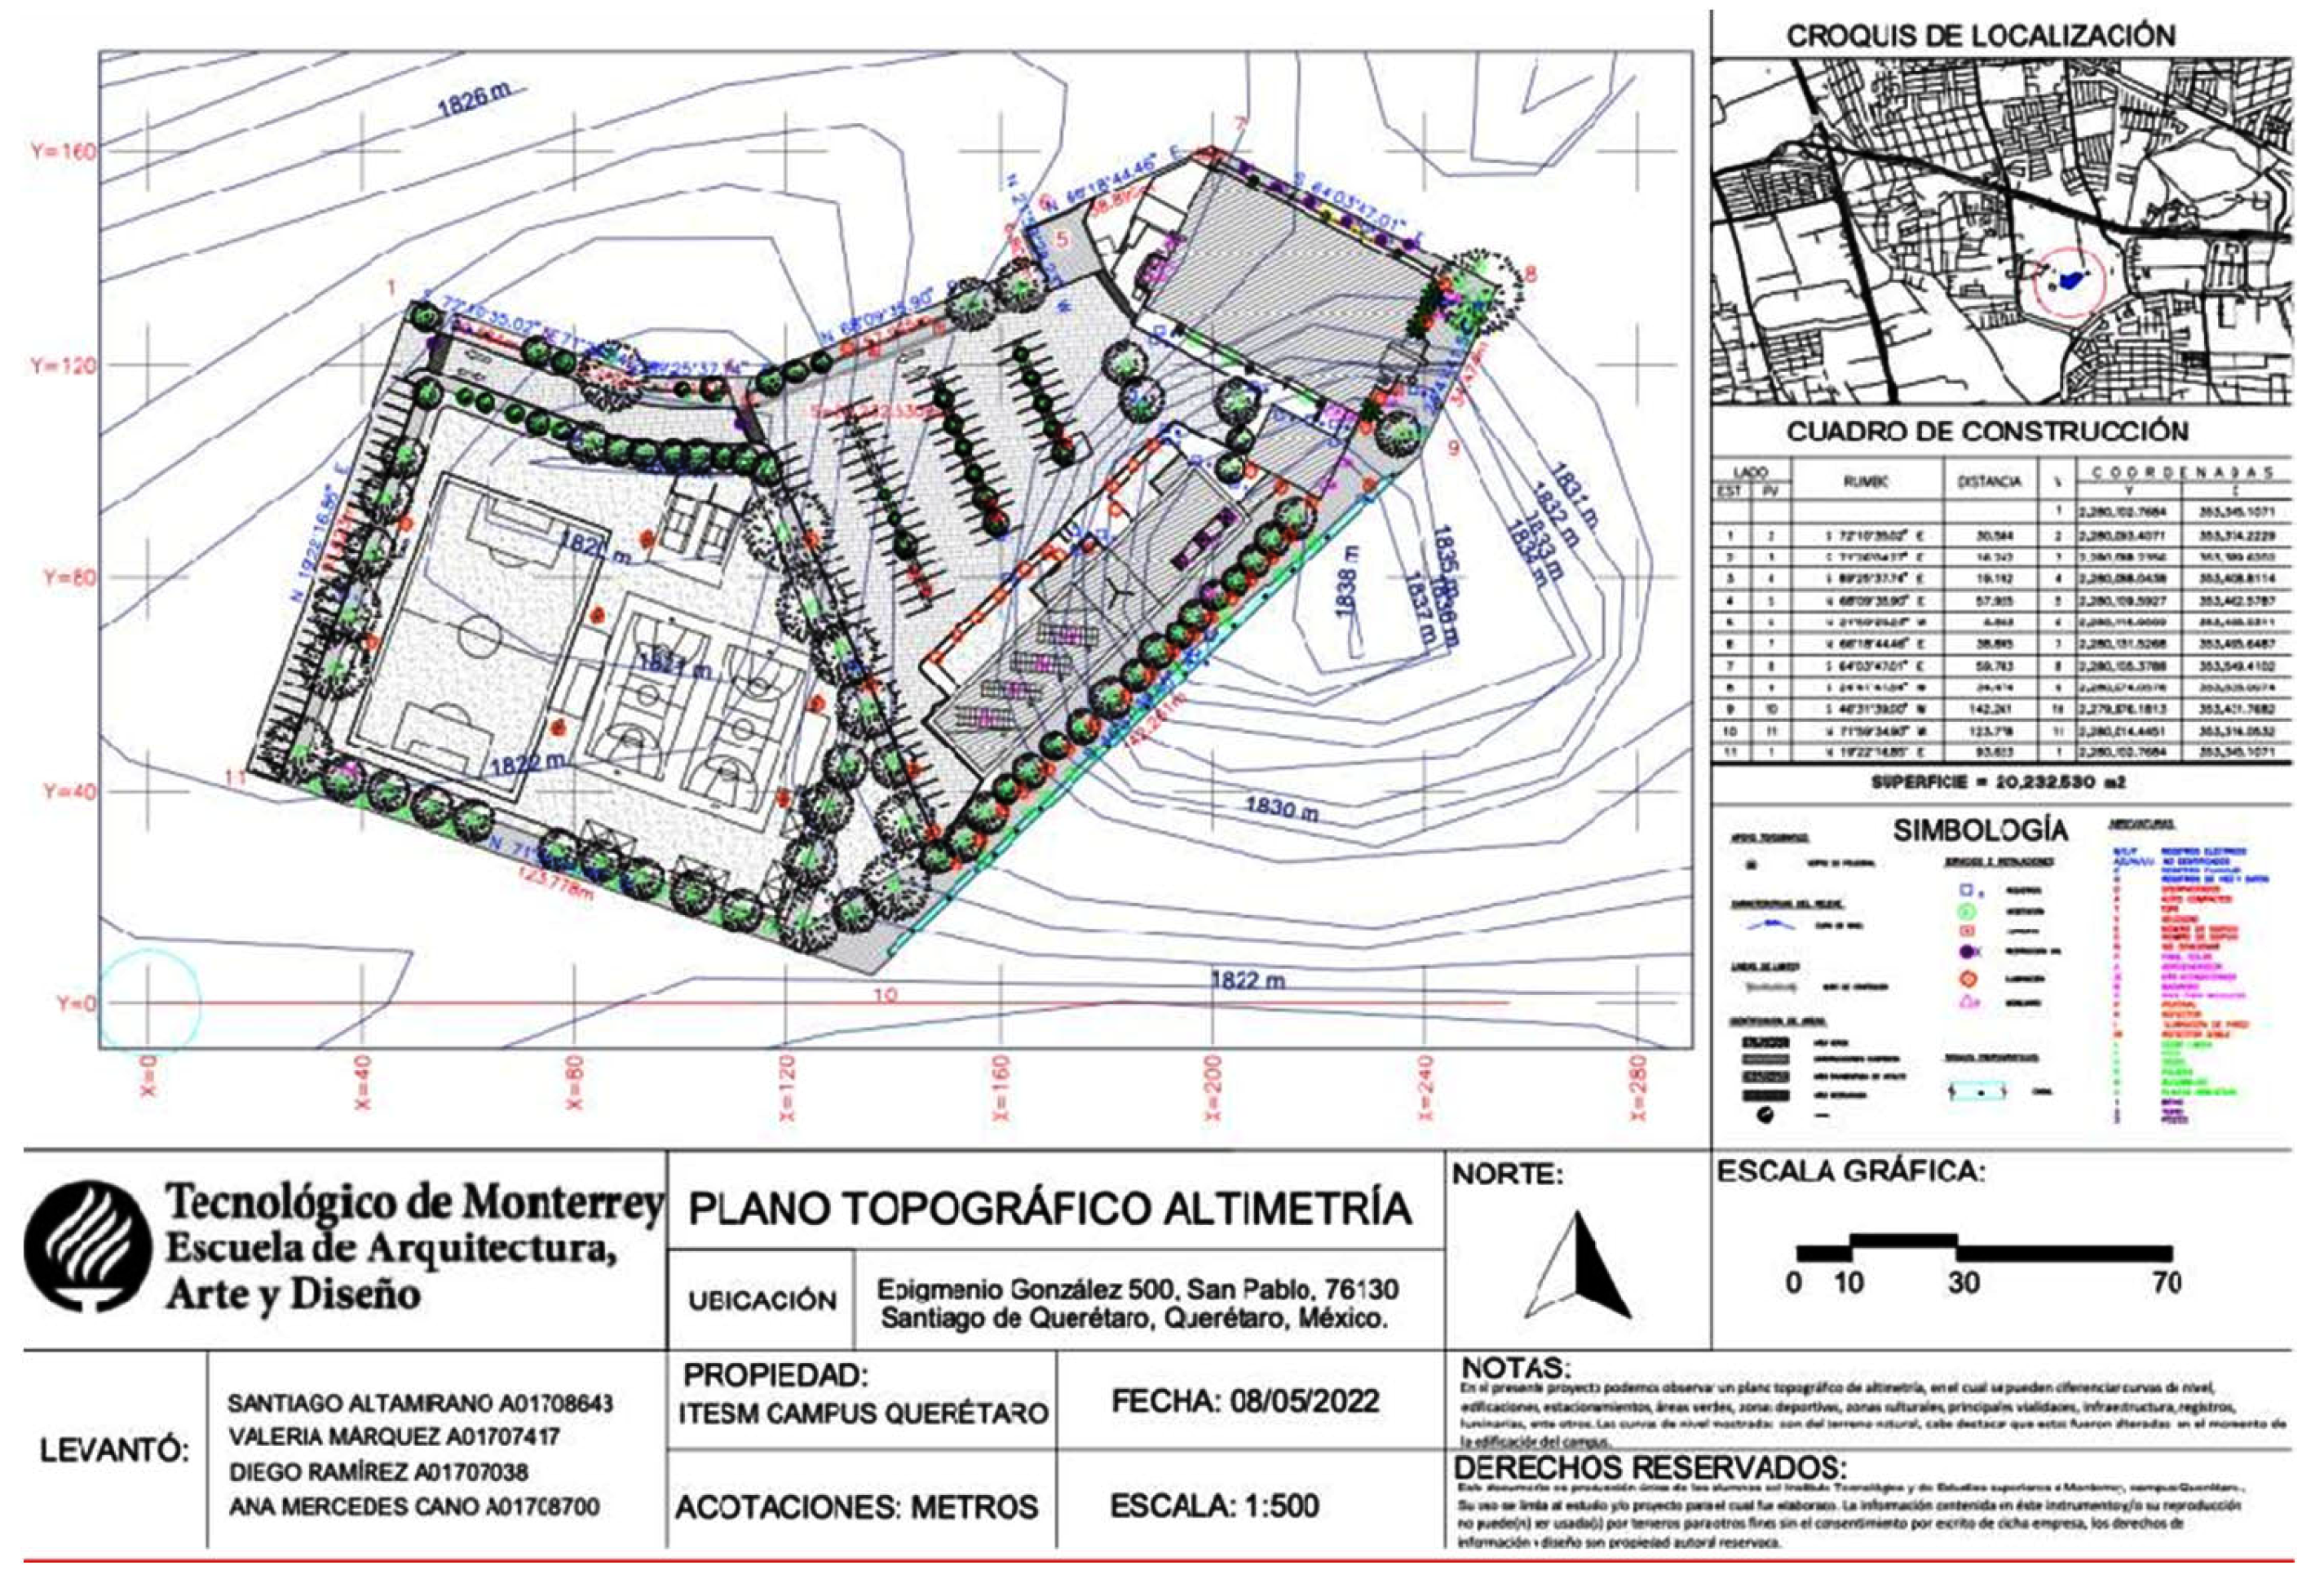
Generate a layout/presentation for printing of your graphic representation (delimitation of areas, auxiliary polygon, construction, and facilities table) with at least the following elements:
  • Graphical North (located at the top right of the layout).
  • Graphic scale.
  • UTM grid or according to the cartographic projection defined by the teachers.
  • Flap or marginal strip in accordance with the requirements of the municipality for the granting of construction permits that includes at least with:
  • Company logo (in this case Tecnológico de Monterrey).
  • Macro location (location of the polygon drawn to a scale showing the main avenues).
  • Location (location of the study area within the Campus).
  • Symbology and legend (a table with the symbols used in the plan and their legend should be included—brief description of the symbols).
  • Data table (location of the property, surface, owner, name of the plan, content, numerical scale, date, data of the person who made the survey, data of the person who made the drawing and plan number).
Three-dimensional Model
5.
Using specialized drawing software (Revit, Archicad, or Sketchup), you will generate a three- dimensional graphic representation of a two-dimensional model of your study area. This model should include the following:
  • Three-dimensional terrain.
  • Existing buildings.
  • Parking lots.
  • Green areas.
  • Sports areas.
  • Cultural zones.
  • Main roads.
6.
Generate the following views for printing:
  • Overall plan
  • Two perspectives showing different angles of your area of study.
  • North façade.
  • South façade.
  • East façade.
  • West façade.
  • Longitudinal cut.
  • Cross section.

2.2.2. Evaluation Criteria

The following is a table of evaluation criteria based on the levels of mastery corresponding to the competency of self-knowledge and management as a support to the teacher for the elaboration of their evaluation plan:
SEG0700 Digital transformation
Students generate solutions to the problems of their professional field with the intelligent and timely incorporation of cutting-edge digital technologies (Table 3).
SEG0701 Digital culture
Uses digital technologies through conscious strategies that generate value in the various spaces of professional and personal participation in the networked society.
Level A
Participate in today’s digital environment. For this, it lists the different communities in digital environments. Knows the scope of digital information and security in digital environments. Uses technology with a sense of respect.
SEG0702 Cutting-edge technologies
Evaluates diverse technologies with openness to the search for and implementation of relevant alternatives in the transformation of professional practice (Table 4).
Level A
Evaluates diverse technologies relevant to the transformation of their professional practice. Is aware of the concepts related to emerging technologies. Is a user of different computer systems related to their profession? Are they aware of the importance of digital transformation? They apply algorithmic reasoning to real model situations related to their professional activity.

3. Results

To develop the evidence just mentioned, the activities in Table 5 were carried out.

Field Data Acquisition

A DJI Phantom 4 RTK that has an accompanying DJI D-RTK 2 Mobile Station base station was used in this research. The D-RTK 2 Mobile Station is an enhanced GNSS receiver from DJI that is compatible with all major satellite navigation systems, providing real-time differential corrections that generate centimeter-accurate positioning information for improved relative accuracy.
The UAV flew over the study area of each zone within approximately 1 to 2 h in favorable weather conditions, without much sun or strong winds. Flights were generally conducted daily at 11 am, and no checkpoints were used. The Phantom 4 RTK UAV remote control contains a built-in electronic display programmed with custom DJI software to plan and execute UAV flights. For this study, flights were planned to result in photographs of sufficient quality to allow us to obtain a two-dimensional orthomosaic and a three-dimensional textured mesh (See Figure 1). Therefore, the type of scheduled flight operation chosen was three-dimensional photogrammetry (multi-oriented), which after planning the area of operation, generates flight paths that will include a single orthographic flight path and four oblique flight paths.
Example Building 14:
  • Equipment
  • Drone: Phantom 4 RTK Mobile Station: D-RTK 2
  • Setting
  • Operation Type: Three-dimensional Photogrammetry (Multi-oriented) Location: Querétaro, Mexico
  • Mapping Area 24,408 m2 Estimated Flight Time: 33 m 21 s Photos: 638
  • Survey Design
  • Flight height (m): 60 (GSD 1.64 cm/pixel) Speed (m/s): 4.5 (Max Speed: 4.5)
  • Oblique Altitude (m): 100 (GSD 2.74 cm/pixel) Oblique Speed (m/s): 7.4 (Max Speed: 7.9)
  • Horizontal Overlapping Rate (%): 70 Vertical Overlapping Rate (%): 80 Oblique Side Overlap Rate (%): 70 Oblique Frontal Overlap Rate (%): 80
  • Photogrammetric Processing Software: Pix4Dmapper version 4.6.4
  • Quality Report
  • Summary
    Project: Building 14:
  • Processed: 31 March 2022
  • Camera Model Name(s): FC6310R_8.8_5472 × 3648 (RGB) Time for Initial Processing (without report): 02 h:16 m:24 s
  • Quality Check
  • Images: median of 41,836 keypoints per image
  • Dataset: 743 out of 743 images calibrated (100%), all images enabled
  • Camera Optimization: 0.59% relative difference between initial and optimized internal camera parameters.
  • Matching: median of 8605.28 matches per calibrated image Georeferencing: yes, no 3D GCP
  • Calibration Details
  • Number of Calibrated Images: 743 out of 743 Number of Geolocated Images 743 out of 743
Evidence A
Digital Sketch
As part of Evidence A, each team made a detailed analysis of the chosen area to familiarize themselves with the environment and identify its main components. Subsequently, they drew a freehand sketch with mixed drawing techniques, such as watercolors, markers, and colors. They captured their interpretation of the site and located its main elements, such as installation records, furniture, signage, and vegetation.
Afterward, the orthomosaic image generated with the drone was used as a reference to make a second digital sketch, this time elaborated with the Autocad program, where accurate measurements were included to obtain a much more precise and professional result as shown in Figure 2.
Evidence B
Two-dimensional Model
For evidence B, different tools were used. The Total Station allows simultaneous planimetry (horizontal control) and altimetry (vertical control) using a laser and a prism. It has the advantage of obtaining the results in coordinates, and this data can be downloaded to the computer using a USB memory stick. The equipment has an integrated microprocessor that will not let the corresponding reading in case of any leveling or alignment error. It is mainly used for roads, railroads, streets, and subdivisions.
Another of the tools used in this activity was the Optical Level (self-leveling or tilting), which allows for obtaining the different slopes in the study area. It is mainly used in sewers, platforms in industrial buildings, and street paving.
The surveying work was divided into two stages:
  • Fieldwork: where the different points of interest to be surveyed are located.
  • Cabinet work: where the data are ordered and downloaded for their calculation and interpretation to represent them through a two-dimensional drawing finally.
As a result, tables or field records were also obtained, also known as leveling records or coordinate tables, depending on the data they contain as seen in Figure 3.
Contour lines were added with Global Mapper, a geographic information system (GIS) application for spatial data management, where polygons that had previously been plotted in Google Earth were imported. Subsequently, we worked in ArchiCAD to convert these curves into nodes that were placed in a mesh to edit their height. The next step involved importing the contour lines into AutoCAD to georeference the plan. Using an extension for this software called CivilCAD, the construction table for each study zone was obtained. Finally, the symbology and all the flap data were added.
Three-dimensional Model
To elaborate the three-dimensional modeling of the projects, the information generated with the drone and the photogrammetry software (orthomosaic, three-dimensional textured mesh) (Figure 4), as well as the contour lines obtained with Global Mapper, were used as references. Each team was free to choose the software of their preference to perform this exercise. Some of the most used programs were Revit, ArchiCAD, and Sketchup (Figure 5).
In accordance with the above, the results derived from the evaluation rubrics that were developed with the intention of obtaining a numerical score corresponding to the development of the competencies are presented below.
Note: the rubric for the two competencies is mentioned in a general way, since there is no evaluation rubric for evidence A.
An amount of 5% of the total grade of the block was assigned to the students who delivered entirely the files corresponding to each one of the types of evidence, such as AutoCAD plan and in PDF format, three-dimensional modeling file (Archicad, Sketchup or Revit) and in PDF format, and descriptive memory. Another 5% of the qualification was assigned to deliver the duplicate files in the E-lumen platform (Table 6).
It can be deduced that, although this activity only consisted of uploading digital files to two platforms, not all students did it or did not do it thoroughly. Group C, which had an afternoon schedule from 4:00 pm to 8:00 pm, had the lowest performance, while group A, which had a morning schedule from 9:00 am to 1:00 pm, had a better performance.
Evidence B—Two-dimensional Model
This part details the grades obtained by the group for the two-dimensional modeling part, which had a percentage of 30% of the final grade (Table 7).
It is also observed that group C had lower performance, highlighting the quality of the line, the auxiliary polygon of the survey, and the information related to the foot of the plan as the factors that require more significant development by the students.
Evidence B—Three-dimensional Model
This section of the rubric breaks down the other 30% of the grade obtained as part of the three-dimensional modeling, where the most important factors considered refer to the architectural object’s graphic representation and views (Table 8).
Group B, with afternoon hours from 3:00 to 7:00 pm, had a much lower performance than the rest of the groups, where they obtained a failing score in points, such as the graphic representation of the terrain and the plan and façade views.
Descriptive Memory
The last 30% of the evaluation rubric consisted of the descriptive report, where the presentation, content, and writing were considered (Table 9).
The most significant area of opportunity in this item is the document’s content, with group C obtaining the lowest score.

4. Discussion

This study was born to explore how aerial photogrammetry can be implemented in architecture, urban planning, and civil engineering courses. It is necessary to obtain information on sites of interest in real-time and then process and analyze the information in detail. So, we can say that the main findings were the following:
Students show great interest and are motivated to learn new technologies. That facilitates collecting data in real-time of areas and buildings to perform a much more detailed analysis that allows them to understand the architectural space where they can develop any project according to their discipline. This coincides with other research in which the use of drones in education has increased student motivation and critical thinking and problem-solving skills [15,16].
Although data collection times with the drone are relatively short compared to traditional processes, such as those obtained with the “total station,” processing the information requires suitable hardware for the results to be optimal in time and quality. Suppose it is desired to obtain precise and detailed information on specific areas, such as levels and heights. In that case, it is necessary to complement the aerial photogrammetry processes with other traditional processes.
The orthomosaic and the textured mesh greatly help obtain a much more complete reading of the site, but above all, to obtain accurate and real-time information that the user can use. It is not available on other platforms, such as Google Earth or Google Maps. Such information then greatly facilitates the detailed graphic representation through two-dimensional plans and three-dimensional modeling necessary for the development of any architectural, urban planning, or infrastructure project [5,6].
According to the motivation survey that was carried out at the end of the exercise, the students commented the following: 87% indicated positively that they know the applications of drone photogrammetry in their discipline or area of study, while the rest commented that they were not sure.
On the other hand, 89% of the students surveyed said that they felt motivated to learn about photogrammetry with drones, and 85% believe that the use of photogrammetry with drones is important in their academic training process. In addition, 83% indicated that they would prefer to know more about the use and applications of drone photogrammetry.
Regarding the mastery of skills that students have regarding the use of this technology, only 11% of those surveyed indicated that it is excellent, while 52% commented that it is good, 30% that it is sufficient, and 7% that it is null. The confidence that students feel when using these technological means that, in their work, processes are good according to 67% of the participants. An amount of 30% said that their confidence is regular, and 3% commented that their confidence is bad.
This is an indicator that it is necessary to continue using this technology in future projects with the intention that students improve their mastery of skills and confidence in these technological processes.

5. Conclusions

The final evidence of the students shows the development of disciplinary and transversal competencies necessary for their academic training. Although the implementation time of this innovation (five weeks) could be relatively short, students in the first semester of their careers have a broad vision of the scope of the photogrammetry area. This can be reinforced if it were to be applied in more advanced courses where the development of projects and the collection of information is much more complex.
It should be noted that photogrammetry in general (aerial and terrestrial), together with other technologies such as AR and VR, present great opportunities to generate immersive experiences based on real environments with optimal quality.
Advantages of using area photogrammetry:
  • Speed and accuracy in data capture.
  • Greater detail and scope.
  • Generation of orthomosaics and three-dimensional textured meshes.
    Disadvantages of using area photogrammetry:
  • High investment costs.
  • Long processing times if the appropriate hardware is not available.
  • You cannnot map what you cannnot see in the photographs, which is a problem in heavily wooded areas.
  • Not suitable for moving or highly reflective objects such as rivers or bodies of water and buildings with large amounts of glass.
In order to improve the methodology presented in this study, it is proposed that students continue using these technological tools throughout their academic development so that they are able to become more familiar with this subject and can develop stronger skills that allow them to successfully apply all this knowledge in his professional life.
In addition to the continuous use of aerial photogrammetry, teacher training with this technology is proposed so that they are able to apply it in different situations and contexts with students, as well as so that it does not remain as an isolated exercise of a research project.
The purchase of adequate computer equipment will also help to develop projects with a better quality so that they can be used in exercises that involve immersive experiences and mixed realities.

Author Contributions

Conceptualization, J.R.; methodology, J.R. and M.P.-C.; software, J.R.; validation, J.R. and M.P.-C.; formal analysis, J.R.; investigation, J.R. and M.P.-C.; writing—original draft preparation, J.R. and M.P.-C.; writing—review and editing, J.R. and M.P.-C.; supervision, M.P.-C.; project administration, J.R.; funding acquisition, J.R. All authors have read and agreed to the published version of the manuscript.

Funding

The authors acknowledge the financial support of NOVUS (Grant number: N20-153), Institute for the Future of Education, Tecnologico de Monterrey, Mexico, in the production of this work. The authors would like to acknowledge the financial support of the Writing Lab, Institute for the Future of Education, Tecnologico de Monterrey, Mexico, in the production of this paper.

Data Availability Statement

No new data were created or analyzed in this study. Data sharing is not applicable to this article.

Acknowledgments

The authors acknowledge the support of Viviana Barquero, Rogelio Castañeda, Guadalupe Ledezma and Jocelyn Reyes in the realization and collaborative work of this project.

Conflicts of Interest

The authors declare no conflict of interest. The funders had no role in the design of the study; in the collection, analyses, or interpretation of data; in the writing of the manuscript; or in the decision to publish the results.

References

  1. Li, J.; Kacimi, R.; Liu, T.; Ma, X.; Dhaou, R. Non-Terrestrial Networks-Enabled Internet of Things: UAV-Centric Architectures, Applications, and Open Issues. Drones 2022, 6, 95. [Google Scholar] [CrossRef]
  2. Cavoukian, A. Privacy and Drones: Unmanned Aerial Vehicles; Information and Privacy Commissioner of Ontario: Toronto, ON, Canada, 2012. [Google Scholar]
  3. Fina, L.; Smith, D.S., Jr.; Carnahan, J.; Sevil, H.E. Entropy-Based Distributed Behavior Modeling for Multi-Agent UAVs. Drones 2022, 6, 164. [Google Scholar] [CrossRef]
  4. Nebel, S.; Beege, M.; Schneider, S.; Rey, G.D. A Review of Photogrammetry and Photorealistic 3D Models in Education from a Psychological Perspective. Front. Educ. 2020, 5, 144. [Google Scholar] [CrossRef]
  5. Küng, O.; Strecha, C.; Beyeler, A.; Zufferey, J.-C.; Floreano, D.; Fua, P.; Gervaix, F. The Accuracy of Automatic Photogrammetric Techniques on Ultra-Light Uav Imagery. Int. Arch. Photogramm. Remote Sens. Spat. Inf. Sci. 2011, 38, 125–130. [Google Scholar] [CrossRef] [Green Version]
  6. Makransky, G.; Terkildsen, T.S.; Mayer, R.E. Adding Immersive Virtual Reality to A Science Lab Simulation Causes More Presence but Less Learning. Learn. Instr. 2019, 60, 225–236. [Google Scholar] [CrossRef]
  7. Dede, C. Immersive interfaces for engagement and learning. Science 2009, 323, 66–69. [Google Scholar] [CrossRef] [Green Version]
  8. Leopold, C.; Mayer, R.E. An Imagination Effect in Learning from Scientific Text. J. Educ. Psychol. 2015, 107, 47–63. [Google Scholar] [CrossRef] [Green Version]
  9. Hassanalian, M.; Abdelkefi, A. Classifications, Applications, And Design Challenges of Drones: A Review. Prog. Aerosp. Sci. 2017, 91, 99–131. [Google Scholar] [CrossRef]
  10. Gallagher, K. The Sky’s the Limit with Drone-Assisted Mapping. The Simulyze Blog. 2016. Available online: https://www.simulyze.com/blog/drone-assisted-mapping-applications (accessed on 28 January 2023).
  11. Methakullachat, D.; Witchayangkoon, B. Coordinates comparison of Google® maps and orthophoto maps in Thailand. Int. Trans. J. Eng. Manag. Appl. Sci. Technol. 2019, 10, 1–8. Available online: https://tuengr.com/V10A/10A17O.pdf (accessed on 5 March 2023).
  12. Portuguez Castro, M.; Gómez Zermeño, M.G. Challenge Based Learning: Innovative Pedagogy for Sustainability through e-Learning in Higher Education. Sustainability 2020, 12, 4063. [Google Scholar] [CrossRef]
  13. Kim, K. User Preferences in Drone Design and Operation. Drones 2022, 6, 133. [Google Scholar] [CrossRef]
  14. Restas, A. Drone Applications for Supporting Disaster Management. World J. Eng. Technol. 2015, 3, 316–321. [Google Scholar] [CrossRef] [Green Version]
  15. Carnahan, C.; Crowley, K.; Hummel, L.; Sheehy, L. New Perspectives on Education: Drones in the Classroom. In Proceedings of Society for Information Technology & Teacher Education International Conference, Savannah, GA, USA, 21 March 2016. [Google Scholar]
  16. Sattar, F.; Tamatea, L.; Nawaz, M. Droning the Pedagogy: Future Prospect of Teaching and Learning. Int. J. Educ. Pedagog. Sci. 2017, 11, 1650–1655. [Google Scholar] [CrossRef]
  17. Bai, O.; Chu, H. Drones in Education: A Critical Review. Turk. J. Comput. Math. Educ. 2021, 12, 1722–1727. [Google Scholar] [CrossRef]
  18. Al-Tahir, R. Integrating UAV into Geomatics Curriculum. In Proceedings of the International Archives of the Photogrammetry, Remote Sensing and Spatial Information Sciences, Toronto, ON, Canada, 30 August–2 September 2015. [Google Scholar]
  19. Bolick, M.M.; Mikhailova, E.A.; Post, C.J. Teaching Innovation in STEM Education Using an Unmanned Aerial Vehicle (UAV). Educ. Sci. 2022, 12, 224. [Google Scholar] [CrossRef]
  20. King, L.G.; McKim, A.J.; Raven, M.R.; Pauley, C.M. New and Emerging Technologies: Teacher Needs, Adoption, Methods, And Student Engagement. J. Agric. Educ. 2019, 60, 277–290. [Google Scholar] [CrossRef]
  21. Cliffe, A.D. Evaluating the Introduction of Unmanned Aerial Vehicles for Teaching and Learning in Geoscience Fieldwork Education. J. Geogr. High. Educ. 2019, 43, 582–598. [Google Scholar] [CrossRef]
  22. Félix-Herrán, L.C.; Izaguirre-Espinosa, C.; Parra-Vega, V.; Sánchez-Orta, A.; Benitez, V.H.; Lozoya-Santos, J.D.-J. A Challenge-Based Learning Intensive Course for Competency Development in Undergraduate Engineering Students: Case Study on UAVs. Electronics 2022, 11, 1349. [Google Scholar] [CrossRef]
  23. Al-Kaff, A.; Martín, D.; García, F.; de la Escalera, A.; Armingol, J.M. Survey of Computer Vision Algorithms and Applications For Unmanned Aerial Vehicles. Expert Syst. Appl. 2018, 92, 447–463. [Google Scholar] [CrossRef]
  24. Portuguez-Castro, M.; Hernández-Méndez, R.V.; Peña-Ortega, L.O. Novus Projects: Innovative Ideas to Build New Opportunities upon Technology-Based Avenues in Higher Education. Educ. Sci. 2022, 12, 695. [Google Scholar] [CrossRef]
  25. Rodriguez, I.; Gallardo, K. Redesigning an Educational Technology Course under a Competency-Based Performance Assessment Model. Pedagogika 2017, 127, 186–204. [Google Scholar] [CrossRef] [Green Version]
  26. Wang, H.; Tlili, A.; Lehman, J.D.; Lu, H.; Huang, R. Investigating Feedback Implemented by Instructors to Support Online Competency-Based Learning (CBL): A Multiple Case Study. Int. J. Educ. Technol. High. Educ. 2021, 18, 5. [Google Scholar] [CrossRef]
  27. Chou, C.Y.; Zou, N.B. An Analysis of Internal and External Feedback in Self-Regulated Learning Activities Mediated By Self-Regulated Learning Tools And Open Learner Models. Int. J. Educ. Technol. High. Educ. 2020, 17, 55. [Google Scholar] [CrossRef]
  28. Yang, Z.; Zhoua, Y.; Chung, J.; Tang, Q.; Jiang, L.; Wong, K. Challenge Based Learning Nurtures Creative Thinking: An Evaluative Study. Nurse Educ. Today 2018, 71, 40–47. [Google Scholar] [CrossRef]
  29. Nichols, M.; Cator, K.; Torres, M. Challenge Based Learner User Guide; Digital Promise and The Challenge Institute: Redwood City, CA, USA, 2016. [Google Scholar]
  30. Rumbo al 2030. Tecnológico de Monterrey. Available online: https://player.flipsnack.com/?hash=QkRCOUY3RkY4RDYraGMzeWpjdDZyaA%3D%3D&p=1 (accessed on 28 January 2023).
Figure 1. Orthomosaic generated (own elaboration).
Drones 07 00187 g001
Figure 2. Digital sketch made in Autocad from the orthomosaic generated with the drone (own elaboration).
Drones 07 00187 g002
Figure 3. Topographic map with altimetry (own elaboration).
Drones 07 00187 g003
Figure 4. Three-dimensional textured mesh generated with photogrammetry (Own elaboration).
Drones 07 00187 g004
Figure 5. Render generated with ArchiCAD (own elaboration).
Drones 07 00187 g005
Table 1. Distribution of the groups (Own elaboration).
Group A Group B Group C
Men 10Men 10Men 11
Woman10Woman6Woman9
Total per group20Total per group16Total per group20
Work teams 7Work teams 5Work teams 8
Full Sample56
Men 31
Women25
Table 2. Participants’ careers (Own elaboration).
CareersN
Architecture34
Civil Engineering20
Urbanism2
Total56
Table 3. Table of evaluation criteria for the mastery level of transversal subcompetences of digital transformation (Own elaboration).
CriterionDescription of the CriterionPresents ItDoes Not Present ItFeedback
Participation in the digital environmentActively participate in technological communities taking advantage of its benefits academically.
Communities in digital environmentsDescribes the different communities in digital environments.
Scope of digital informationExplains the scope of digital information.
Technology valueValues the scope of digital technologies for his professional work and his personal life.
Attitude towards technologyUses digital technologies with respect
Table 4. Table of evaluation criteria for the mastery level of transversal subcompetences. Cutting edge technologies (Own elaboration).
CriterionDescription of the CriterionPresents ItDoes Not Present ItFeedback
Knowledge of technologiesLearn about various technologies relevant to their professional practice
Technology evaluationEvaluate the various technologies and select the pertinent one for the transformation or improvement of their professional practice.
Knowledge of the importance of digitizationShows awareness about the importance of digital transformation.
Algorithmic reasoningModels real situations linked to their professional activity through the use of algorithmic reasoning.
Table 5. Contents and activities of the course (own elaboration).
Learning Objectives Week ActivitiesAssessment
Describe concepts related to photogrammetry and drones from an architectural perspective, as well as their uses and applications.1Introduction to the course. Drone photogrammetry presentation.
Generate a research process to become familiar with a certain site or terrain.Site analysis.Create a document individually where the 36 points of the “Site Analysis” by TIFA are developed according to the chosen area of the campus.
Know the use and management of the Phantom 4 RTK drone to obtain information through a scheduled flight. Process the information obtained with the drone to generate a three-dimensional model and an orthomosaic photo with the Pix4D software.Scanning through a programmed flight with a drone (Phantom 4 RTK) of the area to be worked on. Information processing in Pix4D software.
Graphically represent the concepts used in the built environment for the topographic survey of a project, making use of the definitions investigated in the field.2Concept CatalogGenerate a document that lists all the components observed within the study area to describe and quantify them.
Develop the ability to identify the problems faced in different real scenarios (technical reports, news, articles, videos, etc.).Case AnalysisGenerate an initial debate by team to be able to make a group presentation where the selected case studies are exposed, their most important characteristics, as well as their final reflections on each case.
Learn to work with the different concepts of infrastructure and facilities that are used in the language of territorial representation in a professional environment.Topography Concepts
Become familiar with the general procedure for using various topographic equipment and its main measurement functions, which allow locating points on the Earth’s surface, obtaining their geographic coordinates, distances, directions, or elevations. Indispensable measurements both for the representation of the natural and built environment, as well as for the location of an architectural or infrastructure project and its control during the construction phase.3Total stationEvidence A
4Topographic level
Transfer the information obtained in the field to the computer equipment and its digital management for its graphic representation according to the standards of the profession.5Building Levels and FramesEvidence B
Two-dimensional and Three-dimensional Graphic Representation
Table 6. Average rating per group based on a weighting from 0 to 100 (Own elaboration).
Evaluation CriteriaGroup AGroup BGroup C
Delivery on Drive
5%
AutoCad1.0%10010095
Plan in PDF1.0%10010096
Archicad,
Sketchup or
Revit
1.0%100100100
Three-dimensional Model in PDF1.0%10010090
Descriptive Memory1.0%10010096
Delivery on ELUMEN
5%
AutoCad1.0%958190
Plan in PDF1.0%908886
Archicad,
Sketchup or
Revit
1.0%957385
Three-dimensional Model in PDF1.0%958885
Descriptive Memory1.0%959485
Total10.0%979291
Table 7. Average rating per group based on a weighting from 0 to 100. Two-dimensional model (own elaboration).
Evaluation CriteriaGroup AGroup BGroup C
2D Model
30%
Quality of the work delivered (presentation, order, readability).2.0%93.98788.95
Graphic representation
of:
- Buildings.
- Parking lots.
- Green areas.
- Sports areas.
- Cultural zones.
- Main roads.
5.0%10010096.25
Use of symbols.2.0%10010092
Line quality.2.0%94.4593.12586.7
Use of layers. 2.0%9910089.75
The auxiliary survey polygonal is included.1.0%9010080
Distances, bearings, vertex number and vertex in the auxiliary polygon of the survey are included.4.0%87.272.37575.5
Contains build box with:
- Point number.
- Distance.
- Azimuth.
- North, East coordinates.
- Elevation.
- Vertex.
4.0%10097.595
The hydraulic, electrical, telecommunications, and sanitary installations of the place are observed.3.0%10010092
The PDF file has a footer that includes the following aspects:
- Graphic north.
- Graphic and numerical scale.
- UTM grid.
- Tec de Monterrey logo.
- Macro location.
- Location of the study area within the campus.
- Symbology and legend.
- Property address.
- Surface.
- Owner.
- Plan name.
- Date.
- Data of who carried out the survey.
- Key and plan number.
- Table of notes.
- All rights reserved.
5.0%98.491.437589.4
Pleae Total 30.0%96%94%89%
Table 8. Average rating per group based on a weighting from 0 to 100. Three-dimensional model (own elaboration).
Evaluation CriteriaGroup AGroup BGroup C
3D
Model
30%
Quality of the work delivered (presentation, order, readability).3.0%95.636.562588.25
Graphic representation: Of the terrain.1.5%95.3552.2579
Graphic representation: Of the buildings.3.0%97.7588.62590
Graphic representation: From the context.1.5%95.385.588.75
Views: Overall plan.3.0%8155.62584.95
Views: Perspective 1.3.0%98.787.37591.75
Views: Perspective 2.3.0%98.787.37577.85
Views: Facade 1.3.0%98.756.87590.4
Views: Facade 2.3.0%98.756.87590.4
Views: Cut 1.3.0%90.589.37580.65
Views: Cut 2.3.0%90.589.37582.15
Total 30.0%94.671.485.8
Table 9. Average rating per group based on a weighting from 0 to 100. Descriptive memory (own elaboration).
Evaluation CriteriaGroup AGroup BGroup C
Descriptive Memory
30%
Quality of work delivered:
- Presentation.
- Front page.
- Design.
6%97.5596.5392.78
Contents:
- The file has the topics that were seen throughout the block, such as the use of the drone, the use of the total station, site analysis, software used, steps to generate the two-dimensional and three-dimensional models, conclusions, lessons learned, and references.
20%94.1887.5683.53
Spelling and writing.4%98.2397.5392.03
Total 30%96.6593.87589.44
Disclaimer/Publisher’s Note: The statements, opinions and data contained in all publications are solely those of the individual author(s) and contributor(s) and not of MDPI and/or the editor(s). MDPI and/or the editor(s) disclaim responsibility for any injury to people or property resulting from any ideas, methods, instructions or products referred to in the content.

