
A Computational Model for Simulating the Performance of UAS-Based Construction Safety Inspection through a System Approach

Abstract
:1. Introduction
2. Literature Review
2.1. Construction Safety Inspection
2.2. UAS for Construction Safety Inspection
2.3. System Dynamics for Construction
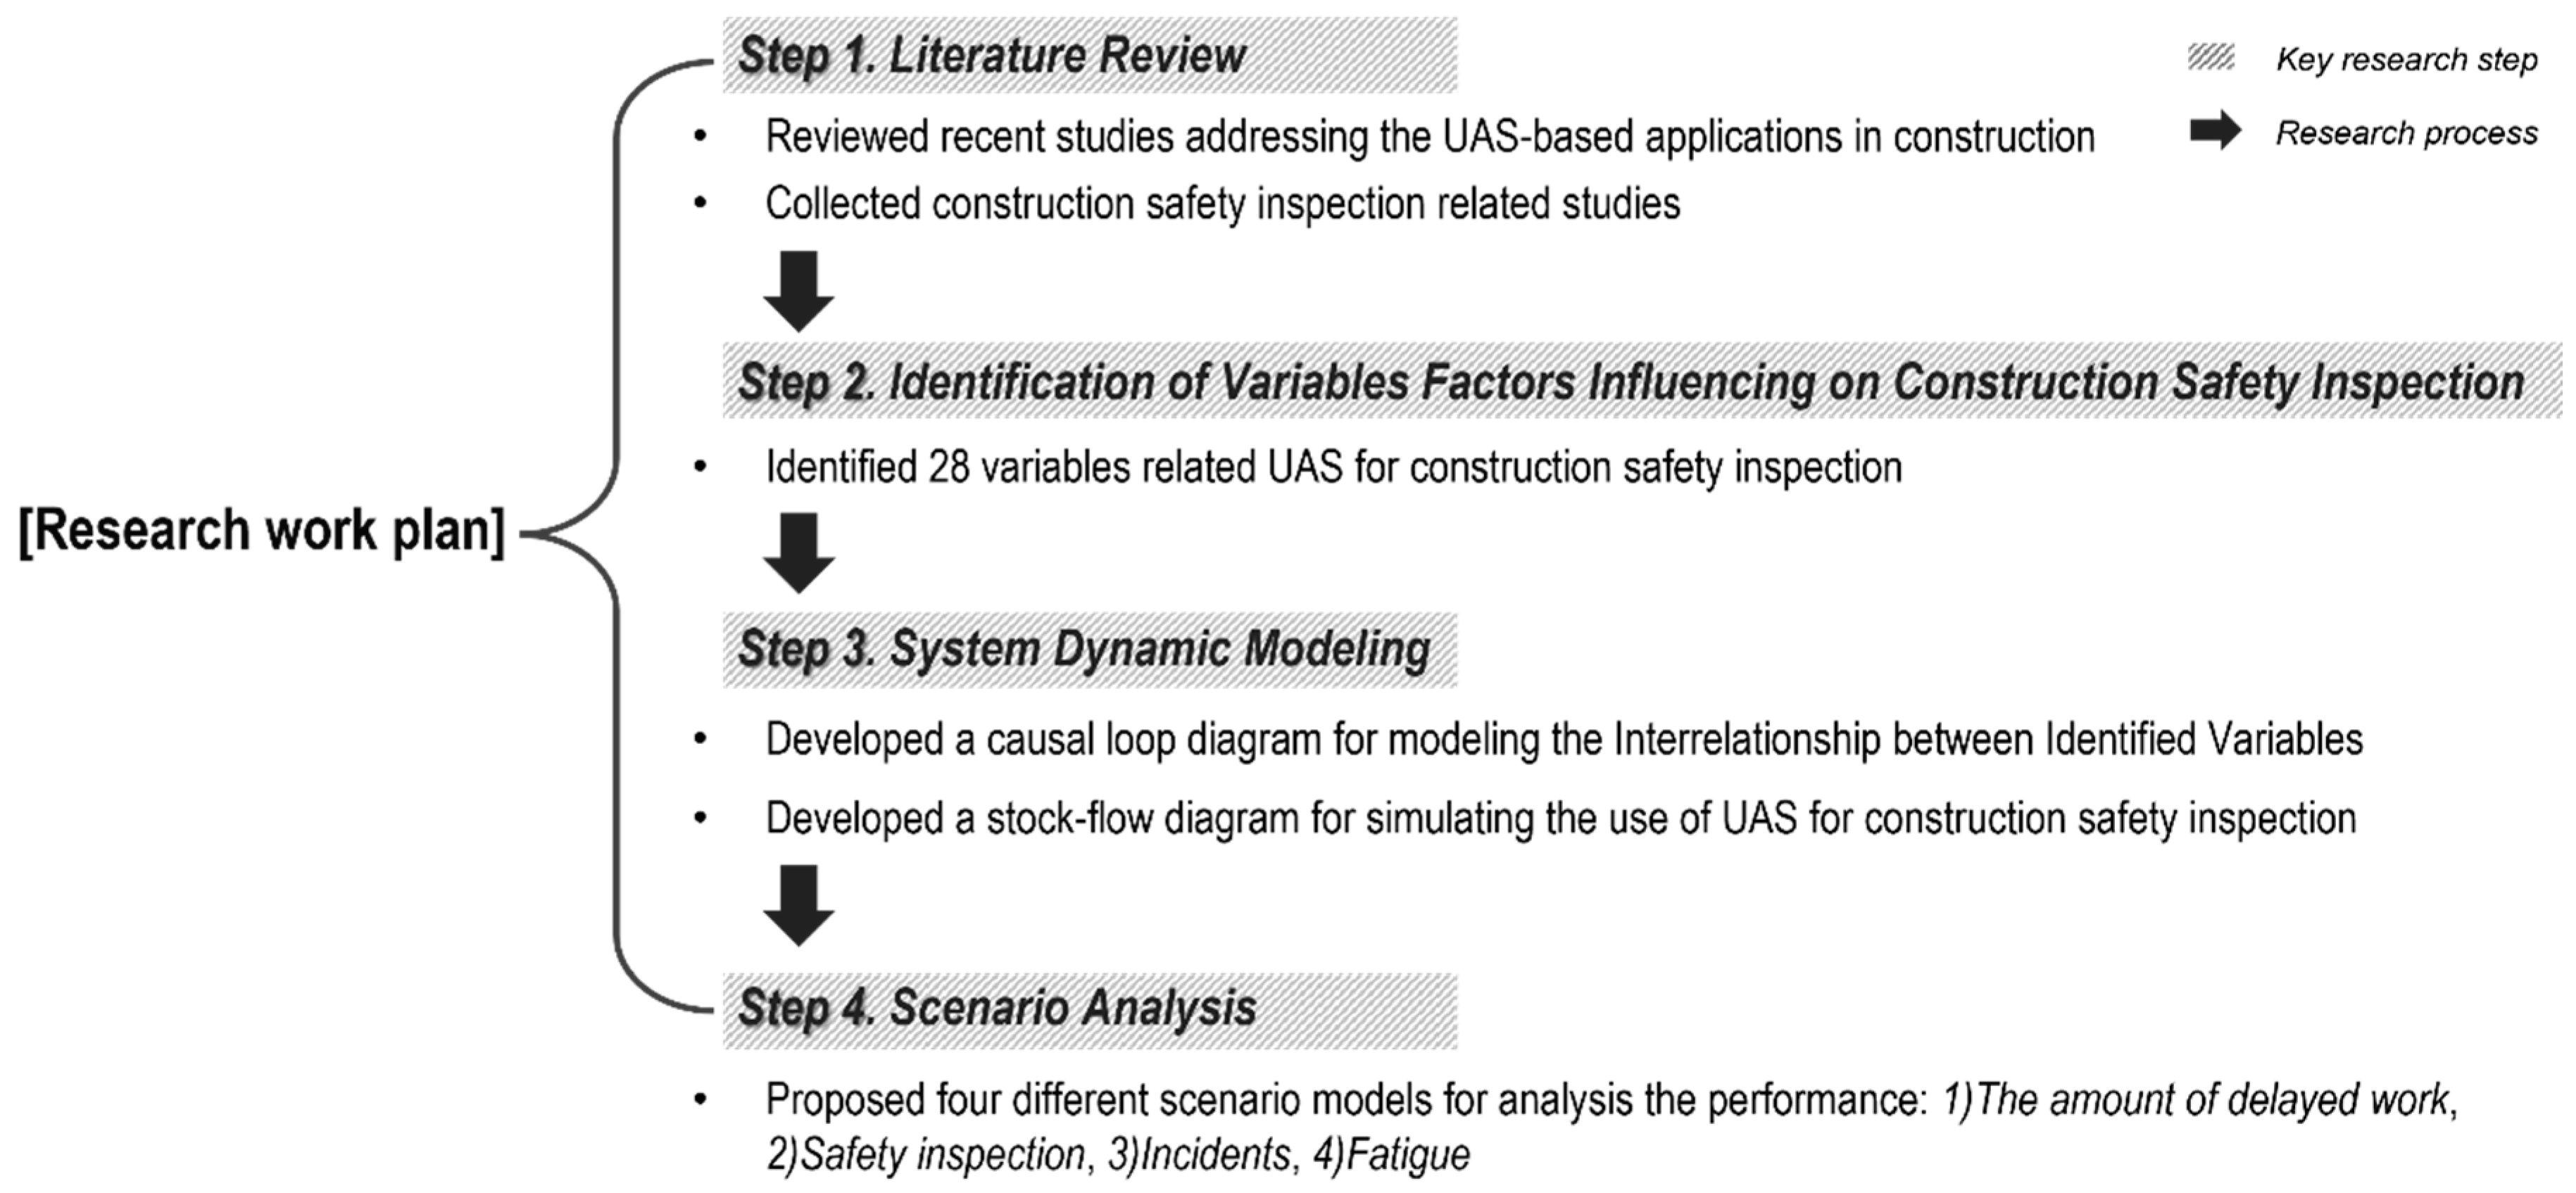
3. Research Methodology
4. System Dynamic Modeling
4.1. Identification of Model Variables
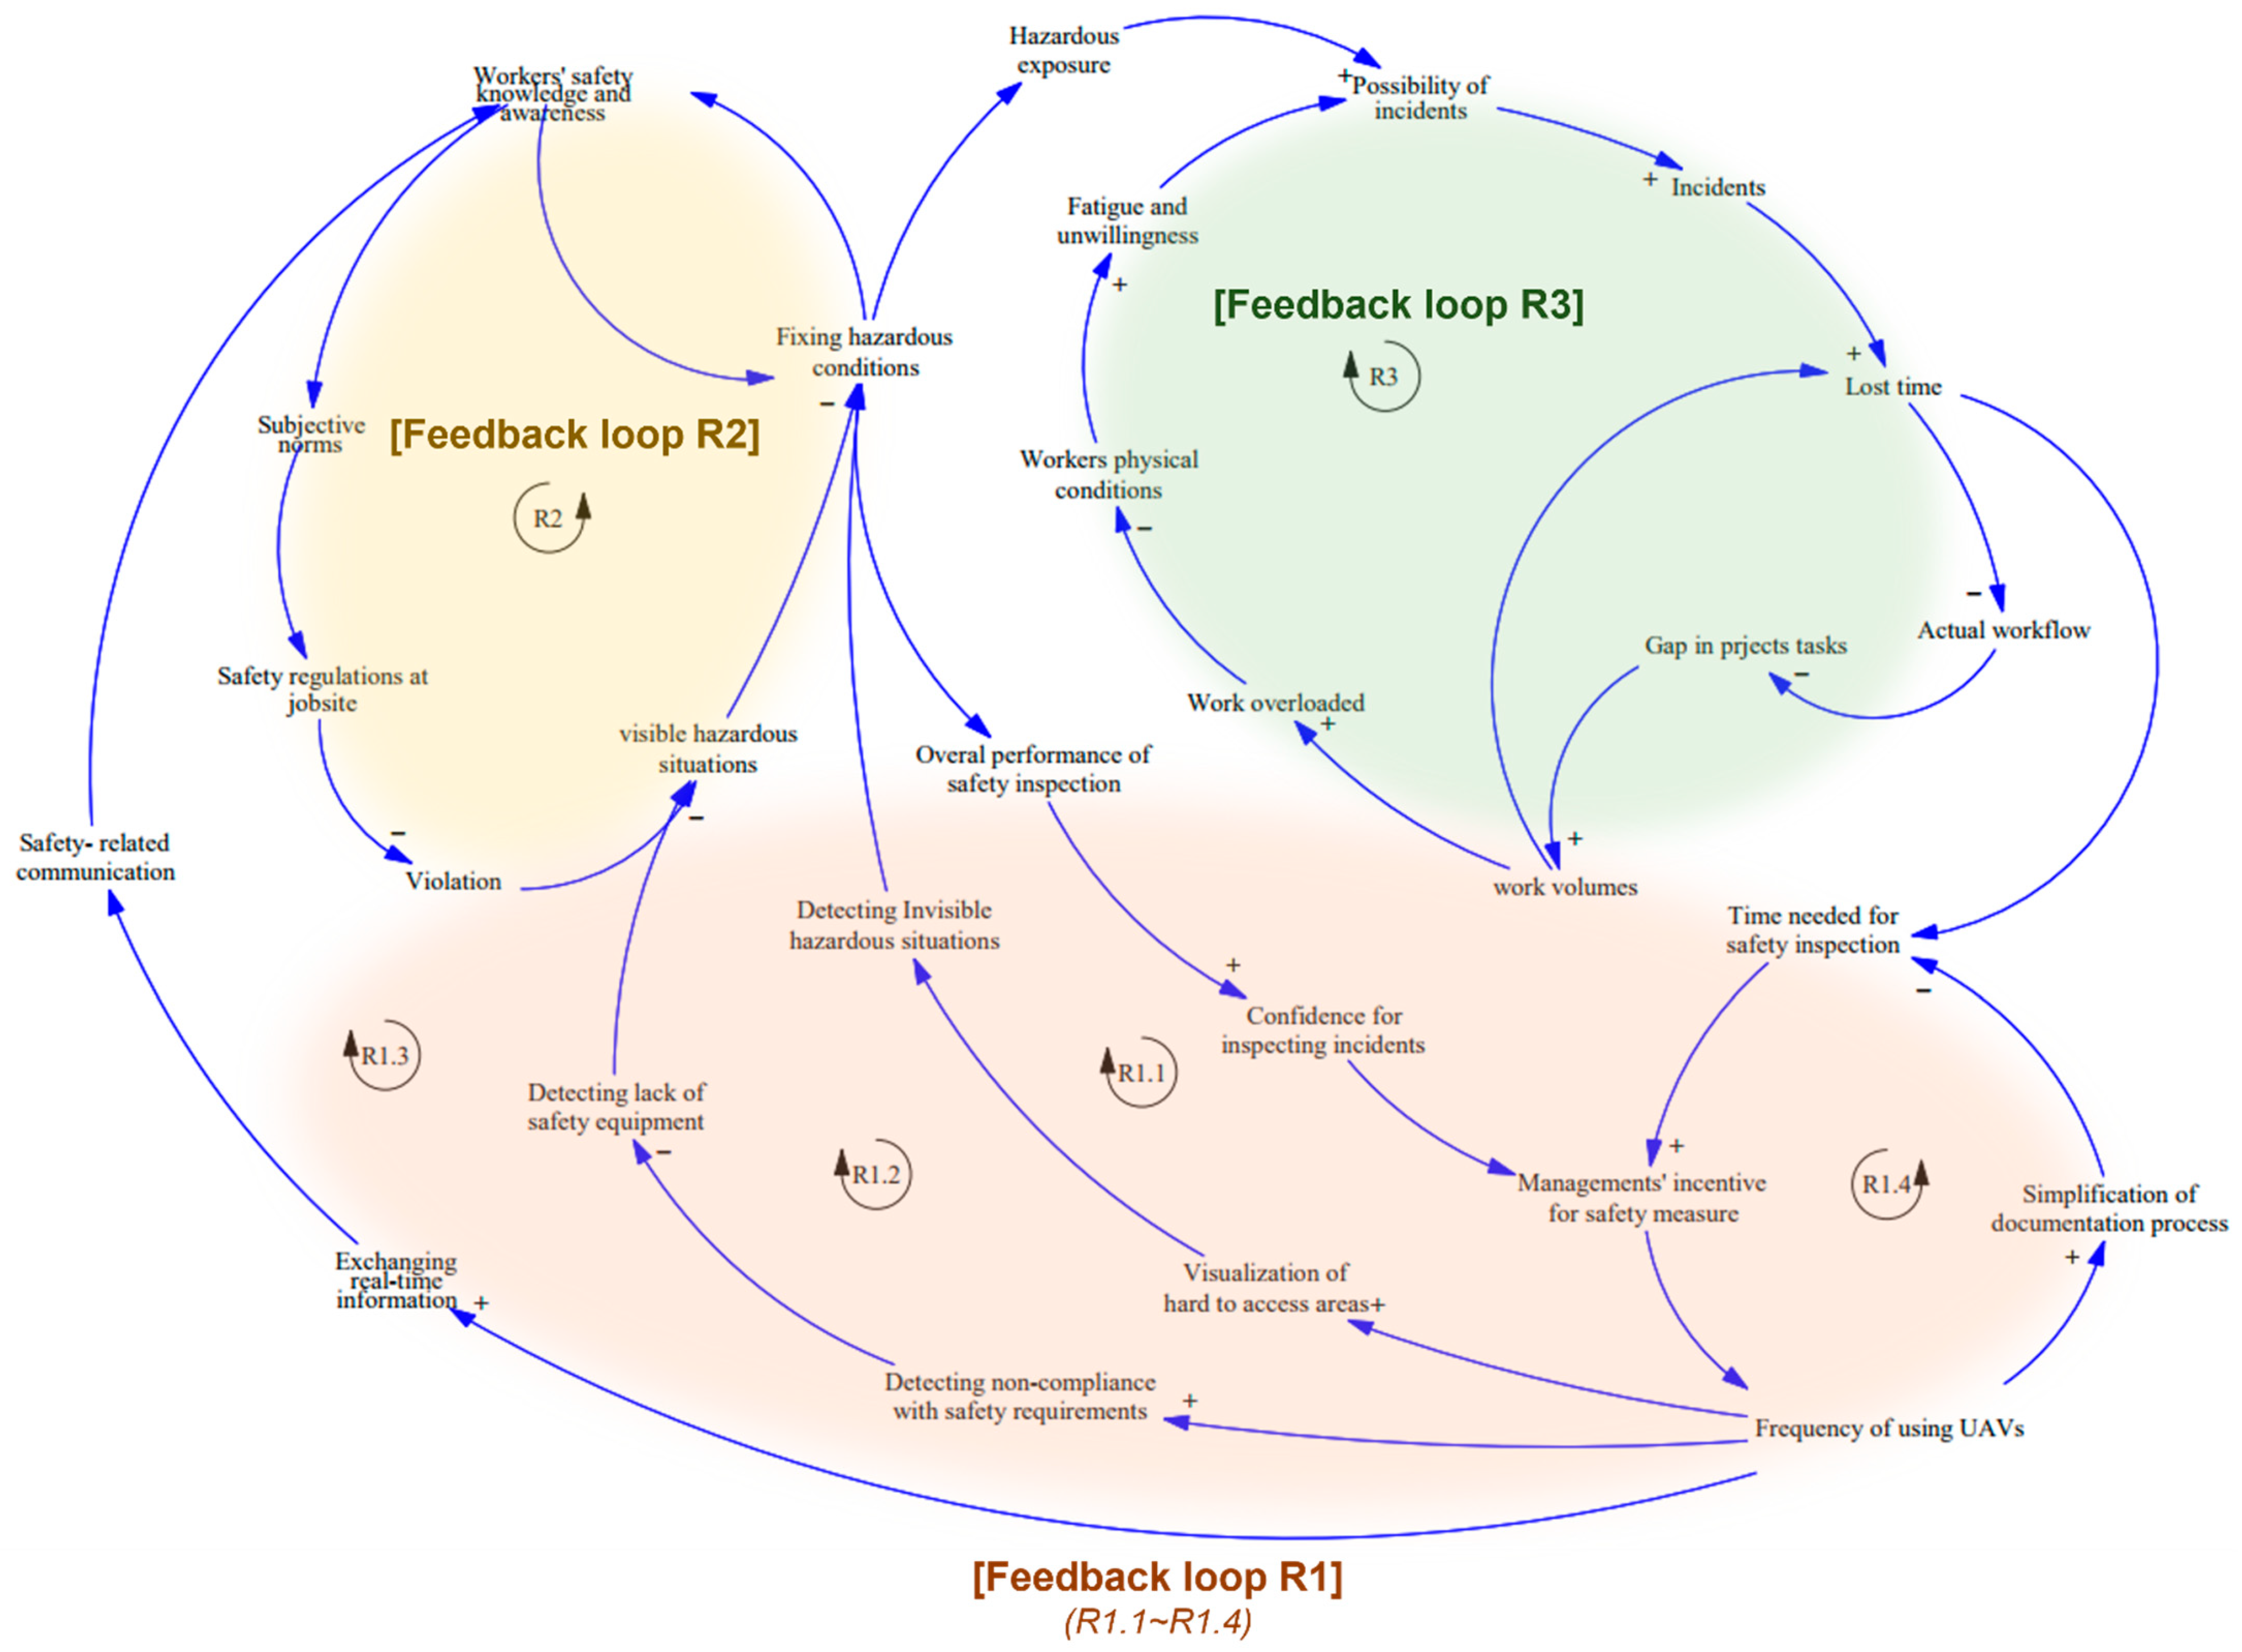
4.2. Causal Loop Diagram
4.3. Stock–Flow Diagram
4.4. Model Validation
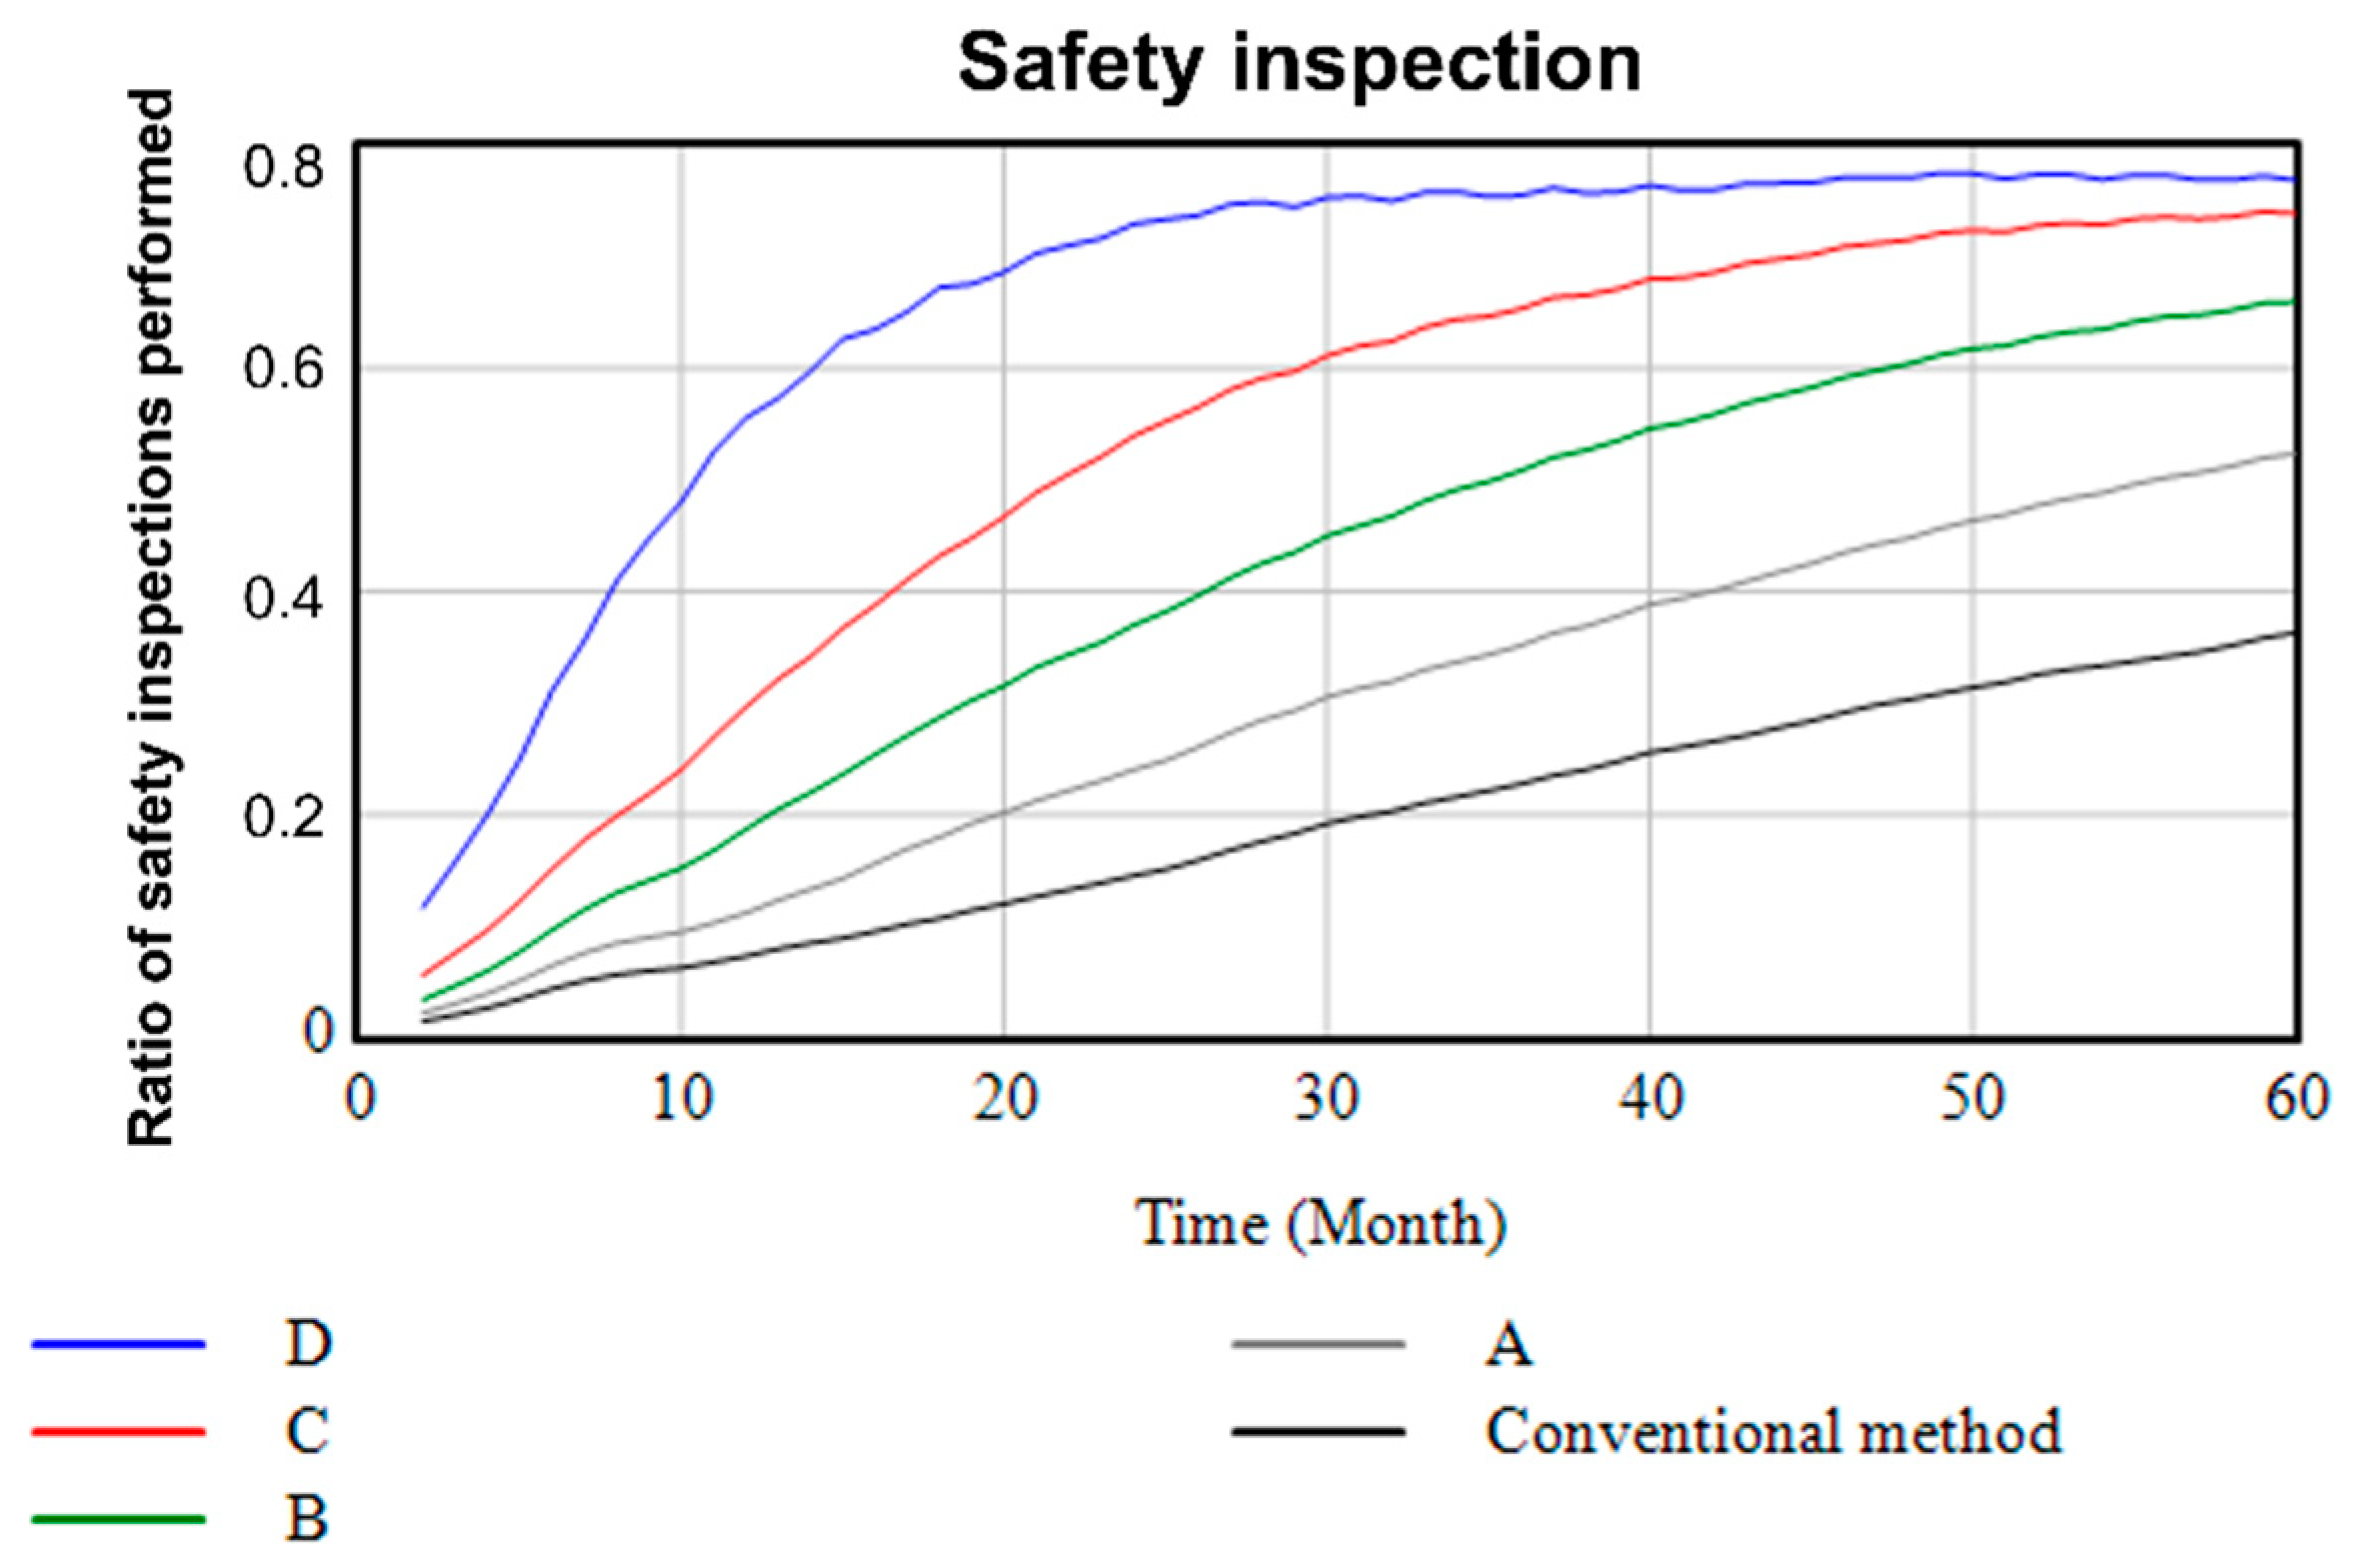
5. Scenario Analysis
6. Discussion and Conclusions
Author Contributions
Funding
Data Availability Statement
Conflicts of Interest
References
- OSHA Field Safety and Health Management System (SHMS) Manual. Available online: https://www.osha.gov/shms (accessed on 8 June 2023).
- 2021 Industrial Accident Analysis Report. Available online: https://www.kosha.or.kr/kosha/data/industrialAccidentStatus.do?mode=view&articleNo=437672&article.offset=0&articleLimit=10 (accessed on 8 June 2023).
- Comparative Analysis of Accident in Construction Industry in OECD Countries. Available online: http://www.cerik.re.kr/report/research/detail/2421 (accessed on 8 June 2023).
- Jeong, H.; Shin, W.; Son, C. An Analysis on the Safety Management Level of Large Construction Companies and Its Improvement Measures. J. Archit. Inst. Korea 2023, 39, 279–288. [Google Scholar]
- Kim, J.; Lee, H.; Park, M.; Kwon, N. A System Dynamics Approach for Modeling Cognitive Process of Construction Worker’s Unsafe Behaviors. Korea J. Constr. Eng. Manag. 2017, 18, 38–48. [Google Scholar]
- Lee, S.; Lee, H.; Shin, D. Analysis of the Effectiveness and Feasibility of Accident Analysis Policy for Construction Safety from the Perspective of System Safety. J. Soc. Disaster Inf. 2023, 19, 146–160. [Google Scholar]
- Li, H.; Lu, M.; Hsu, S.C.; Gray, M.; Huang, T. Proactive behavior-based safety management for construction safety improvement. Saf. Sci. 2015, 75, 107–117. [Google Scholar] [CrossRef]
- Park, C.S.; Kim, H.J. A framework for construction safety management and visualization system. Autom. Constr. 2013, 33, 95–103. [Google Scholar] [CrossRef]
- Jeelani, I.; Gheisari, M. Safety challenges of UAV integration in construction: Conceptual analysis and future research roadmap. Saf. Sci. 2021, 144, 105473. [Google Scholar] [CrossRef]
- Li, X.; Yi, W.; Chi, H.L.; Wang, X.; Chan, A.P.C. A critical review of virtual and augmented reality (VR/AR) applications in construction safety. Autom. Constr. 2018, 86, 150–162. [Google Scholar] [CrossRef]
- Lu, Y.; Gong, P.; Tang, Y.; Sun, S.; Li, Q. BIM-integrated construction safety risk assessment at the design stage of building projects. Autom. Constr. 2021, 124, 103553. [Google Scholar] [CrossRef]
- Shohet, I.M.; Wei, H.H.; Skibniewski, M.J.; Tak, B.T.; Revivi, M. Integrated Communication, Control, and Command of Construction Safety and Quality. J. Constr. Manag. 2019, 145, 04019051. [Google Scholar] [CrossRef]
- Ibrahim, A.; Roberts, D.; Golparvar-Fard, M.; Bretl, T. An Interactive Model-Driven Path Planning and Data Capture System for Camera-Equipped Aerial Robots on Construction Sites. In Proceedings of the Computing in Civil Engineering 2017: Smart Safety, Sustainability, and Resilience, Seattle, WA, USA, 25 June 2017. [Google Scholar]
- Kim, D.; Liu, M.; Lee, S.; Kamat, V.R. Remote proximity monitoring between mobile construction resources using camera-mounted UAVs. Autom. Constr. 2019, 99, 168–182. [Google Scholar] [CrossRef]
- Xu, Y.; Turkan, Y. The development of a safety assessment model for using Unmanned aerial systems (UAS) in construction. Saf. Sci. 2022, 155, 105893. [Google Scholar] [CrossRef]
- Rey, R.O.; Santos de Melo, R.R.; Costa, D.B. Design and implementation of a computerized safety inspection system for construction sites using UAS and digital checklist -Smart Inspecs. Saf. Sci. 2021, 143, 105430. [Google Scholar] [CrossRef]
- Jeong, J.; Han, S.; Kang, L. Development of Construction Site Monitoring System Using UAV Data for Civil Engineering Project. Korea J. Constr. Eng. Manag. 2017, 18, 41–49. [Google Scholar]
- Akinsemoyin, A.; Awolusi, I.; Chakraborty, D.; AI-Bayati, A.; Akanmu, A. Unmanned Aerial Systems and Deep Learning for Safety and Health Activity Monitoring on Construction Sites. Sensors 2023, 23, 6690. [Google Scholar] [CrossRef] [PubMed]
- Irizarry, J.; Gheisari, M.; Walker, B.N. Usability assessment of drone technology as safety inspection tools. Electron. J. Inf. Technol. Constr. 2021, 17, 194–212. [Google Scholar]
- Kim, S.; Irizarry, J.; Costa, D.B. Potential Factors Influencing the Performance of Unmanned Aerial System (UAS) Integrated Safety Control for Construction Worksites. In Proceedings of the Construction Research Congress 2016, San Juan Bautista, Puerto Rico, 31 June 2016. [Google Scholar]
- Gheisari, M.; Esmaeili, B. Applications and requirements of unmanned aerial system (UASs) for construction safety. Saf. Sci. 2019, 118, 230–240. [Google Scholar] [CrossRef]
- Kim, S.; Irizarry, J.; Kanfer, R. Multilevel Goal Model for Decision-Making in UAS Visual Inspections in Construction and Infrastructure Projects. J. Manag. Eng. 2020, 36, 04020036. [Google Scholar] [CrossRef]
- Kim, K.; Kim, S.; Shchur, D. A UAS-based work zone safety monitoring system by integrating internal traffic control plan (ITCP) and automated object detection in game engine environment. Autom. Constr. 2021, 128, 103736. [Google Scholar] [CrossRef]
- Kim, S.; Gan, Y.; Irizarry, J. Framework for UAS-Integrated Airport Runway Design Code Compliance Using Incremental Mosaic Imagery. J. Comput. Civ. Eng. 2021, 35, 04020070. [Google Scholar] [CrossRef]
- Kim, H.; Lee, J.; Ahn, E.; Cho, S.; Shin, M.; Sim, S.H. Concrete Crack Identification Using a UAV Incorporating Hybrid Image Processing. Sensors 2017, 17, 2052. [Google Scholar] [CrossRef] [PubMed]
- Padua, L.; Vanko, J.; Hruska, J.; Adao, T.; Sousa, J.J. UAS, sensors, and data processing in agroforestry: A review of towards practical applications. Int. J. Remote Sens. 2017, 38, 2349–2391. [Google Scholar] [CrossRef]
- Bang, S.; Kim, H.; Kim, H. UAV-based automatic generation of high-resolution panorama at a construction site with a focus on preprocessing for image stitching. Autom. Constr. 2017, 84, 70–80. [Google Scholar] [CrossRef]
- How Construction Can Emerge Stronger After Corona-Virus. Available online: https://www.mckinsey.com/capabilities/operations/our-insights/how-construction-can-emerge-stronger-after-coronavirus#/ (accessed on 8 June 2023).
- Forrester, J.W. Lessons from system dynamics modeling. Syst. Dyn. Rev. 1987, 3, 136–149. [Google Scholar] [CrossRef]
- A Look at Workplace Deaths, Injuries, and Illnesses on Worker’s Memorial Day. Available online: https://www.bls.gov/opub/ted/2022/a-look-at-workplace-deaths-injuries-and-illnesses-on-workers-memorial-day.htm (accessed on 8 June 2023).
- Safety Management Manual for Construction Work. Available online: http://www.molit.go.kr/USR/policyData/m_34681/dtl.jsp?id=3865 (accessed on 8 June 2023).
- Parsamehr, M.; Perera, U.S.; Dodanwala, T.C.; Perera, P.; Ruparathna, R. A review of construction management challenges and BIM-based solutions: Perspectives from the schedule, cost, quality, and safety management. Asian J. Civ. Eng. 2022, 24, 353–389. [Google Scholar] [CrossRef]
- Swayze, N.C.; Tinkham, W.T.; Vogeler, J.C.; Hudak, A.T. Influence of flight parameters on UAS-based monitoring of tree height, diameter, and density. Romote Sens. Environ. 2021, 263, 112540. [Google Scholar] [CrossRef]
- Tatum, M.C.; Liu, J. Unmanned Aircraft System Applications in Construction. Procedia Eng. 2017, 196, 167–175. [Google Scholar] [CrossRef]
- Gromada, K.; Siemiatkowska, B.; Stecz, W.; Plochocki, K.; Wozniak, K. Real-Time Object Detection and Classification by UAV Equipped With SAR. Sensors 2022, 22, 2068. [Google Scholar] [CrossRef]
- Li, X.; He, B.; Ding, K.; Guo, W.; Huang, B.; Wu, L. Wide-Area and Real-Time Object Search System of UAV. Remote Sens. 2022, 14, 1234. [Google Scholar] [CrossRef]
- Martinez, J.G.; Albeaino, G.; Gheisari, M.; Issa, R.R.A.; Alarcon, L.F. iSafeUAS: An unmanned aerial system for construction safety inspection. Autom. Constr. 2021, 125, 103595. [Google Scholar] [CrossRef]
- Alizadehsalehi, S.; Yitmen, I.; Celik, T.; Arditi, D. The effectiveness of an integrated BIM/UAV model in managing safety on construction site. Int. J. Occup. Saf. Ergon. 2020, 26, 829–844. [Google Scholar] [CrossRef]
- Jiang, Z.; Fang, D.; Zhang, M. Understanding the Causation of Construction Worker’s Unsafe Behaviors Based on System Dynamics Modeling. J. Manag. Eng. 2014, 31, 04014099. [Google Scholar] [CrossRef]
- Kim, S.; Chang, S.; Daniel, C.L. Dynamic Modeling for Analyzing Impacts of Skilled Labor Shortage on Construction Project Management. J. Manag. Eng. 2019, 36, 04019035. [Google Scholar] [CrossRef]
- Zoghi, M.; Kim, S. Dynamic Modeling for Life Cycle Cost Analysis of BIM-Based Construction Waste Management. Sustainability 2020, 12, 2483. [Google Scholar] [CrossRef]
- Rodrigues, R.; Bastos, D.; Sampaio, J.; Irizarry, J. Applicability of unmanned aerial system (UAS) for safety inspection on construction sites. Saf. Sci. 2017, 98, 174–185. [Google Scholar]
- Misra, T.; Dattani, N.; Majeed, A. Evaluation of the National Congenital Anomaly System in England and Wales. BMJ J. 2005, 90, 368–373. [Google Scholar] [CrossRef]
- Ham, M.; Jeger, M.; Frajman, A. The role of subjective norms in forming the intention to purchase green food. Econ. Res. Ekon. Istraz. 2015, 28, 738–748. [Google Scholar] [CrossRef]


| Variable | Definition | Reference |
|---|---|---|
| Accumulated delayed time | The time difference between all delays occurring since the project started and the delay due to the work pressure in the previous month. | Kim et al., 2016 [20] |
| Communication | Interaction between project engineers and labor during the construction activities. | Zoghi et al., 2020 [41] |
| Corrective actions | Activities to correct hazardous situations potentially resulting in accidents. | Jiang et al., 2014 [39] |
| Detecting invisible hazardous situations | Areas where hazards and risks are invisible or difficult to inspect. | Jiang et al., 2014 [39] |
| Detecting visible hazardous situation | Intentional or unintentional methods to detect hazards within a construction site. | Jiang et al., 2014 [39] |
| Exchanging real-time information | Information and data exchange between the safety inspection system and the project managers. | Kim et al., 2016 [20] |
| Fatigue | Workers’ physical and mental fatigue. | Rodrigues et al., 2017 [42] |
| Fixing non-compliance and hazards | Identifying hazards and fixing risks during safety inspection. | Jiang et al., 2014 [39] |
| Frequency of using UAVs for safety inspection | Frequency of using a UAV system to identify hazards at construction sites and improve work environments. | Rodrigues et al., 2017 [42] |
| Hazardous situations | Site conditions that may put workers at risk. | Jiang et al., 2014 [39] |
| Learning and training | Systematic learning and routine safety training among workers. | Jiang et al., 2014 [39] |
| Maximum monthly work capacity | The maximum amount of work that one laborer performs in a specific job in a month. | Rodrigues et al., 2017 [42] |
| Monitoring hard-to-access areas | Refers to inspection areas that are difficult to access. | Rodrigues et al., 2017 [42] |
| Postponing inspection service | Refers to delay of safety inspection and measurement. | Jiang et al., 2014 [39] |
| Potential hazardous situations | Hazardous situations and behavior of workers that may cause accidents at the jobsite. | Kim et al., 2016 [20] |
| Rate of extra work | Amount of a worker’s extra work to accelerate project. | Rodrigues et al., 2017 [42] |
| Reporting | Refers to the percentage of anomalies groups reported in construction projects. | Misra et al., 2005 [43] |
| Safety inspection | Refers to a series of processes carried out to identify hazards within a construction site. | Kim et al., 2016 [20] |
| Safety regulations at jobsite | Safety instructions and plans that laborers must follow to prevent accidents. | Rodrigues et al., 2017 [42] |
| Speed of measurements | Refers to the speed of carrying out instructions and reacting to potential hazards and incidents. | Rodrigues et al., 2017 [42] |
| Subjective norms | A type of behavior that puts social pressure on others to behave in certain way. | Ham et al., 2015 [44] |
| Taking a rest | One day to release work stress. | Rodrigues et al., 2017 [42] |
| The amount of delayed work | Cumulative delay since the beginning of the project. | Kim et al., 2016 [20] |
| Time wasted for documentation process | Refers to the time needed to organize and classify safety inspection documents. | Kim et al., 2016 [20] |
| Violation | Workers do not follow the safety rules and compliance. | Jiang et al., 2014 [39] |
| Workflow | This refers to a pattern that is repeated at a construction site. | Jiang et al., 2014 [39] |
| Workers negligent | Some workers who work in inconspicuous locations use safety equipment carelessly. | Rodrigues et al., 2017 [42] |
| Workers’ safety awareness | This refers to the technical and psychological state of workers that keeps them cautious of potential hazards within a construction site. | Jiang et al., 2014 [39] |
| Variables | Equations |
|---|---|
| Exchanging real-time information | IF THEN ELSE (Frequency of using UAVs for safety inspection ≥ 4, 8, IF THEN ELSE (Frequency of using UAVs for safety inspection ≥ 3, 6, IF THEN ELSE (Frequency of using UAVs for safety inspection ≥ 2, 4, IF THEN ELSE (Frequency of using UAVs for safety inspection ≥ 1, 2, 1)))) |
| Accumulated delayed time (t) | Accumulated delayed time (t − dt) + Adding time passed × dt |
| Adding time passed | Postponing inspection service |
| Changing workers’ condition | Work pressure |
| Communication | “Exchanging real-time information” × 0.1 |
| Corrective actions (t) | Corrective actions (t − dt) + “Fixing non-compliance and hazards” × dt |
| Detecting invisible hazardous situations | Monitoring hard-to-access areas |
| Detecting visible hazardous situation | (100-Workers negligent)/2 |
| “Exchanging real-time information” | IF THEN ELSE (Frequency of using UAVs for safety inspection ≥ 4, 8, IF THEN ELSE (Frequency of using UAVs for safety inspection ≥ 3, 6, IF THEN ELSE (Frequency of using UAVs for safety inspection ≥ 2, 4, IF THEN ELSE (Frequency of using UAVs for safety inspection ≥ 1, 2, 1)))) |
| Fatigue | DELAY1(MAX (Workers’ physical condition, 5), 2) |
| “Fixing non-compliance and hazards” | (Detecting visible hazardous situation + Detecting invisible hazardous situations)/2 × 0.01 × Potential hazardous situations × Speed of measurements |
| Frequency of using UAVs for safety inspection | 0, 1, 2, 3, 4 |
| Gap in projects | INTEGER (Lost time) + 0.1 |
| Hazardous situations | 90 − 0.9 × Corrective actions |
| Incidents | MAX (0.1, INTEGER (Possibility of incidents/10)) |
| Learning and training | IF THEN ELSE (Communication ≥ 0.8, “Fixing non-compliance and hazards” × 0.8, IF THEN ELSE (Communication ≥ 0.6, “Fixing non-compliance and hazards” × 0.7, IF THEN ELSE (Communication ≥ 0.4, “Fixing non-compliance and hazards” × 0.6, IF THEN ELSE (Communication ≥ 0.2, “Fixing non-compliance and hazards” × 0.5, “Fixing non-compliance and hazards” × 0.4)))) |
| Lost time | RANDOM UNIFORM (0, Incidents, 0) |
| Maximum monthly work capacity | 2 + 2 × ABS(SIN(Time)) |
| Monitoring hard-to-access areas | IF THEN ELSE (Frequency of using UAVs for safety inspection ≥ 4, 96, IF THEN ELSE (Frequency of using UAVs for safety inspection ≥ 3, 75, IF THEN ELSE (Frequency of using UAVs for safety inspection ≥ 2, 60, IF THEN ELSE (Frequency of using UAVs for safety inspection ≥ 1, 45, 30)))) |
| Possibility of incidents | Hazardous situations |
| Postponing inspection service | INTEGER (The amount of delayed wok) |
| Potential hazardous situations (t) | Potential hazardous situations (t − dt) − Fixing non-compliance and hazards × dt |
| Rate of extra work | Work pressure |
| Reporting | RANDOM UNIFORM (0, 2, 0) + Exchanging real-time information |
| Safety inspection | DELAY1(Corrective actions, 0.1 × Accumulated delayed time) |
| Safety regulations at jobsite (t) | Safety regulations at jobsite (t − dt) + Subjective norms × dt |
| Speed of measurements | 1/Time wasted for documentation process |
| Subjective norms | Workers’ safety awareness × 0.01 |
| Taking a rest | 1 |
| The amount of delayed wok (t) | The amount of delayed wok (t − dt) + workflow × dt-Rate of extra work × dt |
| Time wasted for documentation process | IF THEN ELSE (Frequency of using UAVs for safety inspection ≥ 4, 4, IF THEN ELSE (Frequency of using UAVs for safety inspection ≥ 3, 7, IF THEN ELSE (Frequency of using UAVs for safety inspection ≥ 2, 10, IF THEN ELSE (Frequency of using UAVs for safety inspection ≥ 1, 13, 16)))) |
| Violation | ((10-Reporting) + ((100-Safety regulations at jobsite) × 0.1))/2 |
| Workflow | Gap in projects |
| Work pressure | MIN (Maximum monthly work capacity, The amount of delayed wok-Maximum monthly work capacity) |
| Workers negligent | (Fatigue + 3 × Violation)/2 |
| Workers’ physical condition (t) | Workers’ physical condition (t − dt) + Changing workers’ condition × dt − Taking a rest × dt |
| Workers’ safety awareness (t) | Workers’ safety awareness (t − dt) + Learning and training × dt |
Disclaimer/Publisher’s Note: The statements, opinions and data contained in all publications are solely those of the individual author(s) and contributor(s) and not of MDPI and/or the editor(s). MDPI and/or the editor(s) disclaim responsibility for any injury to people or property resulting from any ideas, methods, instructions or products referred to in the content. |
© 2023 by the authors. Licensee MDPI, Basel, Switzerland. This article is an open access article distributed under the terms and conditions of the Creative Commons Attribution (CC BY) license (https://creativecommons.org/licenses/by/4.0/).
Share and Cite
Jeong, K.; Yu, C.; Lee, D.; Kim, S. A Computational Model for Simulating the Performance of UAS-Based Construction Safety Inspection through a System Approach. Drones 2023, 7, 696. https://doi.org/10.3390/drones7120696
Jeong K, Yu C, Lee D, Kim S. A Computational Model for Simulating the Performance of UAS-Based Construction Safety Inspection through a System Approach. Drones. 2023; 7(12):696. https://doi.org/10.3390/drones7120696
Chicago/Turabian StyleJeong, Kyeongtae, Chaeyeon Yu, Donghoon Lee, and Sungjin Kim. 2023. "A Computational Model for Simulating the Performance of UAS-Based Construction Safety Inspection through a System Approach" Drones 7, no. 12: 696. https://doi.org/10.3390/drones7120696