Article

VSAI: A Multi-View Dataset for Vehicle Detection in Complex Scenarios Using Aerial Images

College of Aerospace Science and Engineering, National University of Defense Technology, Changsha 410073, China
*
Author to whom correspondence should be addressed.
Drones 2022, 6(7), 161; https://doi.org/10.3390/drones6070161
Submission received: 29 May 2022 / Revised: 21 June 2022 / Accepted: 25 June 2022 / Published: 27 June 2022
(This article belongs to the Special Issue Intelligent Coordination of UAV Swarm Systems)

Abstract

:
Arbitrary-oriented vehicle detection via aerial imagery is essential in remote sensing and computer vision, with various applications in traffic management, disaster monitoring, smart cities, etc. In the last decade, we have seen notable progress in object detection in natural imagery; however, such development has been sluggish for airborne imagery, not only due to large-scale variations and various spins/appearances of instances but also due to the scarcity of the high-quality aerial datasets, which could reflect the complexities and challenges of real-world scenarios. To address this and to improve object detection research in remote sensing, we collected high-resolution images using different drone platforms spanning a large geographic area and introduced a multi-view dataset for vehicle detection in complex scenarios using aerial images (VSAI), featuring arbitrary-oriented views in aerial imagery, consisting of different types of complex real-world scenes. The imagery in our dataset was captured with a wide variety of camera angles, flight heights, times, weather conditions, and illuminations. VSAI contained 49,712 vehicle instances annotated with oriented bounding boxes and arbitrary quadrilateral bounding boxes (47,519 small vehicles and 2193 large vehicles); we also annotated the occlusion rate of the objects to further increase the generalization abilities of object detection networks. We conducted experiments to verify several state-of-the-art algorithms in vehicle detection on VSAI to form a baseline. As per our results, the VSAI dataset largely shows the complexity of the real world and poses significant challenges to existing object detection algorithms. The dataset is publicly available.

1. Introduction

Objection detection, as one core task in computer vision, refers to localized objects of interest; predicting their categories is becoming increasingly popular among researchers because of the extensive range of applications, e.g., smart cities, traffic management, face recognition, etc. The contributions of many high-quality datasets (such as PASCAL VOC [1], ImageNet [2], and MS COCO [3]) are immeasurable as part of the extensive elements and efforts leading to the rapid development of object detection technology.
In addition to the above-mentioned conventional datasets, the datasets collected by camera-equipped drones (or UAVs) for object detection have been widely applied in a great deal of fields, including agricultural, disaster monitoring, traffic management, military reconnaissance, etc. In comparison to natural datasets, where objects are almost directed upward because of gravity, object instances in aerial images under oblique view generally exist with arbitrary directions relying on the view of the flight platform and scale transformation due to oblique aerial photography, as illustrated in Figure 1.
Numerous research studies significantly contributed to object detection in remote sensing images [4,5,6,7,8,9,10,11,12], taking advantage of the latest advances in computer vision. Most algorithms [6,8,9,12] experimented by converting object detection in natural scenes to the aerial image fields. It is not surprising that object detection in ordinary images is not applicable to aerial images, as there are many differences (target sizes, degraded images, arbitrary orientations, unbalanced object intensity, etc.) between the two. Overall, it is more challenging for object detection in aerial images.
Figure 1 illustrates that object detection in aerial images is facing many challenges (such as image degradation, uneven object intensity, complex background, various scales, and various directions) distinguished from conventional object detection tasks:
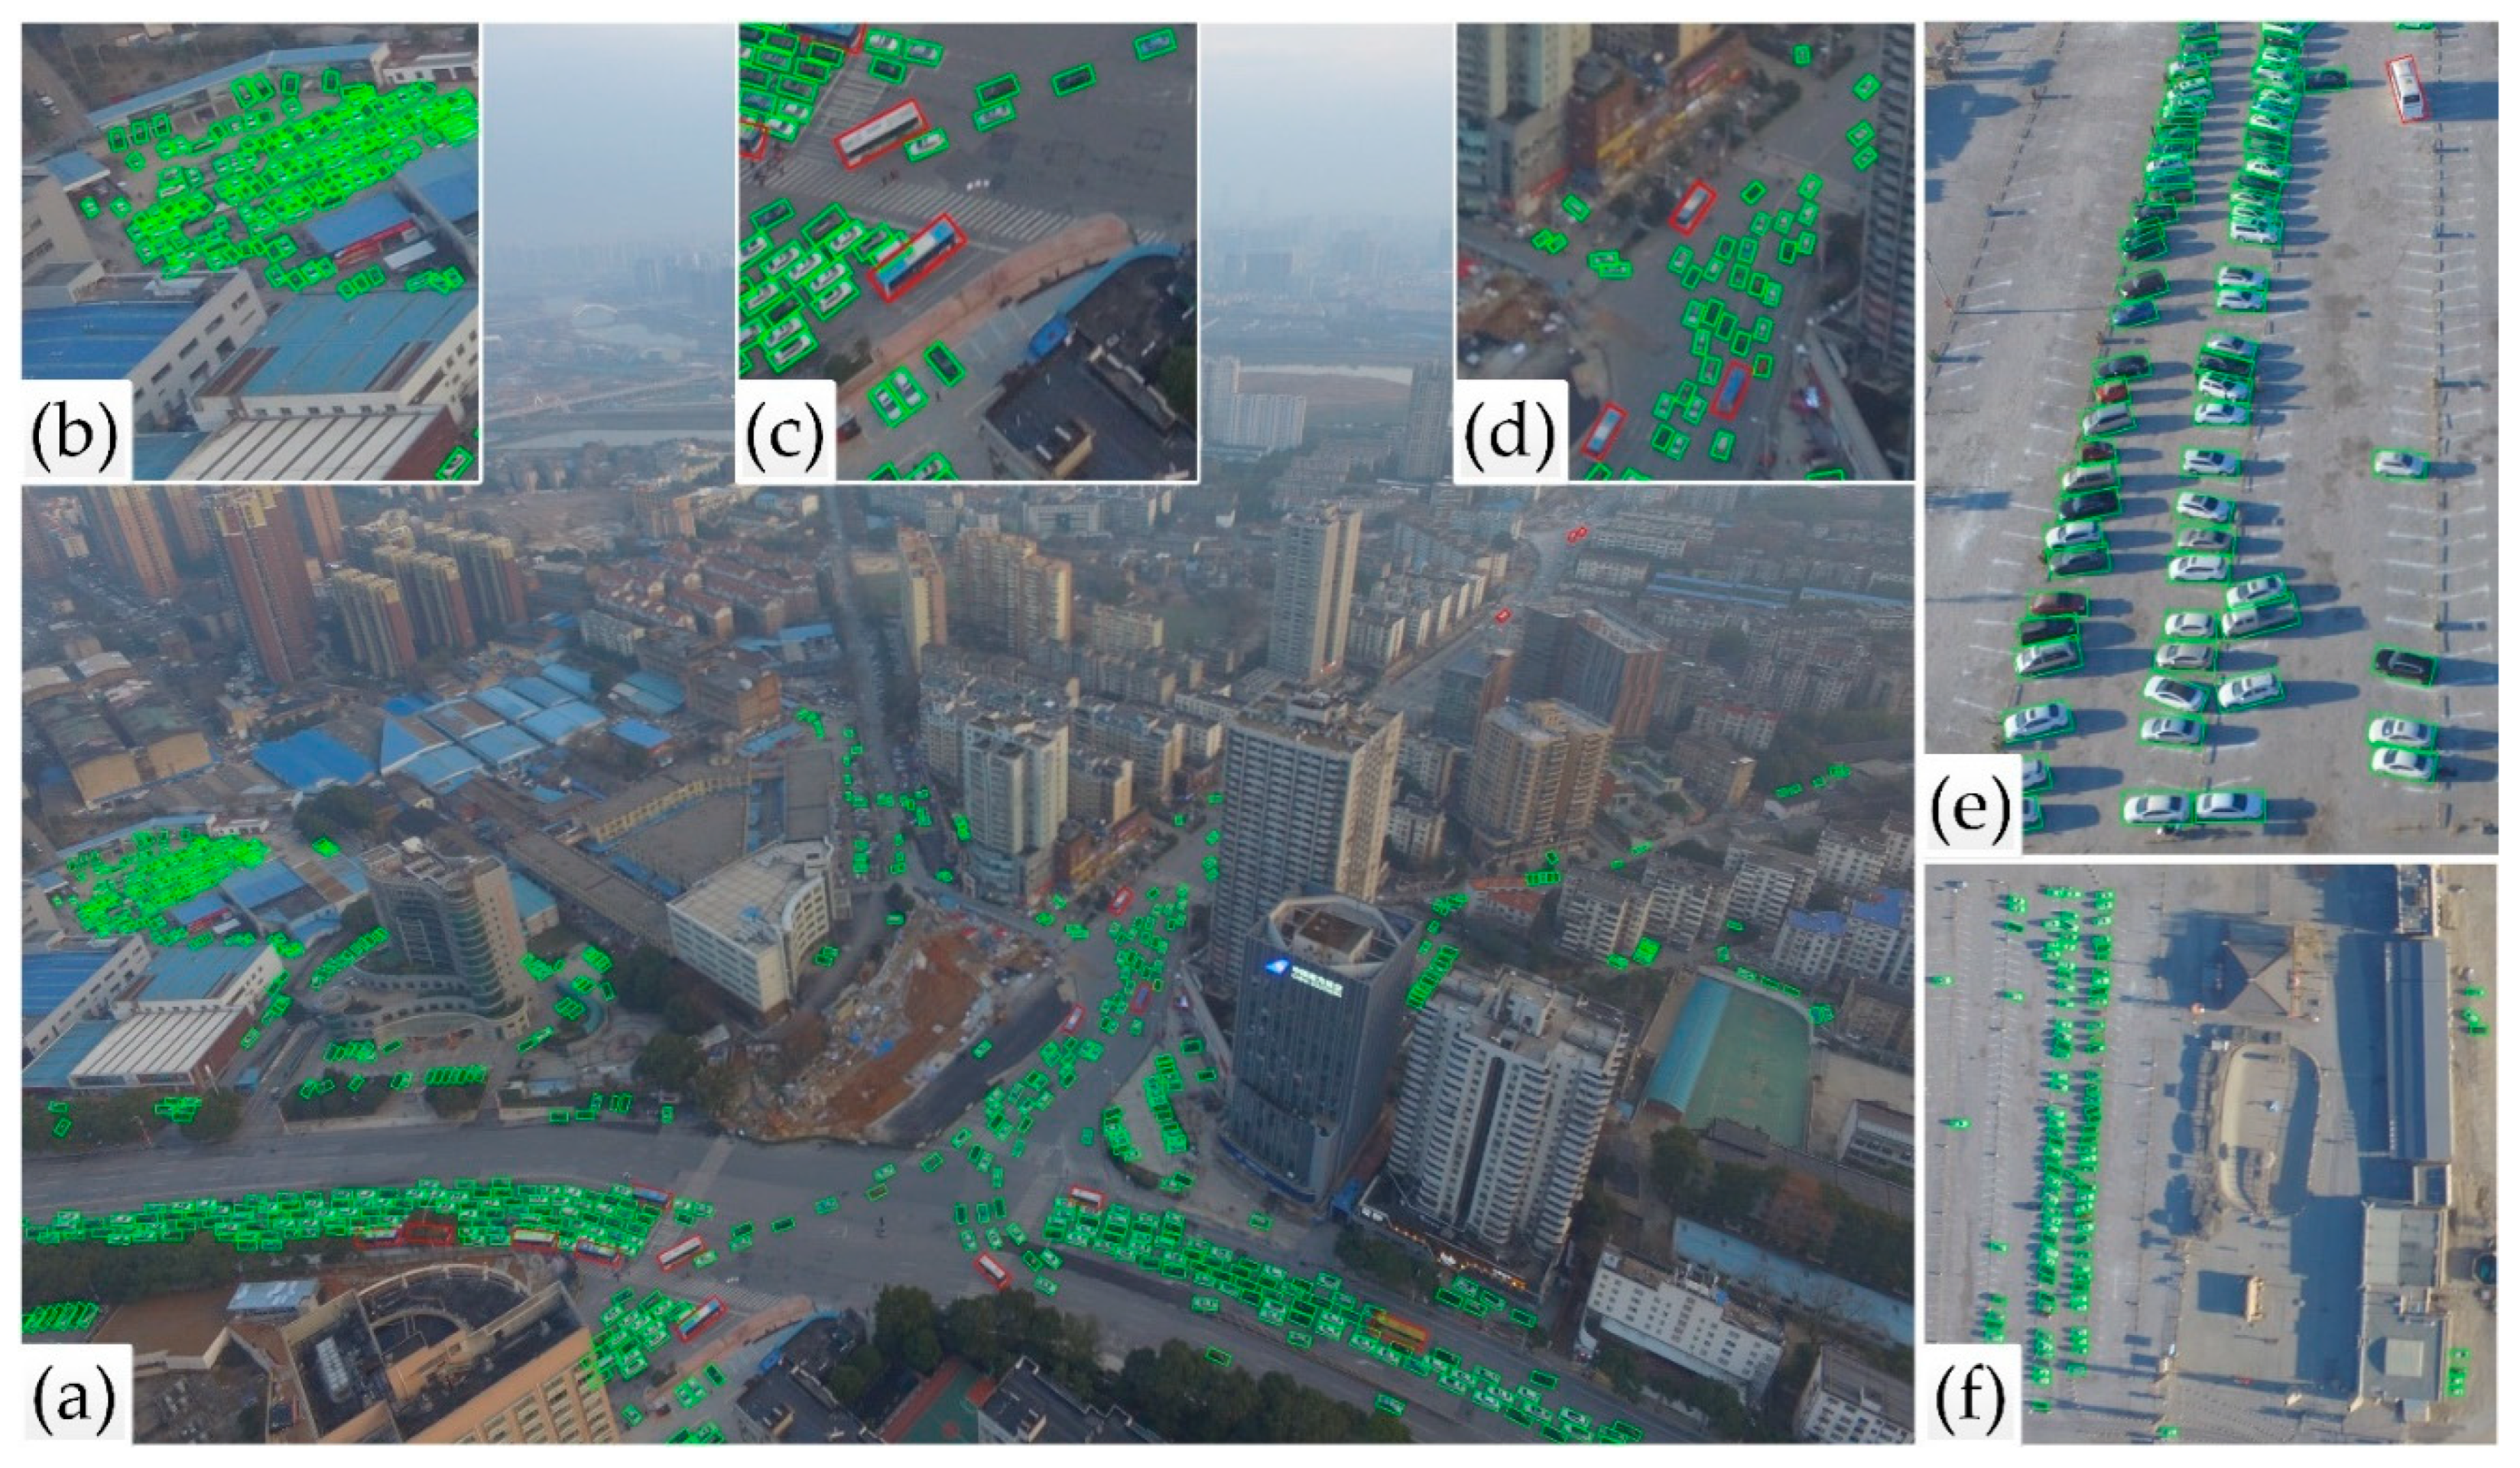
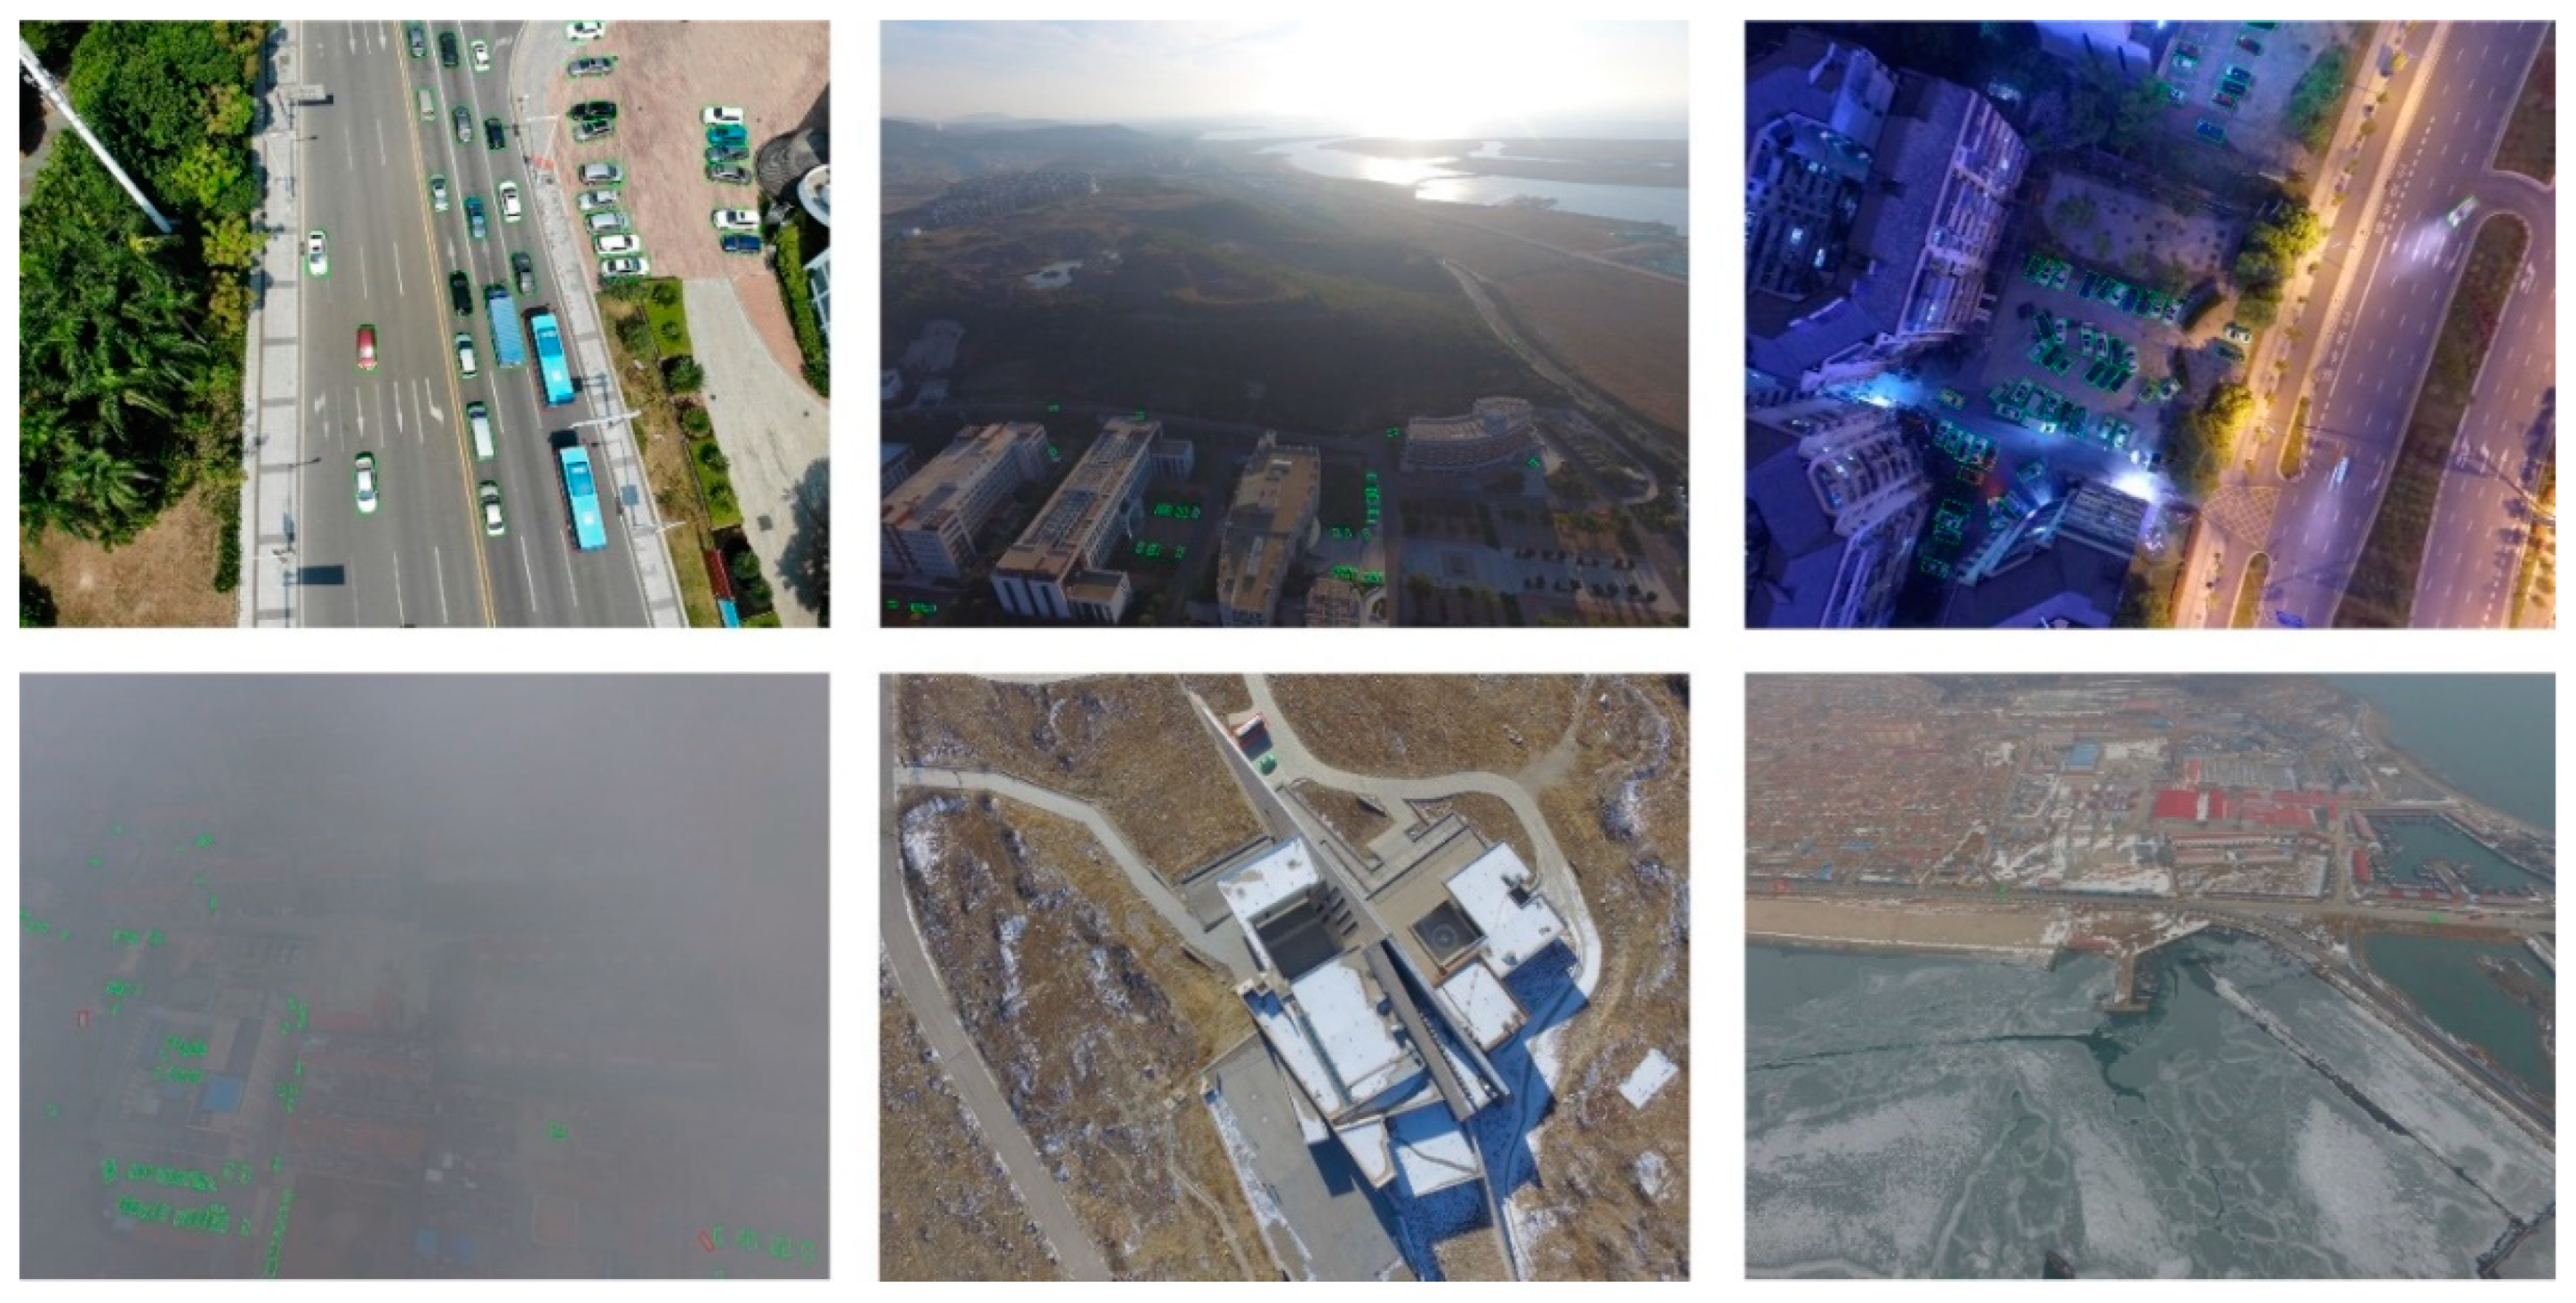
  • Large size variations of instances: this almost depends on the different spatial resolutions of the cameras, which are related to the camera pitch angles and flight heights of UAVs.
  • Degraded images: The load carried by a small UAV platform is subject to severe limitations, with respect to the size and battery. Complex external weather variations (e.g., fog, rain, cloud, snow, light, etc.) and rapid UAV flights have led to vague UAV imagery, namely image degradation [13].
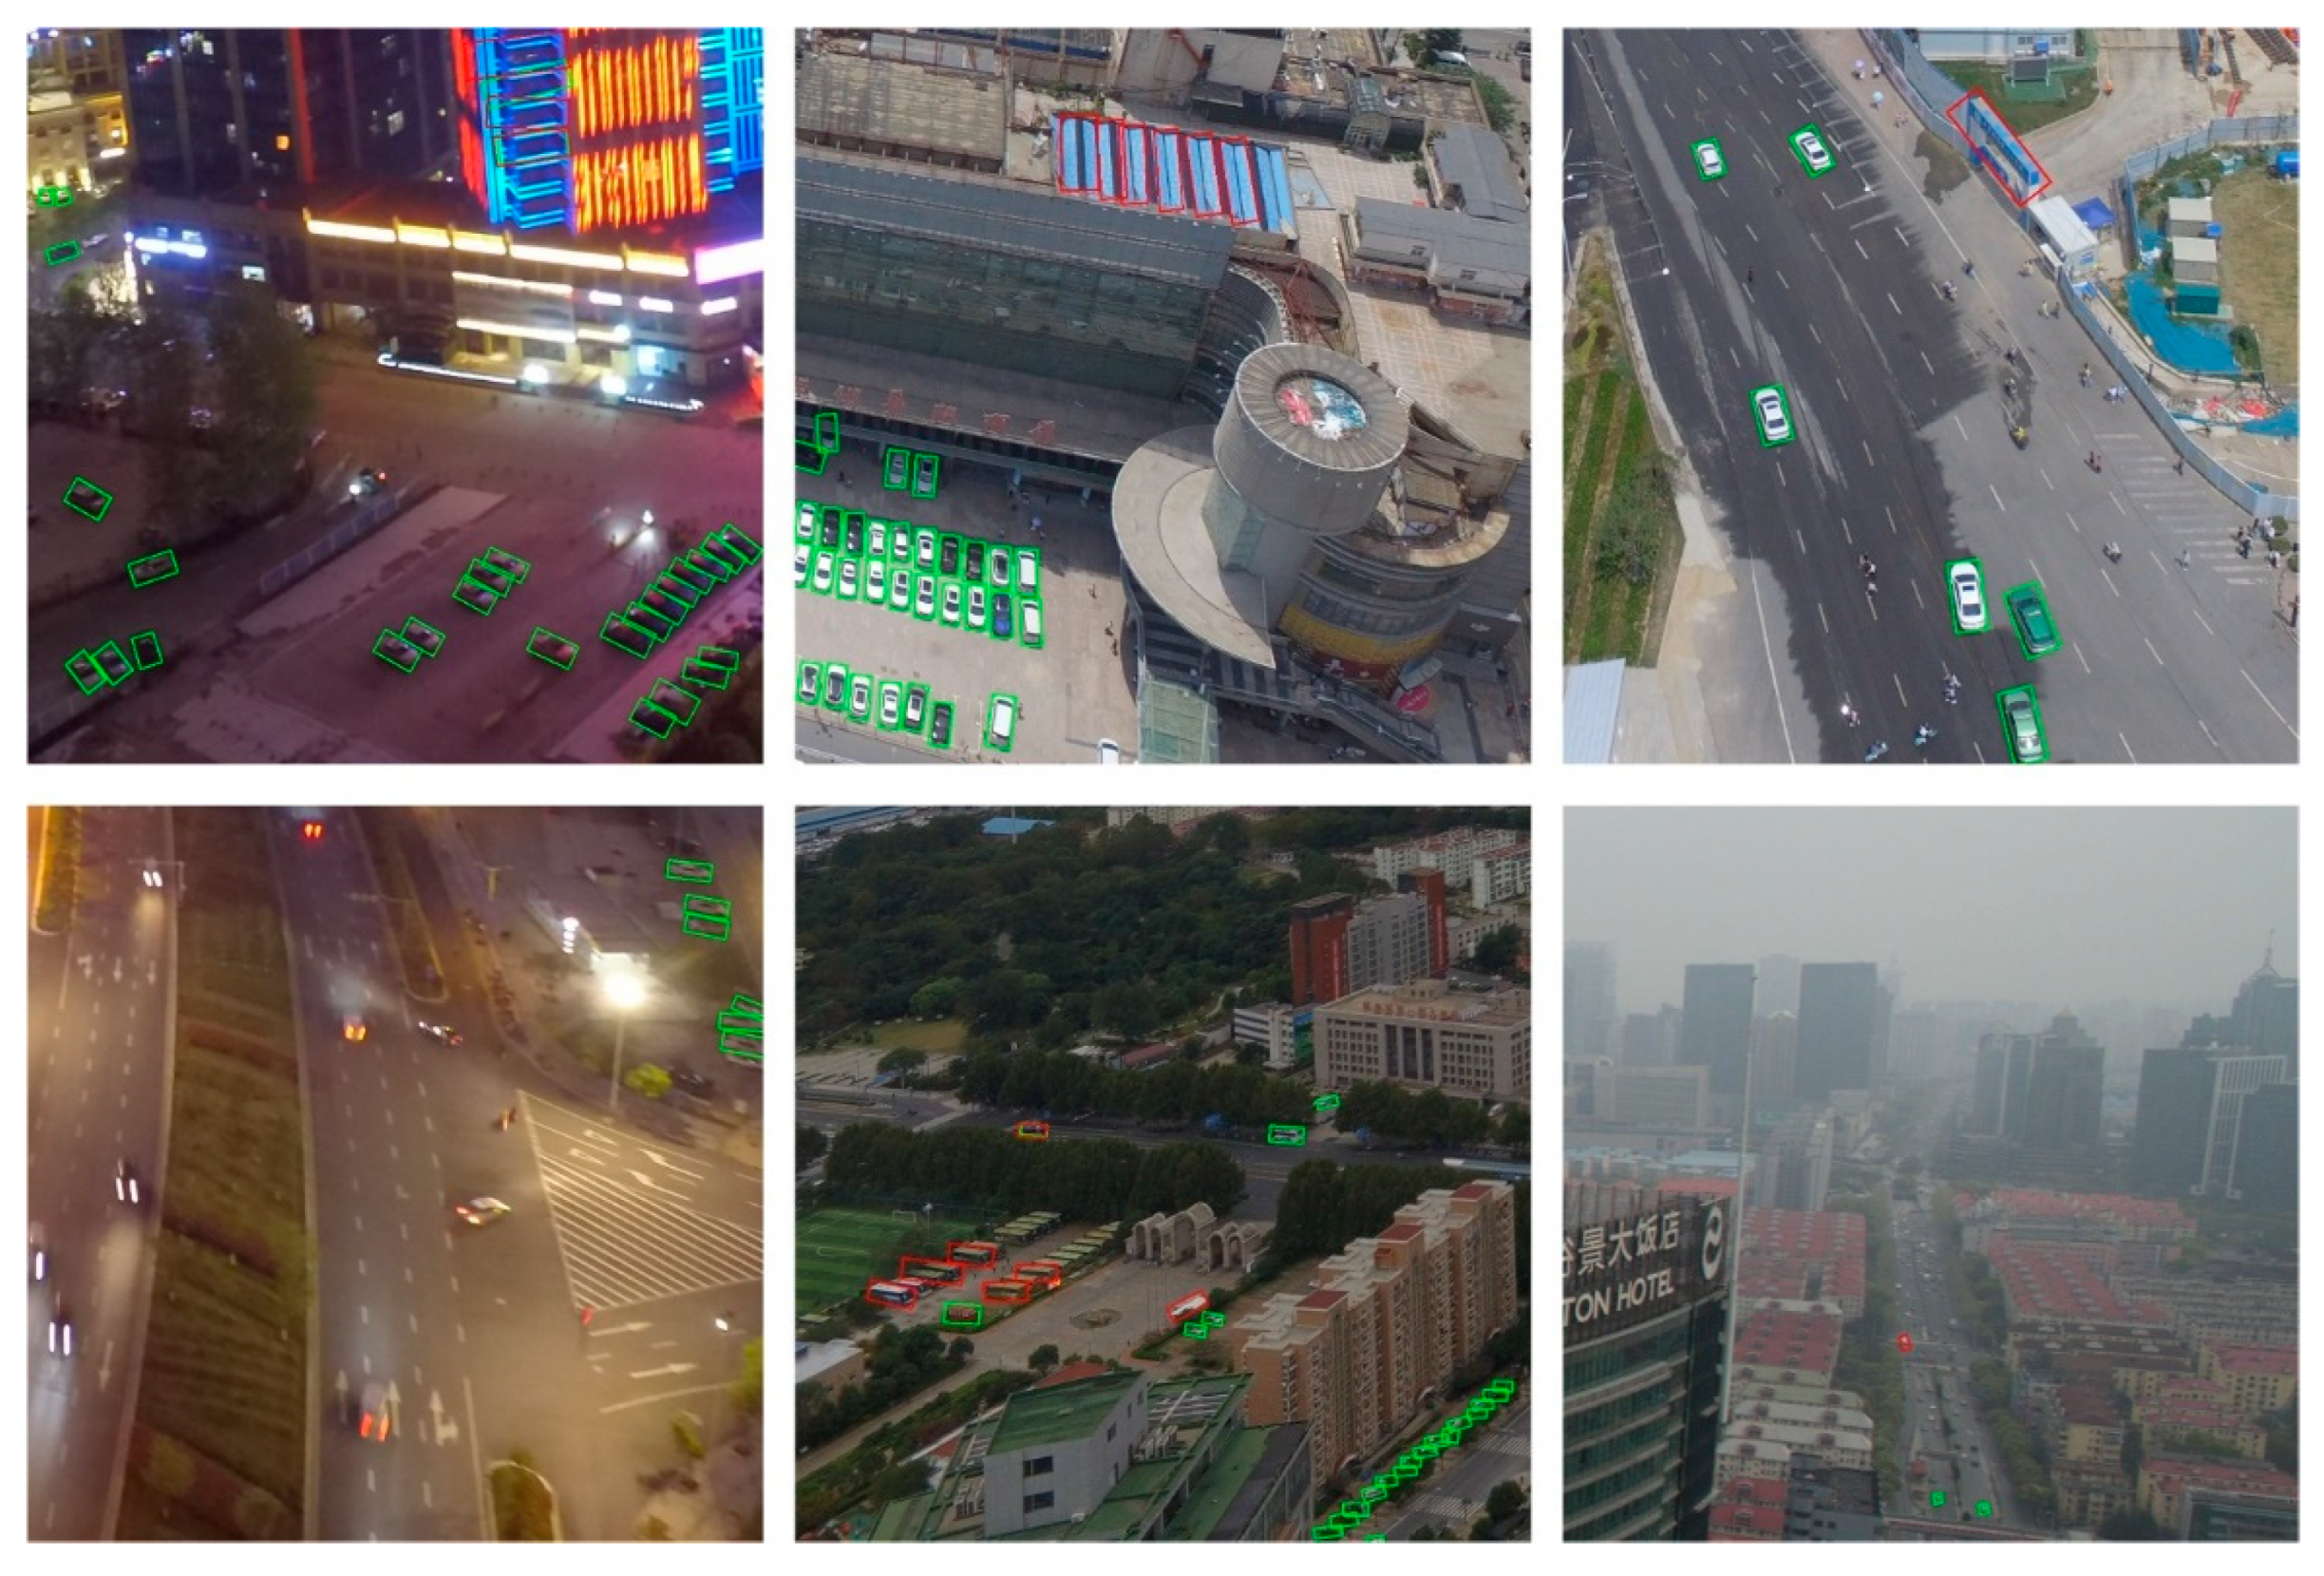
  • Plenty of small instances: Ground objects with areas smaller than 32 × 32 pixels (MS COC dataset’s definition of small objects) account for the majority of all objects in UAV images, as illustrated in Figure 1. Owing to the less diverse features of small targets, they may yield more errors and miss detection objects.
  • Unbalanced object density: Uneven densities of captured objects are extremely prevalent in UAV images. In the same image, some objects may be densely arranged, while others may have sparse and uneven distribution, which are prone to repeated detection and missed detection, respectively.
  • Arbitrary orientations: objects in aerial images usually appear in any direction, as shown in Figure 1.
In addition to these challenges, the research on object detection in UAV images is also plagued by the dataset bias problem [14]. The generalization ability (across datasets) is often low due to some preset specified conditions, which cannot fully reflect the task’s complexity, e.g., fixed flight altitude [15,16], fixed camera pitch angle [15,17,18], narrow shooting area [16,19], clear background [20,21], etc. To improve the generalization ability of an object detection network, a dataset that adapts to the demands of practical applications needs to be created.
Moreover, compared to the object detection from a nadir image, the ability to identify objects with multi-view (off-nadir) imagery enables drones to be more responsive to many applications, such as disaster monitoring, emergency rescue, and environmental reconnaissance. To further unleash the potential of a drone’s multi-view observations, this paper introduces a multi-view dataset for vehicle detection in complex scenarios using aerial images (VSAI), to highlight the object detection research based on drones. We collected 444 aerial images using different drone platforms from multi-view imaging. The resolutions of the pictures included 4000 × 3000, 5472 × 3648, and 4056 × 3040. These VSAI images were annotated by specialists in aerial imagery interpretation, including two categories (small vehicle and large vehicle). The fully labeled VSAI dataset consists of 49,712 instances, 48,925 of which are annotated by an oriented bounding box. The rest are marked with arbitrary quadrilateral bounding boxes for instances at image boundaries, rather than horizontal bounding boxes generally utilized as object labels in natural scenes. The major contributions of this paper are as follows:
  • To our knowledge, VSAI is the first vehicle detection dataset annotated with varying camera pitch angles and flight heights (namely multi-view) rather than almost-fixed heights and camera angles of other datasets for object detection. It can be useful for evaluating object detection models in aerial images under complicated conditions closer to real situations.
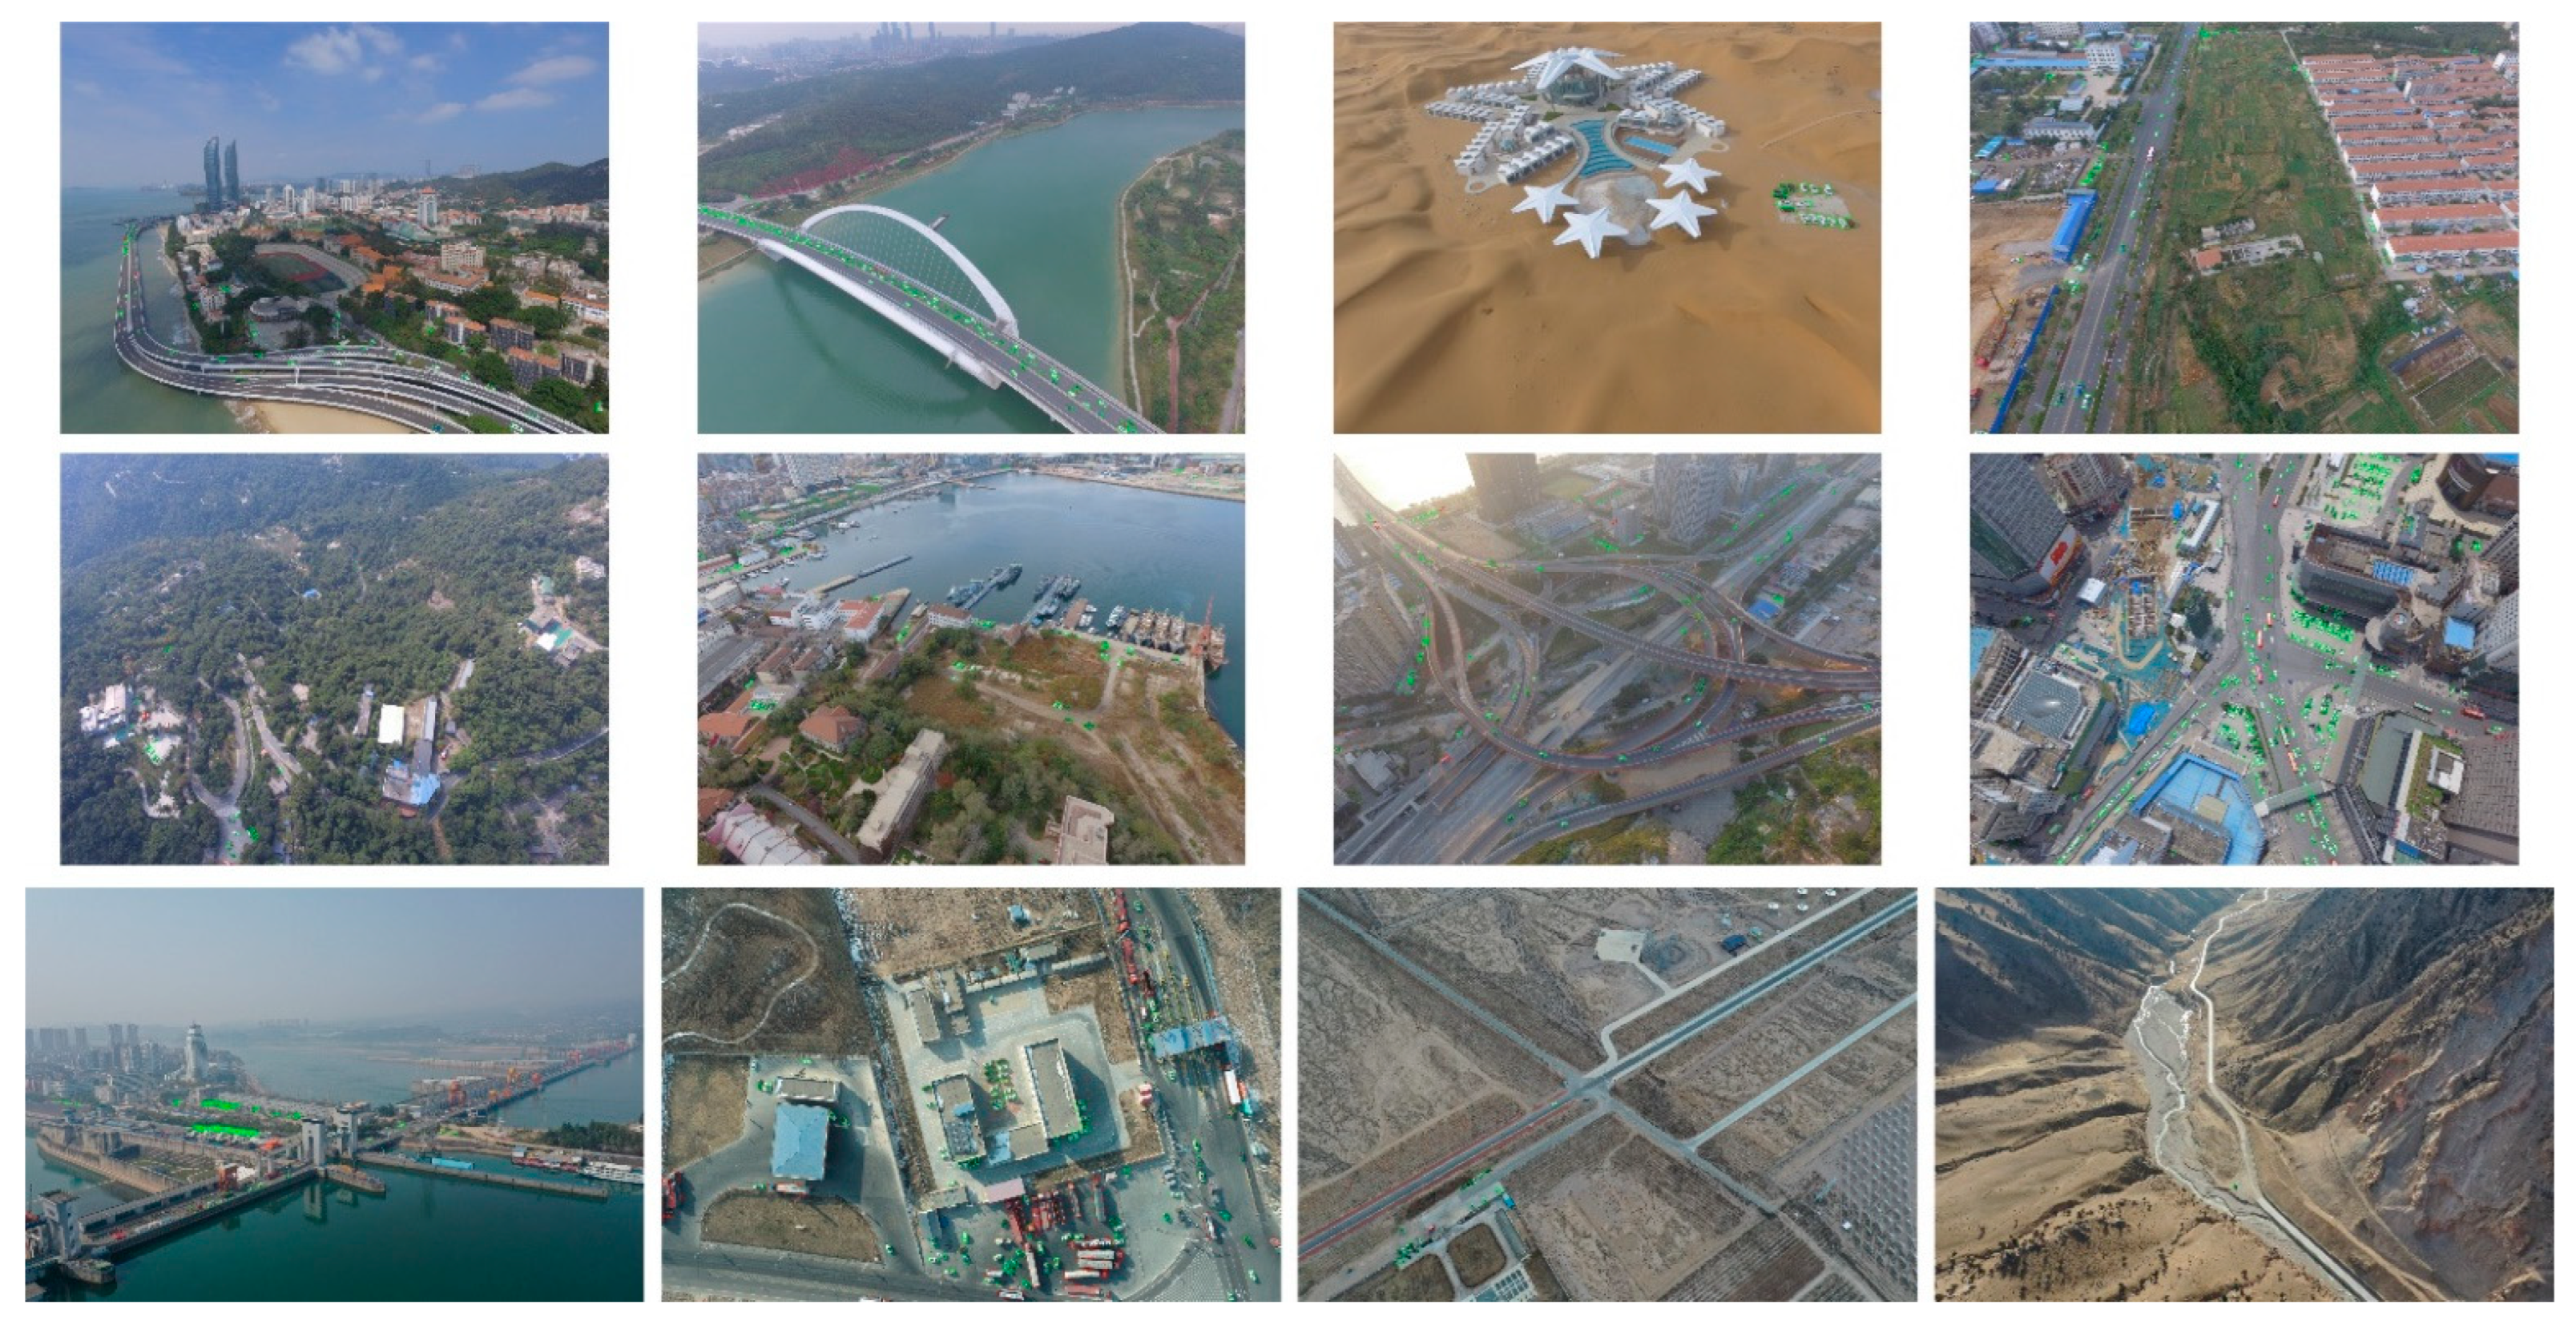
  • Our dataset’s images c massive complex scenes (in exception for multi-view information) from many Chinese cities, such as backlights, the seaside, brides, dams, fog, ice and snow, deserts, tollbooths, suburbs, night, forest, Gobi, harbors, overhead bridges, crossroads, and mountainous regions, as shown in Figure 1.
This paper also evaluated state-of-the-art object detection algorithms on VSAI, which can be treated as the baseline for future algorithm development. We accomplished a cross-dataset generalization with the DOTA [22] dataset to evaluate the generalization capability of the VSAI dataset.

2. Related Work

In recent years, computer vision technology based on drones has gained much attention in many fields. As drones are excellent for acquiring high-quality aerial images and collecting vast amounts of imagery data, different datasets have been created for learning tasks, such as object detection, tracking, and scene understanding. Among these tasks, object detection is considered a fundamental problem; datasets for object detection are very important subsets of drone-based datasets. However, many drone-based datasets mainly use nadir imagery (i.e., images taken by a camera pointing to the ground vertically) for object detection and other computer vision tasks, without considering multi-view observations; the objects in scenes with high complexities are also insufficient, as they do not fully reflect complex real-world scenes.
In this section, we firstly review the relevant drone-based benchmarks and then vehicle target benchmarks collected by drones in object detection fields, similar to VSAI.

2.1. Drone-Based Datasets

To date, there are few drone-based datasets in the object detection field. Barekatain [23] proposed the Okutama-Action dataset for human action detection with the drone platform. It consists of 43 min of completely annotated video sequences, including 77,365 representative frames with 12 action types. The benchmarking IR dataset for surveillance with aerial intelligence (BIRDSAI) [24] is an object detection and tracking dataset captured with a TIR camera equipped on a fixed-wing UAV in many African protected areas. It consists of humans and animals (with resolutions of 640 × 480 pixels). The UAVDT dataset [25] is a large-scale vehicle detection and tracking dataset, which consists of 100 video sequences and 80,000 representative frames, overlapping various weather conditions, flying heights, and multiple common scenarios, including intersections, squares, toll stations, arterial roads, highways, and T-junctions. The VisDrone2018 [26] dataset is a large-scale visual object detection and tracking dataset, which includes 263 video sequences with 179,264 representative frames and 10,209 static images captured by multiple camera devices, using various drones, in over 14 Chinese cities. VisDrone2018 covered some common object types, such as cars, bicycles, pedestrians, and tricycles. VisDrone2019 [18,27], when compared to VisDrone2018, increased 25 long-term tracking video sequences with 82,644 frames in total, 12 of them were taken during the day and the rest at night.

2.2. Vehicle Object Datasets

Hsieh et al. [15] proposed a dataset (CARPK) for car counting, which contained 1448 images shot in parking lot scenes with aerial views (with 89,777 annotated instances). Multi-scale object detection in a high-resolution UAV images dataset (MOHR) [17] is a large-scale benchmark object detection dataset gathered by three cameras with resolutions of 5482 × 3078, 7360 × 4912, and 8688 × 5792, respectively. MOHR incorporated 90,014 object instances with five types, including cars, trucks, buildings, flood damages, and collapses. The UAV-based vehicle segmentation dataset (UVSD) [28] is a large-scale benchmark object detection–counting–segmentation dataset, which owns various annotation formats containing OBB, HBB, and pixel-level semantics. The drone vehicle dataset [18] is a large-scale object detection and counting dataset with both optics and thermal infrared (RGBT) images shot by UAVs. The multi-purpose aerial dataset (AU-AIR) [29] is a large-scale object detection dataset from multimodal sensors (including time, location, IMU, velocity, altitude, and visual) captured by UAVs, which are composed of eight categories—person, car, bus, van, truck, bike, motorbike, and trailer—under different lighting and weather conditions. The largest existing available aerial image dataset for object detection is DOTA [22], composed of 2806 images with 15 categories and about 188,282 bounding boxes annotated with Google Earth and satellite images. The EAGLE [30] dataset is composed of 8820 aerial images (936 × 936 pixels) gained by several flight campaigns from 2006 to 2019 at different times of the day and year with various weather and lighting conditions. It has 215,986 vehicle instances (including large vehicles and small vehicles). To our knowledge, it is the largest aerial dataset for vehicle detection.

2.3. Oriented Object Detection

Significant advances have been made in the last decade in detecting objects in aerial images, which are often allocated with large changes and random directions. However, most current methods are based on heuristically-defined anchors with various scales, angles, and aspect ratios, and typically undergo severe misalignments between anchor boxes (ABs) and axis-aligned convolution features, leading to the usual inconsistency between the category score and localization correctness.
To solve this issue, a single-shot alignment network (S²A-Net) [31] is proposed, which contains two units: a feature alignment module (FAM) for generating high-quality anchors and adaptively aligning the convolutional features, and an oriented detection module (ODM), with the goal of generating orientation-sensitive and orientation-invariant features to reduce the discrepancy between the localization and accuracy classification score.
To address the misalignment, the feature refinement module of the R3Det re-encodes the location parameters of the existing refined bounding box to the corresponding feature points through pixel-wise feature interpolation to accomplish feature reestablishment and alignment.
Meanwhile, another solution named the ROI transformer is put forward to address the above-mentioned problems. The key point of the ROI transformer is to exert spatial transformations on regions of interest (ROIs) and to learn the conversion parameters under the supervision of oriented bounding box (OBB) ground truth labels. To our knowledge, there is no specific algorithm for object detection under multiple perspectives of aerial images. So, we chose and altered the ROI transformer [32] as our baseline due to its higher localization accuracy for oriented object detection. Its specific principle will be introduced in Section 5.
Instead of directly regressing the four vertices, gliding vertices [33] regress four length ratios, describing the relative gliding offset on each resultant side, which can simplify the offset learning and avert ambiguity of sequential annotation points for oriented objects.
In general, there are abundant research studies [34,35,36] on down-view oriented object detection, but multi-view object detection is still in its infancy, which is also one of the areas we focus on in our follow-up research.

3. Overview of VSAI

In this section, we mainly explain the collection details of the entire VSAI dataset, the basis for category selection (small vehicle or large vehicle), and the annotation methods of the VSAI dataset.

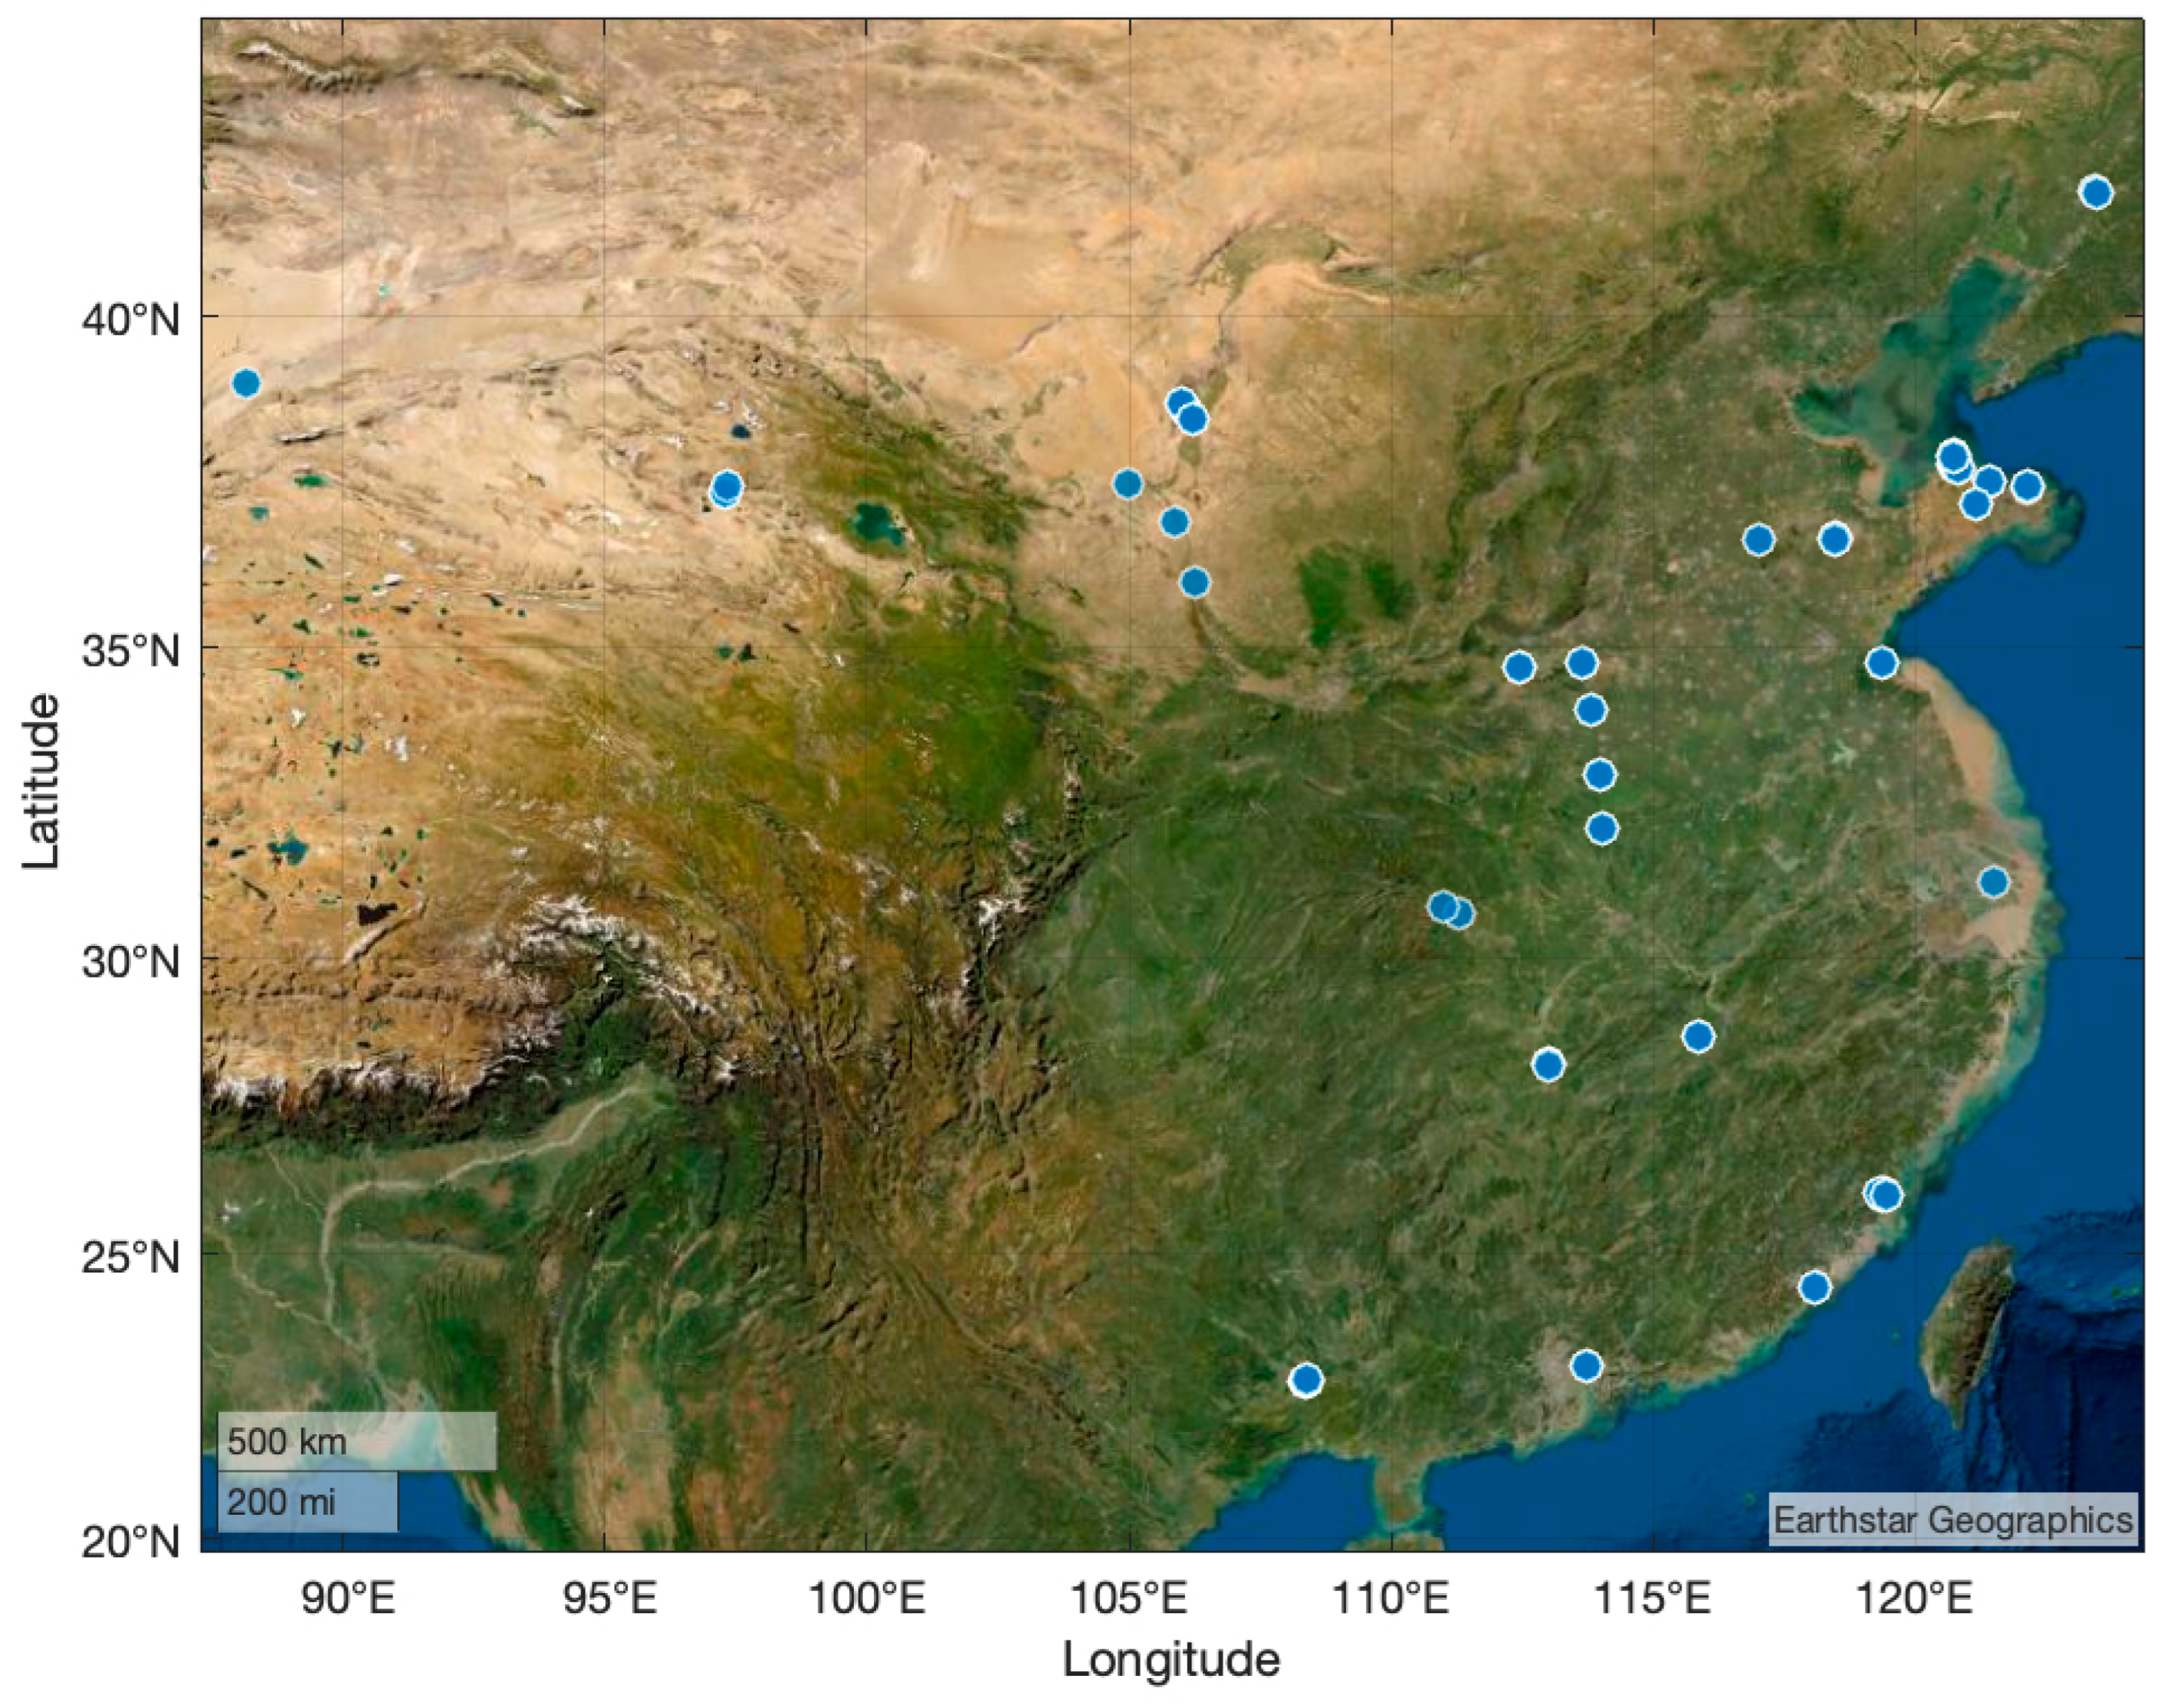
3.1. Image Collection

Our dataset consists of 444 static images (specifically for vehicle detection tasks). Images in our dataset were collected from DJI Mavic Air, DJI Mavic 2 pro, Phantom 3 Pro, Phantom 4, and a 4 RTK drone platform with a high-resolution camera; partial critical technical parameters (including image sensor size, camera field angle, and imagery resolution) of these drones are exhibited in Table 1.
To increase the divergence of data and overlay a wider geographical area, the VSAI dataset gathered images taken in most Chinese cities (including Shenyang, Weihai, Yantai, Weifang, Jinan, Lianyungang, Shanghai, Fuzhou, Xiamen, Zhengzhou, Luoyang, Yichang, Changsha, Guangzhou, Yinchuan, Guyuan, Xian, Delingha, Bayingolin from east to west, from north to south, etc.), as illustrated in Figure 2.
For shooting months shown in Figure 3a, this dataset covers the whole year. We captured the images with all-weather conditions, even the rare ice and snow scenarios as exhibited in Section 4.2. As for the shooting time displayed in Figure 3b, our dataset also basically covers the time range from 7 to 24 o’clock, except for 9 to 10 o’clock and 21 to 23 o’clock. Therefore, the VSAI dataset owns different images of light conditions as illustrated in Section 4.2, such as backlight, daylight, and night.

3.2. Category Selection

Since vehicles photographed at high altitudes are difficult to classify, the VSAI dataset focuses on the vehicle category, which constitutes two categories, as shown in Figure 4, small vehicles (SVs include cars, minibuses, pickups, small trucks, taxis, and police cars) and large vehicles (LVs, such as buses and large trucks), similar to DOTA and EAGLE. The VSAI dataset contains 47,519 small vehicles and 2193 large vehicles, which confirms the uneven distribution of vehicles in the real world.

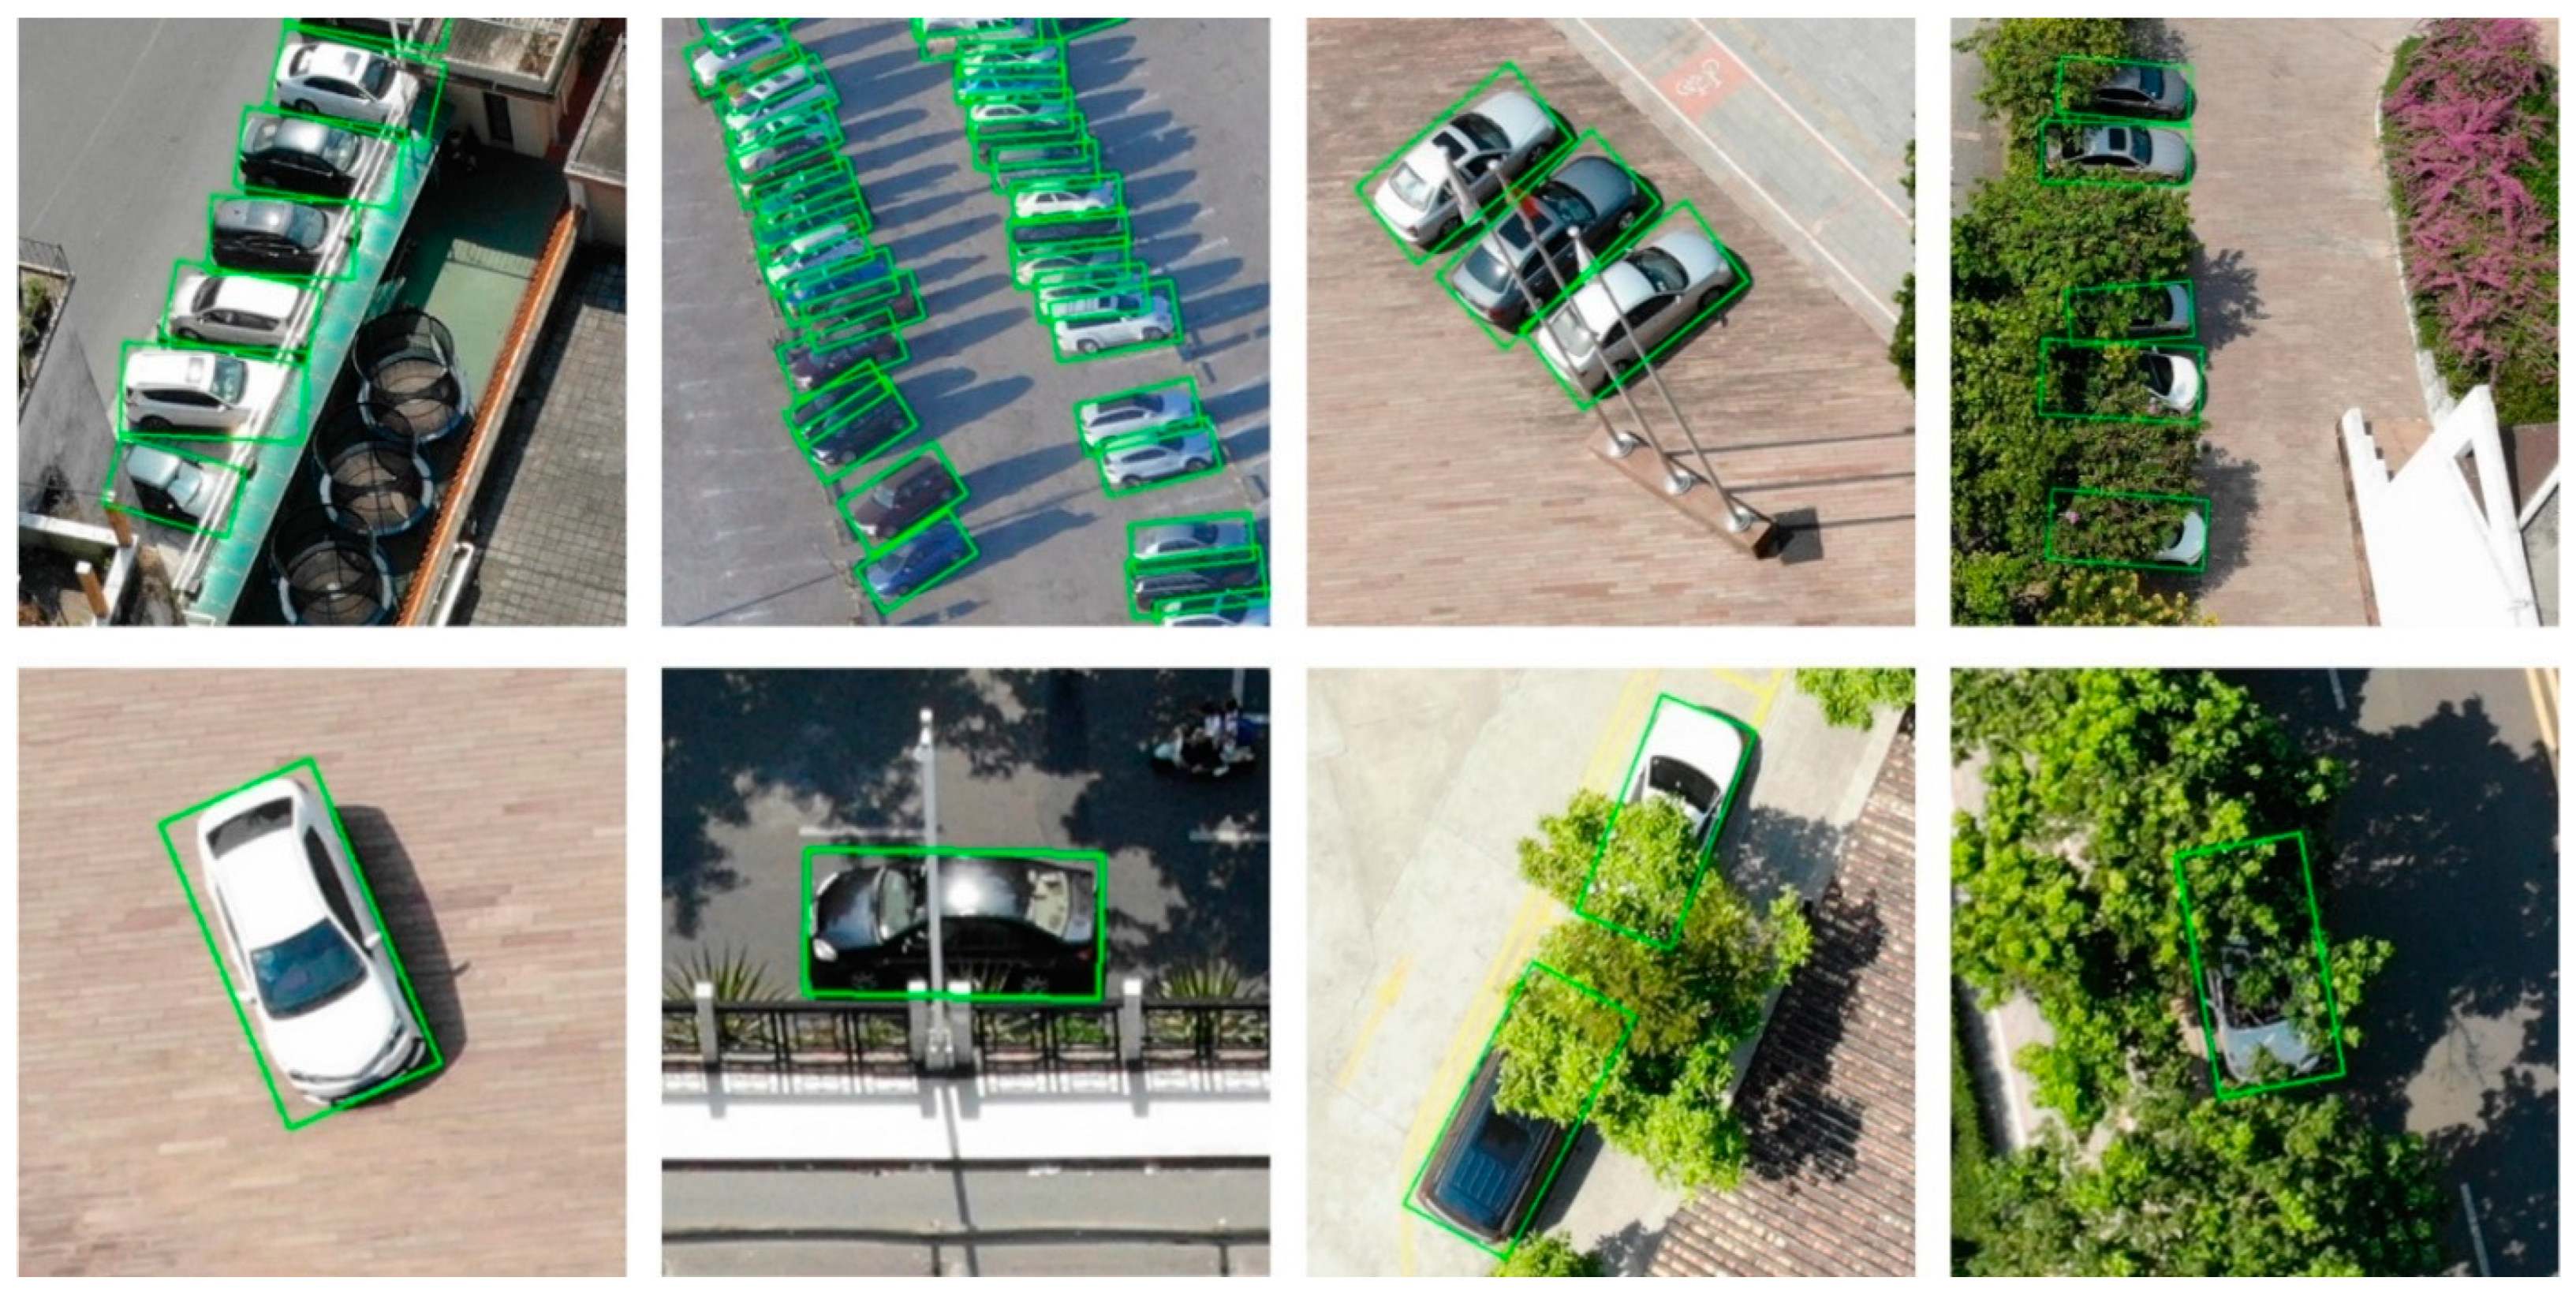
3.3. Annotation Method

This paper considers several methods of annotating. In computer vision, many visual concepts (including objects, region descriptions, relationships, etc.) are labeled with bounding boxes (BB) [37]. A popular presentation of bounding boxes is ( x c , y c , w , h ) , where ( x c , y c ) is the central location and ( w , h ) are the width and height of the bounding box, respectively.
However, the BB method cannot precisely annotate and outline the crowded objects with many orientations in aerial images because of the large overlap between bounding boxes. To settle this, we required searching for an annotation method adapted to oriented objects.
A choice for labeling oriented objects is the oriented bounding box, which is adopted in some text detection benchmarks [38], namely ( x c , y c , w , h , θ ) , where θ refers to the angle from the horizontal direction of the normal bounding box. In fact, the VSAI dataset uses the θ -based oriented bounding boxes (OBB) to annotate objects in the aerial images due to excellent adaptability to rotating targets.
Another alternative is arbitrary quadrilateral bounding boxes (QBB), which can be defined as { ( x i , y i ) , i = 1 , 2 , 3 , 4 } , where ( x i , y i ) refers to the positions of the bounding box apexes in the image. The vertices are arranged in clockwise order, choosing the left front vertices of vehicles as starting points, namely ( x 1 , y 1 ) . This way is widely adopted in oriented text detection benchmarks [39]. In comparison with θ -based-oriented bounding boxes, arbitrary quadrilateral bounding boxes could compactly enclose oriented objects with large deformations among different parts; the latter will also consume more time in labeling due to a higher amount of parameters. Therefore, we only adopted QBB for the instances at the image edges as illustrated in Figure 4, and chose the time-efficient way (OBB) for the rest.

4. Properties of VSAI
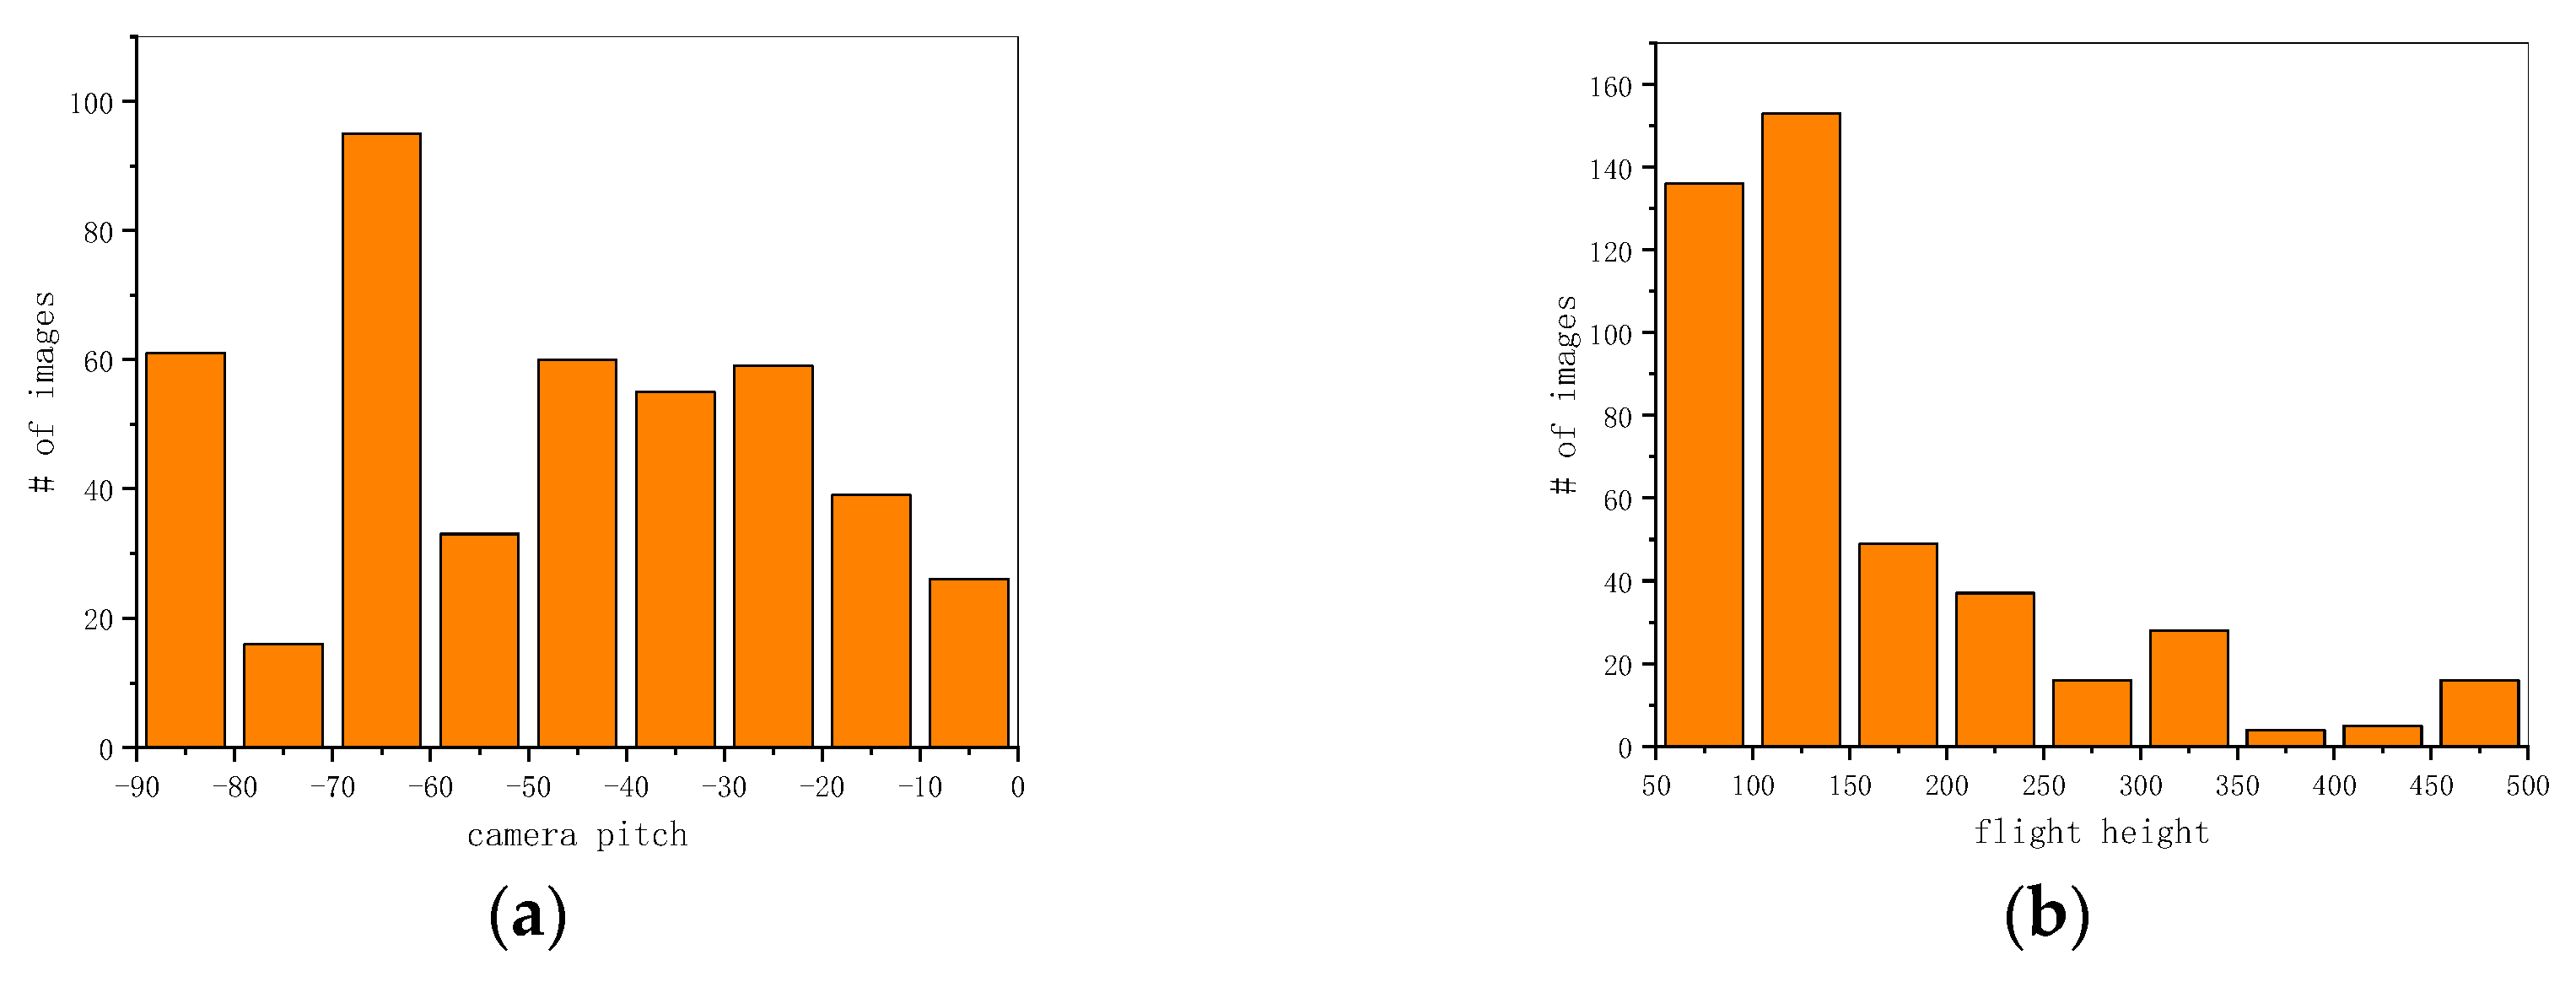
This section depicts the major characteristics of the proposed dataset VSAI, which consists of multi-view UAV images, object visibility information, and more instances in each image. These properties (in comparison to other datasets) are sequentially described.

4.1. Multi-View

The original sizes of the images in VSAI were 4000 × 3000, 4056 × 3040, and 5472 × 3648 pixels, which are particularly huge in comparison to regular natural datasets (e.g., PASCAL-VOC and MSCOCO are no more than 1 × 1 k). To approach the real application scenario, the images in VSAI were shot at various camera pitch angles and flight altitudes in the range of 0° to −90° (0° indicates that the camera points in the forward direction of the UAV; −90° refers to the bird’s-eye view) and from 54.5 to 499.4 m, respectively. As far as we know, extant drone datasets for object detection are rarely dedicated to collecting and labeling pictures from multiple views, namely distinct camera pitch angles and flight heights. This paper draws comparisons among MOHR [17], VisDrone2019 [27], Drone Vehicle [18], Okutama-Action [23], and VSAI to show the differences (Table 2). Note that, compared with our dataset’s multi-view drone images, for facilitating data acquisition, the current UAV dataset is mostly fixed with several heights and camera pitch angles.
We graphed the distribution histogram of the camera pitch angles and flight heights of our dataset. As shown in Figure 5, due to careful selection, the distributions of the camera pitch angles were relatively uniform. However, because of the law restricting flight above 120 m, in most Chinese cities, the flight altitudes were generally concentrated between 100 and 200 m in VSAI. In contrast, images taken from 200 to 500 m were mainly centered in the suburbs, accounting for a relatively low proportion of VSAI. Moreover, due to the scale and shape changes of objects attributed to multi-view UAV images as shown in Figure 1, object detection tasks are closer to reality, but they simultaneously become extremely difficult.
In the VSAI dataset, the instances with line of sight (LOS) angles of (−30°, −25°) were the largest, as illustrated in Figure 6. Overall, the LOS angle distribution of the number of instances was not balanced, mainly concentrating on small observation angles in the range of (−45°, −15°).
The main reason for this distribution is that the camera pitch angle decreases; that is, as the camera’s line of sight gradually approaches the horizontal plane, the larger the ground scene range corresponding to the image area of the same size, the farther the observation distance, and the more object instances can be included, resulting in more objects corresponding to the smaller oblique line of sight angles when there is no significant difference in the number of images at different pitch angles (Figure 7). This shows that the object instances are unevenly distributed with the observation line of sight angle under the multi-view observation condition. At the same time, this observation method will lead to large object scale variations and image blurring, which increases the difficulty of object recognition.

4.2. Complex Scenarios

Apart from the more extensive regional distribution, as shown in Figure 8, VSAI also covers six complicated scenes throughout China, including the desert, city, mountain, suburb, riverside, and seaside, as illustrated in Figure 8. The six scenarios also contain many subsets, such as cities, including the overhead bridge, crossroad, stadium, riverside embracing dam, bridge, etc. Observing Figure 8, VSAI essentially covers the vast majority of real-world complex scenarios, rather than the single urban scenario of other datasets. Meanwhile, aerial images of the VSAI dataset in multiple views are totally different from traditional down-view airborne imageries, because the former have more small targets, instances of occlusion, and larger-scale transformations of targets (as exhibited in Figure 8), which are closer to the complexities of the real-world.
The statistical histogram of the VSAI scene distribution is shown in Figure 9. It is obvious that the urban scenario accounts for half of the VSAI dataset. The other five scenarios make up the other half. The histogram of the VSAI scene distribution exhibits the complexities of the VSAI dataset.
Except for the weakness of a single scene, most existing datasets also ignored the influence of the natural environment and variations in illumination. However, the VSAI dataset considered complicated scenarios with diverse lighting conditions (such as daylight, backlight, and night) and interference from harsh natural environments (fog, snow cover, and sea ice), some examples of labeled images are shown in Figure 10.

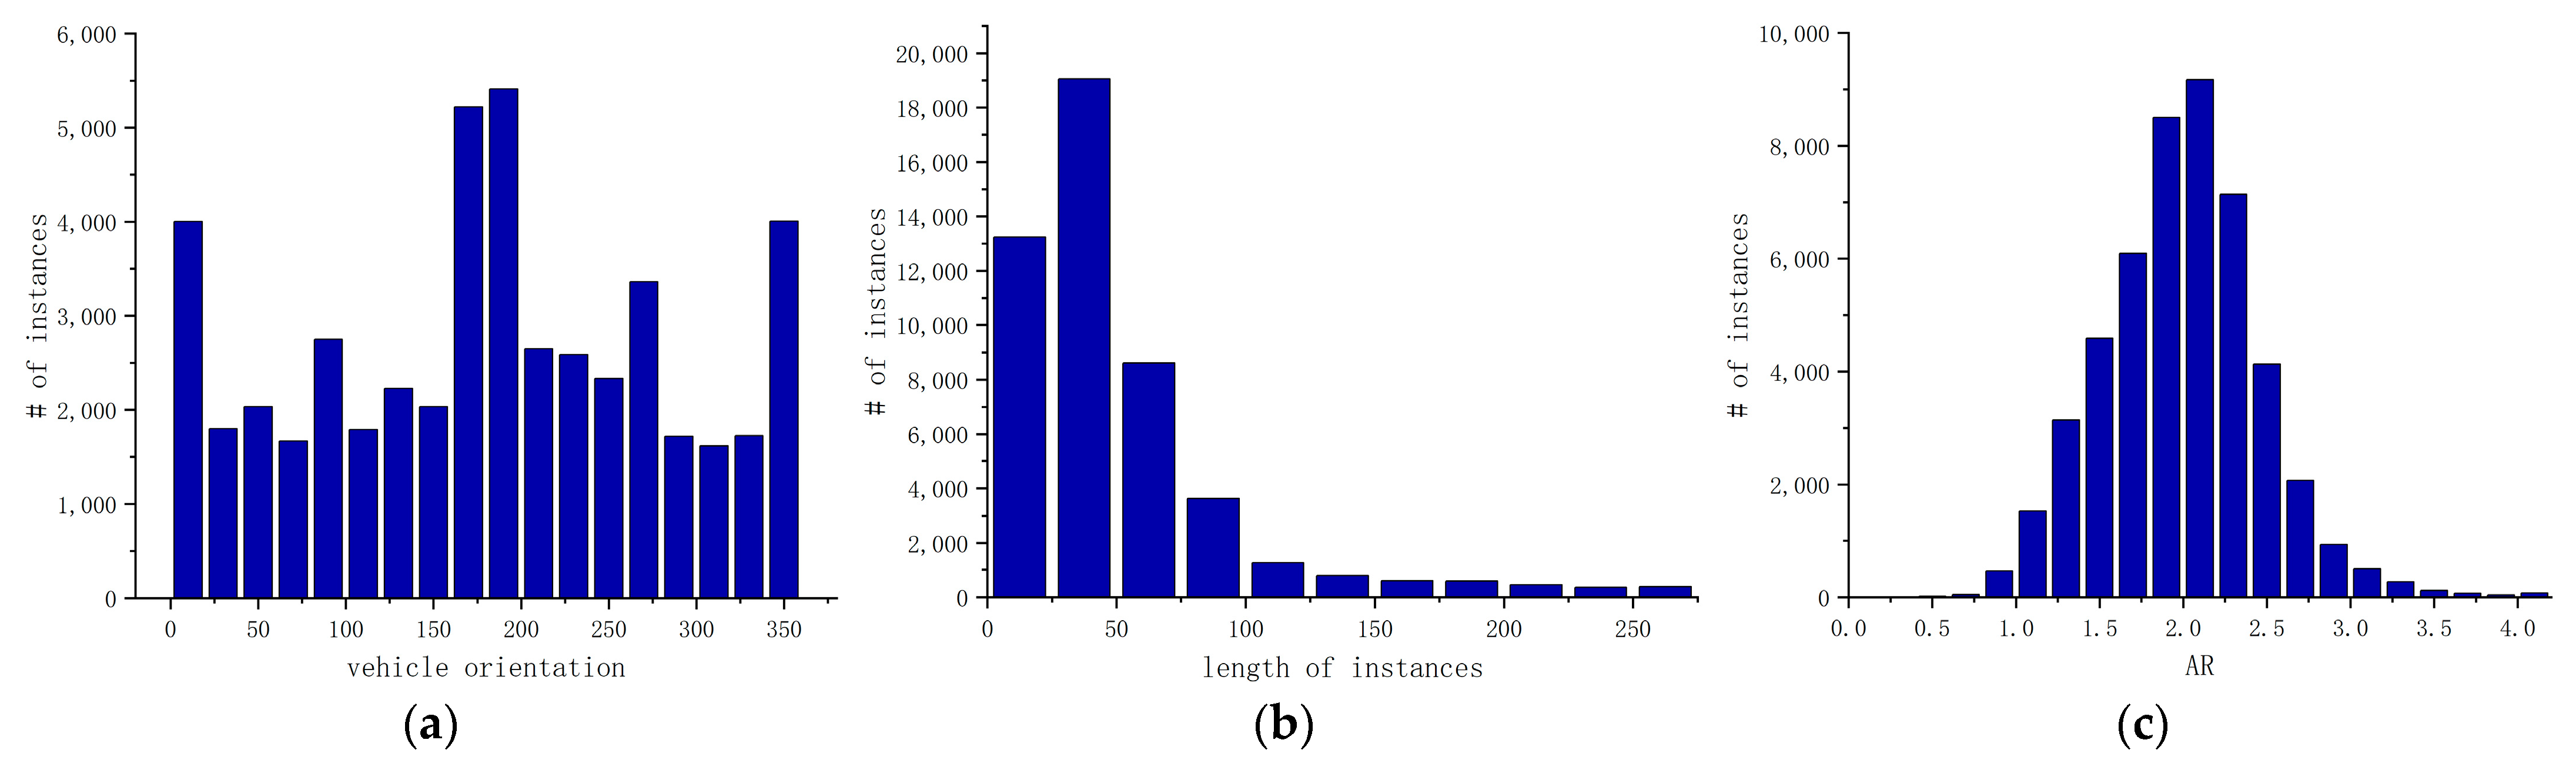
4.3. Vehicle Statistics

We collected statistical information about the vehicles, including the vehicle’s orientation angles, instance length, and vehicle aspect ratio, as illustrated in Figure 11. Because of careful selection, we gained relatively uniform distributions of rotation angles, as shown in Figure 11a. Noting Figure 11b, the lengths of the vehicles were concentrated in the range of 0 to 75 pixels, signifying that there were numerous small instances in the VSAI dataset. At the same time, there was a considerable scale change in VSAI, as shown in Figure 11b. In addition, distinct perspectives also resulted in a wider range of the vehicle aspect ratio rather than the aspect ratio of 2 or so in traditional down-view aerial images.

4.4. Object Occlusion Ratio

Additionally, VSAI provides useful annotations with respect to the occlusion ratio (the distribution of the occlusion ratio is shown in Figure 12). In this case, we used the proportion of vehicles being blocked to represent the occlusion ratio and define four levels of occlusions: no occlusion (occlusion ratio 0%), small occlusion (occlusion ratio < 30%), moderate occlusion (occlusion ratio 30~70%), and large occlusion (occlusion ratio > 70%), mainly for better reflecting the instance density of the instance location. The examples of different occlusion ratios are exhibited in the second line of Figure 13.
Reasons for occlusion in multi-view and down-view aerial images are completely disparate. There are a couple of block types in multi-view aerial images that will never exist in down-view airborne imageries, such as occluded by a building, being blocked by other vehicles, or being sheltered by shafts, such as flags (first line of Figure 13). Due to more types of occlusions, there are more hardships for multi-view aerial images to detect objects accurately in comparison with the down-view ones, which means the former is closer to real-world complicacies.

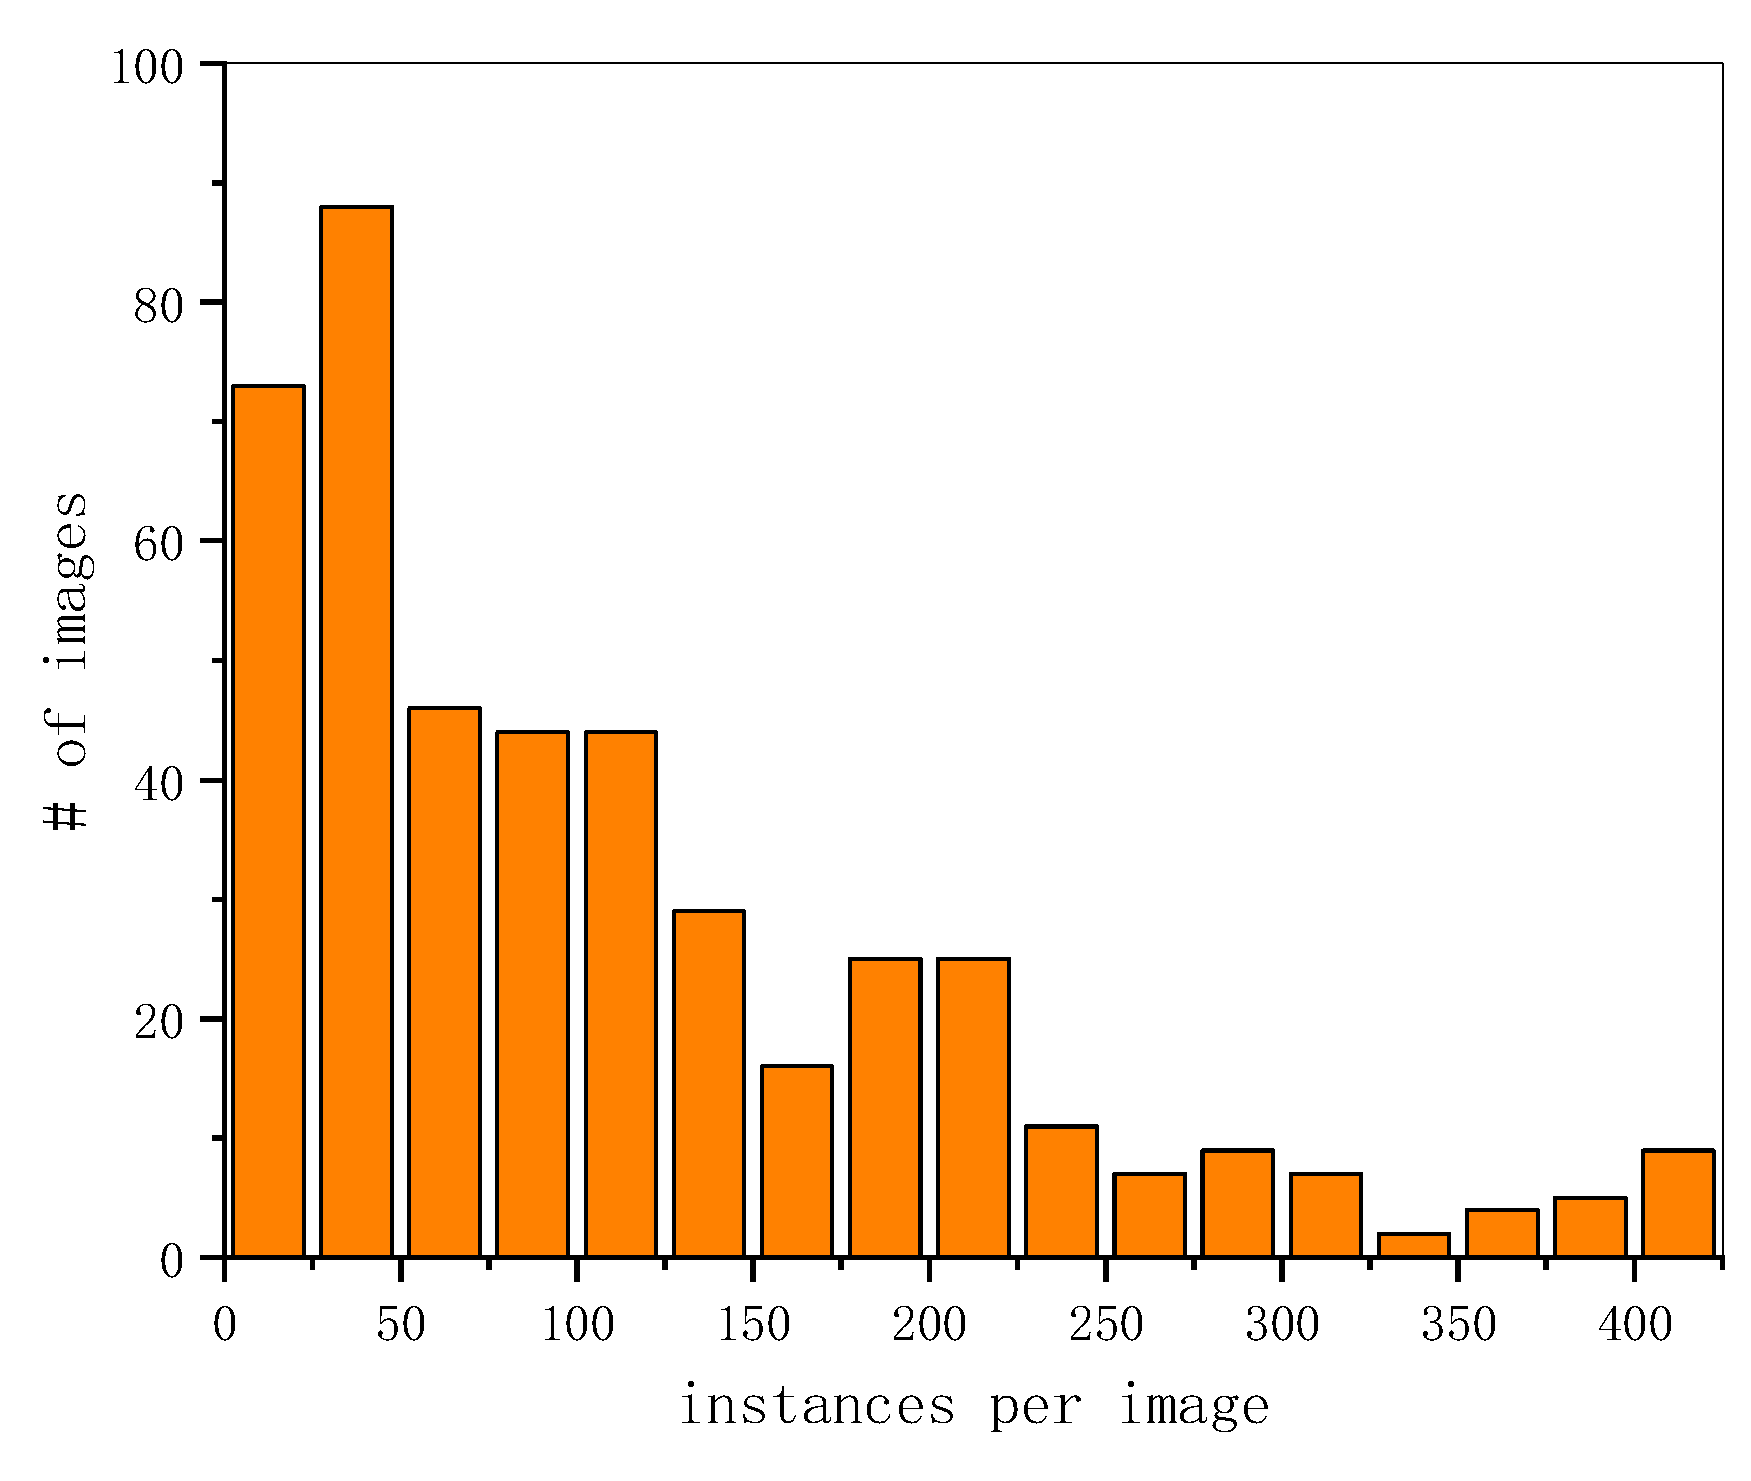
4.5. Average Instances

It is common for UAV images to include plenty of instances (but seldom for general images). However, for aerial datasets, UAVDT images [25] only have 10.52 instances on average. DOTA has 67.10. Our dataset VSAI is much larger in instances per image, which can be up to 111.96. Figure 14 shows the histogram of the number of instances per image in our VSAI dataset. Although the numbers of images and instances of VSAI are less than most other datasets, the average number of instances in each image is much greater than most other datasets, as illustrated in Table 3, except for DLR-3K-Vehicle [40], which only has 20 images.

5. Method

We benchmarked the current object detection methods based on OBB with VSAI in the evaluation section (below). Moreover, we selected and altered the ROI transformer [32] as our baseline because of its higher localization accuracy for oriented object detection.
When detecting dense objects in aerial images, algorithms based on horizontal proposals for natural object detection always lead to mismatches between regions of interest (ROIs) and objects. The ROI transformer is proposed for addressing this; it contains two parts, RROI learner and RROI warping. In this section, we briefly introduce two parts of the ROI transformer and the ResNeSt backbone, the alternative to ResNet in this paper.

5.1. RROI Learner

The purpose of the RROI learner is to learn to rotate ROIs (RROIs) from the feature map of horizontal ROIs (HROIs). We have HROIs in the form of ( x , y , w , h ) for predicted 2D coordinates and the width and height of a HROI; the corresponding feature maps are defined as { F i } . Because ideally a single HROI is the circumscribed rectangle of the RROI, the ROI learner attempts to infer the geometric parameters of RROIs from F i by fully connected layers with dimensions of 5, regressing the offsets of rotated ground truths (RGTs) relative to HROI; the regression targets are shown as
t x g t = 1 w r ( ( x g t x r ) cos θ r + ( y g t y r ) sin θ r ) , t y g t = 1 h r ( ( y g t y r ) cos θ r ( x g t x r ) sin θ r ) , t w g t = log w g t w r , t h g t = log h g t h r , t θ g t = 1 2 π ( ( θ g t θ r ) mod 2 π )
where ( x r , y r , w r , h r , θ r ) represents the location, width, length, and rotation of a RROI and ( x g t , y g t , w g t , h g t , θ g t ) stands for the ground truth parameters of an OBB. For deriving Equation (1), the ROI learner utilizes the local coordinate systems bound to RROIs instead of the global coordinate system bound to the image.
The output vector ( t x , t y , t w , t h , t θ ) of the fully connected layer is represented as follows
t = C ( ; Θ )
where C is the fully connected layer, is the feature map for every HROI, and Θ represents the weight parameters of C .
Once an input HROI matches with a ground truth of OBB, t g t is set by the description in Equation (1). The smooth L1 loss function [41] is used for the regression loss. The predicted t is decoded from offsets to the parameters of RROI. In other words, the RROI learner learns the parameters of RROI from the HROI feature map .

5.2. RROI Warping

Based on the RROI parameters learned by the RROI learner, RROI warping extracts the rotation-invariant deep features for oriented object detection. The module of the rotated position sensitive (RPS) ROI align [32] is proposed as the specific RROI warping, which divides the RROI into K × K bins and exports a feature map Y of the shape ( K , K , C ) ; for the bin’s index ( i , j ) ( 0 i , j < K ) of the output channel c ( 0 c < C ) , we have
Y c ( i , j ) = ( x , y ) b i n ( i , j )   D i , j , c ( T θ ( x , y ) ) n
where D i , j , c is the feature map from the K × K × C feature maps. The n × n denotes the number of sampling locations in the bin. The b i n ( i , j ) represents the coordinates set { i w r k + ( s x + 0.5 ) w r k × n ; s x = 0 , 1 , n 1 } × { j h r k + ( s y + 0.5 ) h r k × n ; s y = 0 , 1 , n 1 } . Moreover, each ( x , y ) b i n ( i , j ) is transformed to ( x , y ) by T θ , where
( x y ) = ( cos θ sin θ sin θ cos θ ) ( x w r / 2 y h r / 2 ) + ( x r y r )
Equation (3) is realized by bilinear interpolation.
The combination of the RROI learner and RROI warping replaces the normal ROI warping, which provides better initialization of RROIs. In turn, it achieves better results in rotating object detection.

5.3. Architecture of ROI Transformer

The main architecture of the ROI transformer is composed of three parts—the backbone, neck, and head networks. We chose the ResNeSt50 backbone to replace ResNet50 in our baseline for extracting features, and the batch size was set to 2. FPN was selected as the neck network to integrate the feature output of the backbone efficiently, whose input channels were set as C i n = [ 256 ,   512 ,   1024 ,   2048 ] , output channels C o u t = 256 . The head network includes the RPN head and the ROI transformer head. We used five scales { 32 2 , 64 2 , 128 2 , 256 2 , 512 2 } and three aspect ratios { 1 / 2 , 1 , 2 } , yielding k = 20 anchors for the RPN head network initialization. The ROI head adopted the ROI transformer described in the previous subsection; we used the Smooth L1 loss [41] function for the bounding box regression loss and the cross-entropy loss function for the category loss. The IOU threshold was set as 0.5. We trained the model in 40 epochs for VSAI. The SGD optimizer was adopted with an initial learning rate of 0.0025, the momentum of 0.9, and weight decay of 0.0001. We used the learning rate warm-up for 500 iterations.

5.4. ResNeSt

ResNeSt accomplished an architectural alteration of ResNet, merging feature map split attention within the separate network blocks. Specifically, each block partitioned the feature map into multiple groups (along the channel dimension) and finer-grained subgroups or splits with each group’s feature representation determined via a weighted combination of the split representations (with weights determined in accordance with global context information). The resulting unit is defined as a split attention block. By stacking some split attention blocks, we gained ResNeSt (S means “Split”).
Based on the ResNeXt blocks [42] that divide the feature into K groups (namely “cardinality” hyperparameter K ), ResNeSt (Figure 15) introduces a new “Radix” hyperparameter R , which means a split number within a “cardinality” group. Therefore, the total number of feature-map groups is G = K R . The group alteration is a 1 × 1 convolution layer followed by a 3 × 3 convolution layer. The attention function is composed of a global pooling layer and two fully connected layers followed by SoftMax in the “cardinal” dimension.
ResNeSt combines the advantage of the “cardinality” group in ResNeXt and the “selective kernel” in SKNets [43], and achieves a state-of-the-art performance compared to all existing ResNet variants, as well as brilliant speed–accuracy trade-offs. Therefore, we chose the ResNeSt backbone to replace ResNet in this paper.

6. Evaluations

6.1. Dataset Split and Experimental Setup

To ensure that the distribution of vehicles in the training, validation, and test sets was approximately balanced, we randomly assigned images with 1/2, 1/6, and 1/3 instances to the training, validation, and test sets, respectively. To facilitate training, the initial images were cropped into the patches with two methods. For the single-scale segmentation method, the size of the patch was 1024 × 1024 pixels, with 200-pixel gaps in the sliding window, leading to 5240, 1520, and 2315 patches of the training, validation, and test sets, respectively, set according to the input size of the DOTA dataset [22]. For the multi-scale segmentation method, the original images were cropped into 682 × 682, 1024 × 1024 and 2048 × 2048 pixels with 500-pixel gaps, resulting in 33,872, 9841, and 14,941 patches of the training, validation, and test sets, respectively. Moreover, this paper evaluated all of the models on NVIDIA GeForce GTX 2080 Ti with PyTorch version 1.6.0.

6.2. Experimental Baseline

We benchmarked the current object detection methods based on OBB with VSAI. In this research, based on the features of VSAI (such as numerous small instances, huge scale changes, and occlusion), we carefully selected rotated Faster R-CNN [44], oriented R-CNN [34], rotated RetinaNet [45], and gliding vertex [33] as our benchmark testing methods due to their wonderful performances on object detection with arbitrary orientations. We chose and altered the ROI transformer [32] as our baseline. We followed the same implementations of these models released by their original developers. Except for the ROI transformer, we modified the backbone network from ResNet50 [46] to ResNeSt50 [47] to obtain better feature extraction results. All codes of the baseline selected in this paper are based on MMRotate [48], available at https://github.com/open-mmlab (accessed on 27 April 2022).

6.3. Experimental Analysis

By exploring the results illustrated in Figure 16, one could see that the OBB detection is still challenging in relation to tiny instances, densely arranged areas, and occlusions in aerial images. In Figure 16, we provide a comparison of small and large vehicle detection with different ROI transformer methods (distinct backbones and split ways). As shown in Figure 16, the unbalanced dataset (the number of small vehicles being much higher than the large vehicles) led to less accuracy of the algorithms in large-vehicle detection compared to small-vehicle detection. Observing the first column in Figure 16, we notice that the models with ResNeSt50, random rotation, and multi-scale split more accurately framed the large vehicle, because the former owns the more powerful feature extraction capability in contrast with ResNet50 and the latter possesses more large-vehicle instances. Whether it is single-scale or multi-scale or ResNet50 or ResNeSt50 models—for large-size vehicles, as shown in the middle column in Figure 16, it precisely detects (even in the shadows and occlusions). As demonstrated in the last column, under reverse light conditions, although the multi-scale split and ResNeSt50 are better than the single-scale split and the ResNet50, the three models completely miss many minor targets. The results are not satisfying, implying the high hardship of this task.
In Table 4, we show the quantitative results of the experiments. Analyzing the results exhibited in Table 4, performances in categories of small vehicles and large vehicles are far from satisfactory, attributed to the former’s small size and the scarcity of the latter in aerial images. Overall, a two-stage network is generally better than a one-stage network, except for S²A-Net and SASM. The former relies on FAM and ODM units to achieve better positioning accuracy by reducing the misalignment between anchor boxes (ABs) and axis-aligned convolution features. The latter obtains better sampling selection results through SA-S and SA-S strategies. Therefore, these two single-stage networks achieve similar results to two-stage networks. It is worth noting that simply replacing the ResNet50 backbone of the ROI transformer with ResNeSt50 improved the mAP by 4.1% and 0.7% for single-scale and multi-scale splits, respectively, which proves the effectiveness of the split-attention module in the ResNeSt50 backbone. An unbalanced dataset contributed to the lower accuracy of all the models in large-vehicle detection in comparison with small-vehicle detection. To summarize, although our baseline of the ROI transformer (adopting ResNeSt50, multi-scale split, and random rotation) achieved the best performances (64.9% mAP, 79.4% average precision (AP) for small vehicles, and 50.4% AP for large vehicles), among the state-of-the-art algorithms used in this paper, object detection in multi-view aerial images was far from satisfactory. Object detection in aerial images under various perspectives needs to be further developed.
In Figure 17, we provide several examples of fault detection and leak detection with our baseline. As shown in Figure 17, it is still pretty hard for the state-of-the-art methods to gain great detection results due to the complex scenes in the VSAI dataset. The model misidentified the neon lights of buildings and blue blocks of roofs and arches, as large vehicles. Motion blur vehicles at night, buses in close rows, and oblique photography of tiny vehicles in the distance were not successfully detected.

6.4. Cross-Dataset Validation

We completed a cross-dataset generalization experiment to validate the generalization ability of the VSAI dataset. We chose DOTA [22] for comparison and its test set for testing. We selected the ROI transformer models with the baseline of the VSAI dataset for generalization experiments with OBB ground truth. Table 5 shows that a model trained on VSAI generalizes well to DOTA, scoring 10% mAP over a model trained on DOTA and tested on VSAI, which indicates that VSAI contains a wider range of features in comparison to DOTA. At the same time, it reveals that VSAI is particularly more complex and challenging than the current available down-view datasets, which makes it suitable for real-world complicated vehicle detection scenarios.

7. Conclusions

We presented VSAI, a UAV dataset for targeting vehicle detection in aerial photography, whose number of instances per image is multiple times higher than existing datasets. Unlike common object detection datasets, we provided every annotated image with camera pitch angles and flight height of drones. We built a dataset highly relevant to real-world scenarios, which included multiple scenarios in aerial images, such as time, weather, illuminative situation, camera view, landform, and season. Our benchmarks illustrated that VSAI is a challenging dataset for the current state-of-the-art orientated detection models; our baseline achieved 64.9% mAP, which is 79.4% the average precision (AP) and 50.4% the AP for small and large vehicles. The cross-dataset validation showed that models trained with pure down-view images could not adapt to multi-angle datasets. On the contrary, VSAI could cover the features of straight-down datasets, such as DOTA. We believe that VSAI contributes to remote sensing target detection (closer to reality). It also introduces novel challenges to the vehicle detection domain.

Author Contributions

J.W. (Jinghao Wang) and X.T. are the co-first authors of the article. Conceptualization, J.W. (Jinghao Wang) and X.T.; methodology, J.W. (Jiaqi Wei); software, J.W. (Jinghao Wang); validation, Z.L. and Q.Y.; formal analysis, X.T.; investigation, Z.L.; resources, J.W. (Jiaqi Wei); data curation, Y.B.; writing—original draft preparation, J.W. (Jinghao Wang); writing—review and editing, J.W. (Jinghao Wang); visualization, X.T.; supervision, Y.B.; project administration, J.W. (Jiaqi Wei); funding acquisition, Z.L. All authors have read and agreed to the published version of the manuscript.

Funding

This research was funded by the National Natural Science Funding of China (no. 61801491).

Data Availability Statement

The download link for the VSAI dataset is publicly available at www.kaggle.com/dronevision/VSAIv1 (accessed on 31 May 2022).

Conflicts of Interest

The funders had no role in the design of the study; in the collection, analyses, or interpretation of data; in the writing of the manuscript, or in the decision to publish the results.

References

  1. Everingham, M.; Van Gool, L.; Williams, C.K.; Winn, J.; Zisserman, A. The pascal visual object classes (voc) challenge. Int. J. Comput. Vis. 2010, 88, 303–338. [Google Scholar] [CrossRef] [Green Version]
  2. Russakovsky, O.; Deng, J.; Su, H.; Krause, J.; Satheesh, S.; Ma, S.; Huang, Z.; Karpathy, A.; Khosla, A.; Bernstein, M. Imagenet large scale visual recognition challenge. Int. J. Comput. Vis. 2015, 115, 211–252. [Google Scholar] [CrossRef] [Green Version]
  3. Lin, T.-Y.; Maire, M.; Belongie, S.; Hays, J.; Perona, P.; Ramanan, D.; Dollár, P.; Zitnick, C.L. Microsoft coco: Common objects in context. In Proceedings of the European Conference on Computer Vision, Zurich, Switzerland, 6–12 September 2014; pp. 740–755. [Google Scholar]
  4. Lin, Y.; He, H.; Yin, Z.; Chen, F. Rotation-invariant object detection in remote sensing images based on radial-gradient angle. IEEE Geosci. Remote Sens. Lett. 2014, 12, 746–750. [Google Scholar]
  5. Liu, Z.; Wang, H.; Weng, L.; Yang, Y. Ship rotated bounding box space for ship extraction from high-resolution optical satellite images with complex backgrounds. IEEE Geosci. Remote Sens. Lett. 2016, 13, 1074–1078. [Google Scholar] [CrossRef]
  6. Cheng, G.; Zhou, P.; Han, J. Rifd-cnn: Rotation-invariant and fisher discriminative convolutional neural networks for object detection. In Proceedings of the IEEE Conference on Computer Vision and Pattern Recognition, Las Vegas, NV, USA, 27–30 June 2016; pp. 2884–2893. [Google Scholar]
  7. Moranduzzo, T.; Melgani, F. Detecting cars in UAV images with a catalog-based approach. IEEE Trans. Geosci. Remote Sens. 2014, 52, 6356–6367. [Google Scholar] [CrossRef]
  8. Zhang, F.; Du, B.; Zhang, L.; Xu, M. Weakly supervised learning based on coupled convolutional neural networks for aircraft detection. IEEE Trans. Geosci. Remote Sens. 2016, 54, 5553–5563. [Google Scholar] [CrossRef]
  9. Wang, G.; Wang, X.; Fan, B.; Pan, C. Feature extraction by rotation-invariant matrix representation for object detection in aerial image. IEEE Geosci. Remote Sens. Lett. 2017, 14, 851–855. [Google Scholar] [CrossRef]
  10. Wan, L.; Zheng, L.; Huo, H.; Fang, T. Affine invariant description and large-margin dimensionality reduction for target detection in optical remote sensing images. IEEE Geosci. Remote Sens. Lett. 2017, 14, 1116–1120. [Google Scholar] [CrossRef]
  11. Ok, A.O.; Senaras, C.; Yuksel, B. Automated detection of arbitrarily shaped buildings in complex environments from monocular VHR optical satellite imagery. IEEE Trans. Geosci. Remote Sens. 2012, 51, 1701–1717. [Google Scholar] [CrossRef]
  12. Long, Y.; Gong, Y.; Xiao, Z.; Liu, Q. Accurate object localization in remote sensing images based on convolutional neural networks. IEEE Trans. Geosci. Remote Sens. 2017, 55, 2486–2498. [Google Scholar] [CrossRef]
  13. Hong, D.; Yokoya, N.; Chanussot, J.; Zhu, X.X. An augmented linear mixing model to address spectral variability for hyperspectral unmixing. IEEE Trans. Image Process. 2018, 28, 1923–1938. [Google Scholar] [CrossRef] [PubMed] [Green Version]
  14. Torralba, A.; Efros, A.A. Unbiased look at dataset bias. In Proceedings of the CVPR 2011, Colorado Springs, CO, USA, 20–25 June 2011; pp. 1521–1528. [Google Scholar]
  15. Hsieh, M.-R.; Lin, Y.-L.; Hsu, W.H. Drone-based object counting by spatially regularized regional proposal network. In Proceedings of the IEEE International Conference on Computer Vision, Venice, Italy, 27–29 October 2017; pp. 4145–4153. [Google Scholar]
  16. Li, S.; Yeung, D.-Y. Visual object tracking for unmanned aerial vehicles: A benchmark and new motion models. In Proceedings of the Thirty-First AAAI Conference on Artificial Intelligence, San Francisco, CA, USA, 4–9 February 2017. [Google Scholar]
  17. Zhang, H.; Sun, M.; Li, Q.; Liu, L.; Liu, M.; Ji, Y. An empirical study of multi-scale object detection in high resolution UAV images. Neurocomputing 2021, 421, 173–182. [Google Scholar] [CrossRef]
  18. Zhu, P.; Sun, Y.; Wen, L.; Feng, Y.; Hu, Q. Drone based rgbt vehicle detection and counting: A challenge. arXiv 2020, arXiv:2003.02437. [Google Scholar]
  19. Robicquet, A.; Sadeghian, A.; Alahi, A.; Savarese, S. Learning social etiquette: Human trajectory prediction in crowded scenes. In Proceedings of the European Conference on Computer Vision (ECCV), Glasgow, UK, 23–28 August 2020. [Google Scholar]
  20. Zhu, H.; Chen, X.; Dai, W.; Fu, K.; Ye, Q.; Jiao, J. Orientation robust object detection in aerial images using deep convolutional neural network. In Proceedings of the 2015 IEEE International Conference on Image Processing (ICIP), Quebec City, QC, Canada, 27–30 September 2015; pp. 3735–3739. [Google Scholar]
  21. Cheng, G.; Han, J.; Zhou, P.; Xu, D. Learning rotation-invariant and fisher discriminative convolutional neural networks for object detection. IEEE Trans. Image Process. 2018, 28, 265–278. [Google Scholar] [CrossRef]
  22. Xia, G.-S.; Bai, X.; Ding, J.; Zhu, Z.; Belongie, S.; Luo, J.; Datcu, M.; Pelillo, M.; Zhang, L. DOTA: A large-scale dataset for object detection in aerial images. In Proceedings of the IEEE Conference on Computer Vision and Pattern Recognition, Salt Lake City, UT, USA, 18–23 June 2018; pp. 3974–3983. [Google Scholar]
  23. Barekatain, M.; Martí, M.; Shih, H.F.; Murray, S.; Prendinger, H. Okutama-Action: An Aerial View Video Dataset for Concurrent Human Action Detection. In Proceedings of the 2017 IEEE Conference on Computer Vision and Pattern Recognition Workshops (CVPRW), Honolulu, HI, USA, 21–26 July 2017. [Google Scholar]
  24. Bondi, E.; Jain, R.; Aggrawal, P.; Anand, S.; Hannaford, R.; Kapoor, A.; Piavis, J.; Shah, S.; Joppa, L.; Dilkina, B. BIRDSAI: A dataset for detection and tracking in aerial thermal infrared videos. In Proceedings of the IEEE/CVF Winter Conference on Applications of Computer Vision, Snowmass, CO, USA, 1–5 March 2020; pp. 1747–1756. [Google Scholar]
  25. Du, D.; Qi, Y.; Yu, H.; Yang, Y.; Duan, K.; Li, G.; Zhang, W.; Huang, Q.; Tian, Q. The unmanned aerial vehicle benchmark: Object detection and tracking. In Proceedings of the European Conference on Computer Vision (ECCV), Munich, Germany, 8–14 September 2018; pp. 370–386. [Google Scholar]
  26. Zhu, P.; Wen, L.; Bian, X.; Ling, H.; Hu, Q. Vision meets drones: A challenge. arXiv 2018, arXiv:1804.07437. [Google Scholar]
  27. Zhu, P.; Wen, L.; Du, D.; Bian, X.; Hu, Q.; Ling, H. Vision meets drones: Past, present and future. arXiv 2020, arXiv:2001.06303. [Google Scholar]
  28. Zhang, W.; Liu, C.; Chang, F.; Song, Y. Multi-scale and occlusion aware network for vehicle detection and segmentation on uav aerial images. Remote Sens. 2020, 12, 1760. [Google Scholar] [CrossRef]
  29. Bozcan, I.; Kayacan, E. Au-air: A multi-modal unmanned aerial vehicle dataset for low altitude traffic surveillance. In Proceedings of the 2020 IEEE International Conference on Robotics and Automation (ICRA), Paris, France, 31 May–31 August 2020; pp. 8504–8510. [Google Scholar]
  30. Azimi, S.M.; Bahmanyar, R.; Henry, C.; Kurz, F. Eagle: Large-scale vehicle detection dataset in real-world scenarios using aerial imagery. In Proceedings of the 2020 25th International Conference on Pattern Recognition (ICPR), Milan, Italy, 10–15 January 2021; pp. 6920–6927. [Google Scholar]
  31. Han, J.; Ding, J.; Li, J.; Xia, G.-S. Align deep features for oriented object detection. IEEE Trans. Geosci. Remote Sens. 2021, 60, 1–11. [Google Scholar] [CrossRef]
  32. Ding, J.; Xue, N.; Long, Y.; Xia, G.-S.; Lu, Q. Learning roi transformer for oriented object detection in aerial images. In Proceedings of the IEEE/CVF Conference on Computer Vision and Pattern Recognition, Long Beach, CA, USA, 15–20 June 2019; pp. 2849–2858. [Google Scholar]
  33. Xu, Y.; Fu, M.; Wang, Q.; Wang, Y.; Chen, K.; Xia, G.-S.; Bai, X. Gliding vertex on the horizontal bounding box for multi-oriented object detection. IEEE Trans. Pattern Anal. Mach. Intell. 2020, 43, 1452–1459. [Google Scholar] [CrossRef] [Green Version]
  34. Xie, X.; Cheng, G.; Wang, J.; Yao, X.; Han, J. Oriented r-cnn for object detection. In Proceedings of the IEEE/CVF International Conference on Computer Vision, Virtual, 11–17 October 2021; pp. 3520–3529. [Google Scholar]
  35. Guo, Z.; Liu, C.; Zhang, X.; Jiao, J.; Ji, X.; Ye, Q. Beyond bounding-box: Convex-hull feature adaptation for oriented and densely packed object detection. In Proceedings of the IEEE/CVF Conference on Computer Vision and Pattern Recognition, Nashville, TN, USA, 20–25 June 2021; pp. 8792–8801. [Google Scholar]
  36. Hou, L.; Lu, K.; Xue, J.; Li, Y. Shape-Adaptive Selection and Measurement for Oriented Object Detection. In Proceedings of the AAAI Conference on Artificial Intelligence, Virtual, 22 February–1 March 2022. [Google Scholar]
  37. Haag, M.; Nagel, H.-H. Combination of edge element and optical flow estimates for 3D-model-based vehicle tracking in traffic image sequences. Int. J. Comput. Vis. 1999, 35, 295–319. [Google Scholar] [CrossRef]
  38. Yao, C.; Bai, X.; Liu, W.; Ma, Y.; Tu, Z. Detecting texts of arbitrary orientations in natural images. In Proceedings of the 2012 IEEE Conference on Computer Vision and Pattern Recognition, Providence, RI, USA, 16–21 June 2012; pp. 1083–1090. [Google Scholar]
  39. Karatzas, D.; Gomez-Bigorda, L.; Nicolaou, A.; Ghosh, S.; Bagdanov, A.; Iwamura, M.; Matas, J.; Neumann, L.; Chandrasekhar, V.R.; Lu, S. ICDAR 2015 competition on robust reading. In Proceedings of the 2015 13th International Conference on Document Analysis and Recognition (ICDAR), Tunis, Tunisia, 23–26 August 2015; pp. 1156–1160. [Google Scholar]
  40. Liu, K.; Mattyus, G. Fast multiclass vehicle detection on aerial images. IEEE Geosci. Remote Sens. Lett. 2015, 12, 1938–1942. [Google Scholar]
  41. Girshick, R.; Donahue, J.; Darrell, T.; Malik, J. Rich Feature Hierarchies for Accurate Object Detection and Semantic Segmentation. In Proceedings of the 2014 IEEE Conference on Computer Vision and Pattern Recognition, Columbus, OH, USA, 23–28 June 2013. [Google Scholar]
  42. Xie, S.; Girshick, R.; Dollár, P.; Tu, Z.; He, K. Aggregated residual transformations for deep neural networks. In Proceedings of the Proceedings of the IEEE Conference on Computer Vision and Pattern Recognition, Honolulu, HI, USA, 21–26 July 2017; pp. 1492–1500. [Google Scholar]
  43. Li, X.; Wang, W.; Hu, X.; Yang, J. Selective kernel networks. In Proceedings of the IEEE/CVF Conference on Computer Vision and Pattern Recognition, Long Beach, CA, USA, 15–20 June 2019; pp. 510–519. [Google Scholar]
  44. Ren, S.; He, K.; Girshick, R.; Sun, J. Faster R-CNN: Towards Real-Time Object Detection with Region Proposal Networks. IEEE Trans. Pattern Anal. Mach. Intell. 2017, 39, 1137–1149. [Google Scholar] [CrossRef] [PubMed] [Green Version]
  45. Lin, T.-Y.; Goyal, P.; Girshick, R.; He, K.; Dollár, P. Focal loss for dense object detection. In Proceedings of the IEEE International Conference on Computer Vision, Venice, Italy, 22–29 October 2017; pp. 2980–2988. [Google Scholar]
  46. He, K.; Zhang, X.; Ren, S.; Sun, J. Deep residual learning for image recognition. In Proceedings of the IEEE Conference on Computer Vision and Pattern Recognition, Las Vegas, NV, USA, 27–30 June 2016; pp. 770–778. [Google Scholar]
  47. Zhang, H.; Wu, C.; Zhang, Z.; Zhu, Y.; Lin, H.; Zhang, Z.; Sun, Y.; He, T.; Mueller, J.; Manmatha, R. Resnest: Split-attention networks. arXiv 2020, arXiv:2004.08955. [Google Scholar]
  48. Zhou, Y.; Xue, Y.; Zhang, G.; Wang, J.; Liu, Y.; Hou, L.; Jiang, X.; Liu, X.; Yan, J.; Lyu, C.; et al. MMRotate: A Rotated Object Detection Benchmark using PyTorch. arXiv 2022, arXiv:2204.13317. [Google Scholar]
  49. Yang, X.; Yan, J.; Feng, Z.; He, T. R3det: Refined single-stage detector with feature refinement for rotating object. In Proceedings of the AAAI Conference on Artificial Intelligence, Virtual, 2–9 February 2021; pp. 3163–3171. [Google Scholar]
Figure 1. Examples of labeled images taken from VSAI (green box: small vehicles, red box: large vehicles). (a) Typical image under slope view in VSAI including numerous instances; examples exhibited in (bd) are cut out from the original image (a). (b) Represents dense and tiny instances; (c) diagram of various instance orientations; (c,d) exhibition of the scale change caused by oblique aerial photography; (e,f) illustrate the distinctions of the same scene from different perspectives.
Drones 06 00161 g001
Figure 2. Distribution of image acquisition locations over China.
Drones 06 00161 g002
Figure 3. Image statics information. (a) The statistical histogram of shooting month; (b) the statistical histogram of shooting time from 7 to 24 o’clock.
Drones 06 00161 g003
Figure 4. Samples of annotated images in VSAI (left to right, top to bottom). Large trucks belong to LV, a large truck (LV), a bus marked with an arbitrary quadrilateral bounding box (LV), a car labeled using an arbitrary quadrilateral bounding box (SV), cars densely arranged and mutually blocked (SV), cars partially occluded by vegetation (SV), a taxi (SV), small trucks (SV), pickup (SV), car (SV), SUV (SV), police car (SV), box truck (SV), minibus (SV).
Drones 06 00161 g004
Figure 5. Image view statics information in VSAI: (a) distribution histogram of camera pitch angles; (b) distribution histogram of flight heights.
Drones 06 00161 g005
Figure 6. Statics histogram of the instances’ line of sight angles (LOS) in VSAI.
Drones 06 00161 g006
Figure 7. Examples of multi-view aerial images under the same scenario in the VSAI dataset: (a) the view of a higher altitude and smaller observation angle; (b) the view of a lower altitude and larger observation angle.
Drones 06 00161 g007
Figure 8. Examples of multi-view annotated images from VSAI with complex scenes and distinct terrains (left to right, top to bottom): seaside (120 m, −8.4°); bridge (208.6 m, −31.3°); desert (106.9 m, −41.9°); suburb (114.8 m, −49.9°); Forest (291.5 m, −57.2°); harbor (104 m, −37.1°); overhead bridges (112.2 m, −46.7°); crossroads (203 m, −69.6°); dam (118.8 m, −6.7°); tollbooth (202.2 m, −89.9°); Gobi (356.6 m, −54.6°); mountainous region (409.2 m, −35.4°). The images in the first three lines have resolutions of 4000 × 3000 pixels; the resolution of the last line is 5472 × 3648 pixels.
Drones 06 00161 g008
Figure 9. Distribution histogram of six complex scenes, including the desert, city, mountain, suburb, riverside, and seaside.
Drones 06 00161 g009
Figure 10. Examples of multi-view annotated images from VSAI in complex scenes (left to right, top to bottom): daylight; backlight that can never appear in a down-view aerial image; night; fog; snow cover; sea ice.
Drones 06 00161 g010
Figure 11. Vehicle statistics information: (a) the distribution of the vehicle’s orientation angles; (b) statics histogram of the instances’ lengths; (c) the distribution of the vehicle’s aspect ratio (AR).
Drones 06 00161 g011
Figure 12. Statics histogram of the instances’ occlusion ratios in VSAI.
Drones 06 00161 g012
Figure 13. Examples of vehicle occlusion. The first line demonstrates different block reasons of instances, from left to right, occluded by a building, blocked by other vehicles, sheltered by shafts, such as flags, and occluded by vegetation, respectively. The second line illustrates different occlusion ratios, from left to right, no occlusion, small occlusion, moderate occlusion, and large occlusion.
Drones 06 00161 g013
Figure 14. Histogram of the number of annotated instances per image in VSAI.
Drones 06 00161 g014
Figure 15. Schematic diagram of the ResNeSt Block and split attention. The left shows the ResNeSt block in a cardinality-major view. The green convolution layer is shown as (no. of in channels, filter size, no. of out channels). The right illustrates the split attention block. s   ( c / k ,   ) and z   ( c ,   ) stand for channel-wise statistics, as s c / k generated by global average pooling and the compact feature descriptor z c created by the fully connected layer. FC, BN, and r-SoftMax mean the fully connected layer, batch normalization, and SoftMax in the cardinal dimension. + and × represent the element-wise summation and element-wise product.
Drones 06 00161 g015
Figure 16. Test prediction samples of the ROI transformer trained on the VSAI dataset. The first row is the result of the model with the ResNet50 backbone and single-scale split, the middle row is the model with the ResNeSt50 backbone and single-scale split, and the third row is the result of the model with ResNeSt50 backbone, random rotation, and multi-scale split. The blue dotted boxes indicate significant differences between the pictures in the rows.
Drones 06 00161 g016
Figure 17. Test prediction samples of our baseline trained on the VSAI dataset. The first row is the result of the fault detection and the second row is the result of the leak detection.
Drones 06 00161 g017
Table 1. Some technical parameters of UAVs used in the VSAI dataset.
VersionCMOSField AngleResolution
Mavic air1/2.3 inch85°4056 × 3040
Mavic 2 pro1 inch77°5472 × 3648
Phantom 3 Pro1/2.3 inch94°4000 × 3000
Phantom 41/2.3 inch94°4000 × 3000
Phantom 4 RTK1 inch84°5472 × 3648
Table 2. Comparison of camera pitch angles and flight heights among VSAI and other object detection datasets based on UAV.
DatasetCamera Pitch AnglesFlight Heights
MOHR [17]−90°About 200, 300, 400 m
VisDrone2019 [27]UnannotatedUnannotated
Drone Vehicle [18]−90°Unannotated
Okutama-Action [23]−45°, −90°10–45 m
EAGLE [30]−90°Between 300 and 3000 m
VSAIFrom 0° to −90°55–500 m
Table 3. Comparison of statistics between VSAI and other object detection benchmarks.
DatasetVehicle Instances
per Image
No. of ImagesNo. of InstancesInstances per ImageImage Width
(Pixels)
UAVDT [25]841,50080,000841,50010.521080
DOTA [22]43,4622806188,28267.10300–4000
EAGLE [30]215,9868280215,98626.09936
DLR-3K-Vehicle [40]14,2322014,232711.65616
VSAI49,71244449,712111.964000, 4056, 5472
Table 4. Benchmark of the state-of-the-art on the rotated bounding box (RBB) detection task trained and tested on VSAI; mAP means mean average precision, higher is better. SS and MS mean single-scale and multi-scale split. RR indicates random rotation. R50 stands for ResNet50, S50 represents ResNeSt50.
MethodBackboneSplit and RotationTypeAP [%]
SVLVMean
Rotated RetinaNet [45]R50SSOne-Stage67.132.649.9
R3Det [49]R50SSOne-Stage69.638.554.0
Gliding Vertex [33]R50SSTwo-Stage70.342.556.4
Rotated Faster R-CNN [44]R50SSTwo-Stage70.744.057.3
S²A-Net [31]R50SSOne-Stage73.641.957.7
Oriented R-CNN [34]R50SSTwo-Stage76.943.160.0
SASM [36]R50SSOne-Stage76.745.260.9
CFA [35]R50SSTwo-Stage77.645.061.3
ROI Transformer [32]R50SSTwo-Stage77.438.457.9
S50SSTwo-Stage77.746.262.0
R50MSTwo-Stage78.948.263.6
S50MSTwo-Stage78.849.864.3
R50MS, RRTwo-Stage79.049.264.1
S50MS, RRTwo-Stage79.450.464.9
Table 5. Comparison of results on VSAI and DOTA using the baseline of the VSAI dataset. The comparison is on account of mAP. SL and LV stand for small vehicle and large vehicle, respectively.
Training SetTest SetSVLVmAP
DOTAVSAI17.04.510.8
VSAIDOTA35.56.120.8
Publisher’s Note: MDPI stays neutral with regard to jurisdictional claims in published maps and institutional affiliations.

