Article

Thermal Imaging of Beach-Nesting Bird Habitat with Unmanned Aerial Vehicles: Considerations for Reducing Disturbance and Enhanced Image Accuracy

by
Kerry L. Mapes
1,*,
Narcisa G. Pricope
1,*,
J. Britton Baxley
1,
Lauren E. Schaale
2,3 and
Raymond M. Danner
2
1
Department of Earth and Ocean Sciences, University of North Carolina Wilmington, 601 S. College Rd, Wilmington, NC 28403, USA
2
Department of Biology and Marine Biology, University of North Carolina Wilmington, 601 S. College Rd, Wilmington, NC 28403, USA
3
Bald Head Island Conservancy, P.O. Box 3109, 700 Federal Rd, Bald Head Island, NC 28461, USA
*
Authors to whom correspondence should be addressed.
Drones 2020, 4(2), 12; https://doi.org/10.3390/drones4020012
Submission received: 26 March 2020 / Revised: 20 April 2020 / Accepted: 22 April 2020 / Published: 24 April 2020
(This article belongs to the Special Issue She Maps)

Abstract

:
Knowledge of temperature variation within and across beach-nesting bird habitat, and how such variation may affect the nesting success and survival of these species, is currently lacking. This type of data is furthermore needed to refine predictions of population changes due to climate change, identify important breeding habitat, and guide habitat restoration efforts. Thermal imagery collected with unmanned aerial vehicles (UAVs) provides a potential approach to fill current knowledge gaps and accomplish these goals. Our research outlines a novel methodology for collecting and implementing active thermal ground control points (GCPs) and assess the accuracy of the resulting imagery using an off-the-shelf commercial fixed-wing UAV that allows for the reconstruction of thermal landscapes at high spatial, temporal, and radiometric resolutions. Additionally, we observed and documented the behavioral responses of beach-nesting birds to UAV flights and modifications made to flight plans or the physical appearance of the UAV to minimize disturbance. We found strong evidence that flying on cloudless days and using sky-blue camouflage greatly reduced disturbance to nesting birds. The incorporation of the novel active thermal GCPs into the processing workflow increased image spatial accuracy an average of 12 m horizontally (mean root mean square error of checkpoints in imagery with and without GCPs was 0.59 m and 23.75 m, respectively). The final thermal indices generated had a ground sampling distance of 25.10 cm and a thermal accuracy of less than 1 °C. This practical approach to collecting highly accurate thermal data for beach-nesting bird habitat while avoiding disturbance is a crucial step towards the continued monitoring and modeling of beach-nesting birds and their habitat.

1. Introduction

Recently, the use of unmanned aerial vehicles (UAVs) has increased across many scientific disciplines, and rapidly so among the fields of environmental biology, conservation, and ecology. The proliferation of this technology has been driven in part by the relatively low cost of the systems, small size, ability to carry various imaging and non-imaging payloads, and ability to monitor environments or phenomena in a timely and responsive manner [1]. The ability of small UAVs to collect imagery and data at high spatial and temporal resolutions has led to the popularization of this tool for a multitude of environmental applications, including land cover and vegetation mapping [2], soil erosion [3], invasive species detection and monitoring [4], and wildlife research and management [5].
Within the context of wildlife research, UAVs have proven to be efficient tools for evaluating wildlife behavior [6,7], abundance [8,9,10,11,12,13,14,15], and habitat [16,17]. Habitat evaluation may be done using visible spectrum cameras to classify habitat by land cover type [16] or through analysis of light detection and ranging (LiDAR) data to examine not only spatial extent of habitat type, but also information on vertical components of the habitat, such as tree height [17]. One potential benefit of using UAVs in wildlife studies is the reduction in disturbances to wildlife caused by the presence of human observers [18,19,20] or other traditional survey methods such as manned aircraft [21]. However, UAVs themselves have been shown to be a source of disturbance to many types of animals; thus, the number of scientific studies that specifically evaluate the effects of UAVs on both terrestrial [22,23,24] and aquatic [5,25,26] target species has increased in recent years. The majority of studies that evaluate the effects of UAVs on wildlife involve observing behavioral responses from video footage obtained by the UAV [26,27], video obtained by a standard camera [13,23,28], direct observations in the wild [13,14,23,29,30,31], or by measuring nesting success [32]. A few studies have also measured physiological responses to UAV activity, such as changes in heart rate [27,33], and considered the aural capacity of the target species in evaluating the response to the UAV [24,33]. These studies have considered responses to specific features or characteristics of the flight plan or of the UAV itself, including launch distance [23], distance of the UAV from target species while in flight [25,29,32], flight angle or movement [26,31], speed [31], flight altitude [18,23,25,26,28,30], exposure frequency [32,33], color [31], and noise level emitted from the UAV [18,33].
Research that can lead to specific recommendations for using UAVs near target species is fundamental to ensuring continued and responsible use of UAVs in wildlife studies. This is especially true for species of conservation concern, such as many species of waterbirds that nest in colonies [20,34]. Short-term or repeated anthropogenic disturbances are known to cause negative impacts on colonial nesting waterbirds. Anthropogenic disturbance can cause these birds to flush (i.e., leave their nests) and increase time spent away from the nest, which can lead to nest predation, overheating, decreases in parental care, or in more extreme cases, complete abandonment of eggs, young, or nesting habitat [35,36,37,38,39]. Therefore, developing methods to study nesting birds and their habitat without causing disturbance remains a top priority for waterbird biologists and conservation managers.
A rapidly expanding area of research in avian biology seeks to understand how high temperatures affect survival and reproductive success in order to predict population persistence. Recent heatwaves have caused widespread mortality in birds [40], and heat-related mortality is predicted to locally extinguish bird populations in the southwestern United States [41] and southern Africa [42] in response to continued climate change. Nearly all of North America’s bird species are expected to experience increased extreme heat events in the future, which contributes to predictions that two-thirds of North American birds are at increased risk of extinction as a result of climate change [43]. Colonial waterbirds that nest on beaches may be particularly susceptible to the effects of high temperatures: many species nest directly on the beach, where they are fully exposed to full sun and high temperatures [36,44]. We still know little, however, about how temperature varies within and across bird habitats at fine spatial scales, and how such variation might influence birds; this information could allow us to refine predictions of population changes in the face of climate change, identify valuable breeding locations, and plan habitat restoration. Thermal imagery from a UAV provides a potential approach to describe temperature variation across the landscape and accomplish these important goals.
In thermal remote sensing, radiation emitted from surface objects in the region of 3 to 35 µm on the electromagnetic spectrum is measured to estimate radiant (or actual) temperature. The amount of energy radiated is dependent on the object’s emissivity and kinetic temperature. Emissivity is the emitting ability of a real material compared to that of a black body (a theoretical object that absorbs and then emits all incident energy at all wavelengths). Kinetic temperature is the surface temperature of an object and is a measure of the amount of heat energy contained in it. Measured temperatures can be influenced by environmental factors such as air temperature or humidity; data is also influenced by the time of day it is collected due to differential thermal heating [45]. Because the spatial resolution of thermal data is often coarser than other imagery types (visible spectrum or multispectral), the ability to register it to other data can be a challenge due to the unacceptable transformations that may result if reliable control points cannot be identified [45], though this approach is commonly employed. Therefore, alternative approaches of image registration and co-registration must be developed.
With UAV imagery specifically, locational accuracy is extremely important when imaging small features to ensure that the feature is placed within the correct pixel. Alternative processing workflows exist, such as that described by Wakeford et al., where both visible spectrum (RGB) and thermal imagery were collected and processed using common natural markers as ground control points (GCPs) before overlaying the thermal texture on the RGB point cloud [46]. However, in many cases, natural markers may not have sufficient contrast to be apparent during processing, or in homogenous landscapes may not be present to begin with. Additionally, the use of commercially available GCPs referenced to very-high-accuracy spatial coordinates is common for visible RGB and multispectral imagery, but much less so for thermal imagery, mostly due to the fact that thermal cameras cannot “see” standard GCP targets as can other sensor types. Within the field of thermography, alternative “passive” GCPs, or GCPs made from materials with different emissivity than the surrounding environment, have been used, including aluminum targets [47,48,49,50,51], as well as gray tarp [52], black polypropelyne [48], and wood panels painted gray [53]. Less commonly utilized in thermal data collection with UAVs are “active” GCPs, or GCPs that are warmed or cooled to a temperature that is different than the background temperature.
When conducting UAV surveys where wildlife is present, tradeoffs between the desired final product and disturbance of the target species are made when lower altitude UAV flights are required to achieve a specific ground sample size and that altitude is likely to cause a disturbance. This is especially true when the features being imaged are very small, such as the nests of some species of shore-nesting birds, because the imagery must be collected at an altitude that can resolve the features of interest in final products [54]. In other words, the pixel size of the final product must be able to capture the target feature within a certain minimum size, otherwise the resulting pixel will be a blend of the target feature and any other features within that pixel [54].
In this study, we conduct a series of flights above a beach-nesting bird colony using an off-the-shelf commercial fixed-wing UAV in order to collect high resolution location and thermal landscape data in support of habitat monitoring and modeling. The research focuses on the least tern (Sternula antillarum), which is found in North, Central, and South America, is listed as a species of conservation concern in several states in the USA, and is listed as federally endangered in the interior USA and California. The research discussed here was the initial phase within a project that will assess the influence of habitat surface temperatures on bird nesting location and success. The specific objectives of the work reported here were to (1) observe and document the behavior of beach-nesting birds to UAV flights and modifications made to flight plans or physical modifications to the UAV in order to minimize disturbance; and (2) assess the quality of the derived imagery products by assessing the spatial accuracy of both RGB and thermal imagery and the temperature accuracy of thermal imagery, both important prerequisites for bird habitat mapping and modeling. Specifically, given the extremely small spatial footprint of individual least tern nests (7 to 10 cm), it was important to collect both highly detailed and highly accurate nest locations as well as thermal imagery in order to effectively match the fine-grain levels of both datasets while ensuring habitat and population disturbance minimization. As such, we structure this paper into two sections: one that details the necessary strategies to minimize population disturbance and a second that details the imagery accuracy considerations necessary to obtain highly accurate thermal data that matches the spatial footprint of nest locations.

2. Materials and Methods

2.1. Study Area

Lea-Hutaff Island (LHI) is a 22.8 km2 uninhabited barrier-island marsh complex of the coast of North Carolina, USA (Figure 1). LHI is separated from Topsail Island to the north by New Topsail Inlet; from Figure Eight Island to the South by Rich Inlet; and from the mainland by Topsail Sound. Once two islands, the landmasses were joined in 1998 when a powerful storm filled in the channel in between them. The geomorphology of the island is characterized by dunes, swales, and overwash fans. The vegetation is comprised of grassy flats, high and low marsh grass communities, and eelgrass beds, with very little vegetation of substantial height. The climate is Koppen Climate Class Cfa, which is a warm temperate climate characterized by full humidity and hot summers [55]. The island is a prominent nesting spot for several species of conservation concern, including loggerhead turtles (Caretta caretta), least terns, american oystercatchers (Haematopus palliates), piping plovers (Charadrius melodus) and clapper rails (Rallus crepitans). Due to the protected status of some of the bird species using this island as nesting habitat, Audubon North Carolina manages land encompassing these critical nesting habitats in collaboration with landowners. We secured permissions from local managing stakeholders to undertake this collaborative research project.

2.2. Mission Planning Considerations

We conducted a series of five test flights using a senseFly eBee plus (hereafter referred to as eBee) fixed-wing drone to assess the impacts of the UAV on disturbance of least tern and other species of colonial beach-nesting birds, as well as to thermally image the nesting habitat to ultimately understand the influence of beach thermal landscapes and other environmental variables on nesting location and success (Figure 2, Table 1). The eBee features an interchangeable sensor housing and can accommodate a variety of sensor types, including visible wavelengths (RGB), multispectral, and thermal. For this study, both the senseFly thermoMap thermal sensor and the S.O.D.A. RGB sensor were utilized. The thermoMap features a 0.3 megapixel sensor recording infrared wavelengths from 7500–13,500 nm, with a sensor resolution of 0.1 °C. The sensor performs a radiometric calibration automatically in-flight and collects images in timelapse mode at a rate of 7.5 images per second [48]. The S.O.D.A. camera has a 20 megapixel sensor, global shutter, and collects RGB imagery simultaneously on a single CMOS (complementary metal-oxide-semiconductor sensor) [48]. We used the senseFly eMotion flight planning and mission implementation software for all phases of planning and data collection (v. 3.5.0, senseFly, 2019). For all flights, we selected a launch/landing location at least 350 m northeast outside of the nesting area (Figure 2). Flight blocks were designed so that the nesting area was imaged in as few passes as possible to minimize potential chances of causing disturbances. Additionally, we designed flight blocks so that all UAV in-flight turns were taken outside the study area to minimize changes in movement that would be observable to the colony. The mission was designed so that the first waypoint was outside of the boundaries of the colony and so that upon reaching the first waypoint, the UAV would circle for at least 30 to 60 s so that the UAV was observable to the birds before entering the airspace over the colony.
Because the eBee is shaped similarly to a predatory bird, it might be mistaken as such when it is in flight, and this fact was immediately evident during our very first flights, which led to widespread colony flushing. As such, we determined that modifications to the UAV had to be made in order for the project to be continued, and we then assessed the response of the birds to the unmodified UAV as well as multiple physical modifications to its color, including the use of dazzle camouflage and painting the underside of the UAV (Figure 3). Dazzle camouflage was created using a combination of blue painter’s tape and light blue cardstock paper to break up the solid black color. The solid sky-blue camouflage was created by taping paper to the underside of the eBee and painting it with light blue paint. Because no modifications were made to the weight balance, sensors, or engineering characteristics of the UAV, these cosmetic modifications do not violate Federal Aviation Administration Part 107 Rules and Regulations [57]. However, laws governing UAV operations may vary by country, thus researchers should familiarize themselves with pertinent laws to ensure legal compliance. Additionally, violation of UAV manufacturers’ warranties or insurance policies should be considered in conducing these types of experiments. We did not assess impacts of UAV noise on the colony due to lack of data relating to noise levels of the eBee or aural capacities of the bird species within the colony.

2.3. Imagery Collection and Accuracy Assessment

Accurate geolocation of imagery was of the utmost importance for this project, because least tern nests are only about 7 to 10 cm in diameter (Figure 1D), while the expected ground sample distance (GSD) of the thermal imagery ranged from 16 to 22 cm/px based on flight height (Table 1). If the thermal imagery were not geolocated with high accuracy, this could mean that a nest point could be placed in an incorrect pixel (therefore matching nest points with incorrect thermal ranges). It was necessary to align the thermal imagery to ground control points (GCPs) collected with RTK and implement the GCPs in the imagery processing workflow for multiple reasons, including: (1) the thermoMap sensor is incompatible with both RTK and PPK (post-processing kinematics); and (2) the thermoMap does not simultaneously collect RGB imagery by which to georeference the thermal imagery as other commercial thermal sensors do (e.g., FLIR). However, it would also be possible to georeference thermal imagery by first conducting an RGB flight using RTK or PPK, then performing a thermal flight using the same eMotion flight plan. After processing the RGB flight and thermal flight, the thermal orthoimage could be co-registered to the RGB orthoimage. We chose not to utilize this methodology, as we could not be certain that two flights could be conducted during each survey if disturbance of the bird populations were observed during a flight, in addition to the lack of natural GCPs available in the study area.
Nest points, points for fence posts marking the boundary of the colony, and thermal GCP locations were collected using a survey grade RTK system that has a horizontal accuracy of +/− 1 cm and vertical accuracy of +/− 2 cm. The equipment includes a Trimble R8 GNSS receiver, TSC2 survey controller, and jet pack MiFi modem. Because there are no industry standard thermal GCPs (such as the colored tiles or targets used for RGB imagery) that exist and are able to be detected by thermal sensors, and because other materials, such as aluminum, may not be distinguishable enough in this environment, we propose one of the first known use cases of an active thermal GCP in a thermal UAV collection and processing workflow. As the thermal sensor cannot “see” visible wavelengths as an RGB or multispectral sensor can, we created an active thermal GCP by placing a bag of ice on top of standard GCP tiles (Figure 4). The temperature contrast between the hot sand and cold ice is easily distinguishable in thermal imagery and serves as a cost-effective and easy-to-implement solution to accurately geolocate thermal UAV imagery. For each flight, we collected active thermal GCPs at three locations along the beach side of the study area. The placement of GCPs was limited to the beach side outside the extent of the colony due to restrictions on entering the colony or other sensitive areas such as the marsh habitats or sand dunes (Figure 1).
During Flight 4, we collected thermal imagery with the senseFly thermoMap to assess the effect of using GCPs vs. not using GCPs in the processing workflow on accuracy of point locations. Additional GCPs and checkpoints were subsequently incorporated into the thermal processing workflow using point data collected at the fence posts marking the boundaries of the colony to achieve higher spatial accuracy (the point was collected at the base of the post). The fence posts are highly visible in the RGB imagery, and much less so in the thermal imagery; however, the fence post locations were used to locate groupings of pixels that were of sufficient uniqueness and clarity to be identifiable in the images within the Pix4Dmapper ray cloud GCP editor. We first completed initial processing using only the active thermal GCPs to increase the accuracy in automatic detection of the additional GCPs, then marked the additional passive GCPs. Additionally, we collected RGB imagery using the senseFly S.O.D.A. camera to create an orthomosaic using both the on-board RTK for the eBee and the same number (and locations) of GCPs and check points used in the thermal imagery processing. Both RGB and thermal imagery were processed using Pix4Dmapper (V. 4.1.25; Pix4D S.A., 2019), referred to hereafter as Pix4D. All post-processing spatial and temperature accuracy assessments were performed in ArcMap (V. 10.7; ESRI, 2011).
There is no standard thermal accuracy that exists for the thermoMap sensor by which to assess the accuracy of the temperatures obtained from the imagery in comparison to the ground truth temperature. Because the sensor is used in dynamic environmental and imaging conditions, it is not possible to accurately account for the variety of conditions under which the sensor is used. However, it would not be uncommon to expect temperature accuracies of +/− 2 °C if: (1) camera temperatures remained stable; (2) target and ambient temperatures were not extreme; (3) the emissivities of imaged objects were close to 1.0; and (4) post-processing/photogrammetry was applied correctly (Daniel Murphy, senseFly, personal communication, 7 June 2018). We tested the thermal accuracy of the thermoMap sensor under the specific conditions which existed during Flight 4 by comparing the processed thermal imagery to ground reference temperature measurements collected with an ennoLogic eT650D hand-held infrared thermometer alongside an RTK point. This dual laser thermometer measures temperatures from −50 °C to 650 °C with 0.1 °C temperature resolution. Temperature points were collected 2 m to the west of the thermal GCP. We did not directly measure the GCP target, given that the ice represents an extreme difference from ambient temperatures. For each temperature point, we collected three measurements, which were subsequently averaged. We compared this ground reference average to the average temperature in the thermoMap data within a 1 m buffer around the RTK point where the temperature was collected.
A total of three initial test flights were conducted before a satisfactory response from least tern and other beach-nesting bird species was observed, though observations were continued until Flight 5. Within the context of this study, we define a satisfactory response as one that includes minimal to no flushing. All flights and observations were conducted with permission of the North Carolina Wildlife Resources Commission (permit #18-ES00497), Audubon North Carolina, and UNCW IACUC (permit #A1617-010). Field studies were conducted under the supervision of an avian biologist from Audubon North Carolina, who assisted with behavioral monitoring and flight planning to ensure minimization of disturbance to the birds. We describe specifics of weather conditions, flight missions, and UAV modification in the Results section alongside the observed responses of nesting shorebirds as we believe this information is best interpreted when considered simultaneously.

2.4. Disturbance Measurements

We monitored disturbance to beach-nesting birds using continuous behavioral observations for Flights 1 through 5. Specifically, 2–4 researchers positioned themselves around the perimeter of the nesting area before the UAV was launched. The observers continuously recorded the activities of birds throughout the flights, including launch, ascent, transects, descent, and landing. The observers recorded the approximate number of each bird species in the nesting area that responded to the UAV. Observers remained in contact with two-way radios. If more than 10% of the birds flushed, the UAV was returned to the launch location and flight mission parameters reassessed before the next launch. Following a flight with observed disturbance, the UAV was not launched again on the same day.

2.5. RGB and Thermal Imagery Processing

RGB imagery was processed to generate a visual reference for the study area and the location of nests within the colony. RGB imagery from Flights 3 and 4 were processed using a modified Pix4D 3D Maps template with the inclusion of three commercial GCP targets (Figure 4), seven additional GCPs at fence post locations, and 40 checkpoints at fence post locations in the processing workflow to increase imagery location accuracy and accurately reference the spatial location of bird nests. This software utilizes a structure-from-motion workflow to reconstruct three-dimensional surfaces from still images [58]. We used the default keypoint image scale for initial feature extraction and matching to full image scale to ensure there was no reduction in final orthomosaic resolution. We also used the alternative calibration method for imagery calibration based on camera parameters, which is optimized for nadir images with accurate geolocation and low texture content, such as a sandy beach. The default image scale for point cloud densification is half (1/2) image size, which was also not modified. The primary output created from processing the RGB imagery was the orthomosaic, which is obtained from the digital surface model (DSM) and corrected for perspective, with the RGB value of an individual pixel being calculated as an average of the pixels in the corresponding original images [59].
Thermal imagery was processed using a modified Pix4D thermoMap template with the inclusion of GCPs within the processing workflow to increase location accuracy of imagery. This template uses full image scale and alternative calibration for computing image matches and generating the sparse point cloud, and full keypoints image scale for densifying the point cloud. We have chosen to utilize a large number of GCPs in the workflow to ensure high geolocation accuracy of the imagery as previously discussed. We used a total of three active thermal GCPs, seven additional passive GCPs, and 40 checkpoints. The initial processing was completed by first using the active thermal GCPs to increase overall imagery alignment and autodetection of additional passive GCPs by Pix4D. The primary output from the thermal processing workflow is the thermal index (essentially an orthoimage where each pixel is characterized by the temperature value for that pixel). The thermal index is computed from what Pix4D refers to as the reflectance map, which for thermal data is actually an orthoimage of the raw values for thermal emittance. We computed the thermal index in °C.

3. Results and Discussion

3.1. Observed Bird Colony Responses to UAV Flights
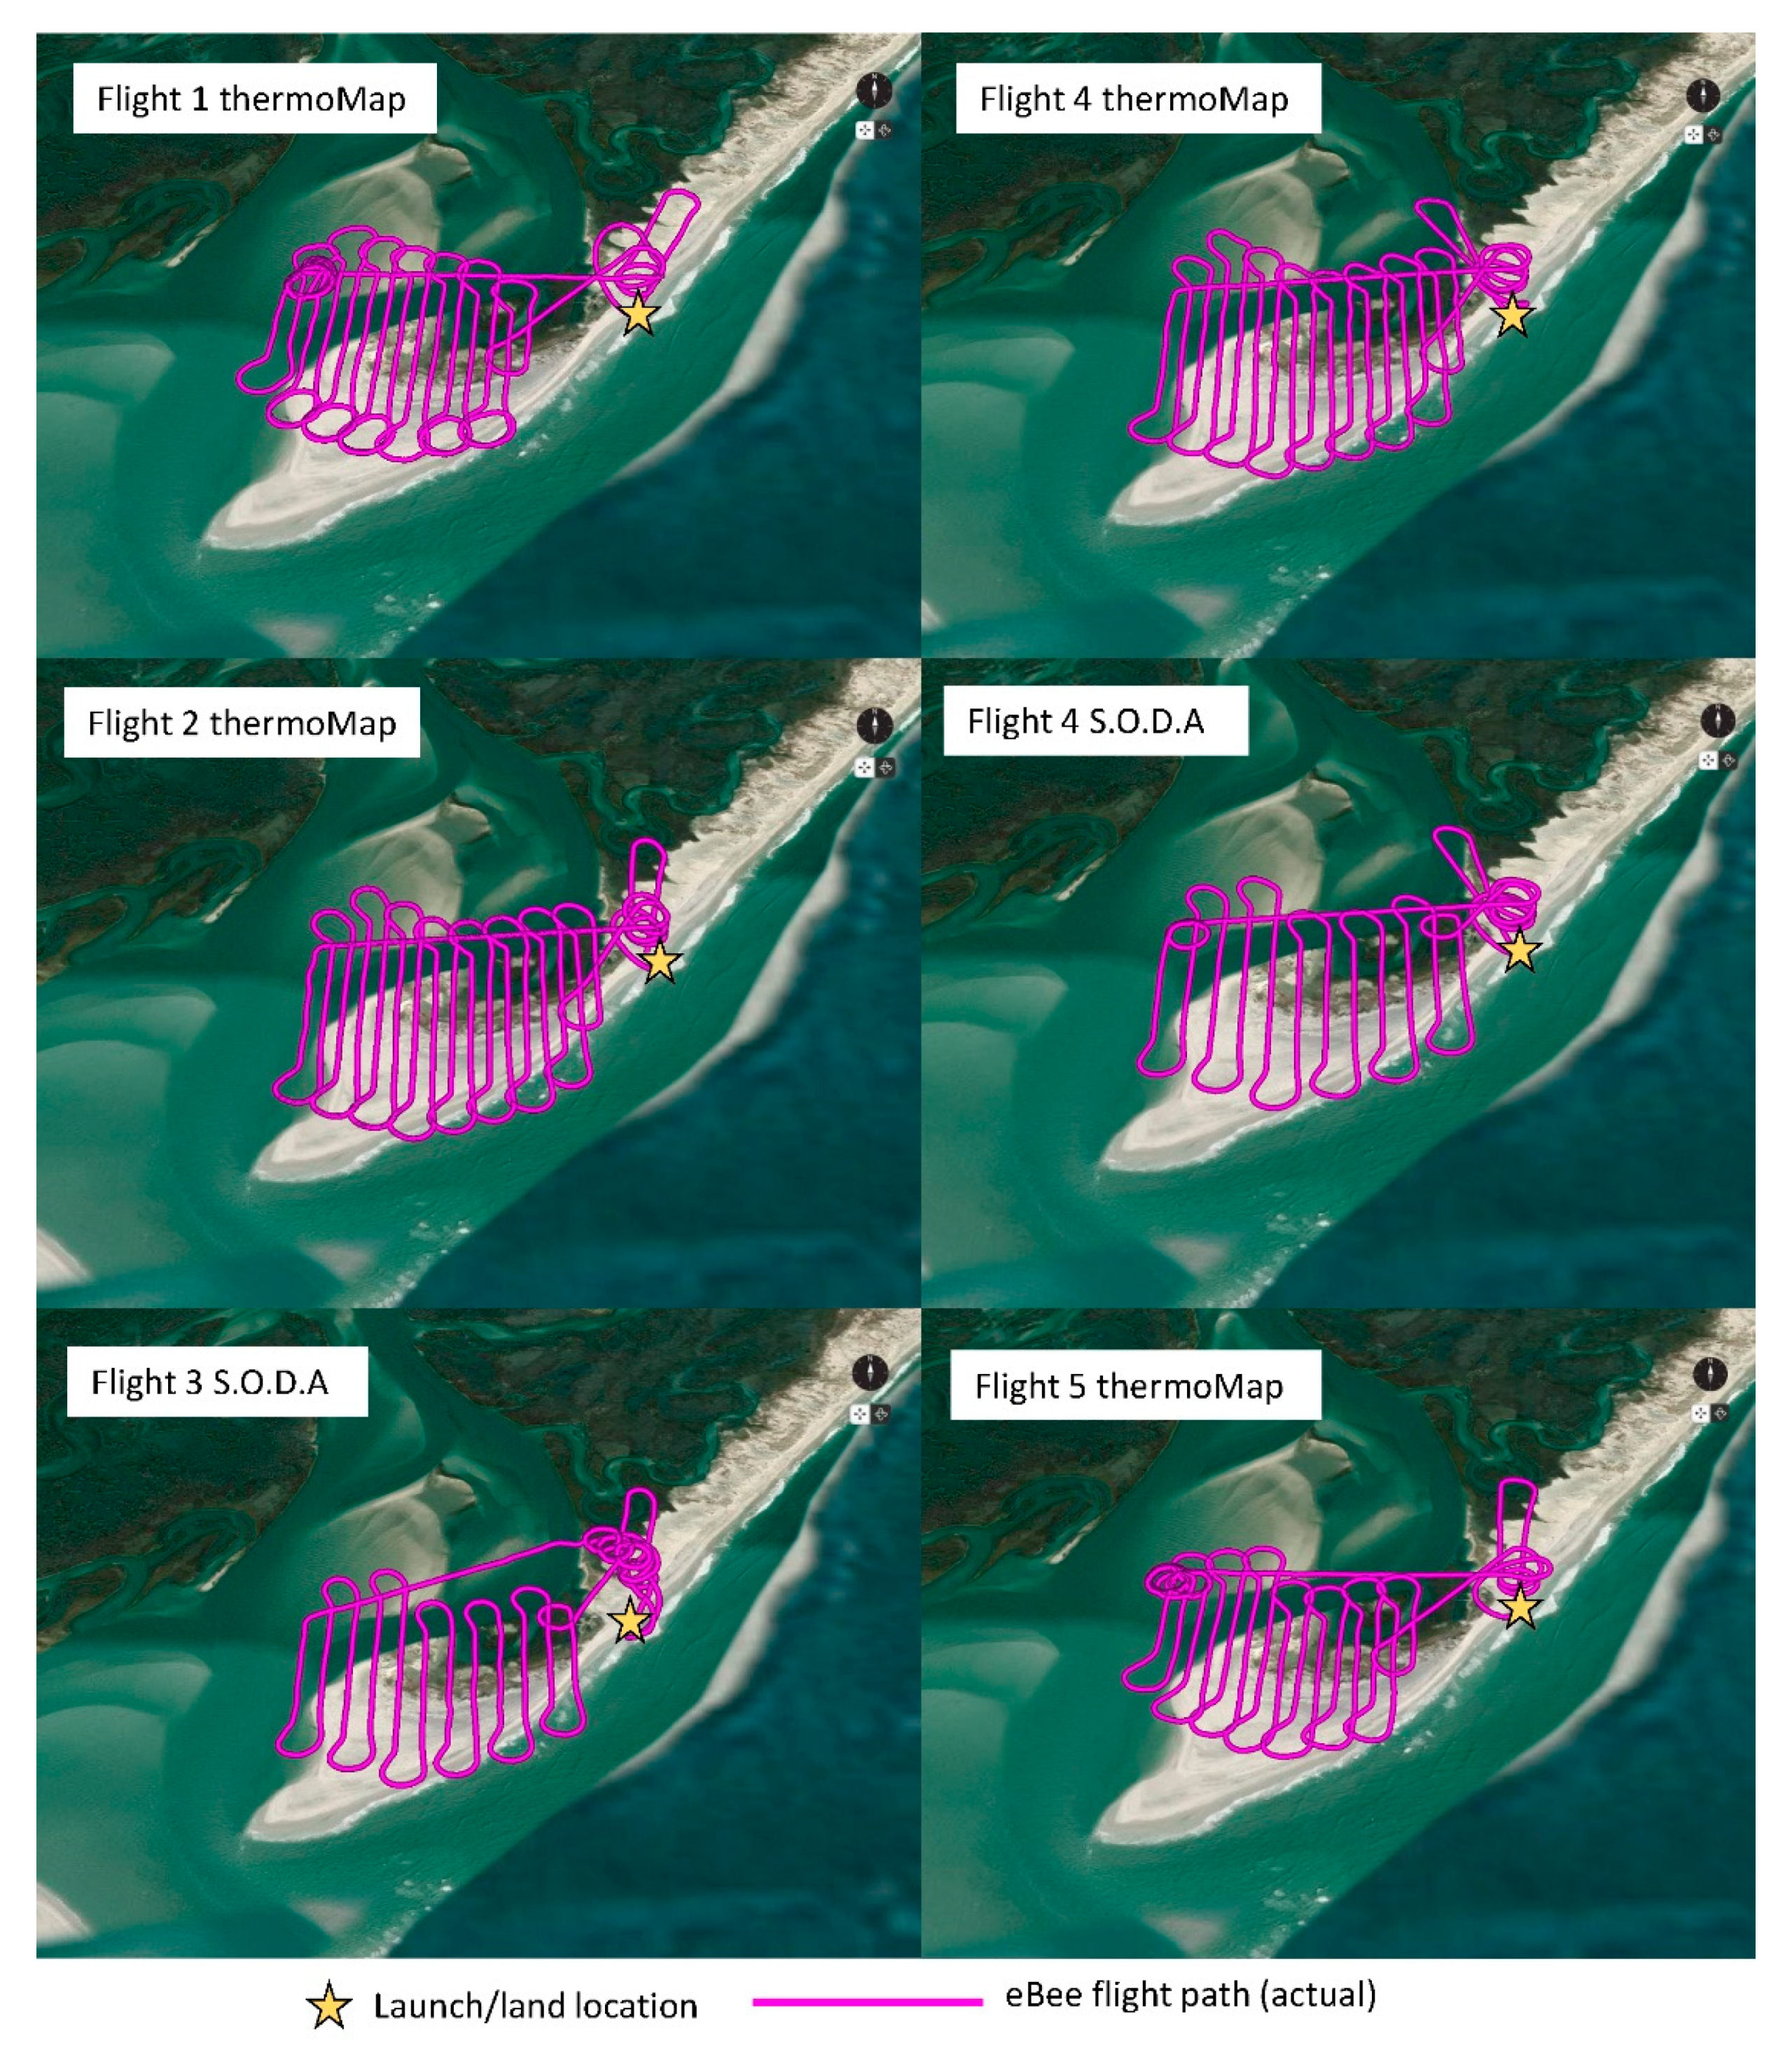
3.1.1. Flight 1

The first test flight was conducted in the morning on 8 May 2018 at 10:00 h when there was 100% cloud cover in the sky (Table 2). During this first flight, no physical modifications were made to the UAV (i.e., the coloration was the original black color of the eBee; Figure 3A). The flight occurred at a height of 85 m above ground level (AGL) using the thermoMap sensor (Table 1). Flight transects were oriented roughly east to west. Our launch location was situated approximately 350 m northeast of the colony extent (Figure 2). The eBee was hand-launched facing away from the colony, ensuring its initial ascent was not towards the colony. During Flight 1, the UAV made several east–west transects as it approached the tern colony from the launch location (Figure 2). This was due in part to the strong crosswinds, which challenged the UAV’s ability to stay on track, causing it to make many unplanned passes in order to hit the predetermined waypoints.
Birds showed no responses during approach or while the UAV flew over the northern edge of the colony (Figure 2). We noted that the initial passes farther from the colony provided additional time for the terns to assess the UAV as a potential non-threat. When the UAV flew directly over the colony, individuals it passed directly above flushed. These included least terns, black skimmers, and common terns. Black skimmers appeared to flush for the longest period, and least terns for the shortest. Some incubating individuals (it was difficult to estimate a percentage) remained on nests, and others flushed. It is likely that most of the non-incubating birds flushed. As the UAV approached the interior of the colony, birds in that area were disturbed. Flights of interior birds appeared to disturb other birds, causing colony-wide disturbance (i.e., flights). We hypothesize that the birds in the interior of the colony were unable to see the UAV approach because of the low dunes surrounding that location, and that this prevented the interior birds from assessing the UAV as a non-threat before it flew over them. The apparent response to UAV overflights tended to be stronger during earlier passes, when, typically, 100 or more birds would flush, up to half of which would fly beyond the colony boundaries (Figure 1). Later passes of the UAV typically caused flushing in only a few dozen individuals, with very few to no birds flying beyond the colony boundaries. Disturbance consisted of birds flying up from the ground, circling over the nesting site, and then landing. Bird flights typically lasted less than 10 s. Some birds flew out beyond the colony boundaries but returned in under 10 s. Birds flushed when the UAV flew overhead and then settled soon after the UAV passed by. The non-colonial American oystercatcher in the middle area of the colony stood in response to at least one over-pass but did not fly.

3.1.2. Flight 2

Flight 2 took place at midday on 22 May 2018 at approximately 13:00 h, which was a partially sunny day with scattered cloud cover (Table 2). Modifications were made to the coloration of the UAV using blue painter’s tape and sky-blue cardstock to create irregular lines and coloration across the underside of the UAV (Figure 2B). This “dazzle camouflage” pattern served to break up the shape and outline of the UAV so that it would be less likely to resemble a predatory bird. No modification was made to the yellow fins on the underside of the eBee to ensure that components of the UAV remained visible to observers. We conducted Flight 2 at 116 m AGL using the thermoMap sensor (Table 1); we hypothesized that the increase in flight altitude from Flight 1 would help minimize disturbance to the birds. Transects were oriented on a north–south axis, or approximately 90° from transect during Flight 2 (Figure 2). This was done so that fewer passes would be made by the UAV over the colony and therefore disturb the center of the colony less than during Flight 1. The UAV flight path began on the western edge of the colony and moved in an overall eastward direction.
It was immediately observed after launch that the UAV stood out against the white clouds. Despite the modifications made to color (dazzle camouflage, Figure 3B), it appeared black, as in Flight 1. It is likely that, because both flights took place on overcast days, the contrast between the UAV and sky was higher and made the UAV more visible to the birds. The modification made to the flight path caused the UAV to ascend directly from the launch location and fly over the northern edge of the colony before starting the north-south transects (Figure 2). When the UAV flew over the colony, most of the birds flushed immediately. They settled relatively quickly as the UAV turned to fly back north. This initiated a regular sequence, where birds flushed on southbound passes and settled as the UAV finished the southbound transect and headed north. Just as the birds settled, the UAV returned south causing them to flush once again. On the last few transects, where the UAV was over the eastern edge of the colony, many birds did not flush. It is unclear if this was because they ha habituated to the UAV presence or if their position with clear view of the sky reduced startling. The birds showed no responses as the UAV left the colony and descended to land.

3.1.3. Flights 3–5

We conducted Flights 3–5 at midday on clear, cloudless, sunny days between 12:00 and 14:00 h at 116 m AGL for the thermal flights and 119 m AGL for the RGB flights (Table 1). Specifically, Flight 3 occurred on 6 June 2018, Flight 4 on 2 July 2018, and Flight 5 on 11 July 2018. For these flights, we completely covered the black underside of the eBee using blue painter’s tape and sky-blue cardstock (Figure 3C). We then painted over the blue painter’s tape so it closely matched the color of the cardstock. The intent with the use of the blue color was to camouflage the eBee so that it would blend in with the sky as much as possible when observed from below. Again, no modification was made to the yellow fins to ensure that the components of the UAV remained visible to observers. The flight plan was slightly modified to begin passes at the waypoint closest to the launch location (Figure 2). This allowed the UAV to make several passes outside the colony extent before passing over the colony, as it was observed in Flight 2 that the direct ascent and initial pass over the colony caused high disturbance and flushing.
During Flights 3–5, we observed no disturbance. The behavioral response to the UAV was less intense than in response to observers walking through the colony. Birds were quiet or vocalized lightly in response to the UAV. Behavioral response from the UAV appeared to be less intense than to other forms of disturbance. Specifically, bird vocalizations in response to the UAV were quieter, and they returned to their nest sites more quickly than in response to natural nest predators, including a gull that we observed fly over the colony during one of the flights. We did not observe any gulls or other avian predators entering the colony during the flights. There are multiple possibilities that exist to explain the minimal behavioral responses of the birds to the UAV during Flights 3–5. First, the solid sky-blue camouflage alone or in conjunction with the cloudless sky made the UAV less visible to birds, where it was not perceived as a threat or predatory bird. Second, the additional flight time of the UAV outside of the colony before entering the colony allowed the birds to assess the UAV from a distance and were either able to interpret it as a non-threat or to habituate to its presence.

3.2. Discussion of Bird Behavioral Response

Previous studies provide mixed advice on optimal UAV launch locations, including launching the UAV out of sight of the target species [60]. Launch sites only 50 m away will induce disturbance reactions in some species [23], while in other species a minimum distance of 100 m was enough to decrease disturbance [27]. Our launch location was situated far enough outside the colony to ensure that it was not visible to birds, nor was the actual launch of the drone visible. However, it has been suggested that allowing the birds to observe the launch of both fixed-wing and rotocopter UAVs may aid them in assessing the UAV as a non-threat [61]. Additionally, it has been noted that the initial approach of the UAV may not cause flushing if the approach is from a location visible to the target species [60]. Our observations support this finding, in that there was less disturbance and flushing when the UAV was programmed to make additional passes further from the colony, such as in Flight 1 and Flights 3–5. During Flight 2, the specific flight path led to the UAV passing directly over the colony following its ascent, leading to substantial disturbance and flushing. We therefore recommend that UAV flight paths should allow the target bird species additional time to observe the UAV in flight outside of the colony boundaries or habitat area, therefore allowing the UAV to be assessed as a non-threat or allowing birds to habituate to its presence.
UAV flight altitude can influence bird behavioral response [60,61]. McEvoy et al. [60] found that flying a fixed-wing UAV at 60 m and higher did not induce flushing in a variety of waterfowl if the birds were approached from a visible location (i.e., parallel to the beach habitat). Alternatively, Bierlich et al. [61] found that a fixed-wing UAV flying at 60 m did cause flushing in birds inhabiting beach habitat, though birds returned quickly after making one flight. In addition, Bierlich et al. [61] point out that they did not provide sufficient time for the birds to habituate to the presence of the UAV before the approach. Our observations do not conclusively demonstrate whether or not increasing the UAV flight altitude had any impact on bird behavior. During our study, the only time flight altitude was increased was after Flight 1 at 85 m, with all other flights being conducted at 116–119 m (Table 1). During both Flights 1 and 2, flown at different altitudes, birds demonstrated strong disturbance reactions. Flights 3, 4, and 5 resulted in no disturbance reaction from birds. Birds demonstrated very different behavioral responses between Flight 2 and Flights 3–5 (all were flown at similar altitude); thus, we conclude that behavioral reactions were likely influenced more by other factors such as cloud cover or specific UAV flight path. Overall, we noticed the biggest reduction in bird disturbance occurred when flying on cloudless days and when the UAV was camouflaged with solid sky blue. We hypothesize that the type of camouflage used may be dependent on cloud cover, where camouflage that helps the UAV blend into the sky will reduce or eliminate disturbance to the birds. The modifications made to our flights resulted in less of a behavioral reaction than that of traditional methods such as physically entering the nesting area. Our findings may not be transferrable to surveys using rotocopter-style UAVs.

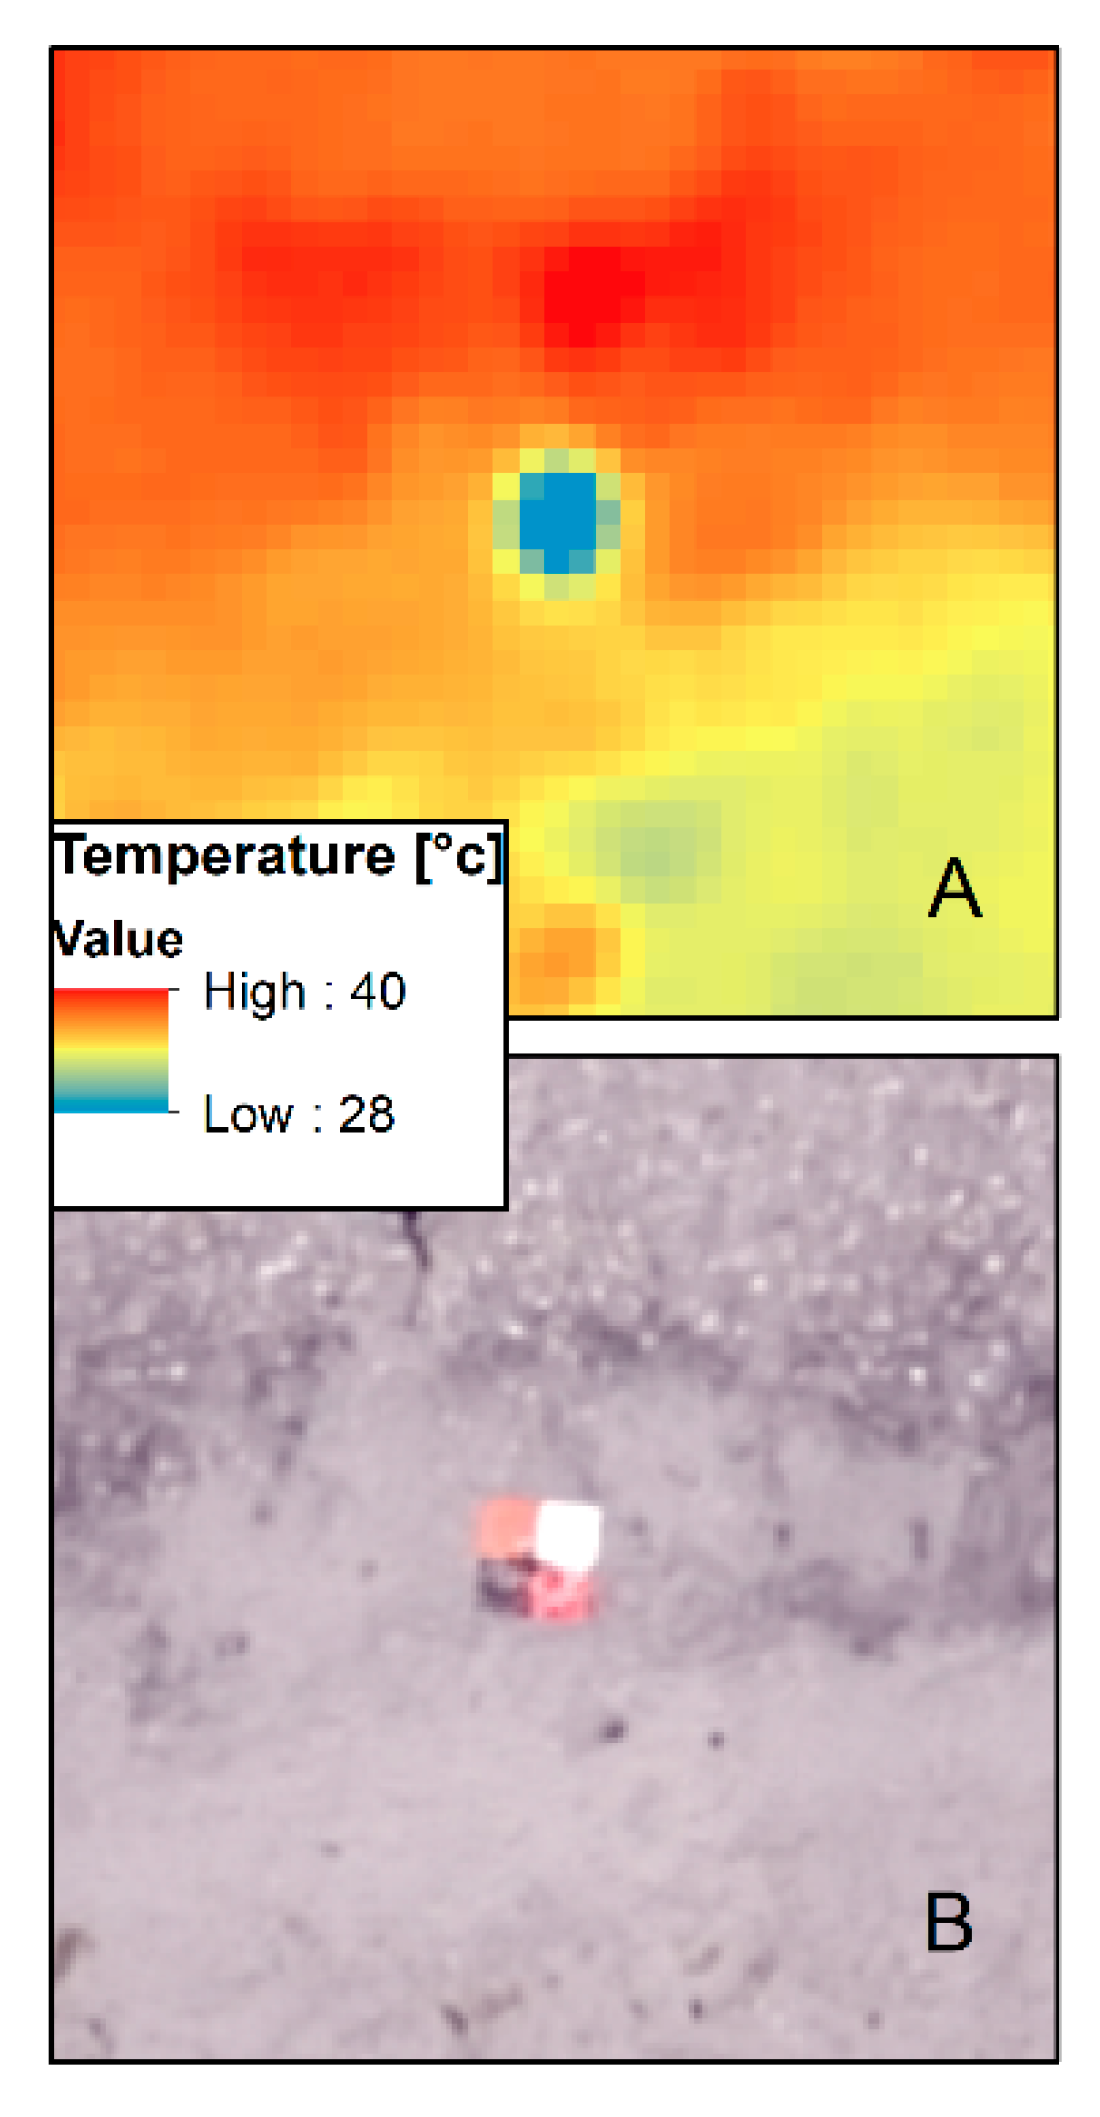
3.3. Spatial and Temperature Accuracy Assessment for Thermal Imagery

In our assessment of spatial accuracy of thermal imagery collected with and without GCPs, we observe that active thermal GCPs offer multiple benefits, including ease of detection during imagery processing (Figure 4), as well as contribute to overall increases in spatial accuracy of UAV imagery (Table 3). In imagery processed without GCPs, the actual location of the thermal GCPs varied by about 5 to 6 m horizontally (Figure 5). The average root-mean-square (RMS) error indicates localization accuracy per GCP and mean errors in the three coordinate (X, Y, Z) directions. We compare the mean RMS error of the checkpoints in imagery processed with and without GCPs (Table 3). Mean RMS error for imagery without GCPs was 23.75 m, with about 12 m inaccuracy in both the X and Y components and over 46.5 m inaccuracy in the Z component. In imagery processed with GCPs, the mean RMS error for checkpoints was 0.59 m, with less than 0.2 m inaccuracy in the X and Y components and about 1.4 m in the Z component. This indicates that the nest points could be drastically misplaced if GCPs are not used, resulting in inaccurate relationships being established between nest location and ground temperature, for example. Additionally, we observe that the direction of displacement is not uniform between points (Figure 5), thus standard imagery registration and alignment techniques are unlikely to improve the spatial accuracy of thermal imagery collected without GCPs. In addition to inaccuracies in spatial location, we also observe a net difference of +0.73 cm in actual ground sample distance between imagery processed with and without GCPs (Table 3), despite using the same imagery processing parameters in Pix4D (the only difference being the inclusion or exclusion of GCPs). For both products processed with and without GCPs, we observe differences in the expected GSD of 22.0 cm (Table 3).
Our assessment of the thermal accuracy of the thermoMap sensor collected under the specific environmental conditions and flight parameterization of Flight 4 indicates good agreement (over 90%) of thermoMap temperature data and ground reference temperature measurements (Figure 6). The measurements obtained from the thermoMap were generally within +/− 2 °C variation from ground reference data (Figure 6). We conclude that the data collected with the thermoMap under these specific conditions are accurate and suitable for incorporating into further analysis and assessment of habitat conditions; however, we recommend that researchers conduct independent thermal accuracy assessments, especially in areas with strong thermal contrasts or if a given degree of thermal accuracy is required for a research project. When it comes to least tern nests specifically, the final GSD of thermal imagery achieved within the course of this study (Table 3) was insufficient to resolve the nest size of the least tern (7 to 10 cm) but this does not detract from using the dataset for habitat analysis. Thus, the higher altitudes required to limit disturbance reactions in shore-nesting birds are a potential limitation of future applications of these datasets if the intent is detection of individual nests.

4. Conclusions

In this paper we present a practical approach to collecting high-resolution thermal data for beach-nesting bird habitat monitoring and modeling that relies on UAVs to collect spatially continuous data while avoiding bird population and habitat disturbance. Not only does field collection using appropriately camouflaged UAVs decrease disturbance to nesting birds, it also allows for the reconstruction of thermal landscapes at high spatial, temporal, and radiometric resolutions during critical stages of breeding and nesting. We found evidence that a combination of sky-blue camouflage and flying on cloudless days eliminated disturbance in nesting birds at our study site, though we recommend more testing to conclusively validate which one plays a larger role in reducing disturbance. In addition, the novel active thermal ground control point collection and implementation methodology we propose in this research is both cost-effective, easily transferable and has the potential to greatly improve spatial accuracy of thermal imagery where passive GCPs cannot be implemented or are less effective.

Author Contributions

Conceptualization, N.G.P., L.E.S, and R.M.D.; methodology, N.G.P., J.B.B., L.E.S., and R.M.D; software, N.G.P.; validation, K.L.M. and N.G.P.; formal analysis, K.L.M., and J.B.B.; investigation, J.B.B., K.L.M., L.E.S., and R.M.D.; resources, N.G.P., L.E.S., and R.M.D.; data curation, J.B.B.; writing—original draft preparation, K.L.M., N.G.P., J.B.B., L.E.S., and R.M.D.; writing—review and editing, K.L.M., N.G.P., L.E.S., and R.M.D.; visualization, K.L.M.; project administration, R.M.D.; funding acquisition, L.E.S., and R.M.D. All authors have read and agreed to the published version of the manuscript.

Funding

This research was funded by a grant from the Cape Fear Audubon Society to Lauren E. Schaale, a University of North Carolina Wilmington (UNCW) Center for Marine Sciences Pilot Grant to Raymond M. Danner, and with support from the UNCW College of Arts and Sciences to Raymond M. Danner and Narcisa G. Pricope.

Acknowledgments

We would like to thank senseFly USA, Raleigh, North Carolina office and especially senseFly USA General Manager, Troy Hittle, for their support for our research and lending us the thermoMap sensor used in this research. This work would not have been possible without their continued support. We would also like to extend a special thank you to Lindsay Addison of Audubon North Carolina for her willingness to facilitate and contribute to this new approach for monitoring shoreline habitats. We thank Anna Parot and Robert Snowden for assistance with field logistics and data collection. We kindly thank our anonymous reviewers for their feedback and comments that ultimately have strengthened our communication of our research and findings.

Conflicts of Interest

The authors declare no conflict of interest.

References

  1. Anderson, K.; Gaston, K.J. Lightweight unmanned aerial vehicles will revolutionize spatial ecology. Front. Ecol. Environ. 2013, 11, 138–146. [Google Scholar] [CrossRef] [Green Version]
  2. Ahmed, O.S.; Shemrock, A.; Chabot, D.; Dillon, C.; Williams, G.; Wasson, R.; Franklin, S.E. Hierarchical land cover and vegetation classification using multispectral data acquired from an unmanned aerial vehicle. Int. J. Remote Sens. 2017, 38, 2037–2052. [Google Scholar] [CrossRef]
  3. Peter, K.D.; d’Oleire-Oltmanns, S.; Ries, J.B.; Marzolff, I.; Ait Hssaine, A. Soil erosion in gully catchments affected by land-levelling measures in the Souss Basin, Morocco, analysed by rainfall simulation and UAV remote sensing data. CATENA 2014, 113, 24–40. [Google Scholar] [CrossRef]
  4. Samiappan, S.; Turnage, G.; Hathcoch, L.A.; Morehead, R. Mapping of invasive phragmites (common reed) in Gulf of Mexico coastal wetlands using multispectral imagery and small unmanned aerial systems. Int. J. Remote Sens. 2017, 38, 2861–2882. [Google Scholar] [CrossRef]
  5. Jones, G.P.; Pearlstine, L.G.; Percival, H.F. An assessment of small unmanned eerial vehicles for wildlife research. Wildl. Soc. Bull. 2006, 34, 750–758. [Google Scholar] [CrossRef]
  6. Clarke, L.J.; Hill, R.A.; Ford, A.; Herbert, R.J.H.; Esteves, L.S.; Stillman, R.A. Using remote sensing to quantify fishing effort and predict shorebird conflicts in an intertidal fishery. Ecol. Inform. 2019, 50, 136–148. [Google Scholar] [CrossRef]
  7. Sardà-Palomera, F.; Bota, G.; Padilla, N.; Brotons, L.; Sardà, F. Unmanned aircraft systems to unravel spatial and temporal factors affecting dynamics of colony formation and nesting success in birds. J. Avian Biol. 2017, 48, 1273–1280. [Google Scholar] [CrossRef]
  8. Barr, J.R.; Green, M.C.; DeMaso, S.J.; Hardy, T.B. Detectability and visibility biases associated with using a consumer-grade unmanned aircraft to survey nesting colonial waterbirds. J. Field Ornithol. 2018, 89, 242–257. [Google Scholar] [CrossRef]
  9. Drever, M.C.; Chabot, D.; O’Hara, P.D.; Thomas, J.D.; Breault, A.; Millikin, R.L. Evaluation of an unmanned rotorcraft to monitor wintering waterbirds and coastal habitats in British Columbia, Canada. J. Unmanned Veh. Syst. 2015, 3, 256–267. [Google Scholar] [CrossRef]
  10. Hodgson, J.C.; Mott, R.; Baylis, S.M.; Pham, T.T.; Wotherspoon, S.; Kilpatrick, A.D.; Raja Segaran, R.; Reid, I.; Terauds, A.; Koh, L.P. Drones count wildlife more accurately and precisely than humans. Methods Ecol. Evol. 2018, 9, 1160–1167. [Google Scholar] [CrossRef] [Green Version]
  11. Lyons, M.B.; Brandis, K.J.; Murray, N.J.; Wilshire, J.H.; McCann, J.A.; Kingsford, R.T.; Callaghan, C.T. Monitoring large and complex wildlife aggregations with drones. Methods Ecol. Evol. 2019, 10, 1024–1035. [Google Scholar] [CrossRef] [Green Version]
  12. McClelland, G.T.W.; Bond, A.L.; Sardana, A.; Glass, T. Rapid population estimate of a surface-nesting seabird on a remote island using a low-cost unmanned aerial-vehicle. Mar. Ornithol. 2016, 44, 215–220. [Google Scholar]
  13. Rush, G.P.; Clarke, L.E.; Stone, M.; Wood, M.J. Can drones count gulls? Minimal disturbance and semiautomated image processing with an unmanned aerial vehicle for colony-nesting seabirds. Ecol. Evol. 2018, 8, 12322–12334. [Google Scholar] [CrossRef]
  14. Valle, R.G.; Scarton, F. Effectiveness, efficiency, and safety of censusing Eurasian Oysteratchers Haematopus ostralegus by unmanned aircraft. Mar. Ornithol. 2019, 47, 81–87. [Google Scholar]
  15. Afán, I.; Máñez, M.; Díaz-Delgado, R. Drone Monitoring of Breeding Waterbird Populations: The Case of the Glossy Ibis. Drones 2018, 2, 42. [Google Scholar] [CrossRef] [Green Version]
  16. Kamm, M.; Reed, J.M. Use of visible spectrum sUAS photography for land cover classification at nest sites of a declining bird species (Falco sparverius). Remote Sens. Ecol. Conserv. 2019, 5, 259–271. [Google Scholar] [CrossRef]
  17. Tattoni, C.; Rizzolli, F.; Pedrini, P. Can LiDAR data improve bird habitat suitability models? Ecol. Model. 2012, 245, 103–110. [Google Scholar] [CrossRef]
  18. Reintsma, K.M.; McGowan, P.C.; Callahan, C.; Collier, T.; Gray, D.; Sullivan, J.D.; Prosser, D.J. Preliminary evaluation of behavioral response of nesting waterbirds to small unmanned aircraft flight. Waterbirds 2018, 41, 326–331. [Google Scholar] [CrossRef]
  19. Weissensteiner, M.H.; Poelstra, J.W.; Wolf, J.B.W. Low-budget ready-to-fly unmanned aerial vehicles: An effective tool for evaluating the nesting status of canopy-breeding bird species. J. Avian Biol. 2015, 46, 425–430. [Google Scholar] [CrossRef]
  20. Borrelle, S.B.; Fletcher, A.T. Will drones reduce investigator disturbance to surface-nesting birds? Ornithology 2017, 45, 89–94. [Google Scholar]
  21. Christie, K.S.; Gilbert, S.L.; Brown, C.L.; Hatfield, M.; Hanson, L. Unmanned aircraft systems in wildlife research: Current and future applications of a transformative technology. Front. Ecol. Environ. 2016, 14, 241–251. [Google Scholar] [CrossRef]
  22. Kays, R.; Sheppard, J.; Mclean, K.; Welch, C.; Paunescu, C.; Wang, V.; Kravit, G.; Crofoot, M. Hot monkey, cold reality: Surveying rainforest canopy mammals using drone-mounted thermal infrared sensors. Int. J. Remote Sens. 2019, 40, 407–419. [Google Scholar] [CrossRef]
  23. Rümmler, M.-C.; Mustafa, O.; Maercker, J.; Peter, H.-U.; Esefeld, J. Sensitivity of Adélie and Gentoo penguins to various flight activities of a micro UAV. Polar Biol. 2018, 41, 2481–2493. [Google Scholar] [CrossRef]
  24. Scobie, C.A.; Hugenholtz, C.H. Wildlife monitoring with unmanned aerial vehicles: Quantifying distance to auditory detection. Wildl. Soc. Bull. 2016, 40, 781–785. [Google Scholar] [CrossRef]
  25. Bevan, E.; Whiting, S.; Tucker, T.; Guinea, M.; Raith, A.; Douglas, R. Measuring behavioral responses of sea turtles, saltwater crocodiles, and crested terns to drone disturbance to define ethical operating thresholds. PLoS ONE 2018, 13, e0194460. [Google Scholar] [CrossRef] [PubMed]
  26. Ramos, E.A.; Maloney, B.; Magnasco, M.O.; Reiss, D. Bottlenose dolphins and antillean manatees respond to small multi-rotor unmanned aerial systems. Front. Mar. Sci. 2018, 5, 316. [Google Scholar] [CrossRef]
  27. Weimerskirch, H.; Prudor, A.; Schull, Q. Flights of drones over sub-Antarctic seabirds show species- and status-specific behavioural and physiological responses. Polar Biol. 2018, 41, 259–266. [Google Scholar] [CrossRef]
  28. Barnas, A.; Newman, R.; Felege, C.J.; Corcoran, M.P.; Hervey, S.D.; Stechmann, T.J.; Rockwell, R.F.; Ellis-Felege, S.N. Evaluating behavioral responses of nesting lesser snow geese to unmanned aircraft surveys. Ecol. Evol. 2018, 8, 1328–1338. [Google Scholar] [CrossRef] [Green Version]
  29. Junda, J.H.; Greene, E.; Zazelenchuk, D.; Bird, D.M. Nest defense behaviour of four raptor species (osprey, bald eagle, ferruginous hawk, and red-tailed hawk) to a novel aerial intruder—A small rotary-winged drone. J. Unmanned Veh. Syst. 2016, 4, 217–227. [Google Scholar] [CrossRef]
  30. Fettermann, T.; Fiori, L.; Bader, M.; Doshi, A.; Breen, D.; Stockin, K.A.; Bollard, B. Behaviour reactions of bottlenose dolphins (Tursiops truncatus) to multirotor Unmanned Aerial Vehicles (UAVs). Sci. Rep. 2019, 9, 8558. [Google Scholar] [CrossRef] [Green Version]
  31. Vas, E.; Lescroël, A.; Duriez, O.; Boguszewski, G.; Grémillet, D. Approaching birds with drones: First experiments and ethical guidelines. Biol. Lett. 2015, 11, 20140754. [Google Scholar] [CrossRef] [PubMed] [Green Version]
  32. Brisson-Curadeau, É.; Bird, D.; Burke, C.; Fifield, D.A.; Pace, P.; Sherley, R.B.; Elliott, K.H. Seabird species vary in behavioural response to drone census. Sci. Rep. 2017, 7, 17884. [Google Scholar] [CrossRef] [PubMed] [Green Version]
  33. Ditmer, M.A.; Werden, L.K.; Tanner, J.C.; Vincent, J.B.; Callahan, P.; Iaizzo, P.A.; Laske, T.G.; Garshelis, D.L. Bears habituate to the repeated exposure of a novel stimulus, unmanned aircraft systems. Conserv. Physiol. 2019, 7. [Google Scholar] [CrossRef] [PubMed] [Green Version]
  34. Rebolo-Ifrán, N.; Graña Grilli, M.; Lambertucci, S.A. Drones as a threat to wildlife: YouTube complements science in providing evidence about their effect. Environ. Conserv. 2019, 46, 205–210. [Google Scholar] [CrossRef]
  35. Burger, J. The effect of human activity on birds at a coastal bay. Biol. Conserv. 1981, 21, 231–241. [Google Scholar] [CrossRef]
  36. Oswald, S.A.; Bearhop, S.; Furness, R.W.; Huntley, B.; Hamer, K.C. Heat stress in a high-latitude seabird: Effects of temperature and food supply on bathing and nest attendance of great skuas Catharacta skua. J. Avian Biol. 2008, 39, 163–169. [Google Scholar] [CrossRef]
  37. Van de Voorde, S.; Witteveen, M.; Brown, M. Differential reactions to anthropogenic disturbance by two ground-nesting shorebirds. Ostrich 2015, 86, 43–52. [Google Scholar] [CrossRef]
  38. Tremblay, J.; Ellison, L.N. Effects of human disturbance on breeding of Black-Crowned Night Heron. Auk 1979, 96, 364–369. [Google Scholar]
  39. Snowden, R.S. Least Tern Nest Thermoregulation in Response to Environmental Temerature and Human Disturbance. Master’s Thesis, University of North Carolina Wilmington, Wilmington, NC, USA, 2018. [Google Scholar]
  40. McKechnie, A.E.; Wolf, B.O. Climate change increases the likelihood of catastrophic avian mortality events during extreme heat waves. Biol. Lett. 2010, 6, 253–256. [Google Scholar] [CrossRef] [Green Version]
  41. Albright, T.P.; Mutiibwa, D.; Gerson, A.R.; Smith, E.K.; Talbot, W.A.; O’Neill, J.J.; McKechnie, A.E.; Wolf, B.O. Mapping evaporative water loss in desert passerines reveals an expanding threat of lethal dehydration. Proc. Natl. Acad. Sci. USA 2017, 114, 2283–2288. [Google Scholar] [CrossRef] [Green Version]
  42. Conradie, S.R.; Woodborne, S.M.; Cunningham, S.J.; McKechnie, A.E. Chronic, sublethal effects of high temperatures will cause severe declines in southern African arid-zone birds during the 21st century. Proc. Natl. Acad. Sci. USA 2019, 116, 14065–14070. [Google Scholar] [CrossRef] [PubMed] [Green Version]
  43. Wilsey, C.; Bateman, B.; Taylor, L.; Wu, J.X.; LeBaron, G.; Shepherd, R.; Koseff, C.; Friedman, S.; Stone, R. Survival by Degrees: 389 Bird Species on the Brink; National Audubon Society: New York, NY, USA, 2019. [Google Scholar]
  44. Amat, J.A.; Masero, J.A. How Kentish plovers, Charadrius alexandrinus, cope with heat stress during incubation. Behav. Ecol. Sociobiol. 2004, 56, 26–33. [Google Scholar] [CrossRef] [Green Version]
  45. Prakash, A. Thermal remote sensing: Concepts, issues, and applications. Int. Arch. Photogramm. Remote Sens. 2000, 43, 5. [Google Scholar]
  46. Wakeford, Z.E.; Chmielewska, M.; Hole, M.J.; Howell, J.A.; Jerram, D.A. Combining thermal imaging with photogrammetry of an active volcano using UAV: An example from Stromboli, Italy. Photogramm. Rec. 2019, 34, 445–466. [Google Scholar] [CrossRef]
  47. Dlesk, A.; Vach, K. Point Cloud Generation of A Building from Close Range Thermal Images. ISPRS Int. Arch. Photogramm. Remote Sens. Spat. Inf. Sci 2019, XLII-5/W2, 29–33. [Google Scholar] [CrossRef] [Green Version]
  48. Brooke, C.; Clutterbuck, B. Mapping Heterogeneous Buried Archaeological Features Using Multisensor Data from Unmanned Aerial Vehicles. Remote Sens. 2019, 12, 41. [Google Scholar] [CrossRef] [Green Version]
  49. Hartmann, W.; Tilch, S.; Eisenbeiss, H.; Schindler, K. Determination of the uav position by automatic processing of thermal images. ISPRS Int. Arch. Photogramm. Remote Sens. Spat. Inf. Sci. 2012, XXXIX-B6, 111–116. [Google Scholar] [CrossRef] [Green Version]
  50. Tucci, G.; Parisi, E.; Castelli, G.; Errico, A.; Corongiu, M.; Sona, G.; Viviani, E.; Bresci, E.; Preti, F. Multi-Sensor UAV Application for Thermal Analysis on a Dry-Stone Terraced Vineyard in Rural Tuscany Landscape. ISPRS Int. J. Geo-Inf. 2019, 8, 87. [Google Scholar] [CrossRef] [Green Version]
  51. Park, S.; Nolan, A.P.; Ryu, D.; Chung, H. Estimation of crop water stress in a nectarine orchard using high-resolution imagery from unmanned aerial vehicle (UAV). In Proceedings of the MODSIM2015, 21st International Congress on Modelling and Simulation, Modelling and Simulation Society of Australia and New Zealand, Gold Coast, Australia, 29 November–4 December 2015. [Google Scholar]
  52. Sagan, V.; Maimaitijiang, M.; Sidike, P.; Eblimit, K.; Peterson, K.; Hartling, S.; Esposito, F.; Khanal, K.; Newcomb, M.; Pauli, D.; et al. UAV-Based High Resolution Thermal Imaging for Vegetation Monitoring, and Plant Phenotyping Using ICI 8640 P, FLIR Vue Pro R 640, and thermoMap Cameras. Remote Sens. 2019, 11, 330. [Google Scholar] [CrossRef] [Green Version]
  53. Maes, W.; Huete, A.; Steppe, K. Optimizing the Processing of UAV-Based Thermal Imagery. Remote Sens. 2017, 9, 476. [Google Scholar] [CrossRef] [Green Version]
  54. Burke, C.; Rashman, M.; Wich, S.; Symons, A.; Theron, C.; Longmore, S. Optimising observing strategies for monitoring animals using drone-mounted thermal infrared cameras. Int. J. Remote Sens. 2019, 40, 439–467. [Google Scholar] [CrossRef] [Green Version]
  55. Kottek, M.; Grieser, J.; Beck, C.; Rudolf, B.; Rubel, F. World Map of the Köppen-Geiger climate classification updated. Meteorol. Z. 2006, 15, 259–263. [Google Scholar] [CrossRef]
  56. Thompson, B.C.; Jackson, J.A.; Burger, J.; Hill, L.A.; Kirsch, E.M.; Atwood, J.L. Least Tern (Sternula antillarum), Version 1.0. In Birds of the World; Cornell Lab of Ornithology: Ithaca, NY, USA, 2020. [Google Scholar]
  57. Federal Aviaiton Administration Advisory Circular 107-2; Federal Aviaiton Administration: Washington, DC, USA, 2016.
  58. Westoby, M.J.; Brasington, J.; Glasser, N.F.; Hambrey, M.J.; Reynolds, J.M. ‘Structure-from-Motion’ photogrammetry: A low-cost, effective tool for geoscience applications. Geomorphology 2012, 179, 300–314. [Google Scholar] [CrossRef] [Green Version]
  59. Pricope, N.G.; Mapes, K.L.; Woodward, K.D.; Olsen, S.F.; Baxley, J.B. Multi-Sensor Assessment of the Effects of Varying Processing Parameters on UAS Product Accuracy and Quality. Drones 2019, 3, 63. [Google Scholar] [CrossRef] [Green Version]
  60. McEvoy, J.F.; Hall, G.P.; McDonald, P.G. Evaluation of unmanned aerial vehicle shape, flight path and camera type for waterfowl surveys: Disturbance effects and species recognition. PeerJ 2016, 4, e1831. [Google Scholar] [CrossRef] [Green Version]
  61. Bierlich, K.; Johnston, D. Using Unoccupied Aerial Systems (UAS) for Surveying Shorebirds in North Carolina; Marine Conservation Ecology Unoccupied Systems Facility; Duke University: Durham, NC, USA, 2016; p. 23. [Google Scholar]
Figure 1. Lea-Hutaff Island, North Carolina. (A) Study area showing colony extent and nest locations. (B) Locator map. (C) Close up view of bird nest points in S.O.D.A. imagery. The imagery is viewed at near-pixel resolution and is meant to show that the bird nests are not visible in the RGB imagery. (D) Photograph of least tern nest with eggs; nests are in an approximately 2-cm deep depression about 7 to 10 cm across and are made directly on the sand. Sand is the main substrate, but occasionally shells may be present, either being there before construction or being placed by the bird [56].
Drones 04 00012 g001
Figure 2. Flight missions using the senseFly eBee plus equipped with thermoMap or S.O.D.A. sensors on Lea-Hutaff Island. See Table 1 for additional mission parameter information. S.O.D.A flights use the same flight block. Thermal flights 2–4 used the same flight block, and thermal flight 3 is not shown in the figure.
Drones 04 00012 g002
Figure 3. senseFly eBee Plus fixed-wing drone. (A) Flight 1—No modifications. (B) Flight 2—dazzle camouflage. (C) Flights 3 through 5—solid sky-blue camouflage.
Drones 04 00012 g003
Figure 4. (A) Active thermal GCP created by temperature contrast of ice against the beach backdrop as seen in ArcMap, indicated by the cooler temperature blob (blue). The actual temperature of the active thermal GCP is inaccurate due to the drastic difference from ambient temperature under which the thermoMap was calibrated. (B) Standard RGB GCP tile as seen in ArcMap.
Drones 04 00012 g004
Figure 5. Comparison of thermal imagery processed with and without ground control points (GCPs) using Flight 4 imagery. In thermal imagery processed with no GCPs, the actual location of the active thermal GCP (indicated by the triangle) differs by over six meters (6 m) straight-line distance from the GCP location in the imagery (indicated by the cooler temperature blob, see top left where it is also indicated with an arrow). The thermal imagery is overlaid with a 40% transparency over the RGB orthomosaic. Imagery and GCP points were collected on 2 July 2018. Active thermal GCP points were evenly distributed around the outside of the colony along the beach (for reference, see Figure 6).
Drones 04 00012 g005
Figure 6. Thermal accuracy assessment of thermoMap imagery. Average temperatures taken with the handheld infrared (IR) thermometer (represented by the star) were compared to average temperature from the thermoMap within a one (1) m radius around the IR point. Imagery and thermal IR data collected on 2 July 2018 (Flight 4). Temperature points were collected two (2) m West of the thermal GCP points (not shown).
Drones 04 00012 g006
Table 1. Flight mission data from Flights 1 through 5 using senseFly eBee plus with thermoMap or S.O.D.A. sensors. See Figure 2 for visualization of flight plans.
FlightSensorAltitude (m AED)Estimated GSD (cm/px)Longitudinal Overlap (%)Latitudinal Overlap (%)Estimated Duration (mm:ss)
1thermoMap8516.0908013:46
2thermoMap11622.0908010:48
3thermoMap11616.0908010:48
3S.O.D.A.1192.80607008:12
4thermoMap11616.0908010:48
4S.O.D.A1192.80607008:12
5thermoMap11616.0908010:36
Table 2. Observed responses of nesting shorebirds to UAV flights.
Flight NumberDateCamouflageCloud Cover (%)Observed ResponseImpact
18 May 2018None (black)100Substantial flushing: birds flew out in a semi-circle over water and returnedConsiderable disturbance
222 May 2018Dazzle50Substantial flushing: birds flew out in a semi-circle over water and returnedConsiderable disturbance
36 June 2018Solid sky blue0No flushingNo disturbance
42 July 2018Solid sky blue0No flushingNo disturbance
511 July 2018Solid sky blue0No flushingNo disturbance
Table 3. RGB and thermal imagery processing spatial accuracy assessment using Flight 4 imagery (2 July 2018). Calibration percent represents the percentage of total images successfully matched and calibrated with camera parameters and used in subsequent point cloud densification. Actual ground sample distance (GSD) differed from a predicted GSD of 22.0 cm in thermal imagery (Table 1). Mean root-mean-square (RMS) error represents the localization accuracy per GCP and mean errors in the three coordinate (X, Y, Z) directions.
GCPs UsedCheck Points UsedImagery Calibration (%)Actual GSD (cm)Mean RMS Error (m) of GCPsMean RMS Error (m) of Check Points
1040902.740.050.23
0409424.37N/A23.75
10409425.100.290.59

