Article

Morphological Exposure of Rocky Platforms: Filling the Hazard Gap Using UAVs

by
Rafael C. Carvalho
1,2,* and
Colin D. Woodroffe
2
1
School of Life and Environmental Sciences, Deakin University, Burwood, VIC 3125, Australia
2
School of Earth, Atmospheric and Life Sciences, University of Wollongong, Wollongong, NSW 2522, Australia
*
Author to whom correspondence should be addressed.
Drones 2019, 3(2), 42; https://doi.org/10.3390/drones3020042
Submission received: 3 April 2019 / Revised: 29 April 2019 / Accepted: 30 April 2019 / Published: 3 May 2019
(This article belongs to the Special Issue Drones for Coastal Environments)

Abstract

:
Rock platforms are dangerous environments commonly subject to high wave energy on the open coast. Platform morphology is central to understanding what makes one stretch of coastline more hazardous than another, and it can be used to create site-specific morphological exposure hazard indices to assess the relative risk of being washed into the sea, assisting coastal managers in an effort to reduce the number of injuries and drowning incidents. This paper describes the use of an unmanned aerial vehicle (UAV) to derive morphological parameters for two data-poor rock platforms along the Illawarra coast of southern New South Wales, to fill the gap using an easily replicable site-specific hazard index, developed previously, that can be applied to other microtidal wave-dominated settings. The approach is based on the subdivision of the terrestrial seaward edge of platforms into segments, classified according to mean elevation, orientation and edge type, to model different weighting scenarios of predominant southeasterly and northeasterly wave direction. UAV-derived results were deemed satisfactory for all study sites, and a comparison of results derived from LiDAR for two platforms suggested that UAV data can be successfully used to guide risk policy on rock coasts, despite differences in the delimitation of the seaward edge due to tidal level during survey acquisition.

1. Introduction

Rock platforms are distinctive near-horizontal or sloping rock surfaces that occur within or close to the intertidal zone (around the mean water elevation) as a result of the erosional retreat of sea cliffs and subsequent lowering of the platform driven by the interaction between marine and subaerial processes [1,2,3,4].
Platforms can have slippery surfaces and are internationally recognised as particularly hazardous areas where people can be washed into the sea by waves and drown [5,6,7]. The risk is greatest when people stand, or spend substantial time, on the edge of a platform as this is the location where most of the energy is dissipated through processes of wave breaking [8,9]. Platform morphology is a key physical component that needs to be considered in order to understand what makes one platform more dangerous than another. Rocky coasts show considerable variability due to a range of factors, such as lithology, prevailing wave climate and inheritance from the past [10,11].
There has been an increase in drownings over recent decades in Australia, particularly among rock fishers swept from the edge of rock platforms. In Australia, 1.2 million people participate in rock fishing activities and an average of 12 lives were lost each year between 2004 and 2017 as a result of rock fishing. 95% of all 158 fatalities that occurred during this period happened to men aged between 40 and 65 years. 92% of all casualties were Australian residents, and a large proportion of all individuals were born overseas (at least 62%) [12]. Statistical analysis of the accidents indicates that 55% were caused by waves, 99% of 158 individuals were not wearing a life jacket, and more than half of all deaths occurred between January and May from 7 am to 3 pm [13].
The Australian state of New South Wales, home to almost 8 million people (approximately 32% of the Australian population) [14], has 12% of its population engaged in rock fishing. Of the rock fishing drownings in the country between 2004 and 2017, 65% occurred in New South Wales (NSW) [13]. The state has also some of the best-documented rock platforms in the world [15,16,17]. Several studies have examined the morphology of platforms in the Illawarra and their relationship to present sea level, as well as inferred former sea levels [16,18,19,20]. The degree of inundation and the size of waves able to cross the platform surface are determined by the platform elevation. The front depth (the water depth immediately offshore of the platform) determines how much wave energy will impact the platform and whether the wave will have broken offshore. A gently sloping surface dissipates more energy offshore than a horizontal surface with a seaward cliff [5].
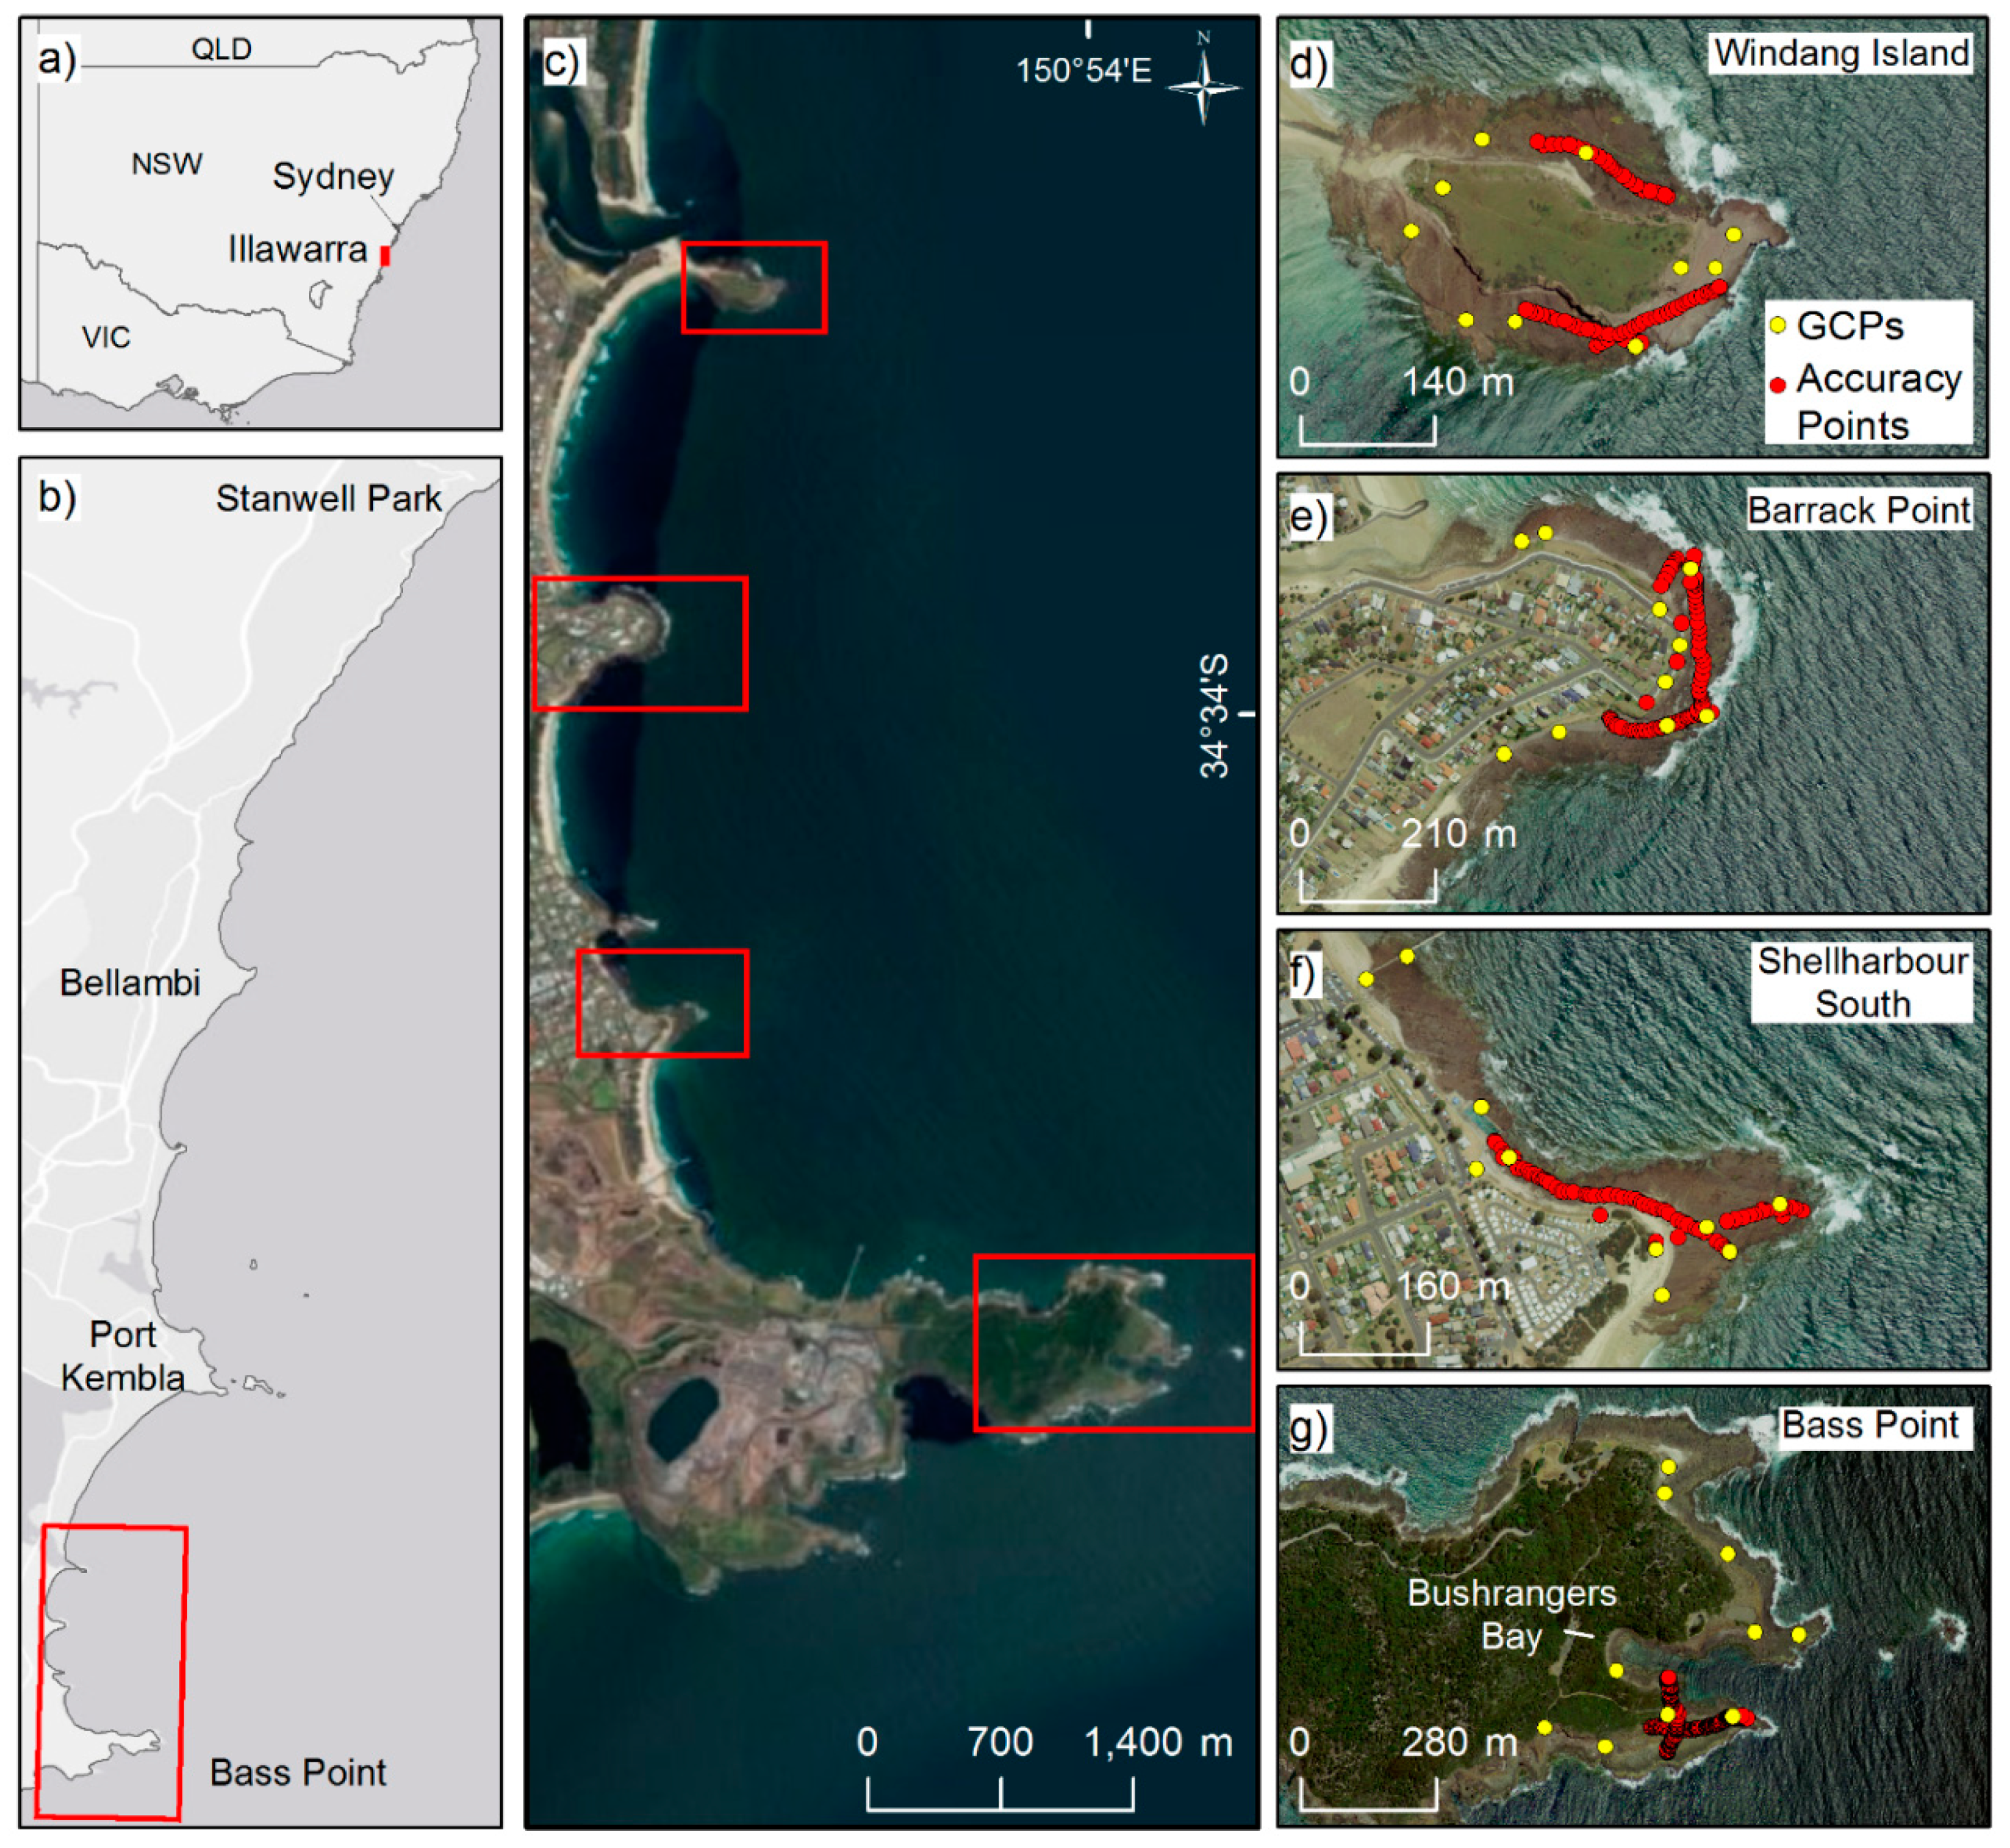
The rocky coast of the Illawarra attracts tourists to the region for recreational activities, especially rock fishing, and a recent morphology-based drowning risk index was developed for rock platforms in the area between Stanwell Park (north) and Bass Point (south) using airborne LiDAR [
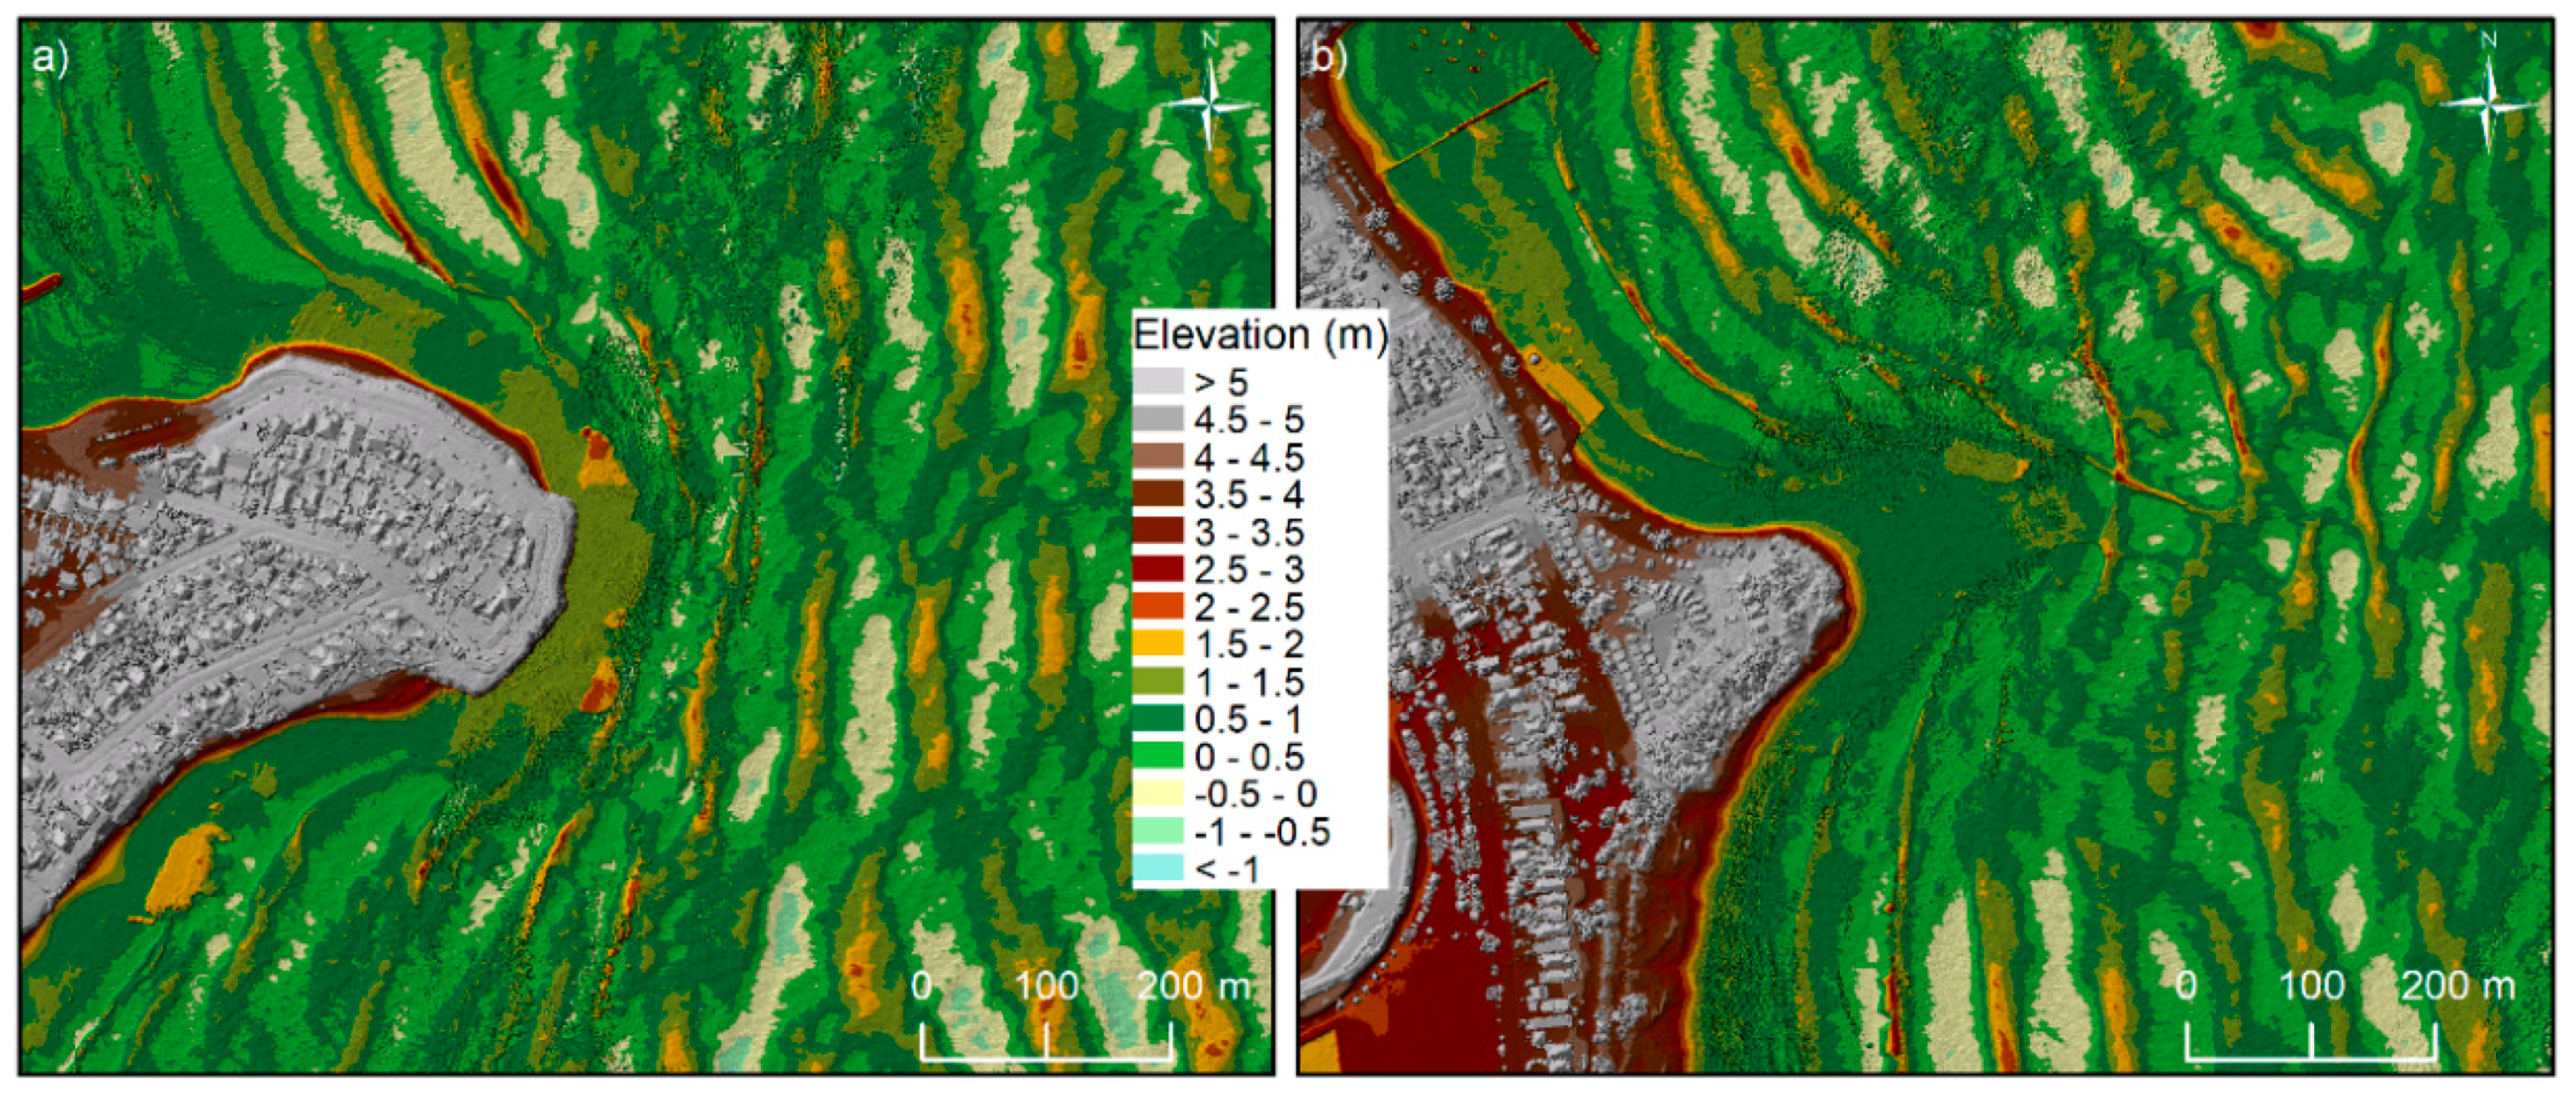
7]. The study modelled four different weighting scenarios of morphological exposure (mean elevation, orientation and edge type) for 620 individual segments from 26 rock platforms, indicating the most hazardous areas along the 42 km stretch of rugged coastline. However, due to issues associated with tidal inundation, wave action and/or post-processing classification with the airborne topographic LiDAR data collected by the contractor, the easily replicable site-specific hazard index developed previously could not be applied to several rock platforms in the region.
Unmanned aerial vehicle (UAV) technology has recently emerged as a revolution in geomatics, transforming digital elevation modelling and geomorphological analysis [21,22]. An inexpensive technique to derive terrain elevations from aerial photography is based on structure-from-motion (SfM) technology, an exciting scientific field that merges traditional photogrammetry and advances in computer vision, offering the potential to generate highly accurate dense point clouds [23]. SfM algorithms are used to identify matching features in overlapping images and to calculate camera location and orientation. Based on these calculations overlapping imagery can be used to reconstruct 3D point cloud models of the photographed surface [24].
In this paper, we use an off-the-shelf UAV quadcopter to collect topographic data and derive morphological parameters for several rock platforms in Illawarra, showing the potential of this emerging technology to fill the hazard index gaps in the area. Four scenarios are presented based on distinct wave direction and weighting systems. We also report on the comparison of results derived from UAV and LiDAR surveys.

2. Materials and Methods

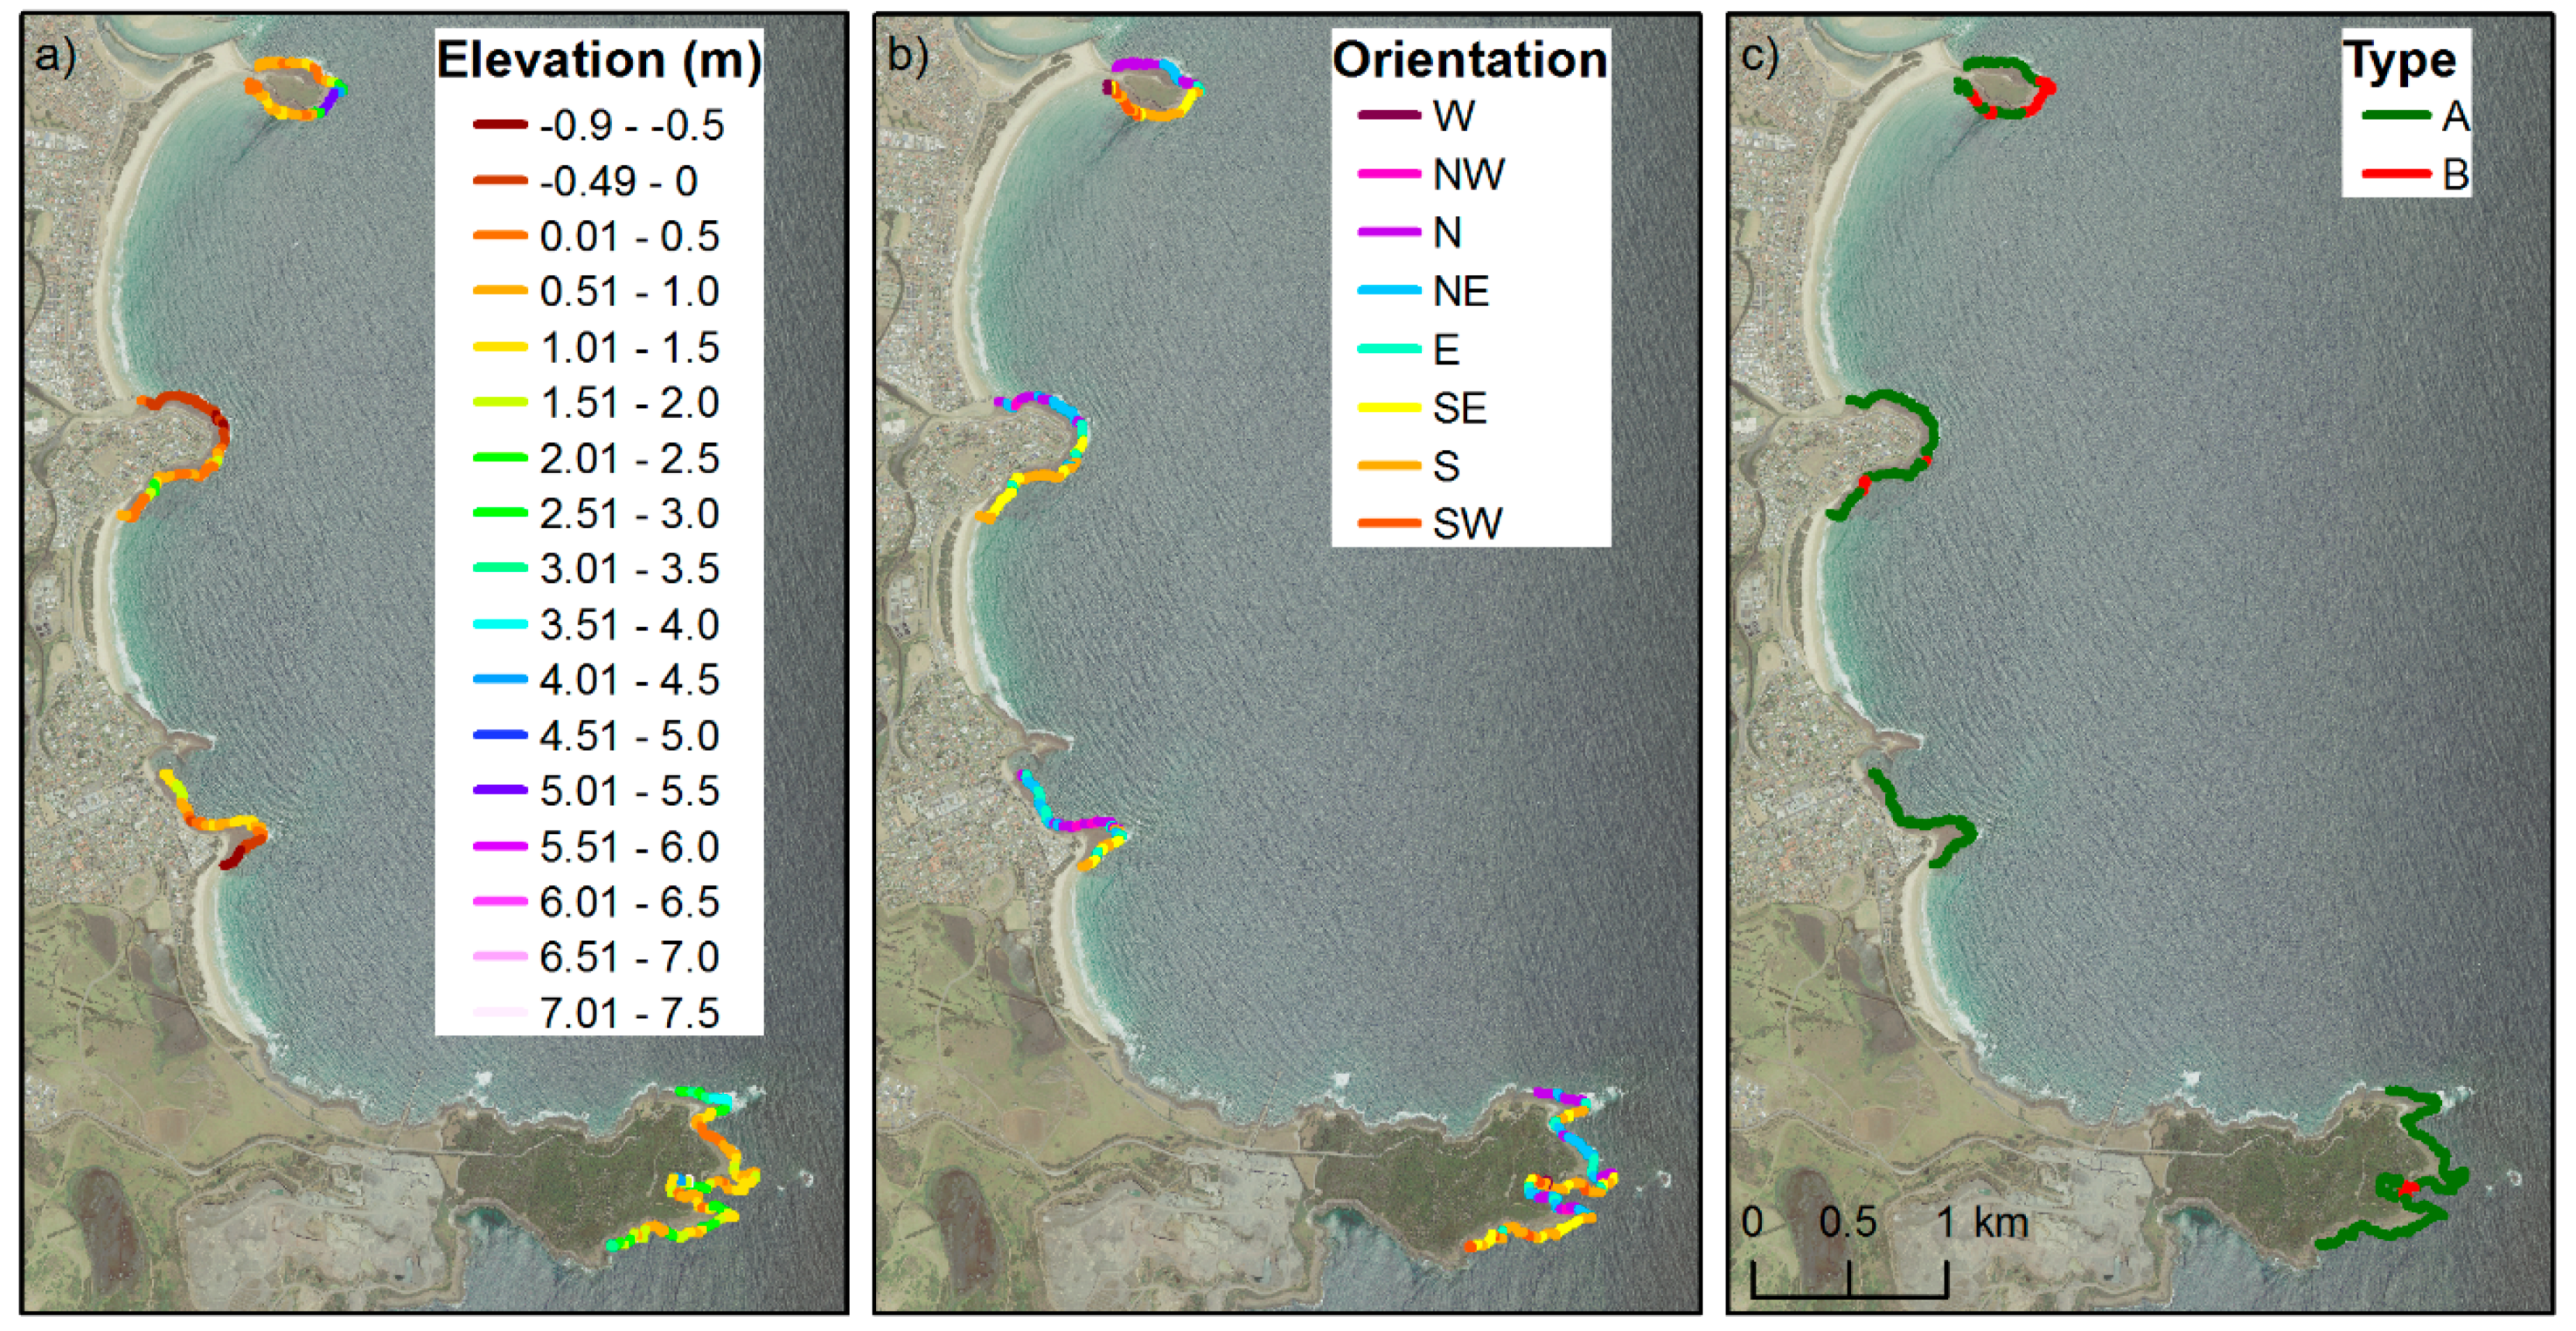
A quadcopter (DJI Phantom 4) with a built-in (4000 × 3000 pix) RGB camera was used to derive digital surface models (DSMs) for four specific rock platforms along the Illawarra Coast, southeast Australia. The platforms of Barrack Point and Shellharbour South were chosen because the LiDAR-derived morphological exposure hazard index study undertaken by [7] for the region (Figure 1) did not include these platforms. These gaps were due to the inundation (elevated water level) of the platform caused by a storm event in association with high tides during the airborne topographic LiDAR acquisition, which prevented the use of bare ground topographic points to derive the morphometric parameters in the previous study (Figure 2).
Apart from Barrack Point and Shellharbour South, we also collected UAV-derived data for two platforms included in the original LiDAR-derived study [7], namely Windang Island and (part of) Bass Point (Figure 1). These surveys were conducted in order to compare the results obtained with the different survey techniques.
A Trimble R8 GNSS RTK Rover with a vertical accuracy of 0.03 m was used to collect ground control points (GCPs) to correct the offset in both horizontal and vertical dimensions driven by the inherited imprecisions of the navigation GPS and the altimeter onboard the quadcopter (Figure 1). The RTK-GPS delivers reliable, precise positioning due to 3G internet connection to the nearest GPS base station (or CORS network). Independent datasets of RTK-GPS points (69 at Windang Island; 79 at Barrack Point; 71 at Shellharbour South; 148 at Bass Point) were collected concomitantly with the GCPs at each of those platforms to assess the overall accuracy of the UAV-derived DSMs using a point-to-raster comparison.
UAV flight missions were planned with 60% overlap using the Map Pilot App. Flight altitudes were set to 60 m, resulting in ground resolution of approximately 2.5 cm/pixel. Individual DSMs were generated in Pix4Dmapper [25] using full keypoints image scaling, half image size point cloud densification, optimal point density and a minimum number of three matches. 3D texture meshes were generated using medium resolution, and final DSMs were created using noise and sharp surface smoothing filtering. Raster DSMs were interpolated using inverse distance weighting. Selected UAV flight and processing parameters are provided in Table 1.
Once DSMs were generated, morphological parameters were derived, following procedures outlined in the original study [
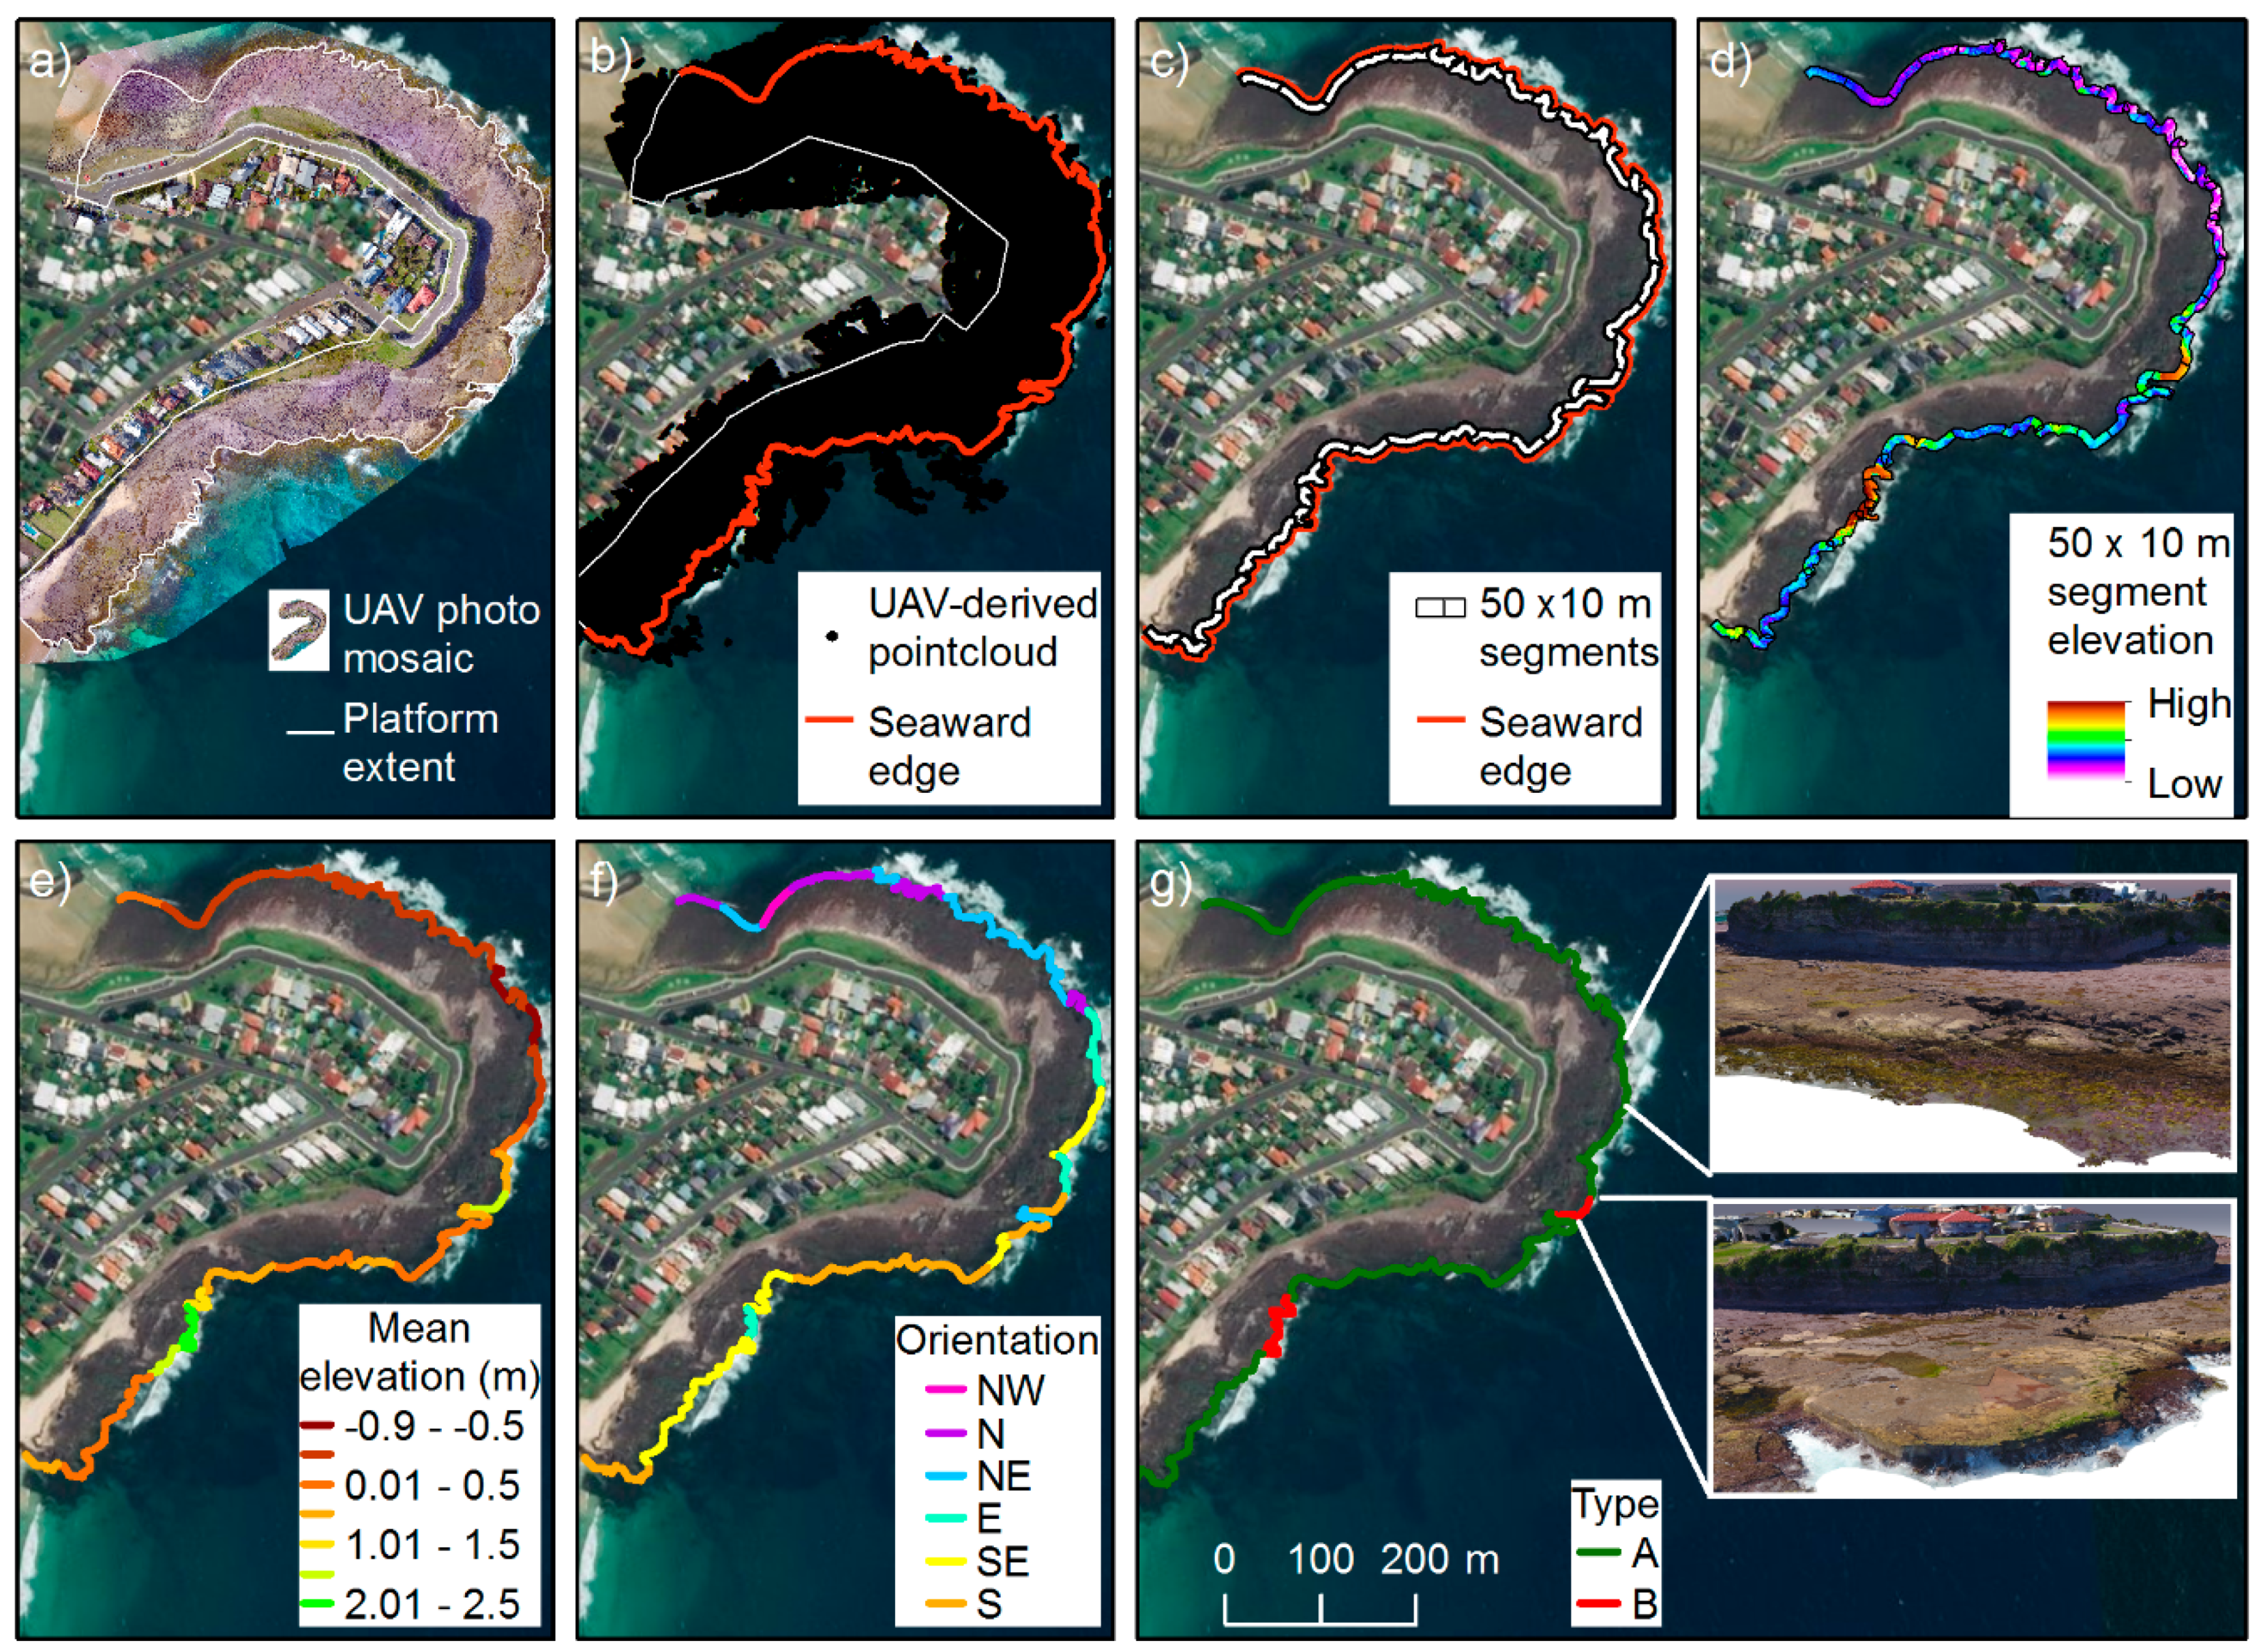
7] based on the elevation, orientation and type of platform. The first step was to use a polygon to delineate the extent of each platform. Special attention was given to the manual delimitation of the seaward edge of the polygons, in order to select only rock ground and not the water. These individual polygons were used to clip the DSMs to create elevation surfaces for the four platforms; they were also converted to polylines. The seaward edges of these polylines were divided into approximately 50 m segments, and a 10 m landward buffer was created and used to clip the elevation maps. The rationale behind the segmentation and buffering is the site-specificity of the morphological variation and the considered ‘riskiness’ of the area close to the intertidal seaward edge, respectively. Once all 50 × 10 m segments were created, mean elevation, orientation (8 classes based on main cardinal directions) and edge type (segments which slope seawards as a uniform ramp (A), and with a distinctive, abrupt seaward edge (B)) were determined for each segment (Figure 3).
Orientation was incorporated because of the different exposure of segments in relation to the predominant swell direction, whereas the edge type was considered a suitable indication of the transformation of wave energy (in the absence of water depth data seaward of each platform), with sloping platform margins of type A serving to dissipate wave energy [26]. The classification follows that used on beaches where broad low-gradient dissipative beaches are characterised by waves breaking further offshore. In the case of rock platforms, significant dissipation occurs at wave breaking prior to wave arrival, or as waves arrive, at the seaward edge [27], whereas type B morphologies are more analogous to intermediate-reflective beach states, as a great part of the wave energy is reflected by the seaward edge, especially at low tide [28]. Further information regarding the processing steps to calculate the morphological parameters can be found in [7].
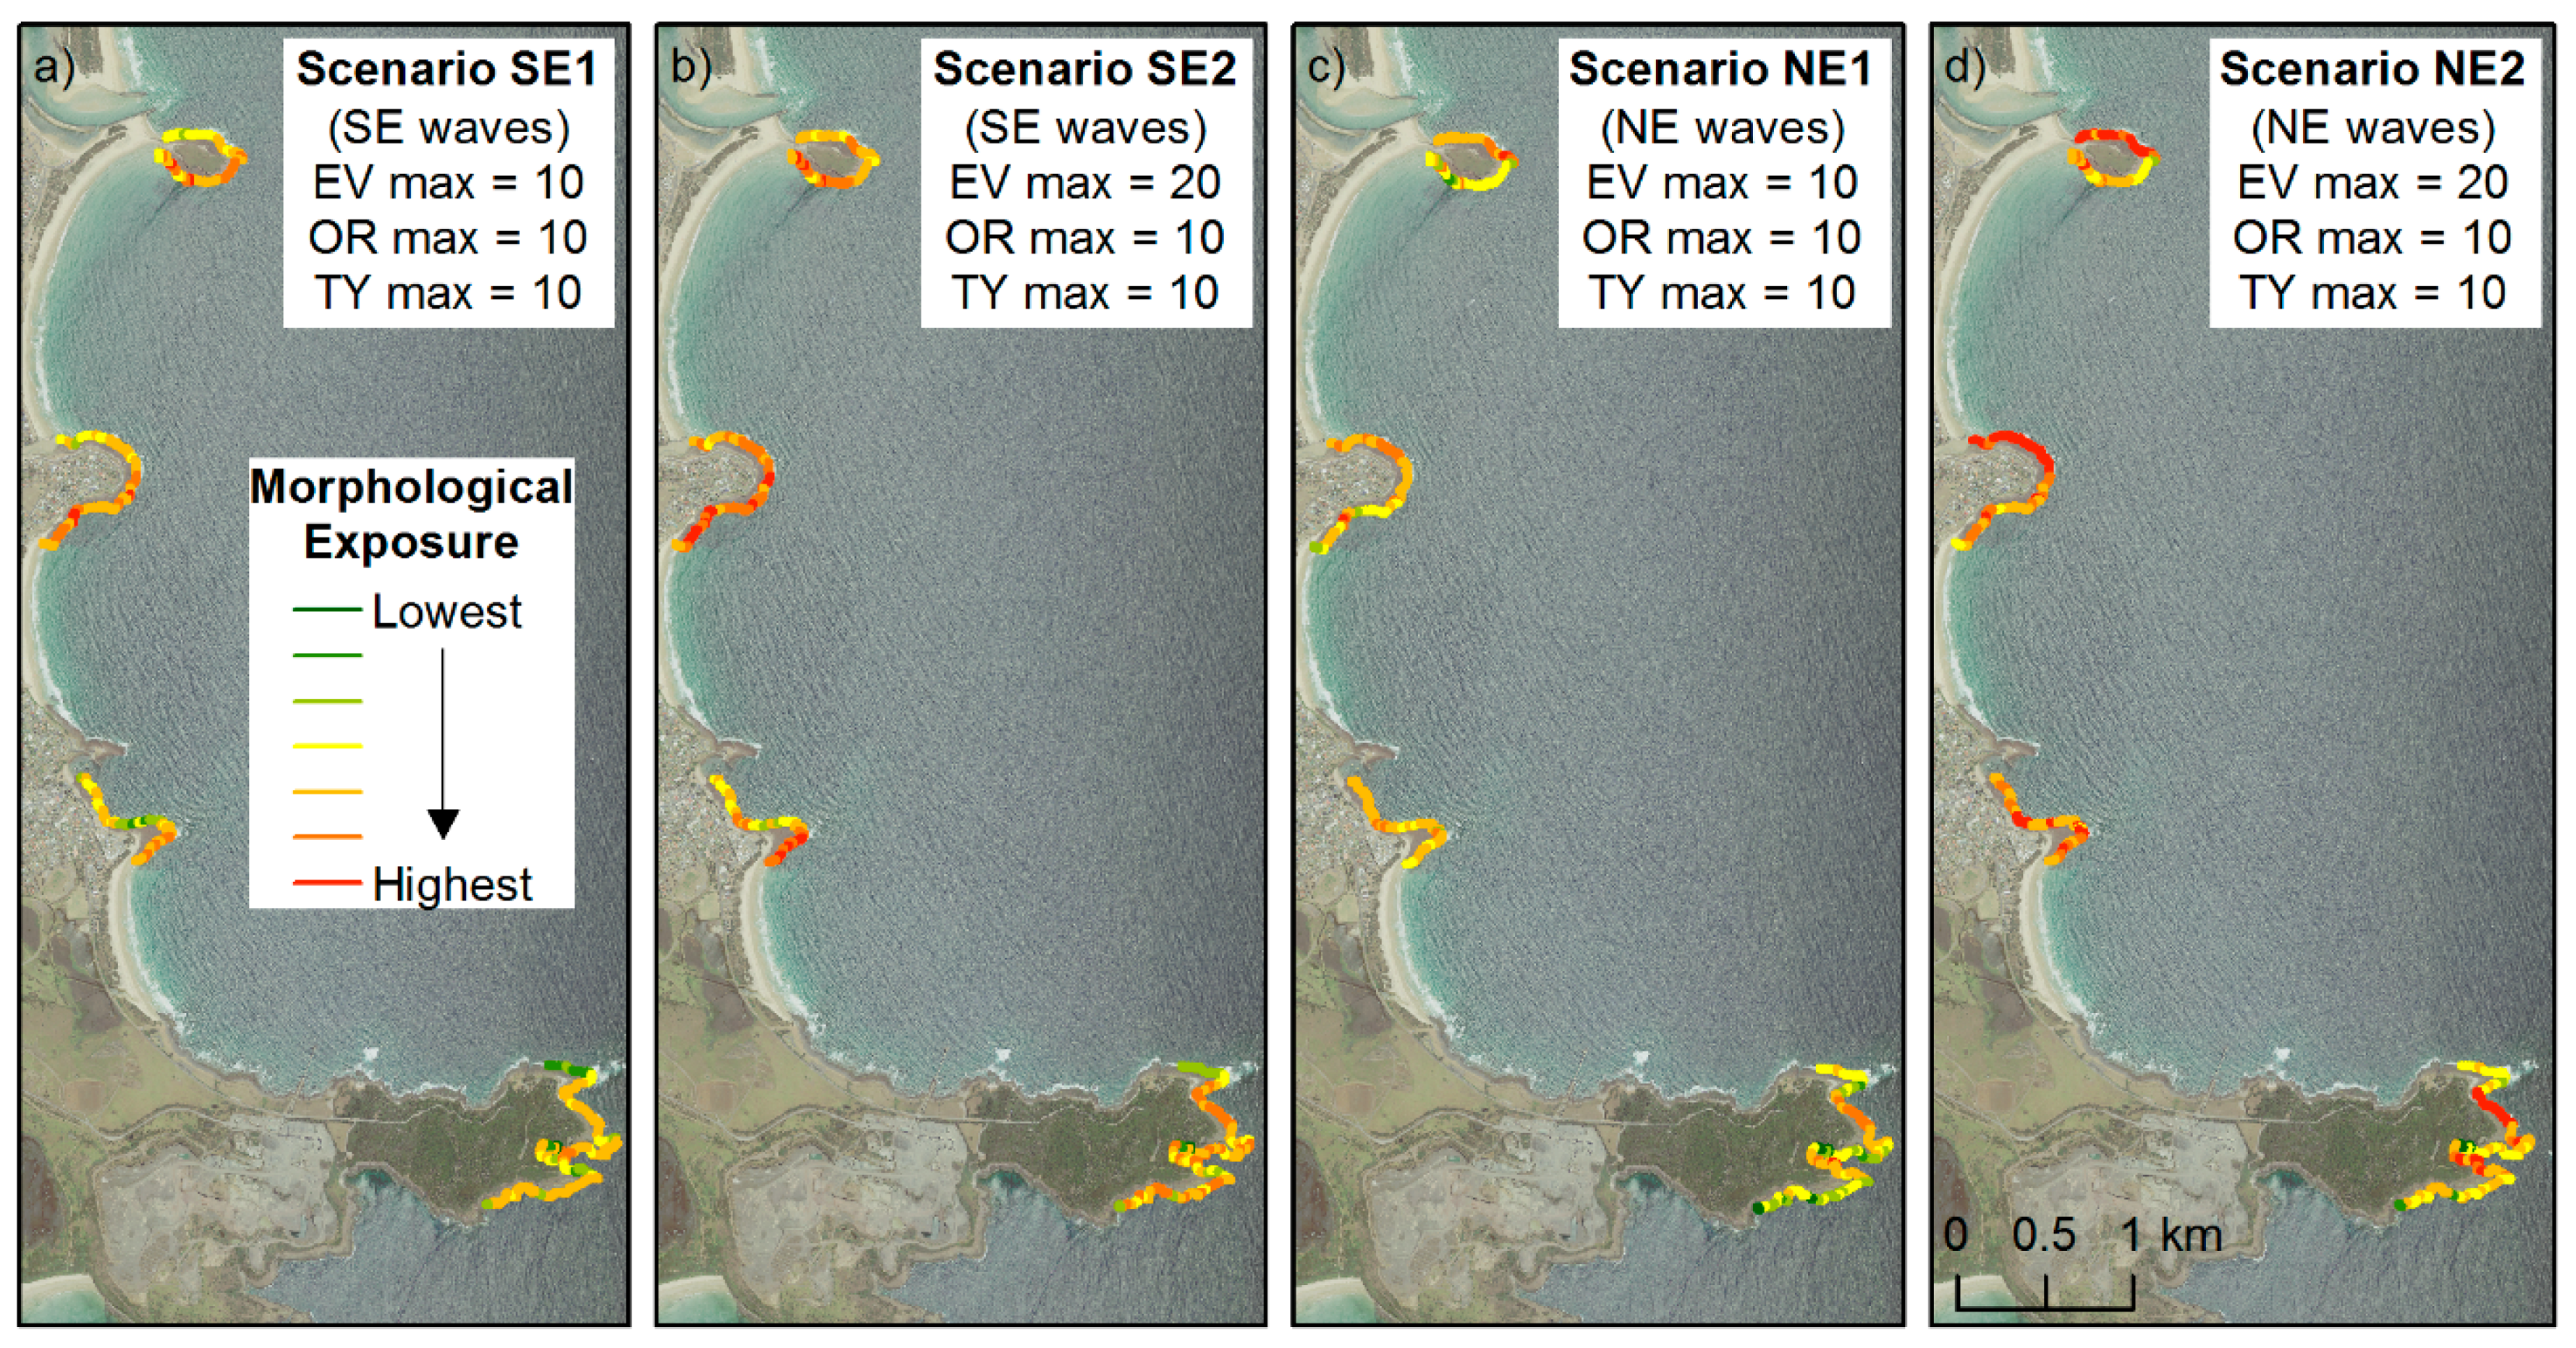
Once all morphological parameters were calculated, a morphological exposure (ME) hazard index based on the mean elevation (EV), orientation (OR) and type (TY) of platform segment was created using Equation (1) and the weightings in Table 2. It is worth noting that, as in [7], the absence of fine/medium scale bathymetry adjacent to the rock platforms of the study area implied that no distinct morphologies below sea level, identified as important in wave transformation [29], could be assigned, and therefore, the water depth immediately seaward of the platform edge could not be estimated.
ME = EV + OR + TY
Four distinct ME scenarios were created. Scenarios SE1 and SE2 represent the predominant wave climate with swells from the southeasterly direction, and scenarios NE1 and NE2 represent swells from the northeasterly direction, that mostly occur during summer months. The alternative scenarios tested the effect of weighting the morphological parameters differently. For scenarios SE1 and NE1, all morphological parameters (elevation, orientation and type) were equally weighted (10 maximum for each parameter), whereas for scenarios SE2 and NE2, a maximum weighting of 20 was assigned for elevation whereas orientation and type were weighted 10 each. Elevation received twice the weighting assigned for orientation and type for scenarios SE2 and NE2 as this terrain derivative is considered a key parameter for determining the exposure of fishers on microtidal rock platforms [30].
The range of EV observed in the study area was classified into five equal interval categories (Table 2). The lowest class (−0.89–0.78 m AHD) received a weighting of 10 and the highest elevation class (5.82–7.49 m AHD) received a weighting of 2. These values were doubled for scenarios SE2 and NE2. Type A segments, that have gently sloping gradients without a significant topographic break at the seaward edge resulting in a gradual dissipation of the wave energy before reaching the subaerial part of the platforms, were given a weighting of 5. Type B segments were given a weighting of 10. These segments had an abrupt edge and a low tide cliff-face from which we infer a greater water depth offshore of the platform, enabling waves to break closer to, or at, the seaward edge, implying that more energy is capable of overtopping the platform edge.
Segment orientation received different weighting because waves lose energy through shoaling and refraction [5]. Platforms facing the predominant swell direction are more exposed and, therefore, for swells from the southeasterly direction (scenarios SE1 and SE2), a maximum weighting was assigned to southeast-facing segments and the lowest weighting was assigned to northwesterly-oriented segments. For northeasterly swells (scenarios NE1 and NE2), the lowest weighting was assigned to southwesterly-oriented segments, whereas the maximum weighting was assigned to segments facing the northeast. These different directional scenarios were incorporated to capture the seasonal wave variability in the area.
Type B, low elevation (up to 0.78 m AHD) segments, oriented to the predominant swell direction were determined to have the highest morphological exposure index, and could potentially score a maximum of 40 points depending on the scenario. Conversely, type A, high elevated segments facing the opposite direction to the predominant swell direction were considered the least hazardous, and could potentially score a minimum of 9 points depending on the scenario. Once all scenarios were calculated, ME values were classified into seven equal interval categories (lowest to highest) similar to the methodology adopted by [30].

3. Results

3.1. Digital Surface Models (DSMs) and Accuracy Assessment

Photomosaic and DSMs of four platforms are shown in Figure 4. Black polygons in photomosaics indicate platform extent used in the delimitation of seaward edges. Elevation range was greatest at Bass Point (26.2 m) followed by Windang Island (21.8 m), Barrack Point (18.9 m) and Shellharbour South (18.5 m). Pixel values of −1.6 m, representing the lowest elevation obtained in all DSMs, were retrieved in Bass Point.
Morphology of these platforms varied considerably. The eastern part of Windang Island is much higher than the remaining parts of this platform, with heights above 5 m AHD. No major changes in platform elevation exist at Barrack Point and Shellharbour South, whereas slopes are greatest at Bass Point. Maximum platform width is approximately 90 m at Windang, 85 at Barrack Point, 200 m at Shellharbour South and 260 m at Bass Point. Three dangerous rock indentations exist at Bass Point and one to the east of Windang Island.
Accuracy assessment of the DSMs based on the coefficient of determination (R2) indicated a very strong relationship between the independent elevations obtained with the RTK-GPS and DSM-derived elevations. The strongest correlation was observed at Barrack Point (0.99) and the weakest was at Shellharbour South (0.85). The best RMSE was obtained for Shellharbour South DSM (0.29 m) and the worst one was Bass Point (0.59 m) (Figure 5).

3.2. Morphological Parameters

A total of 178 individual segments were assessed (Figure 6). Mean elevation varied from 0.21 to 5.24 m AHD for the 32 segments of Windang Island, −0.59 to 2.18 m AHD for the 38 segments of Barrack Point, −0.89 to 1.79 m AHD for the 32 segments of Shellharbour South, and 0.09 to 7.49 m AHD for the 76 analysed segments of Bass Point. The average elevation and standard deviation of all segments were 1.68 and 1.16 m AHD, respectively. However, the mean elevation of approximately half of the platform edges (91 out of 178) was lower than 0.9 m AHD (mean sea level). The high mean elevation of all segments is mainly driven by the segments of Windang Island (1.38 m) and Bass Point (1.68 m) that lie above high tide level in contrast to many platforms around the world, including Barrack Point (0.33 m) and Shellharbour South (0.61 m) that are intertidal. In general terms, the highest elevation segments (>1.8 m) were located on the east of Windang Island and at Bass Point. Adjacent segments within the Windang platform showed a mean elevation variation of 2.5 m, highlighting the spatially variable nature of some platform morphology, as indicated by [7].
The most common segment orientation was south (41 segments) followed by north (36), and northeast and southeast (32 each). Of the 91 segments, 67 (73.6%) lower than the mean sea level were oriented to the north, northeast or south. Approximately 10% (18) of all analysed segments were of type B. They were mostly located at Windang Island and absent from the Shellharbour South platform.

3.3. Morphological Exposure Index

As expected, different morphological exposure results were obtained from the four simulated scenarios (Figure 7). For southeasterly waves, 4 and 16 individual segments achieved the highest ranking for scenarios SE1 and SE2, respectively. The most exposed segments for scenario SE1 were concentrated along southern parts of Windang Island and Barrack Point platforms, whereas scenario SE2 also included some of the segments located on the eastern part of Barrack Point and the southern part of Shellharbour South. The latter ones must be interpreted with caution, as the headland of Bass Point would somewhat protect the Shellharbour South platform from southeasterly waves.
Only one individual segment reached the highest morphological index for scenario NE1. The highest ranked for scenario NE1 was located inside Bushrangers Bay and one must also have reservations about it, in view of the protection granted by the northern headland of this bay. The second highest class for scenario NE1 was reached by 27 segments. These segments were located on all four platforms. Of the segments, 24 were deemed the highest morphological index for scenario NE2. All these segments were also considered the highest or the second highest class for scenario NE1.

4. Discussion

RGB cameras mounted on UAVs are suitable for deriving digital terrain models (DTMs) in coastal settings such as rock platforms, which are mostly devoid of vegetation and built environment. Contrary to most other coastal settings, UAV-derived DSMs are almost equivalent to DTMs on rock platforms. However, rainfall or saltwater accumulation on surfaces within rock platforms may influence the determination of bare-ground elevation of some areas.
According to [30], the main limitation to the calculation of morphological exposure and risk indices is data availability. The low-cost data provided by UAVs can be used not only to fill the gaps in the LiDAR data but also to cover multiple platforms along a stretch of rocky coastline devoid of topographic data over a few days of fieldwork. Water level difference driven by tidal movements has to be taken into account as UAV and RTK-GPS surveys may take a few hours at each platform, depending on the survey area, flight altitude, platform access and shape, topography of the terrain (some platforms may have gullies and faults difficult to transpose), availability of take-off and landing areas, restricted airspace and other factors.
Although much more important in macrotidal settings, tidal variations can also be significant in microtidal environments such as the Illawarra Region, influencing the delimitation of the seaward edge for hazard assessments. The lack of common criteria for defining the seaward edge based on different approaches has led to difficulty in comparing results from different authors. Out of the five approaches (tidal elevation, morphological, sedimentological, biological and process) observed in the literature and summarised by [31], tidal elevation seems to be the easiest one to apply to subaerial remotely-sensed data when acquisition time is known. However, even in microtidal settings, there is still no consensus on the adoption of a tidal benchmark as some authors have used the lowest low tide (LLT) [32,33], whereas others [34] used the low spring tide (LST).
In any case, the acquisition of UAV data without much tidal variation (0.5 m was the approximate tidal variation between surveys) below mean sea level (approximately 0 m AHD in NSW) such as the data collected here, allows one to minimise the discrepancies between sites and indicate whether inter-study comparisons can be made. However, one issue arises when UAV surveys are conducted in order to fill topographic gaps in LiDAR surveys, as the exact time and sometimes even the exact date of the LiDAR survey is hardly ever recorded in the metadata file. When recorded, traditional airborne topographic LiDAR data collected across-shore at an altitude of 2000 m and swath widths in the range of 1000 m, such as the Kiama LiDAR dataset used here, may still present difficulties in the delimitation of the seaward edges due to tidal changes, as observed by [35].
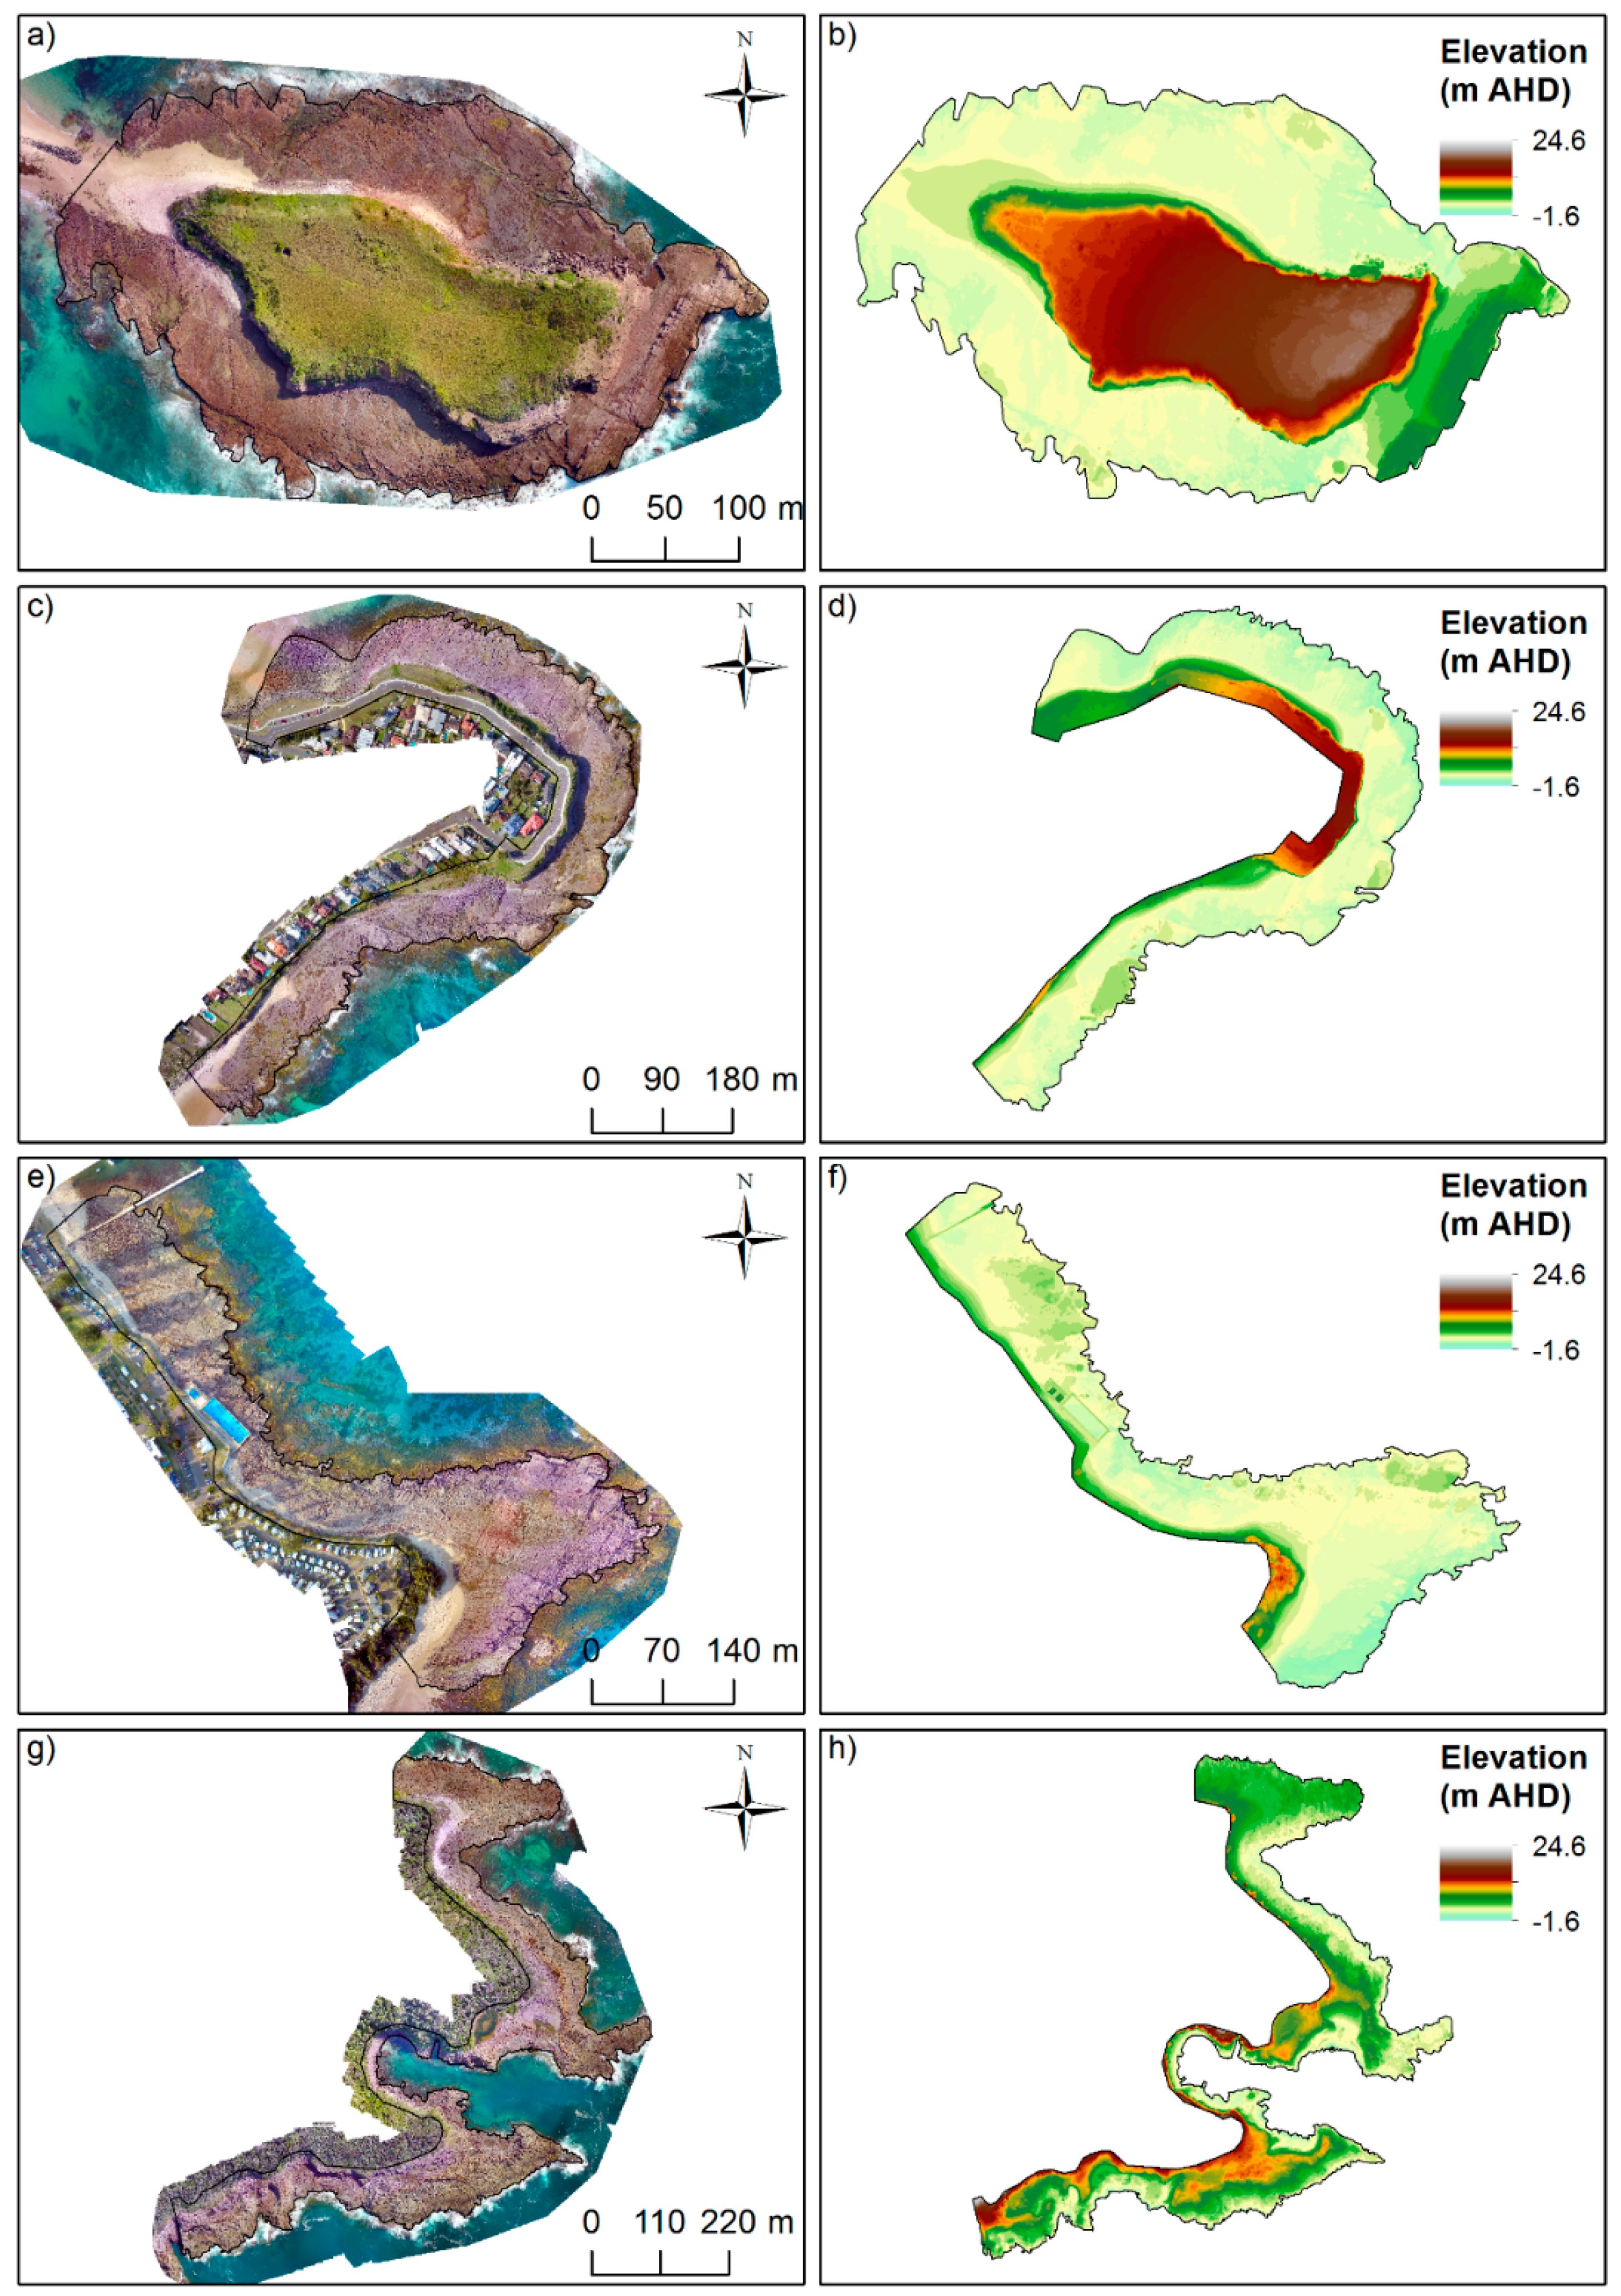
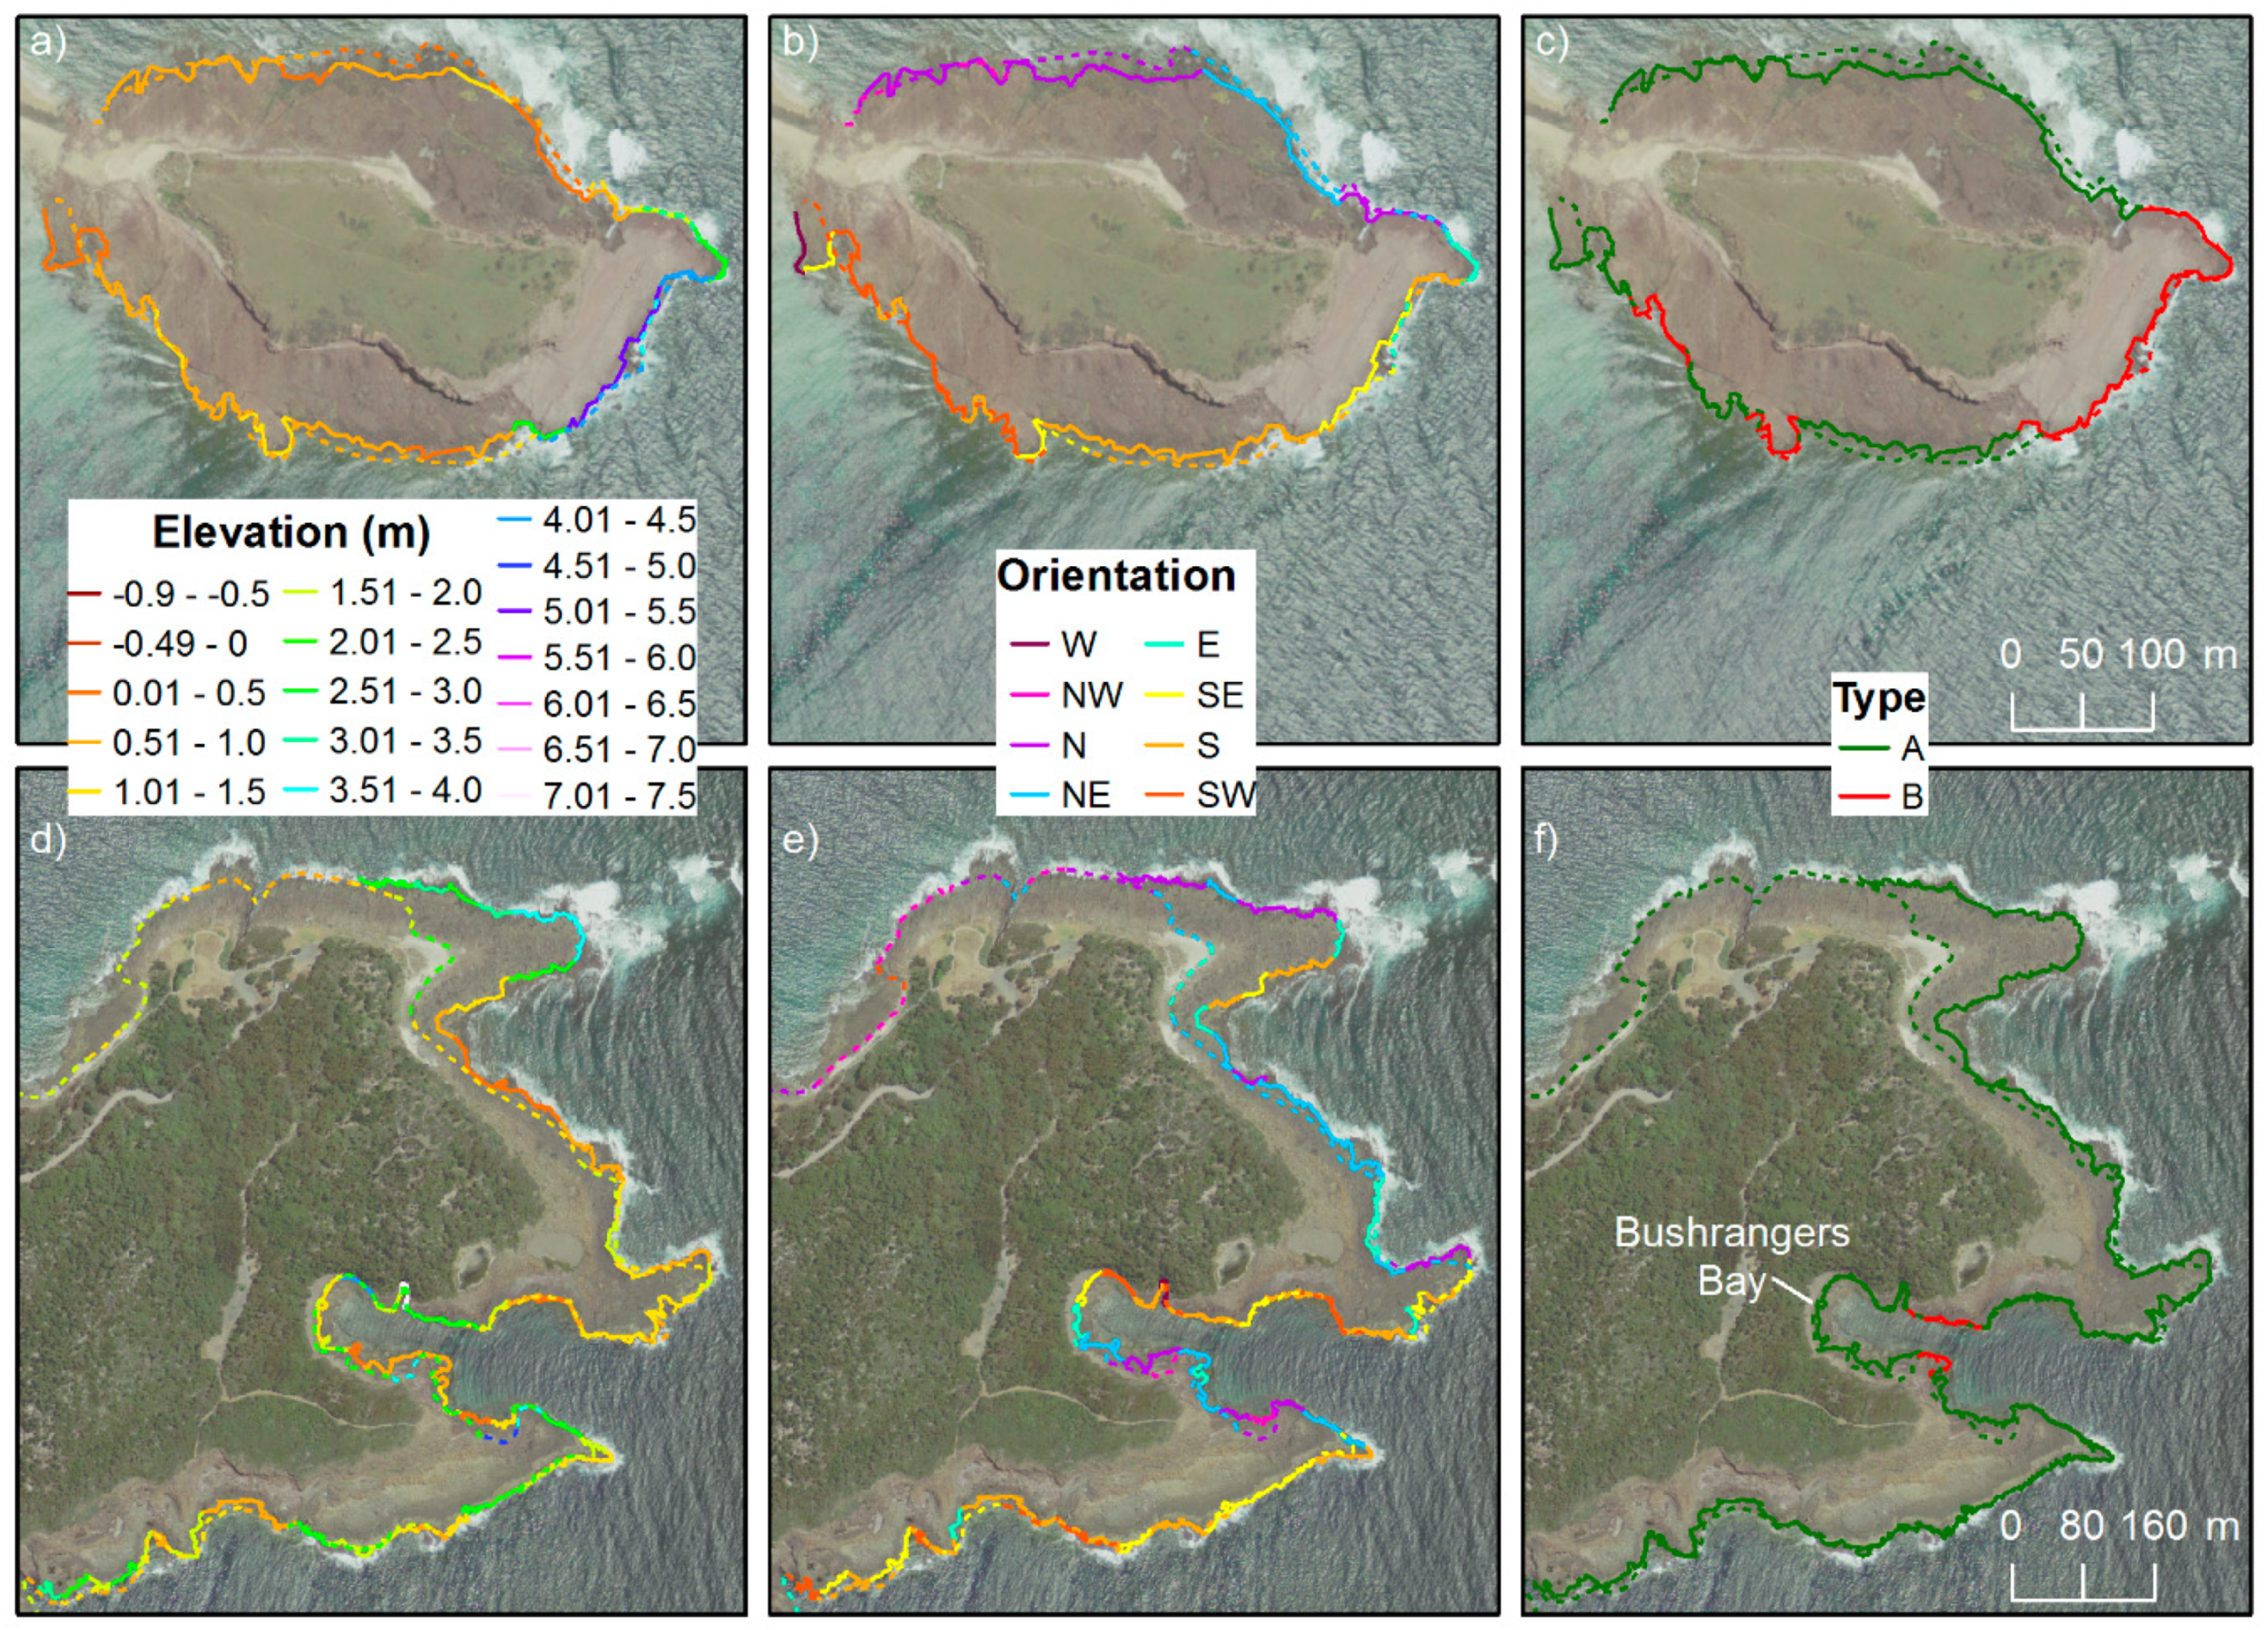
Figure 8 was created to highlight the point above. The maps show a comparison of mean elevation, orientation and type for individual segments presented in this study (full lines) using UAV data, and for segments analysed by [7] using LiDAR data (dashed line). One thing that clearly stands out is the difference in the definition of the seaward edge. At Windang Island (a, b and c), the seaward edge derived by LiDAR was located further out than the one delimited from the UAV data for large parts of the platform, whereas at Bass Point (d, e and f), edge delimitation was mostly the same, apart from the northeastern part of the platform that showed a large disparity between surveys, probably as a result of classification issues performed by the contractor. Given that the LiDAR metadata file indicates that 37 flight runs were needed over 16 days to capture the Kiama dataset (which extends for approximately 600 km2 in both the westerly and southerly directions), conjectures about tidal levels are difficult to formulate.
The delimitation of the seaward edge using UAV data collected during calm conditions (low wind, waves and sediment suspension in the water) can also present issues. In shallow confined water areas of platforms such as at Bushranger Bay at Bass Point, the process can derive the topography of the seafloor. This has been the case, during the UAV survey for that part of Bass Point. Waves and white water created inaccurate surfaces in more exposed areas, due to the difference in elevation and colour driven by the water movement in distinct images. However, the close to ideal conditions in the shallow/protected areas of Bushrangers Bay allowed bathymetry to be derived. This has made delimitation of the seaward edge trickier than when an inaccurate surface is observed.
The RMSE for the DSMs reported here is considered within the range of reported RMSE values in the literature compiled by [24], as the point-to-raster accuracy comparison is normally higher than other techniques (point-to-point or raster-to-raster comparison). This is based on the fact that the independent RTK-GPS datasets were validated against rasterised data products derived from SfM techniques, whose point cloud data were not used directly in the accuracy assessment. Furthermore, as an internal part of the georeferencing process, 3D position error of each GCP introduces an additional source of error into the SfM process, as indicated by the previously mentioned authors. When compared with the horizontal (0.8 m) and vertical accuracy (0.3 m) provided by the LiDAR supplier, the assessments presented in Figure 5 seem satisfactory. Furthermore, the discrepancies in the location of the seaward edge mapped using both techniques presented in Figure 8a,d indicate a consistent pattern between datasets (furthest seaward segments lower than the landward-most ones).
In terms of hazard results, the subtle variations in the delimitation of individual segments presented in Figure 8 can yield slight changes in the hazard rank, mostly driven by changes in elevation and orientation classes. Nevertheless, this should not have a major effect on the results, as the morphological exposure (hazard) is just one component of the assessment of risks, which should also take into account the number of fishers (usage) and their susceptibility to drowning. The incorporation of usage and susceptibility to drowning, as well as other hazard variables, such as nearshore wave transformation and front depth adjacent to platforms, should provide a more robust ranking and improve fishing management risks.

5. Conclusions

In recent years, most of the rock fishing drownings that occurred in Australia were in NSW and statistical analysis of the accidents indicates that at least 55% were caused by waves. Platform morphology is central to better understanding the risk of rock fishers being washed away by waves over the seaward edge and potentially drowned. Here, we used UAV-derived morphological parameters from data-poor platforms in Illawarra, showing the potential of this technology to fill the gaps of a replicable hazard index created previously for the region. As in the original study, four scenarios are presented based on distinct wave direction and weighting systems. Results indicate that the most exposed segments to southerly wave scenarios are located along the southern parts of the Windang Island and Shellharbour South, and the southern and eastern parts of Barrack Point platforms, whereas more than 20 segments distributed along all four platforms were deemed the most exposed to northeasterly waves. UAV-derived morphometric parameters, and consequently exposure scenarios, were comparable with previously published LiDAR-derived results, despite localised differences in the delimitation of the seaward edge. These imply that UAV data can be successfully used to guide risk policy on rock coasts.

Supplementary Materials

3D models of Barrack Point and Shellharbour South platforms are available at https://skfb.ly/6JSXV and https://skfb.ly/6JSXN, respectively.

Author Contributions

Conceptualization, R.C.C.; funding acquisition, C.D.W.; investigation, R.C.C.; methodology, R.C.C.; project administration, C.D.W.; software, R.C.C.; supervision, C.D.W.; writing—original draft, R.C.C.; writing—review and editing, R.C.C. and C.D.W.

Funding

This research was funded by the Australian Research Council (ARC) Linkage Program (LP130100204) and Surf Life Saving Australia.

Acknowledgements

The authors are grateful to the NSW Land and Property Information for provision of the LiDAR data used in the original study, and to David Kennedy (The University of Melbourne) for leading the Linkage Program and for constructive discussions during the course of it. The manuscript was improved as a result of valuable comments by three anonymous reviewers.

Conflicts of Interest

The authors declare no conflict of interest. The funders had no role in the design of the study; in the collection, analyses, or interpretation of data; in the writing of the manuscript, or in the decision to publish the results.

References

  1. Trenhaile, A.S. The Geomorphology of Rock Coasts; Clarendon Press: Oxford, UK, 1987; p. 384. [Google Scholar]
  2. Sunamura, T. Geomorphology of Rocky Coasts; John Wiley & Sons: Chichester, UK, 1992; p. 302. [Google Scholar]
  3. Griggs, G.B.; Trenhaile, A.S. Coastal cliffs and platforms. In Coastal Evolution: Late Quaternary Shoreline Morphodynamics; Carter, R.W.G., Woodroffe, C.D., Eds.; Cambridge University Press: Cambridge, UK, 1994; pp. 425–450. [Google Scholar]
  4. Stephenson, W.J.; Dickson, M.E.; Trenhaile, A.S. Rock Coasts. In Treatise on Geomorphology; Shroder, J.F., Ed.; Academic Press: San Diego, CA, USA, 2013; pp. 289–307. [Google Scholar]
  5. Kennedy, D.M.; Sherker, S.; Brighton, B.; Weir, A.; Woodroffe, C.D. Rocky coast hazards and public safety: moving beyond the beach in coastal risk management. Ocean Coast. Manag. 2013, 82, 85–94. [Google Scholar] [CrossRef]
  6. Moran, K. Rock-based fisher safety promotion: a decade on. Int. J. Aquat. Res. Edu. 2017, 10, 1. [Google Scholar] [CrossRef]
  7. Carvalho, R.C.; Kennedy, D.M.; Woodroffe, C.D. A morphology‑based drowning risk index for rock platform fishing: a case study from southeastern Australia. Nat. Hazards 2019. [Google Scholar] [CrossRef]
  8. Beetham, E.P.; Kench, P.S. Field observations of infragravity waves and their behavior on rock shore platforms. Earth Surf. Proc. Landf. 2011, 36, 1872–1888. [Google Scholar] [CrossRef]
  9. Ogawa, H.; Dickson, M.E.; Kench, P.S. Hydrodynamic constraints and storm wave characteristics on a sub-horizontal shore platform. Earth Surf. Proc. Landf. 2015, 40, 65–77. [Google Scholar] [CrossRef]
  10. Emery, K.O.; Kuhn, G.G. Sea Cliffs, Their Processes, Profiles and Classification. Geol. Soc. Am. Bull. 1982, 93, 644–654. [Google Scholar] [CrossRef]
  11. Trenhaile, A.S. Rock coasts, with particular emphasis on shore platforms. Geomorphology 2002, 48, 7–22. [Google Scholar] [CrossRef]
  12. Ryan, A.; Rijksen, E.; Stone, K.; Daw, S. Coastal Safety Brief: Rock Fishing; Surf Life Saving Australia: Sydney, NSW, Australia, 2018. [Google Scholar]
  13. SLSA. National Coastal Safety Report 2017; Surf Life Saving Association of Australia: Sydney, NSW, Australia, 2017. [Google Scholar]
  14. ABS 2018 Australian Demographic Statistics, Sep 2018. Available online: https://www.abs.gov.au/AUSSTATS/abs@.nsf/0/D56C4A3E41586764CA2581A70015893E?Opendocument (accessed on 22 March 2019).
  15. Dana, J.D. Geology; Report of the United States Exploring Expedition 1838–1842; Sherman: Philadelphia, PA, USA, 1849; Volume 10. [Google Scholar]
  16. Brooke, B.P.; Young, R.W.; Bryant, E.A.; Murray-Wallace, C.V.; Price, D.M. A Pleistocene origin for shore platforms along the northern Illawarra coast, New South Wales. Aust. Geogr. 1994, 25, 178–185. [Google Scholar] [CrossRef]
  17. Kennedy, D.M.; Brighton, B.; Weir, A.; Sherker, S.; Woodroffe, C.D. Towards a typology of rocky coasts in the context of risk assessment. In Proceedings of the 21st NSW Coastal Conference, Kiama, Australia, 6–9 November 2012. [Google Scholar]
  18. Bird, E.C.F.; Dent, O.F. Shore platforms of the South Coast of New South Wales. Aust. Geogr. 1966, 10, 71–80. [Google Scholar] [CrossRef]
  19. Young, R.W.; Bryant, E.A. Coastal rock platforms and ramps of Pleistocene and Tertiary age in southern New South Wales, Australia. Z. Geomorphol. 1993, 37, 257–272. [Google Scholar]
  20. Brooke, B.P. Shore Platforms of Northern Illawarra. Honours Thesis, University of Wollongong, Wollongong, NSW, Australia, 1993. [Google Scholar]
  21. Lejot, J.; Delacourt, C.; Piegay, H.; Fournier, T.; Tremelo, T.; Allemand, P. Very high spatial resolution imagery for channel bathymetry and topography from an Unmanned Aerial Platform. Earth Surf. Proc. Landf. 2007, 32, 1705–1725. [Google Scholar] [CrossRef]
  22. Westoby, M.J.; Brasington, J.; Glasser, N.F.; Hambrey, M.J.; Reynolds, J.M. “Structure-from-Motion” photogrammetry: A low-cost, effective tool for geoscience applications. Geomorphology 2012, 179, 300–314. [Google Scholar] [CrossRef]
  23. James, M.R.; Robson, S. Straightforward reconstruction of 3D surfaces and topography with a camera: accuracy and geoscience application. J. Geophys. Res. Atmos. 2012, 117. [Google Scholar] [CrossRef]
  24. Carrivick, J.L.; Smith, M.W.; Quincey, D.J. Structure from Motion in the Geosciences; Wiley-Blackwell: Chichester, UK, 2016; p. 208. [Google Scholar]
  25. Pix4D SA. Pix4Dmapper 4.1 User Manual; Pix4D SA: Lausanne, Switzerland, 2017. [Google Scholar]
  26. Marshall, R.J.E.; Stephenson, J.S. The morphodynamics of shore platforms in a micro-tidal setting: interactions between waves and morphology. Mar. Geol. 2011, 288, 18–31. [Google Scholar] [CrossRef]
  27. Stephenson, W.J.; Thornton, L.E. Australian rock coasts: review and prospects. Aust. Geogr. 2005, 36, 95–115. [Google Scholar] [CrossRef]
  28. Stephenson, W. Rock Coasts. In Coastal Environments and Global Change; Masselink, G., Gehrels, W.R., Eds.; Wiley: Chichester, UK, 2014; pp. 356–379. [Google Scholar]
  29. Kennedy, D.M. The subtidal morphology of microtidal shore platforms and its implication for wave dynamics on rocky coasts. Geomorphology 2016, 268, 146–158. [Google Scholar] [CrossRef]
  30. Kennedy, D.M.; Ierodiaconou, D.; Weir, A.; Brighton, B. Wave hazards on microtidal shore platforms: testing the relationship between morphology and exposure. Nat. Hazards 2017, 86, 41–755. [Google Scholar] [CrossRef]
  31. Kennedy, D.M. Where is the seaward edge? A review and definition of shore platform morphology. Earth-Sci Rev. 2015, 147, 99–108. [Google Scholar] [CrossRef]
  32. Stephenson, W.J.; Kirk, R.M. Development of shore platforms on Kaikoura Peninsula, South Island, New Zealand: Part One: the role of waves. Geomorphology 2000, 32, 21–41. [Google Scholar] [CrossRef]
  33. Stephenson, W.J.; Kirk, R.M. Development of shore platforms on Kaikoura Peninsula, South Island, New Zealand: II: the role of subaerial weathering. Geomorphology 2000, 32, 43–56. [Google Scholar] [CrossRef]
  34. Davies, P.; Sunamura, T.; Takeda, I.; Tsujimoto, H.; Williams, A.T. Controls of shore platform width: the role of rock resistance factors at selected sites in Japan and Wales, UK. J. Coast. Res. 2006, SI 39, 160–164. [Google Scholar]
  35. Palamara, D.R.; Dickson, M.E.; Kennedy, D.M. Defining shore platform boundaries using airborne laser scan data: A preliminary investigation. Earth Surf. Proc. Landf. 2007, 32, 945–953. [Google Scholar] [CrossRef]
Figure 1. Rock platform site locations along the Illawarra coast. (a) Location of the Illawarra region. (b) Spatial extent (from Stanwell Park to Bass Point) of platforms investigated by [7]. Rock platforms investigated in this study (c). Rectangular area indicates platforms of Windang Island (d), Barrack Point (e), Shellharbour South (f) and Bass Point (g). Location of ground control points (GCPs) used to georeference the digital surface models (DSMs) and independent points used in the accuracy assessment of DSMs are shown in yellow and red, respectively.
Drones 03 00042 g001
Figure 2. Stormy conditions during LiDAR survey acquisition at Barrack Point (a) and Shellharbour South (b). Note wave crests of more than 4 m AHD (red colour) around platforms, partially inundated surfaces and high elevated water levels at the seaward edges.
Drones 03 00042 g002
Figure 3. Example of the methodological process to derive morphometric parameters for Barrack Point platform. (a) Photomosaic showing platform extent polygon and UAV flight mosaic, draped on base map; (b) UAV-derived point cloud and seaward edge extracted from platform extent polygon; (c) 50 × 10 m segments; (d) elevation of segments; (e) segment mean elevation; (f) segment orientation; and (g) segment type showing both sloping (type A) and abrupt seaward edge (type B) morphologies. Oblique images representing both morphologies taken from Pix4Dmapper.
Drones 03 00042 g003
Figure 4. Photomosaic (left) and DSMs (right) of Windang Island (a,b), Barrack Point (c,d), Shellharbour South (e,f) and Bass Point (g,h). DSMs were clipped using platform extent polygon. Elevation symbology has been standardised to allow comparison of DSMs. Links to Barrack Point and Shellharbour South models are available as Supplementary Materials.
Drones 03 00042 g004
Figure 5. Accuracy assessment of UAV-derived DSMs based on comparison of independent elevation dataset measured in situ (RTK-GPS) and values derived from DSMs for Windang Island (n = 69), Barrack Point (n = 79), Shellharbour South (n = 71) and Bass Point (n = 148).
Drones 03 00042 g005
Figure 6. Mean elevation (a), orientation (b) and type (c) classification for the 178 segments analysed at Windang Island, Barrack Point, Shellharbour South and Bass Point platforms.
Drones 03 00042 g006
Figure 7. Morphological exposure index based on four modelled scenarios.
Drones 03 00042 g007
Figure 8. Comparison of mean elevation (left), orientation (middle) and type (right) segments derived by UAV (full line) and LiDAR (dashed line) at Windang Island (ac) and Bass Point (df). LiDAR-derived segments from [7].
Drones 03 00042 g008
Table 1. Unmanned aerial vehicle (UAV) flight and processing parameters for each studied platform. * Denotes average tide level during UAV flights (Mean Sea Level = 0 m AHD which is approximately 0.9 m tide level).
PlatformFlight DateTide Level * (m)Wave Height (m)Flight Area (km2)Number PhotosAverage 2D Keypoints/Photo
Windang Island18 Apr 2017~0.71–1.50.1357943,087
Barrack Point04 Jan 2018~0.3<0.50.2244246,797
Shellharbour South04 Jan 2018~0.2<0.50.1930656,291
Bass Point24 Apr 2017~0.40.5–10.3454050,018
Table 2. Weighting system adopted for the four scenarios based on predominant wave swell from southeasterly (SE1 and SE2 scenarios) and northeasterly (NE1 and NE2 scenarios) directions. Morphological parameters were equally weighted for scenarios SE1 and NE1, whereas elevation received twice the weighting assigned for orientation and type, in scenarios SE2 and NE2.
ScenariosElevation (EV)Orientation (OR)Type (TY)
SE1 (Equal weighting; SE waves)5.82–7.49 m = 2NW = 2,A = 5
B = 10
4.14–5.81 m = 4N and W = 4,
2.47–4.13 m = 6NE and SW = 6,
0.79–2.46 m = 8E and S = 8,
−0.89–0.78 m = 10SE = 10
SE2 (Elevation twice the weighting of other parameters; SE waves)5.82–7.49 m = 4NW = 2,A = 5
B = 10
4.14–5.81 m = 8N and W = 4,
2.47–4.13 m = 12NE and SW = 6,
0.79–2.46 m = 16E and S = 8,
−0.89–0.78 m = 20SE = 10
NE1 (Equal weighting; NE waves)5.82–7.49 m = 2SW = 2,A = 5
B = 10
4.14–5.81 m = 4S and W = 4,
2.47–4.13 m = 6SE and NW = 6,
0.79–2.46 m = 8E and N = 8,
−0.89–0.78 m = 10NE = 10
NE2 (Elevation twice the weighting of other parameters; NE waves)5.82–7.49 m = 4SW = 2,A = 5
B = 10
4.14–5.81 m = 8S and W = 4,
2.47–4.13 m = 12SE and NW = 6,
0.79–2.46 m = 16E and N = 8,
−0.89–0.78 m = 20NE = 10

