
Forecasting Tsunami Hazards Using Ocean Bottom Sensor Data and Classification Predictive Modeling †


Department of Statistical and Actuarial Sciences, Western University, London, ON N6A 3K7, Canada
†
Presented at the 4th International Electronic Conference on Geosciences, 1–15 December 2022; Available online: https://sciforum.net/event/IECG2022 .
Proceedings 2023, 87(1), 7; https://doi.org/10.3390/IECG2022-14266
Published: 20 March 2023
(This article belongs to the Proceedings of The 4th International Electronic Conference on Geosciences)
Abstract
:This study compares the results of analyzing tsunami simulations that are based on two approaches of characterizing earthquake slips, i.e., uniform (simplistic) and heterogeneous (complex) distributions. The aim of this study is to compare how heterogeneous and uniform distributed data affect the classification of maximum near-shore tsunami amplitudes. Due to the lack of historical earthquake and tsunami data to train the forecasting model, 4000 stochastic tsunami simulations are employed. The focused location is Iwanuma, Japan, where an ocean bottom sensors (OBS) S-net network has been deployed. Multiple linear regression combined with the Akaike information criterion (AIC) is applied to the simulated off-shore wave amplitude data to fit the model. The estimated tsunami amplitude is classified into four levels of warning classes. The performance of the models is quantified by the accuracy of the confusion matrices and is compared with the base model, which only uses earthquake information. The forecasting accuracy can be improved by 30% when the wave amplitude data are used as additional information. The heterogeneous slip-based model reaches a higher accuracy than the uniform-slip based model. The results of this study are particularly valuable for setting up an OBS-based system for monitoring the physical phenomena of tsunamis, and choosing heterogeneous as a preferable slip distribution when tsunami events are simulated.
1. Introduction
Tsunamis are rare events, but they can be destructive. In the last two decades, there have been two most notable tsunami events (the 2004 Indian Ocean tsunami and the 2011 Tohoku tsunami), which were triggered by mega earthquakes whose magnitude (M) was 9.0 or greater. Because of the increasing vulnerability of coastal regions on account of growing population and building asset development [1], research on tsunami early warnings has been conducted using various techniques, such as using seismic source (earthquake moment) data [2] and using real-time wave data [3,4].
A tsunami early warning system can foretell information about the amplitude of the tsunami wave and the tsunami’ss arrival time. This study focuses on generating early warnings at Iwanuma in Japan based on the maximum near-shore tsunami amplitude, using a classification model incorporating multiple linear regression (MLR). To fine-tune the model so that the model can capture the uncertainty from a variety of earthquakes that may happened in the future, synthetic earthquake source data and tsunami wave data are used because of lack of historical data. The synthetic slip distribution generated by a stochastic earthquake source model has an important effect on tsunami wave amplitude [5]. Thus, this study considered both uniform and heterogeneous slip distribution for data simulation and model comparison.
This study builds on the results of Li and Goda [6], and develops a tsunami classification model utilizing both uniform and heterogeneous event data. Two types of classification models, i.e., one model trained with earthquake magnitude and location only, denoted as the base model, and the other model with additional parameters from OBS, denoted as the sensor model, are developed under each distribution of data. The model performance of the sensor models is compared with the base model, and also compared against models trained with data with different distributions. The aim of this study is to use statistical regression-based methods to develop a tsunami amplitude classification model for early warning announcement, and investigate how uniformly and heterogeneously distributed slip distributions affect the prediction of tsunamis.
2. Tsunami Data and Classification Model
2.1. Study Area and S-Net Sensors
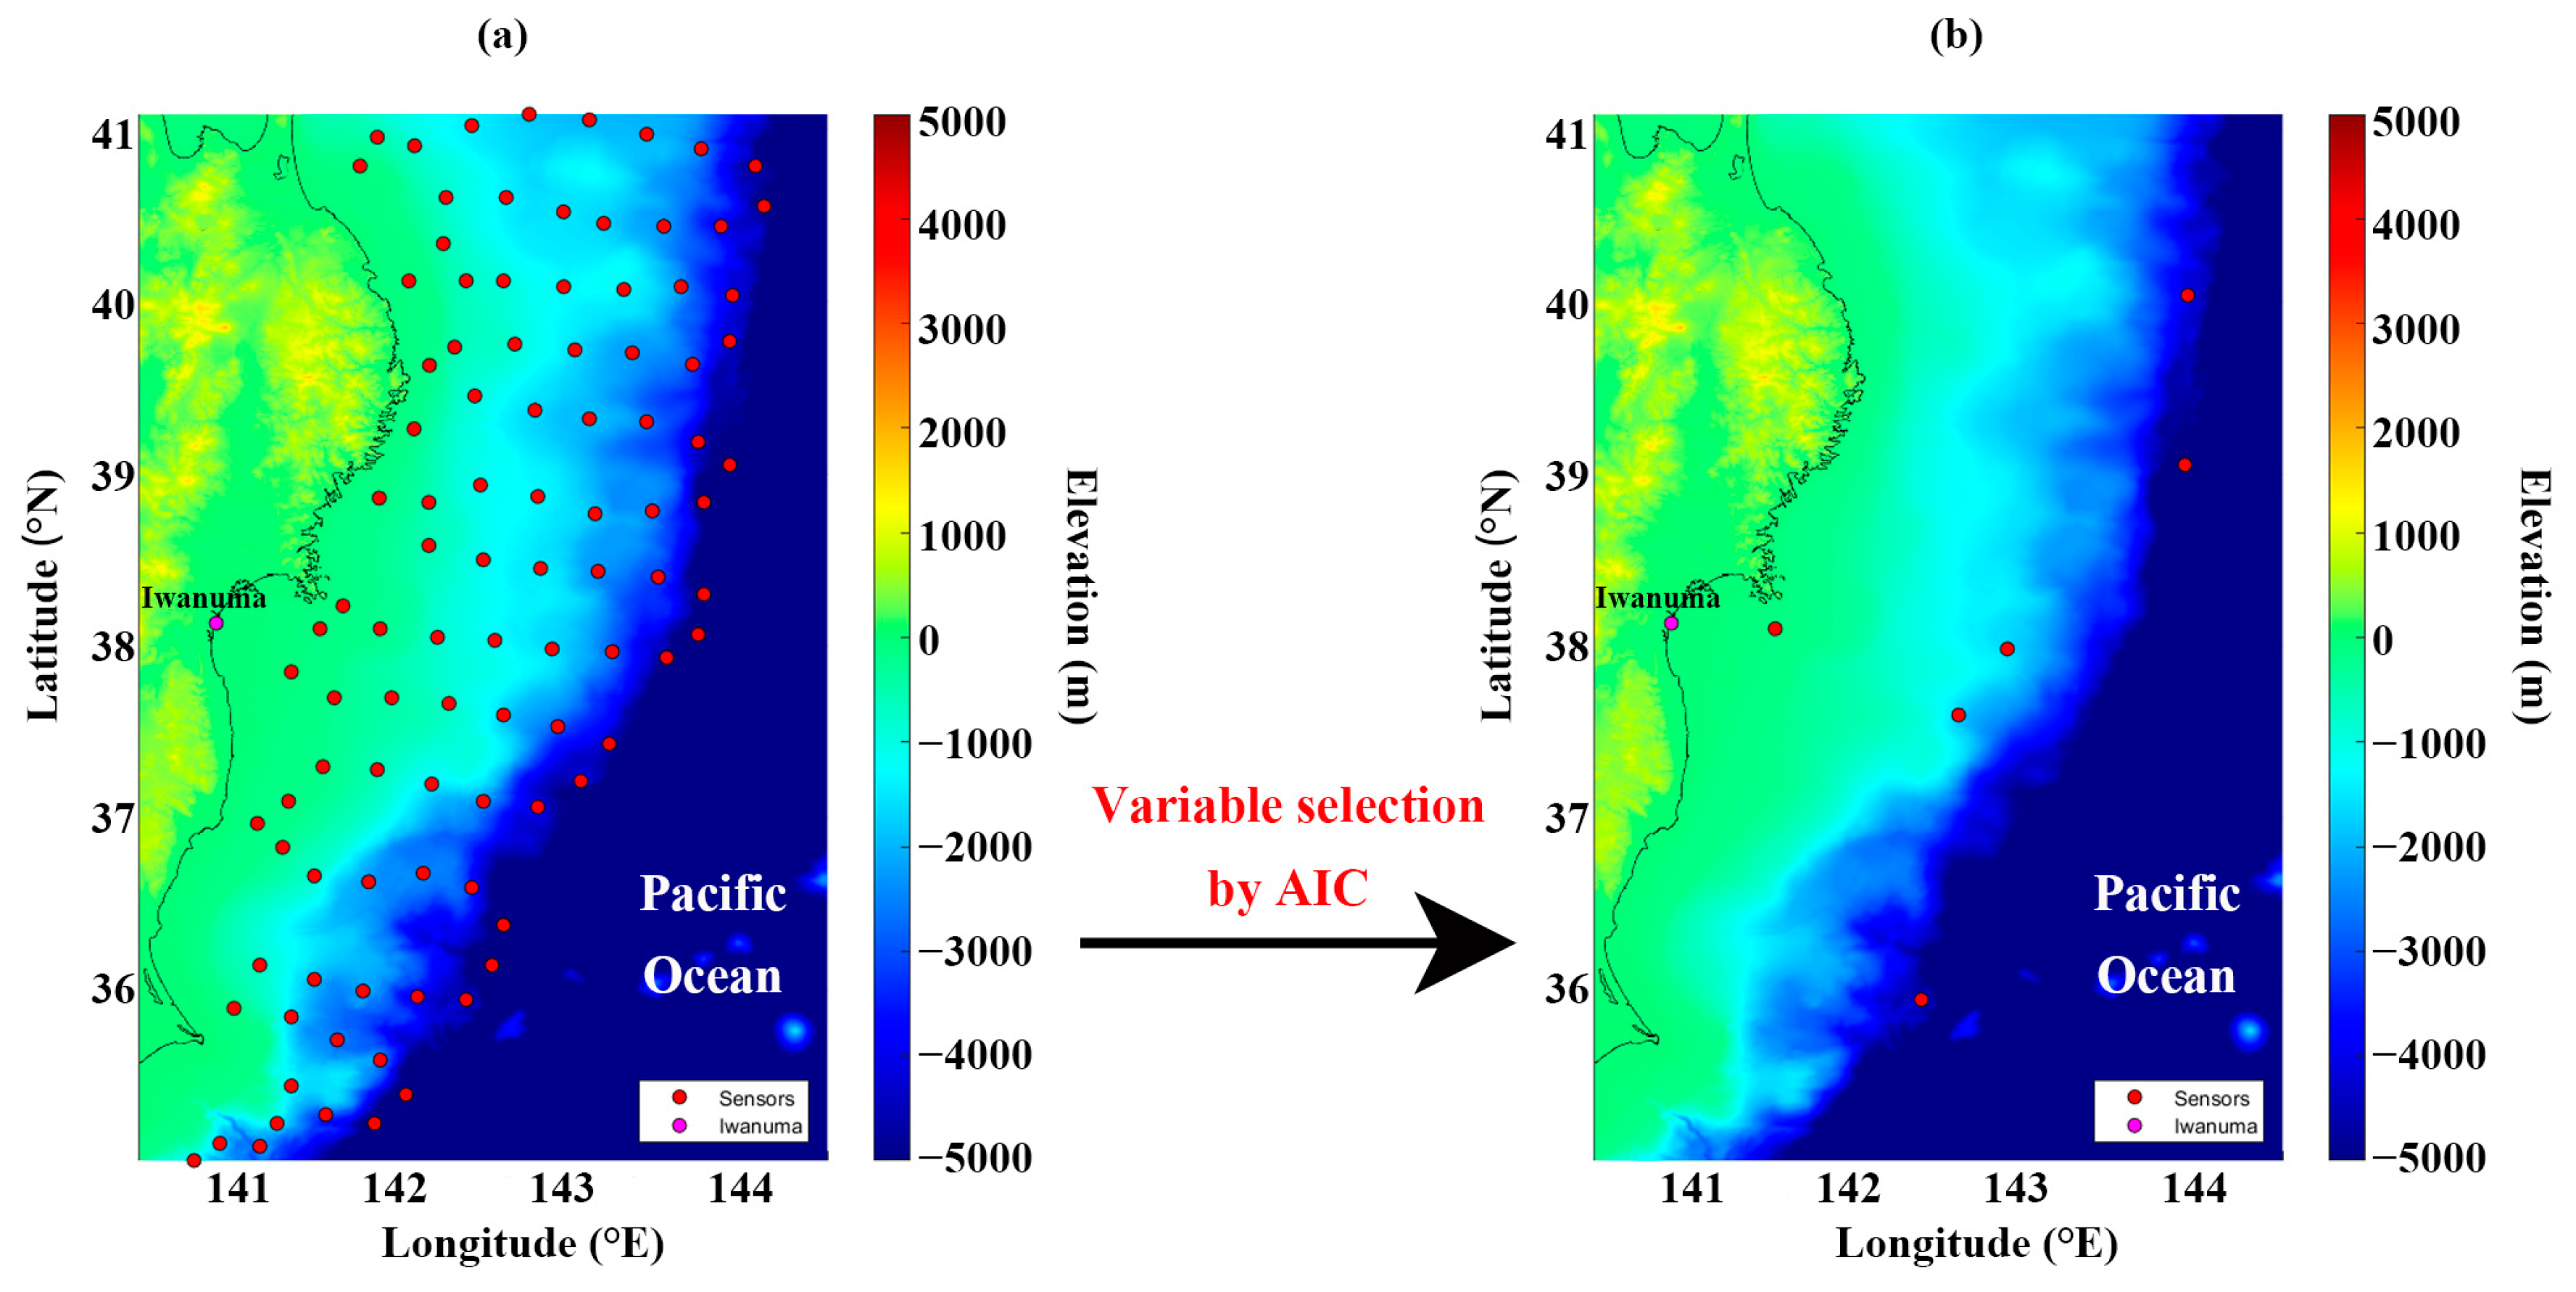
Iwanuma is in the Tohoku region of Japan, bordered by the Pacific Ocean to the east (Figure 1). The epicenter of the 2011 Tohoku earthquake was about 80 km east of Iwanuma, and Iwanuma faced the triggered tsunami directly. There are a total of 99 off-shore sensors that are employed in this study (Figure 1a), and all of them are used to fit the MLR model firstly. Then, a variable selection technique using AIC is applied to select the 6 most informative sensors (Figure 1b), and an efficient simpler model is built [6]. The base model uses earthquake magnitude (), earthquake epicenter latitude (), and longitude (), and the sensor model uses additional wave amplitudes from 6 sensors (). They can be presented as follows:
There are two sensor models that are fitted by the different data (i.e., uniform versus heterogeneous slip distributions). The number of explanatory variables (three parameters from the earthquake information plus six parameters from OBS) is the same for the two sensor models, but the coefficients of the parameters () are different, since one is fitted using heterogeneous slip data and the other is fitted using uniform slip data.
2.2. Data and Statistical Methods
This study generates 4000 stochastic earthquake and tsunami events for both uniform and heterogeneous distributions [7]. This study considers a range of earthquake magnitude of M7.5–9.1, with a magnitude interval of 0.2. The wave amplitude is calculated based on physical governing equations [8], and the wave amplitude simulation starts when an earthquake occurs, and ends after 120 min. The maximum wave amplitude during the first 3 min collected by the off-shore sensors is used as explanatory variable to fit the model, since enough information is contained in the first 3 min of data collected by the off-shore sensors after an earthquake [6].
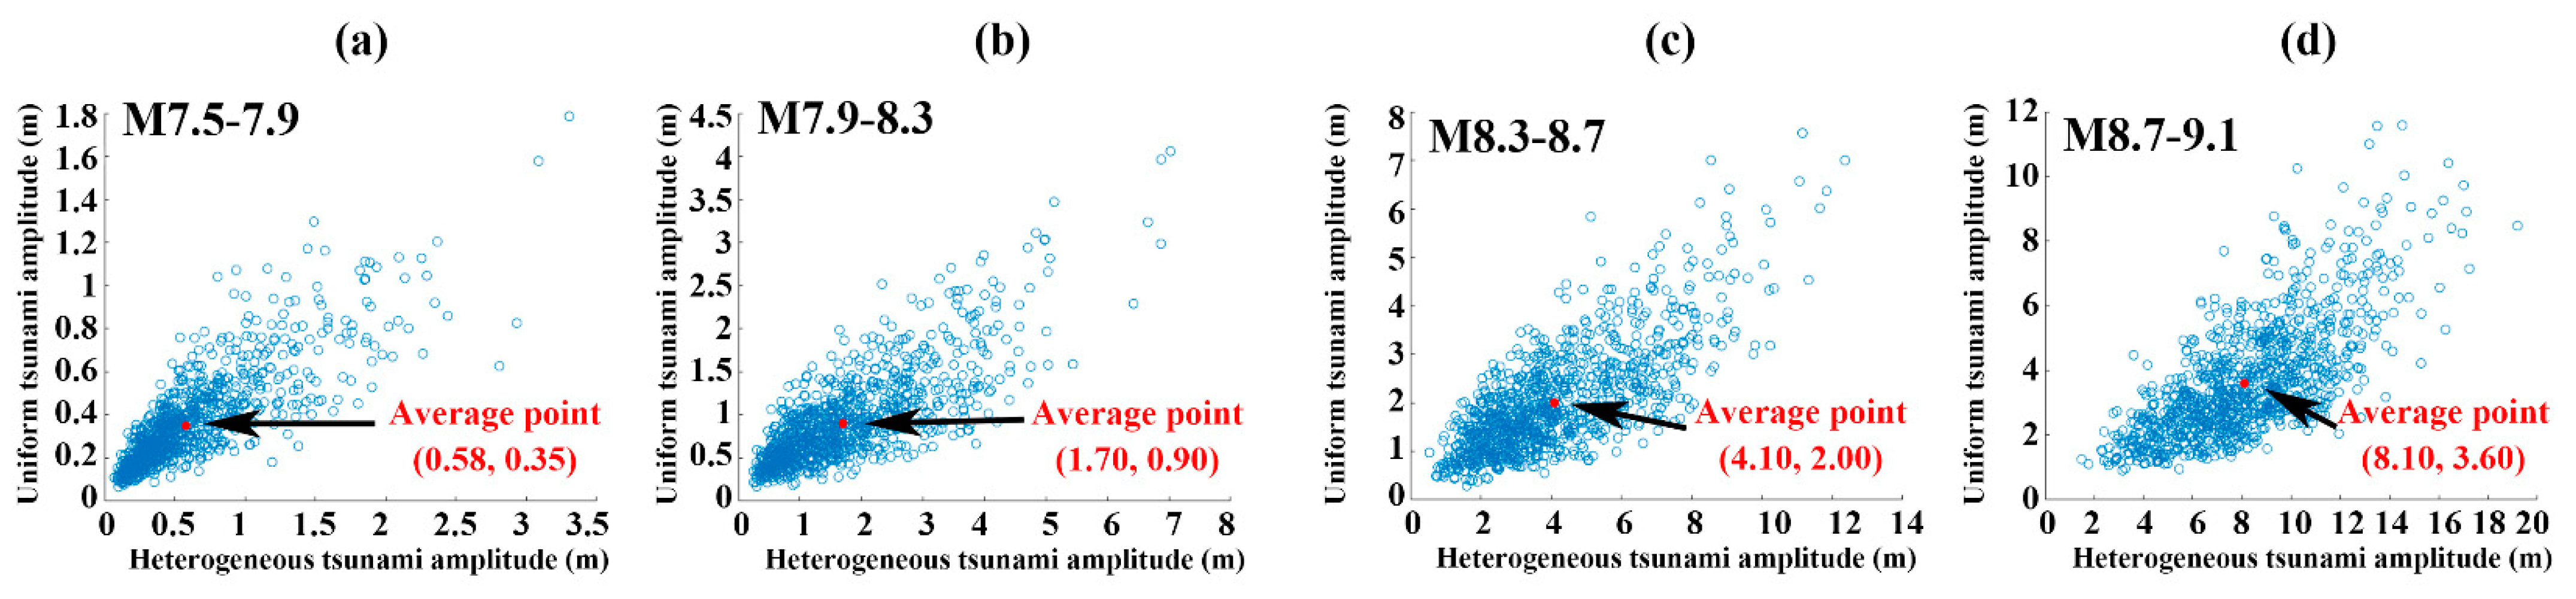
Figure 2 shows the plot of the maximum near-shore tsunami amplitude (response variable) of the heterogeneous slip distribution compared with the uniform slip distribution. Within the same earthquake event, the heterogeneous distributed maximum near-shore tsunami amplitude tends to be greater than the uniform one (see Figure 2). The maximum near-shore tsunami amplitude becomes greater as the earthquake magnitude increases, with the average amplitude for the heterogeneous slip distribution increasing from 0.58 m to 8.10 m, and the average amplitude for the uniform slip distribution increasing from 0.35 m to 3.6 m.
The response variable is the maximum near-shore tsunami amplitude, which is a continuous variable originally. Because the assumption of data distribution is normal in MLR, a logarithmic transformation (based on Box–Cox transformation) is applied to the response variable to hold the normality. After the model predicts the value, the value will transform back to original unit. Then, it is transformed to a category variable (these variables are of four classes. The first class is 0–2 m, denoting ‘low’; the second class is 2–5 m, denoting ‘moderate’; the third class is 5–10 m, denoting ‘high’; and fourth class is over 10 m, denoting ‘critical’) under a criterion for tsunami hazard assessment at the water-level height scale [9]. The classification and forecasting of tsunamis are more commonly for early warning announcement purposes, which makes them more easily accepted by the public. The accuracy of a confusion matrix (CM) is used to describe the model’s performance in classification problems.
3. Results
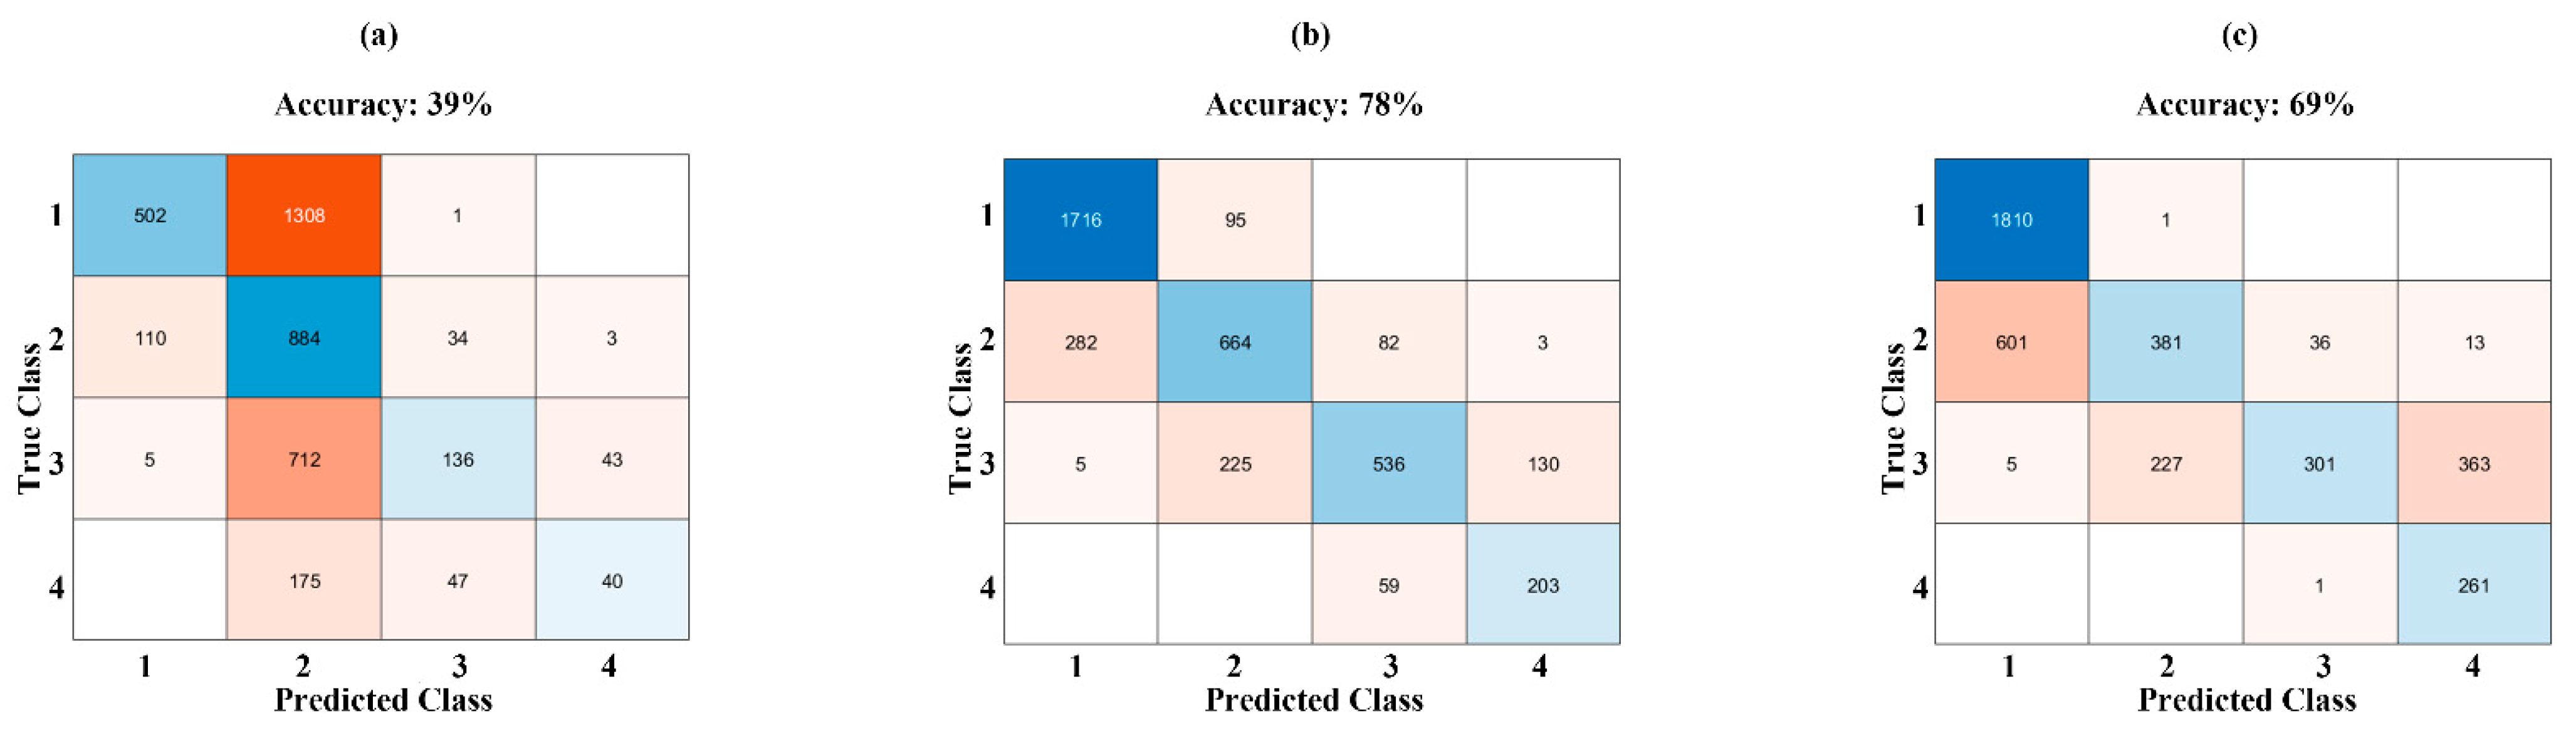
The tsunami classification model result is presented in Figure 3. Figure 3a shows the accuracy of the base model (39%) has a much lower accuracy than the sensor models. It is insufficient that only earthquake magnitude and location data are used for regression to forecast a tsunami’s amplitude. When the wave amplitude data collected by OBS are added, the accuracy of the heterogeneous slip-based model (78%) is doubled (Figure 3a,b), and the accuracy of the uniform slip-based model increases by 30% (Figure 3a,c). The heterogeneous slip-based model has approximately 10% higher accuracy than the uniform slip-based model (Figure 3b,c). The latter is because the coefficients of the uniform slip-based model are calibrated with simulated tsunami data with unrealistic earthquake slip distributions.
4. Discussion
This study investigated whether using wave amplitude data collected by OBS improves tsunami classification. It is difficult to classify a tsunami’s amplitude using a model that is only trained with earthquake information, as in this study. The heterogeneous slip-based model achieves a higher accuracy than the uniform slip-based model. For hypothetical tsunami simulations, a heterogeneous earthquake slip distribution is preferable, even though the process of generating heterogeneous distributed data is more complex than generating uniform distributed earthquake slip data.
For studies in the future, several fields can be improved. Firstly, this may be achieved by applying the tsunami early warning algorithm (model) to different regions with similar geophysical characteristics to Iwanuma. Besides, a different approach may be taken to reduce the number of explanatory variables, by applying Lasso and Ridge regression.
Funding
This work is funded by the Canada Research Chair program (950-232015) and the NSERC Discovery Grant (RGPIN-2019-05898).
Institutional Review Board Statement
Not applicable.
Informed Consent Statement
Not applicable.
Data Availability Statement
Not applicable.
Conflicts of Interest
The author declare no conflict of interest.
References
- Imamura, F.; Boret, S.P.; Suppasri, A.; Muhari, A. Recent Occurrences of Serious Tsunami Damage and the Future Challenges of Tsunami Disaster Risk Reduction. Prog. Disaster Sci. 2019, 1, 100009. [Google Scholar]
- An, C.; Liu, H.; Ren, Z.; Yuan, Y. Prediction of Tsunami Waves by Uniform Slip Models. J. Geophys. Res. Ocean. 2018, 123, 8366–8382. [Google Scholar] [CrossRef]
- Maeda, T.; Obara, K.; Shinohara, M.; Kanazawa, T.; Uehira, K. Successive Estimation of a Tsunami Wavefield without Earthquake Source Data: A Data Assimilation Approach toward Real-time Tsunami Forecasting. Geophys. Res. Lett. 2015, 42, 7923–7932. [Google Scholar] [CrossRef]
- Wang, Y.; Su, H.Y.; Ren, Z.; Ma, Y. Source Properties and Resonance Characteristics of the Tsunami Generated by the 2021 M8.2 Alaska Earthquake. J. Geophys. Res. Ocean. 2022, 123, e2021JC018308. [Google Scholar] [CrossRef]
- Geist, E.L. Complex Earthquake Rupture and Local Tsunami. J. Geophys. Res. Solid Earth 2002, 107, ESE-2. [Google Scholar] [CrossRef]
- Li, Y.; Goda, K. Hazard and Risk-Based Tsunami Early Warning Algorithms for Ocean Bottom Sensor S-Net System in Tohoku, Japan, Using Sequential Multiple Linear Regression. Geosciences 2022, 12, 350. [Google Scholar] [CrossRef]
- Goda, K. Multi-hazard Parametric Catastrophe Bond Trigger Design for Subdection Earthquakes and Tsunamis. Earthq. Spectra 2021, 37, 1827–1848. [Google Scholar] [CrossRef]
- Goto, C.; Ogawa, Y.; Shuto, N.; Imamura, F. Numerical Method of Tsunami Simulation with the Leap-frog Scheme. IOC Man. Guides 1997, 35, 130. [Google Scholar]
- Santos, A.; Fernandes, J.; Mileu, N. Tsunami Hazard Assessment at Oeiras Municipality, Portugal. J. Mar. Sci. Eng. 2022, 10, 1120. [Google Scholar] [CrossRef]
Figure 1.
Map of Iwanuma and off-shore sensors: (a) 99 sensors before the AIC variable selection, (b) 6 sensors after the AIC variable selection. The red dots represent the selected offshore sensors.
Figure 1.
Map of Iwanuma and off-shore sensors: (a) 99 sensors before the AIC variable selection, (b) 6 sensors after the AIC variable selection. The red dots represent the selected offshore sensors.

Figure 2.
Comparison plots of simulated maximum near-shore tsunami amplitude: (a) the amplitude plot under an earthquake of magnitude 7.5–7.9; (b) the amplitude plot under an earthquake of magnitude 7.9–8.3; (c) the amplitude plot under an earthquake of magnitude 8.3–8.7; (d) the amplitude plot under an earthquake of magnitude 8.7–9.1.

Figure 3.
Confusion matrixes with accuracy of three models: (a) CM of base model; (b) CM of heterogeneous slip-based sensor model; (c) CM of uniform slip-based sensor model. The number in each grid represent the number of events predicted in each class with their true class. The colder the color is (more blue), the more events predicted in the right class.

Disclaimer/Publisher’s Note: The statements, opinions and data contained in all publications are solely those of the individual author(s) and contributor(s) and not of MDPI and/or the editor(s). MDPI and/or the editor(s) disclaim responsibility for any injury to people or property resulting from any ideas, methods, instructions or products referred to in the content. |
© 2023 by the author. Licensee MDPI, Basel, Switzerland. This article is an open access article distributed under the terms and conditions of the Creative Commons Attribution (CC BY) license (https://creativecommons.org/licenses/by/4.0/).
Share and Cite
MDPI and ACS Style
Li, Y. Forecasting Tsunami Hazards Using Ocean Bottom Sensor Data and Classification Predictive Modeling. Proceedings 2023, 87, 7. https://doi.org/10.3390/IECG2022-14266
AMA Style
Li Y. Forecasting Tsunami Hazards Using Ocean Bottom Sensor Data and Classification Predictive Modeling. Proceedings. 2023; 87(1):7. https://doi.org/10.3390/IECG2022-14266
Chicago/Turabian StyleLi, Yao. 2023. "Forecasting Tsunami Hazards Using Ocean Bottom Sensor Data and Classification Predictive Modeling" Proceedings 87, no. 1: 7. https://doi.org/10.3390/IECG2022-14266