1. Introduction
Soil erosion is a process that occurs in different areas of the planet. Inadequate land use through non-conservation practices increases susceptibility to this process.
To identify and quantify the areas affected by this process, soil loss models such as Universal Soil Loss Equation (USLE) and Revised Universal Soil Loss Equation (RUSLE) can be used. To calculate these models, C-factor (Crop Management) is needed, used to determine the effectiveness of soil and crop management systems in preventing soil loss resulting from erosion by rain. This factor represents the soil loss ratio between an area with preserved vegetation cover and management and an area with plowed and bare soil during the cultivation period [
1].
Vegetation cover can be analyzed using spectral indices obtained by radiometric measurements from satellite images. The red and infrared bands are the most sensitive to the biophysical variations of vegetation over time and space. Among the most used spectral indices is the Normalized Difference Vegetation Index (NDVI). This index uses the red bands and varies from −1 to 1. The studies [
2,
3] used the NDVI to calculate the C-factor, while Durigon et al. [
1] used the NDVI to calculate the C-factor in the Atlantic Rainforest of Brazil.
There are few studies [
1] that have used spectral indices to calculate the C-factor in the Atlantic Rainforest area, where intense land use and climate favor erosion [
4,
5]. Due to the scarcity of methodologies that use spectral indices to calculate the C-factor, literature reviews and the use of analog cartographic bases of use and coverage are still very present in studies developed to calculate the C-factor in the Atlantic Rainforest area, such as Brazil. The use of spectral indices derived from satellite images, using remote sensing, is a possibility to reduce data collection costs, in addition to enabling faster and more accurate data analysis that supports assessments of changes in land use and land cover, degradation of soils, and erosion prevention [
3,
6,
7,
8].
Due to the scarce scientific production on the calculation of the C-factor in areas of the Atlantic Rainforest, a region intensely occupied throughout the 19th and 20th centuries, which potentiated erosion processes in this region [
9], we propose a methodology based on remote sensing and GIS to calculate the C-factor using the transformation functions (Near, Gaussian and Symmetric Linear), applied in the Atibaia watershed, São Paulo State, Brazil.
2. Materials and Methods
2.1. Study Area
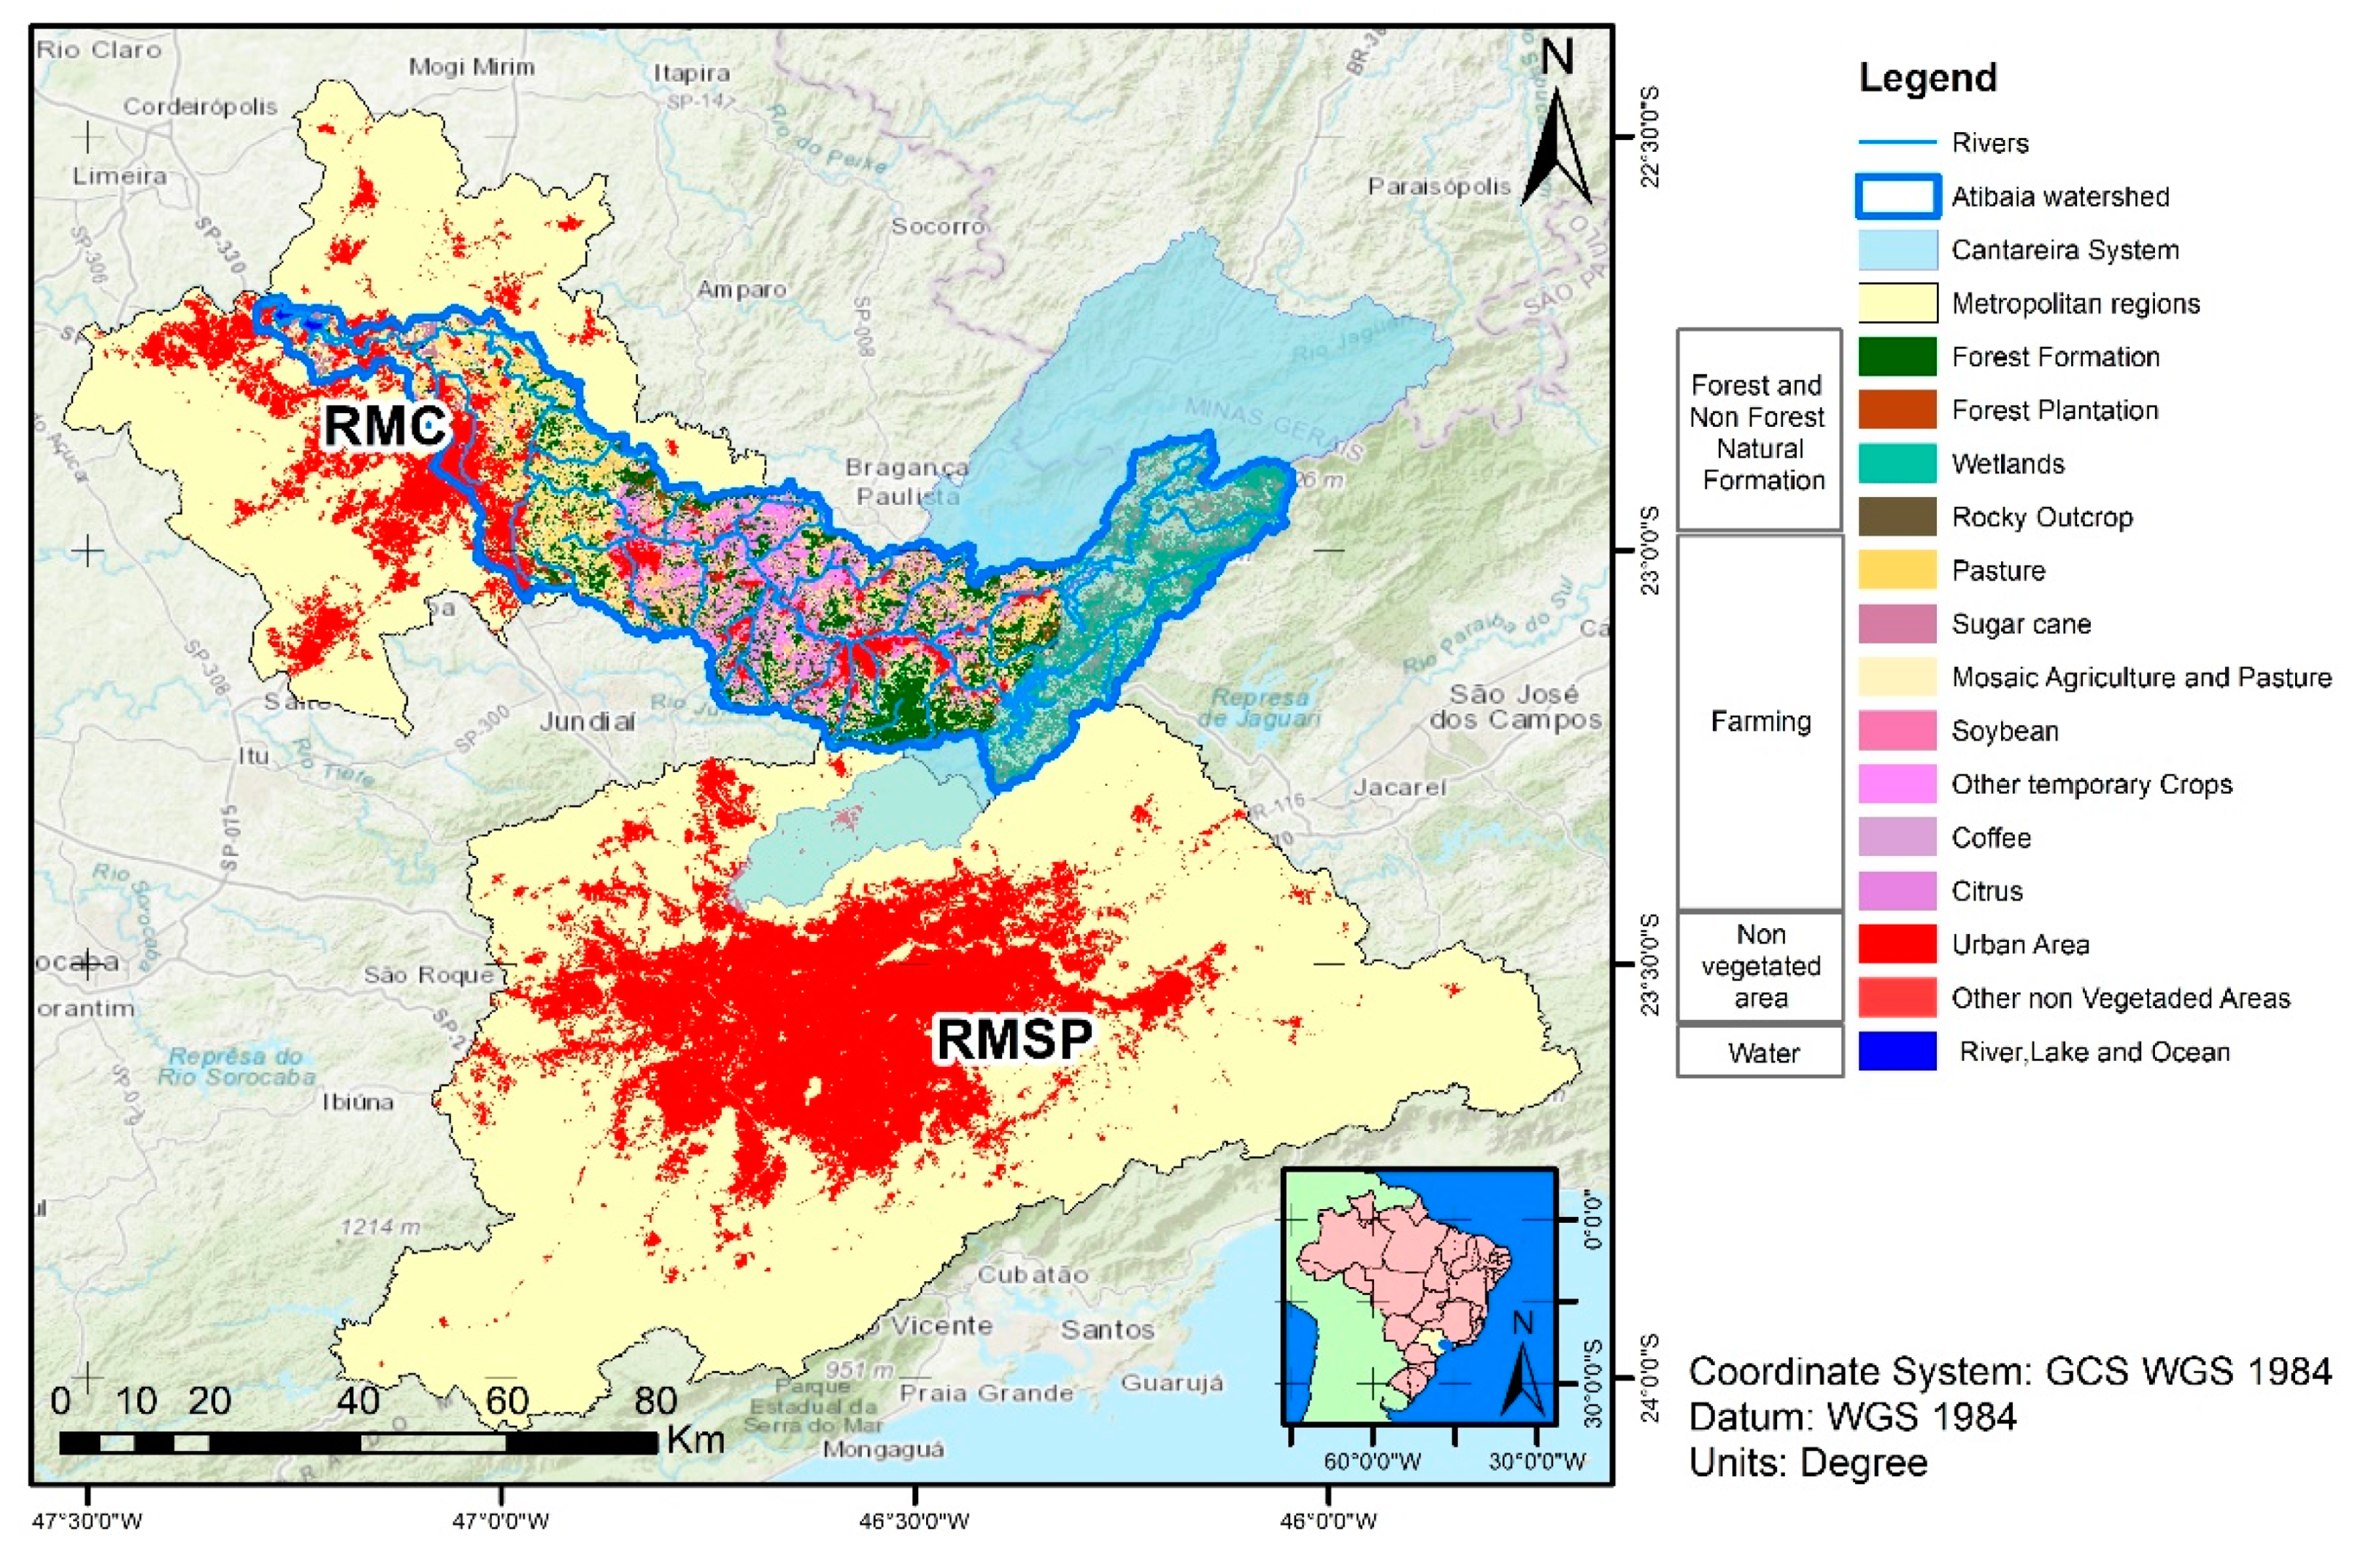
The Atibaia river basin is located between two metropolitan regions of the State of São Paulo, the Metropolitan Region of São Paulo (RMSP) and the Metropolitan Region of Campinas (RMC), in addition to the source of the important rivers that form it, located in the Atlantic Rainforest of Brazil. The Cantareira System is the region with reservoirs responsible for supplying water to the population of the RMSP (
Figure 1).
The area covers 276.849 ha, in a region with a high concentration of population, agricultural areas and a water system with important hydrographic basins that have been intensely modified over time due to alterations resulting from land use and cover.
2.2. Data Acquisition and Processing
The test with the transformation functions was applied to a LANDSAT-8 image from 2 July 2014, acquired at the EarthExplorer. In the years 2014–2015, the state of São Paulo experienced a prolonged drought. The periods of severe drought in recent years and dependence on the Cantareira System for supplying the two metropolitan areas resulted in a worrying long-term prognosis for water security and water governance [
10,
11].
The image underwent necessary radiometric corrections, and then the NDVI formula proposed by [
12] was applied:
The IV represents the infrared band and the V represents the red band. After calculating the NDVI, a mask was created to remove negative values.
In the next step, the C-factor was calculated using the Near, Gaussian, and SymLinear transformation functions. In this step, the NDVI values were rescaled using a mathematical function using the Rescale by function tool in ArcGIS. The parameters defined for calculating the Near, Gaussian, and SymLinear transformation functions were: value below threshold = 1, value above threshold = 0, from scale = 0, to scale = 1, and the transformation functions: Near is most useful if the highest preference is near a specific value, Gaussian transforms the input values using a normal distribution, and SymmetricLinear (SymLinear) applies a linear function between the specified minimum and maximum values, which is mirrored around the midpoint of the Minimum and Maximum. The Near and Gaussian transformation functions can be similar, depending on the specified parameters. The Near function generally decreases at a faster rate, with a narrower spread, than the Gaussian function.
With the three calculated functions, we extracted the C-factor values of the different models (Near, Gaussian, and SymLinear) by land use class using a sample of random points of 644 observations. In this sample, we applied the
tapply function in Rstudio, extracting the minimum, maximum, average, and median values by LU classes from the mapping developed by Mapbiomas platform (
https://mapbiomas.org/, accessed on 3 June 2022) (2014 image).
3. Results and Discussion
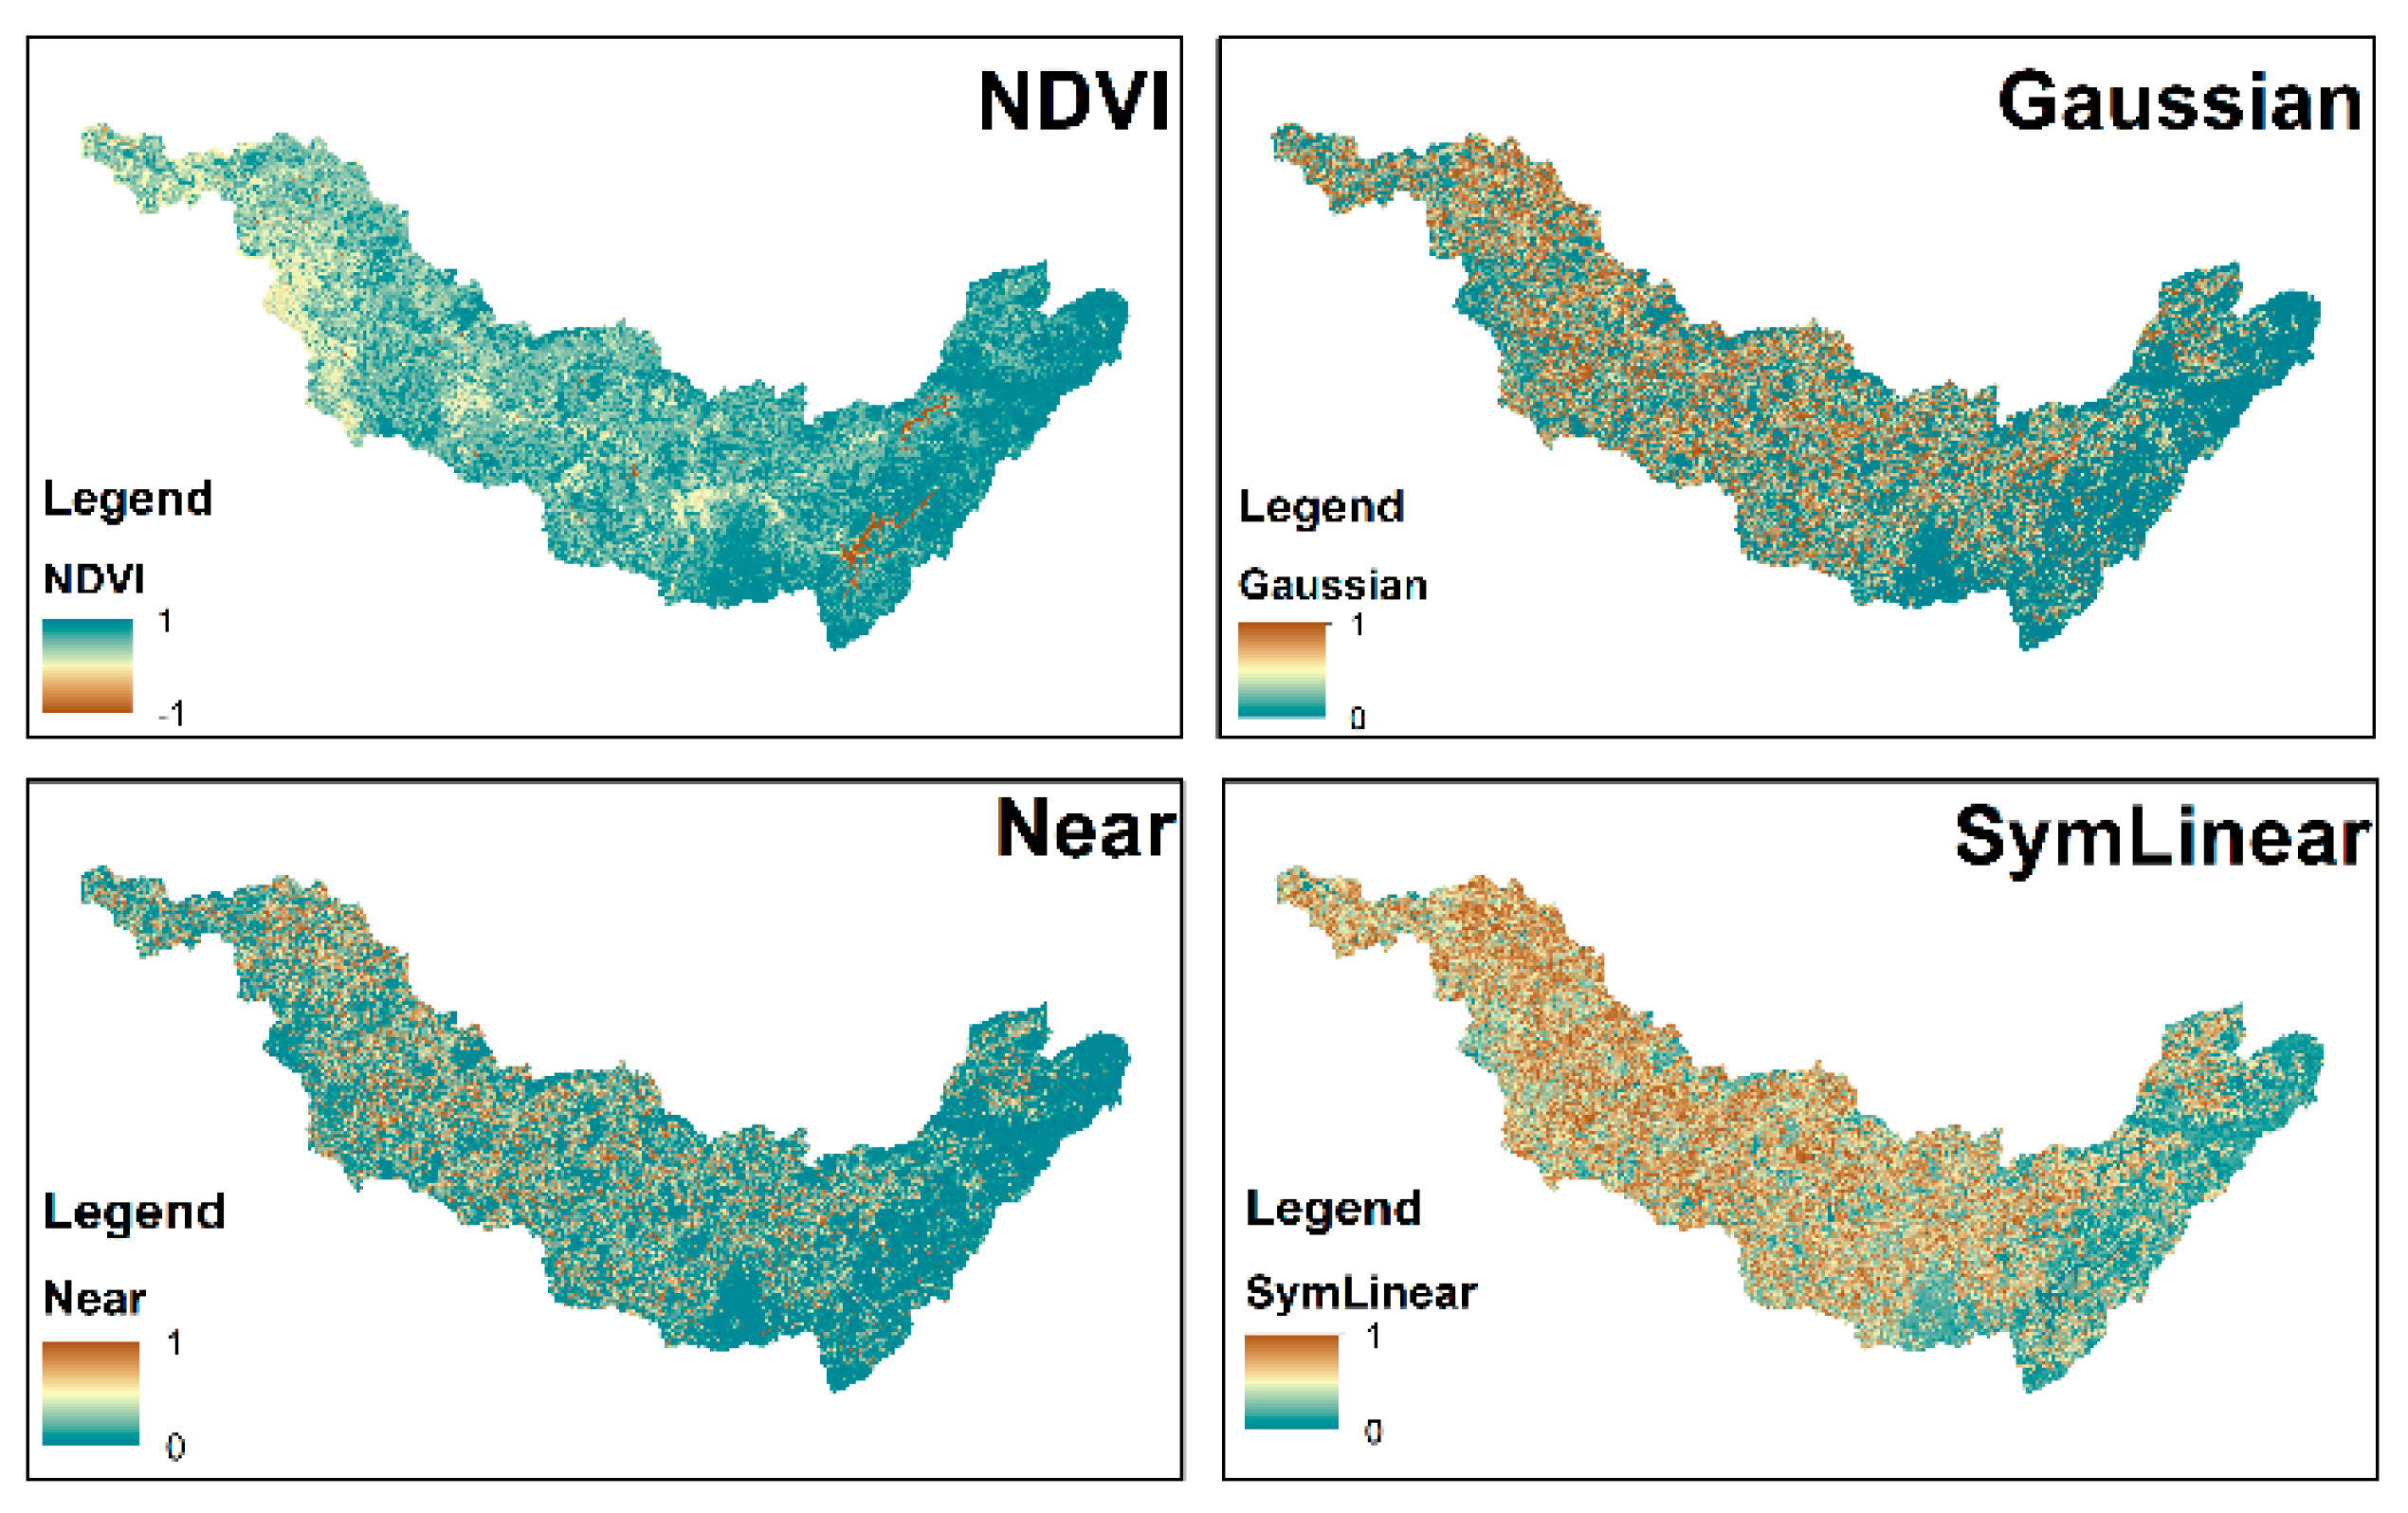
Figure 2 and
Figure 3 show the distribution histograms and NDVI images and the three proposed models:
In the Atibaia watershed, a large number of pixels with NDVI values above 0.5 were found, indicating that the vegetation cover was high. Among the three proposed models, it was identified that the classification of the Gaussian and Near models concentrated a large number of pixels with lower values, between 0 and 0.2, while the SymLinear model better distributed the values between the range 0 and 1.
The minimum, maximum, mean, and median values of three transformation functions by LU classes were (
Table 1):
In all LU classes, the SymLinear model obtained higher average values concerning the Gaussian and Near models. The three models maintained the same pattern of distribution of mean values in the LULC classes.
In two LU classes, the values of Gaussian and Near models mean were very similar. In the Forest Formation class, the mean values were 0.054 (Gaussian) and 0.055 (Near). In the Forest Plantation class, the mean values were 0.039 (Gaussian) and 0.048 (Near).
The same pattern was observed between the Citrus and Coffee classes; Pasture and Rocky Outcrop; and Wetlands and Other Non-Vegetated Area, while the other classes recorded values with good separability between them.
The dense vegetation classes were the ones that registered the lowest values in all models, while the classes related to agricultural plantations registered intermediate values, which are related to the type of culture and its stages of development [
13,
14]. The classes related to pastures and Rocky Outcrops registered the highest values. This is due to the exposure of these classes to the weather that results in erosive processes and consequent loss of soil [
15].
4. Conclusions
The use of NDVI to calculate the C-factor in soil loss equations is a widely used method, as addressed by the studies of [
1,
2,
3]. In the present study, we seek to present three other models based on transformation functions and classifying of NDVI images, according to the Gaussian, Near, and SymLinear functions.
The study also proposes the calculation of the C-factor using only a selected satellite image for the 2014 dry period and not the average calculation of the C-factor as proposed by Durigon [
1]. This date was selected due to the occurrence of an extreme drought event recorded in the Atibaia watershed. In this way, it was possible to identify the real photosynthetic activity of the vegetation, which is not possible when calculating an average NDVI image of a period.
Knijff [
2] pioneered study the estimation of the C-factor using the NDVI for European conditions. New studies proposing methodologies for other regions of the planet are needed. The study area of this article is located in the Atlantic Rainforest, with scarce publications on the subject and intense modification of use and coverage, due to economic growth, importance of agricultural activity and the Atibaia watershed being used for public supply of a region with high population density, formed by the RMC and RMSP in the State of São Paulo, Brazil [
16,
17,
18,
19]. These characteristics, in a scenario of climate change, with extreme drought events such as those registered in 2014 [
11,
16], increase the vulnerability of the Atibaia watershed. Studies such as this one, developing methods to estimate the C-factor, help in the development of studies to estimate soil loss in the Atlantic Rainforest.
We applied transformation functions and correlated them with land use and land cover classes. We observed that the Near and Gaussian functions recorded similar values. This is because the two functions register the same pattern of distribution of values, depending on the parameters. Neighboring pixels had a greater influence on the distribution of values in these two functions, while, with SymLinear, applying a linear function that considers the minimum and maximum values resulted in a more balanced distribution in the adopted scale. Thus, the separability of the C-factor values by land use class was better used.
Author Contributions
Conceptualization, S.F., and A.M.H.d.A.; methodology, software, validation, and formal analysis, S.F.; investigation; resources, S.F. and A.M.H.d.A.; data curation and writing—original draft preparation, S.F.; writing—review and editing, A.M.H.d.A.; visualization and supervision, A.M.H.d.A. All authors have read and agreed to the published version of the manuscript.
Funding
This research received no external funding.
Institutional Review Board Statement
Not applicable.
Informed Consent Statement
Not applicable.
Data Availability Statement
Acknowledgments
Center for Meteorological and Climatic Research Applied to Agriculture (CEPAGRI) in the University of Campinas (UNICAMP).
Conflicts of Interest
The authors declare no conflict of interest.
References
- Durigon, V.L.; Carvalho, D.F.; Antunes, M.A.H.; Oliveira, P.T.S.; Fernandes, M.M. NDVI Time Series for Monitoring RUSLE Cover Management Factor in a Tropical Watershed. Int. J. Remote Sens. 2014, 35, 441–453. [Google Scholar] [CrossRef]
- Van der Knijff, J.M.; Jones, R.J.A.; Montanarella, L. Soil Erosion Risk Assessment in Europe; European Soil Bureau: Brussels, Belgium, 2000. [Google Scholar]
- Karaburun, A. Estimation of C Factor for Soil Erosion Modeling Using NDVI In Buyukcekmece Watershed. Ozeanistik J. Apply Sci. 2010, 3, 77–85. [Google Scholar]
- Morgan, R.P.C.; Morgan, D.D.V.; Finney, H.J. A Predictive Model for the Assessment of Soil Erosion Risk. J. Agric. Eng. Res. 1984, 30, 245–253. [Google Scholar] [CrossRef]
- Flores, B.M.; Staal, A.; Jakovac, C.C.; Hirota, M.; Holmgren, M.; Oliveira, R.S. Soil Erosion as a Resilience Drain in Disturbed Tropical Forests. Plant Soil 2020, 450, 11–25. [Google Scholar] [CrossRef]
- Wu, Q.; Li, H.; Wang, R.; Paulussen, J.; He, Y.; Wang, M.; Wang, B.; Wang, Z. Monitoring and Predicting Land Use Change in Beijing Using Remote Sensing and GIS. Landsc. Urban Plan. 2006, 78, 322–333. [Google Scholar] [CrossRef]
- Oñate-Valdivieso, F.; Bosque Sendra, J. Application of GIS and Remote Sensing Techniques in Generation of Land Use Scenarios for Hydrological Modeling. J. Hydrol. 2010, 395, 256–263. [Google Scholar] [CrossRef]
- El Baroudy, A.A. Monitoring Land Degradation Using Remote Sensing and GIS Techniques in an Area of the Middle Nile Delta, Egypt. CATENA 2011, 87, 201–208. [Google Scholar] [CrossRef]
- Rocha Junior, P.R.; Andrade, F.V.; Mendonça, E.S.; Donagemma, G.K.; Fernandes, R.B.A.; Bhattharai, R.; Kalita, P.K. Soil, Water, and Nutrient Losses from Management Alternatives for Degraded Pasture in Brazilian Atlantic Rainforest Biome. Sci. Total Environ. 2017, 583, 53–63. [Google Scholar] [CrossRef]
- Leão, R.S.; De Stefano, L. Making Concrete Flexible: Adapting the Operating Rules of the Cantareira Water System (São Paulo, Brazil). Water Secur. 2019, 7, 100032. [Google Scholar] [CrossRef]
- Nobre, C.A.; Marengo, J.A.; Seluchi, M.E.; Cuartas, L.A.; Alves, L.M. Some Characteristics and Impacts of the Drought and Water Crisis in Southeastern Brazil during 2014 and 2015. J. Water Resour. Prot. 2016, 8, 252–262. [Google Scholar] [CrossRef]
- Huete, A. A Comparison of Vegetation Indices over a Global Set of TM Images for EOS-MODIS. Remote Sens. Environ. 1997, 59, 440–451. [Google Scholar] [CrossRef]
- Araújo, G.K.D.; Rocha, J.V.; Lamparelli, R.A.C.; Rocha, A.M. Mapping of Summer Crops in the State of Paraná, Brazil, through the 10-Day Spot Vegetation NDVI Composites. Eng. Agríc. 2011, 31, 760–770. [Google Scholar] [CrossRef]
- Benedetti, R.; Rossini, P. On the Use of NDVI Profiles as a Tool for Agricultural Statistics: The Case Study of Wheat Yield Estimate and Forecast in Emilia Romagna. Remote Sens. Environ. 1993, 45, 311–326. [Google Scholar] [CrossRef]
- Jiao, J.; Zou, H.; Jia, Y.; Wang, N. Research Progress on the Effects of Soil Erosion on Vegetation. Acta Ecol. Sin. 2009, 29, 85–91. [Google Scholar] [CrossRef]
- Cavalcanti, I.F.A.; Nunes, L.H.; Marengo, J.A.; Gomes, J.L.; Silveira, V.P.; Castellano, M.S. Projections of Precipitation Changes in Two Vulnerable Regions of São Paulo State, Brazil. Am. J. Clim. Chang. 2017, 6, 268–293. [Google Scholar] [CrossRef]
- De Assis Souza Filho, F.; Formiga-Johnsson, R.M.; de Carvalho Studart, T.M.; Abicalil, M.T. From Drought to Water Security: Brazilian Experiences and Challenges. In Global Water Security. Water Resources Development and Management; Springer: Singapore, 2018; pp. 233–265. [Google Scholar]
- Emplasa Dados Sobre as Regiões Metropolitanas Do Estado de São Paulo. Available online: https://emplasa.sp.gov.br/ (accessed on 30 May 2022).
- Renard, K.G.; Foster, G.R.; Weesies, G.A.; McCool, D.K.; Yoder, D.C. Predicting Soil Erosion by Water: A Guide to Conservation Planning with the Revised Universal Soil Loss Equation (RUSLE); U.S. Department of Agriculture: Washington, DC, USA, 1997.
| Disclaimer/Publisher’s Note: The statements, opinions and data contained in all publications are solely those of the individual author(s) and contributor(s) and not of MDPI and/or the editor(s). MDPI and/or the editor(s) disclaim responsibility for any injury to people or property resulting from any ideas, methods, instructions or products referred to in the content. |
© 2022 by the authors. Licensee MDPI, Basel, Switzerland. This article is an open access article distributed under the terms and conditions of the Creative Commons Attribution (CC BY) license (https://creativecommons.org/licenses/by/4.0/).


