Proceeding Paper

The Influence of Financial Ratio and Company Reputation on Company Stock Prices Financial Sector †

Vocational Education Program, Finance and Banking Study Program, Jakarta 16424, Indonesia
Presented at the 5th International Conference on Vocational Education Applied Science and Technology 2022, Teluk Betung, Indonesia, 26–28 October 2022.
Proceedings 2022, 83(1), 47; https://doi.org/10.3390/proceedings2022083047
Published: 5 January 2023

Abstract

:
Profitability is one indicator appropriate for measuring performance within a company. This study aims to determine the effect of financial ratios, namely, the influence of Current Ratio, Debt to Equity Ratio, Total Assets Turnover, Net Profit Margin, Return on Equity, Price to Earnings Ratio, and Company Reputation. Specifically, the study seeks to find out which ratio has the effect on the stock price of financial sector companies listed on the Indonesia Stock Exchange from 2016 to 2020. This study uses secondary data, where the data obtained from existing sources. The results show that there are only two variables, namely Current Ratio (CR) and Return on Equity (ROE) that affect stock prices in financial sector companies which were listed on the Indonesia Stock Exchange from 2016 to 2020.

1. Introduction

The capital market is one of the facilities available to channel funds from parties who have excess funds who need funds. Shares are one of the assets traded by companies in the capital market. The share price is the value of a share that reflects the wealth of the company that issued the shares, but changes and fluctuations in price are largely determined by the supply and demand forces for the shares themselves that appear on the stock exchange (secondary market) [1]. The more the demand, the more the stock price will increase.
Stock prices in the capital market are influenced by several factors, including a company’s performance. Financial statements are the final result of the accounting process carried out to provide information about the financial condition of a company. Investors or managers use reports to make investment decisions [2].
To measure the performance of a company, investors usually look at the financial performance as reflected in various ratios. One indicator of financial performance measurement that is often used is a company’s profitability. The company profitability measurement tools that are most often used are Return on Assets (ROA) and Return on Equity (ROE) [3].
The amount of negative sentiment that emerged from the spread of the COVID-19 outbreak both in the world and in Indonesia affected capital market conditions in both stock markets and in bond markets. The uncertainty over the end of the COVID-19 pandemic has prompted investors to make adjustments to their financial portfolios by shifting liquidity to safe haven assets, including developing countries such as Indonesia. These conditions put pressure on the domestic capital market, although in general capital market stability can still be maintained. Stock market conditions experienced a significant weakening, as reflected in the Composite Stock Price Index (JCI), which experienced a contraction. The JCI closed at 4538 in the first quarter of 2020, weakened by 29.8 percent (YoY). This condition is considered the lowest position of the JCI since December 2016.
The financial sector (finance) has the largest weight on the JCI, so the movement of this index also influences the direction of the JCI. Within these conditions, the financial sector also shows a fair amount of sensitivity to market conditions. Referring to the daily report of the Indonesia Stock Exchange (IDX), the financial sector experienced a decline of 6.69 percent. As to conditions for short-term investors, current conditions can be a yellow light for the regulation of their risk management. However, on the other hand, for long-term investors, depressed index conditions are the best momentum to get stocks at low prices. However, in a panicked market, shares of issuers with good fundamentals will also be depressed.
As for discussion about the company’s reputation, this is very important because it can affect the company’s stock price. For example, the share price of PT Garuda Indonesia experienced a decline in 2019. Pressure on Garuda’s share price came from local investors who began to sell their shares of this stock. Then in May 2021 the share price of PT Garuda Indonesia also experienced a decline. The stock plunged 6.7 percent and then fell 6.8 percent again. This is allegedly because PT Garuda Indonesia has faced problems in paying the company’s debts.
One of the investments made in the capital market today is investment in stocks. The motive of investors in investing in the stock market is to obtain returns in the form of dividends or capital gains as well as company ownership. Before investing, investors will consider the return on shares they will receive and the value of the company. The share price represents the value of a publicly traded company [4].
Return on Assets (ROA) has a positive and significant effect on a firm’s value. The results of this study confirm the conclusion that ROA has a significant effect on a firm’s value. Subsequent research [5] states that the Debt to Equity Ratio has a negative and insignificant effect on a firm’s value. The existence of a negative relationship from the leverage variable (DER) to the firm’s value shows that the higher the leverage (DER), the lower the firm’s value and that it does not have a significant effect. This is because no matter how much debt is used, it will not affect the stock price and the firm’s value because the use of debt will cause the cost of ordinary equity to rise by the same level [6].
A company’s reputation has a positive influence on its market value. The reputation of the company, a metric that is driven by the perception of the effectiveness of the company, is believed to increase investor reactions that the risk of investing in company shares is low. Favorable investor reactions will result in rising stock prices and company stock returns [5].
Corporate reputation can be defined as a general attribute of an organization that reflects the extent to which internal and external stakeholders see the company as a good company rather than a bad company. A good corporate reputation has a beneficial impact on various stakeholder groups. The formation of a good and positive corporate reputation can benefit the company in many ways, such as by influencing customers in choosing products, limiting the potential for competition by competitors, and securing social status in an industry [7].
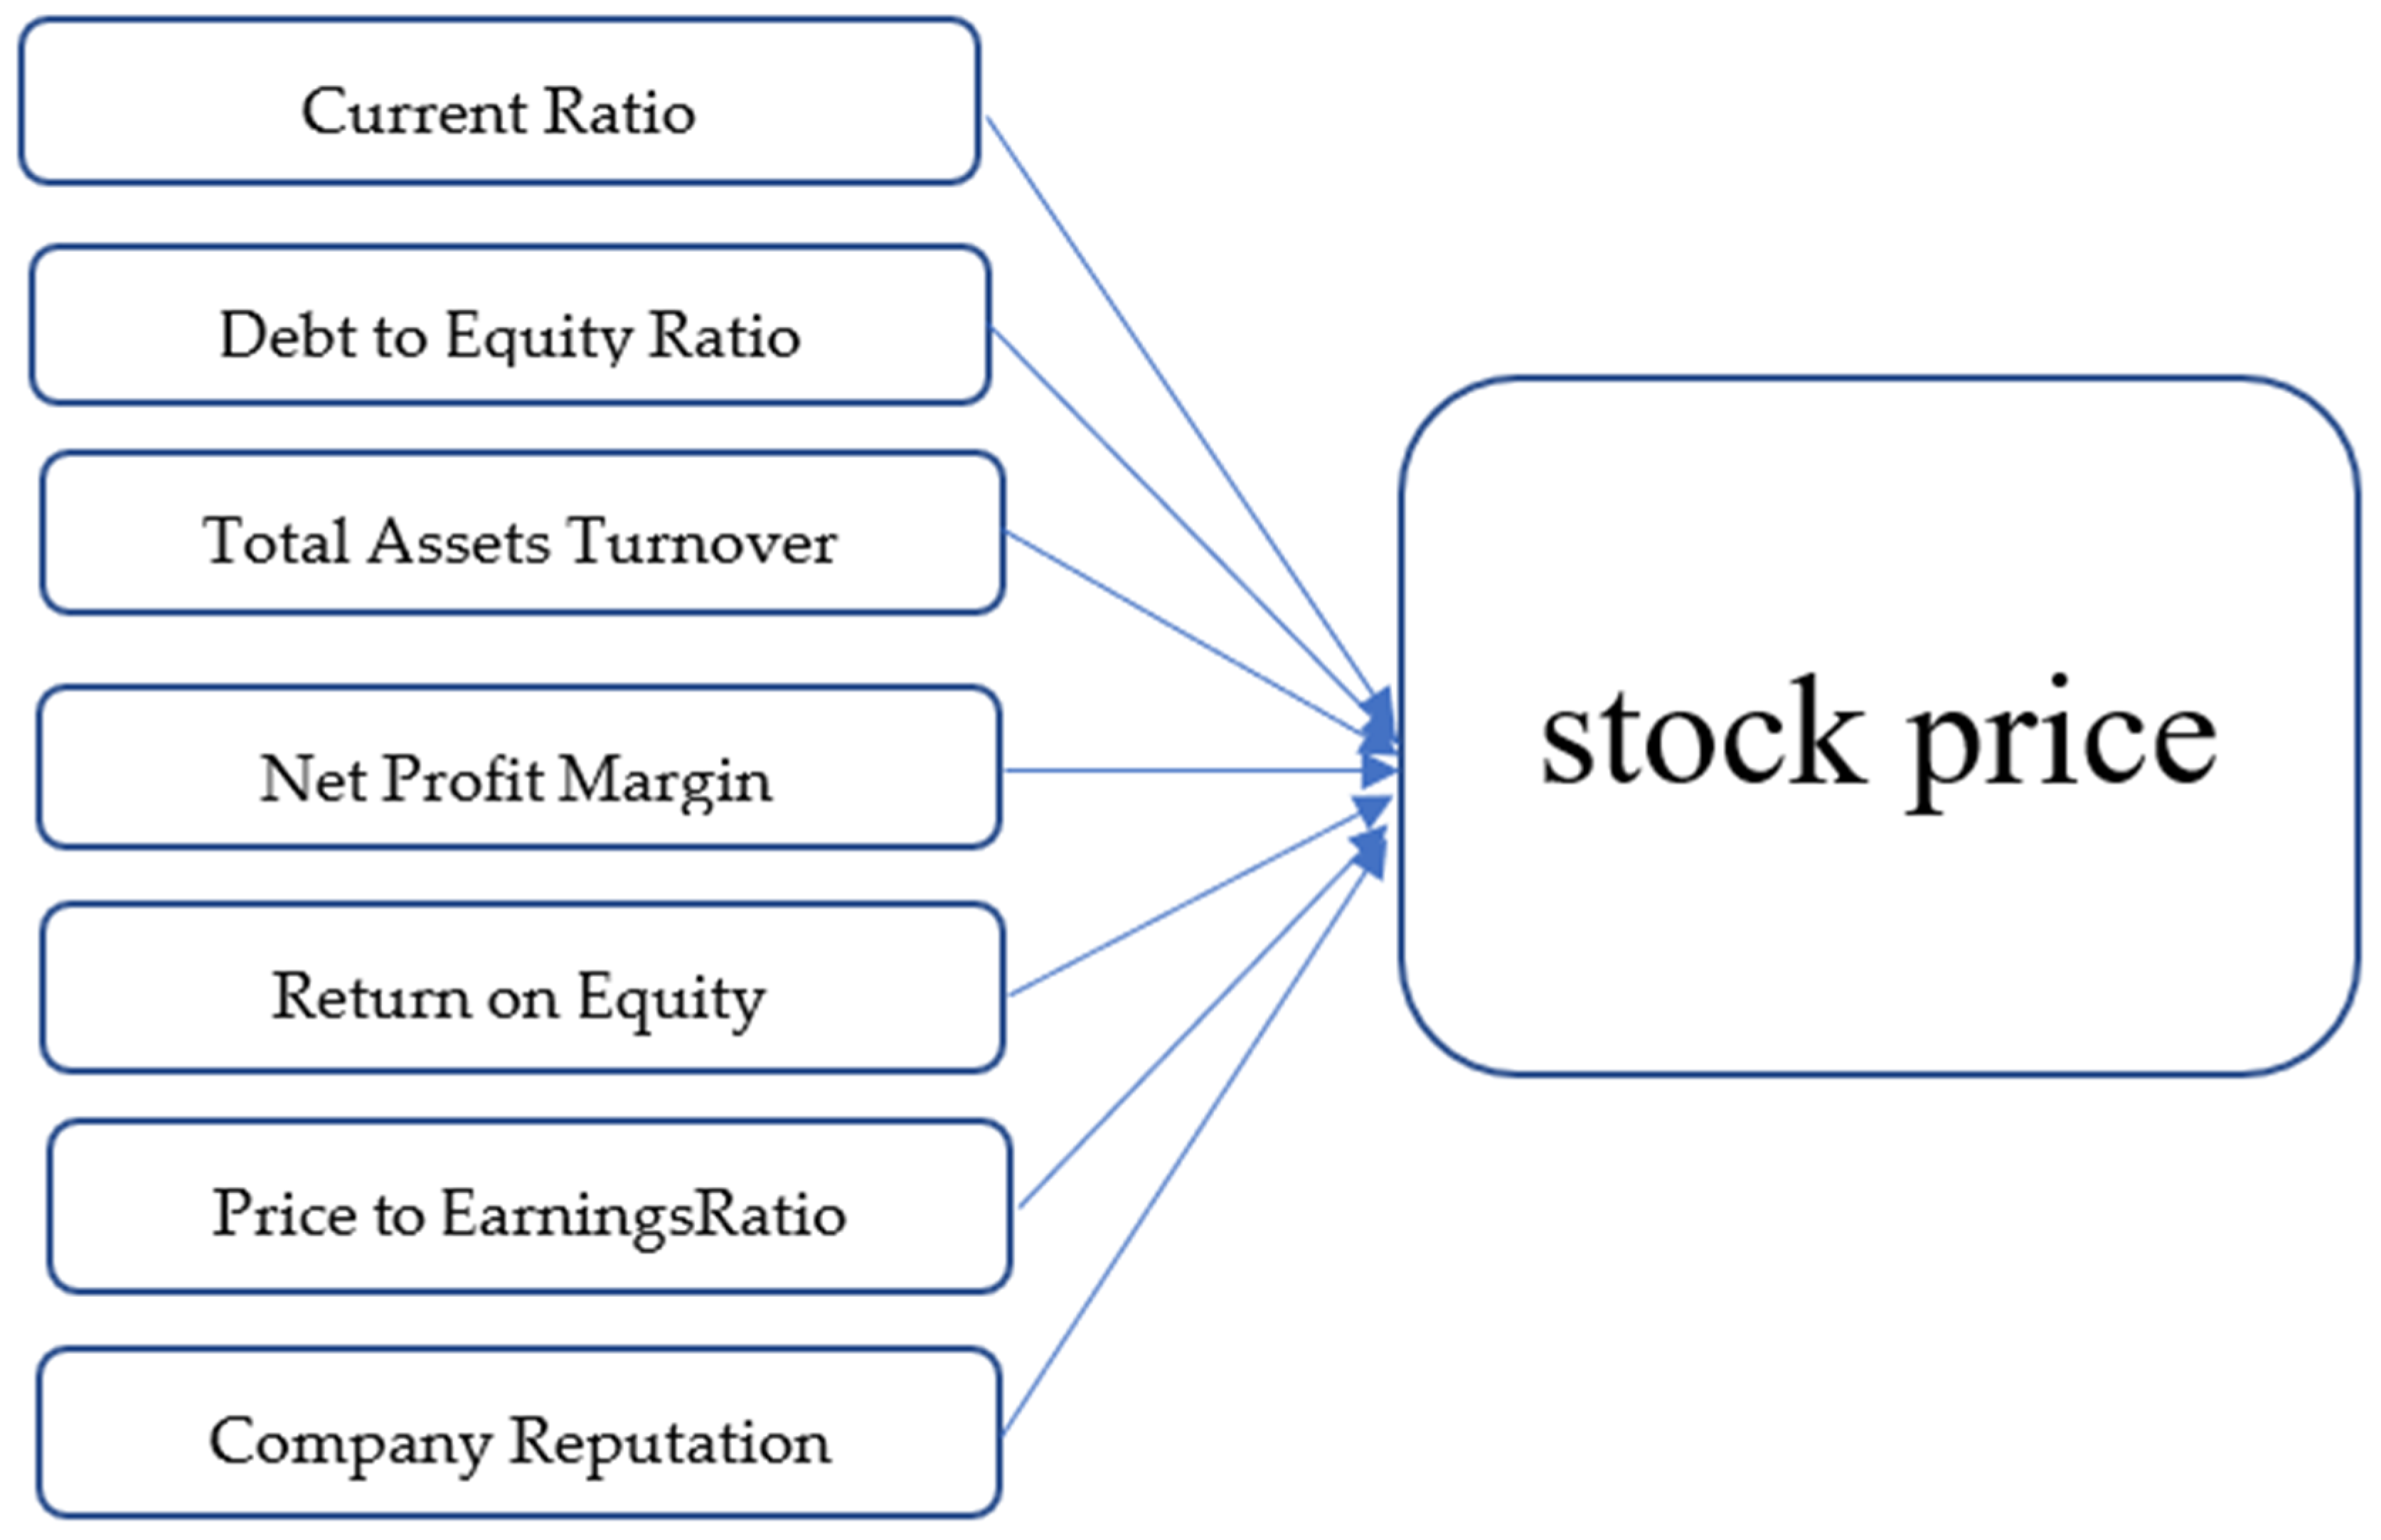
Based on this explanation, the researcher endeavors to see the influence of financial ratios and non-ratio variables on stock prices in financial sector companies in companies listed on the Indonesia Stock Exchange from 2016 to 2020. Researchers want to know more deeply how these ratios affect stock prices so that they can influence investors’ decisions. Therefore, the researcher took the title “The Influence of Current Ratio, Debt to Equity Ratio, Total Assets Turnover, Net Profit Margin, Return on Equity, Price to Earnings Ratio, and Company Reputation on Stock Prices of Financial Sector Companies”.

1.1. Research Questions

  • Does the Current Ratio (CR), Debt to Equity Ratio (DER), Total Assets Turnover (TATO), Net Profit Margin (NPM), Return on Equity (ROE), Price to Earnings Ratio (PER), and company reputation affect the share prices of Financial Sector companies listed on the Indonesia Stock Exchange from 2016 to 2020?
  • What is the ratio that has the most influence on stock prices in Financial Sector companies listed on the Indonesia Stock Exchange from 2016 to 2020?

1.2. Research Purposes

(1)
This study aims to see the effect of several financial ratios such as Current Ratio (CR), Debt to Equity Ratio (DER), Total Assets Turnover (TATO), Net Profit Margin (NPM), Return on Equity (ROE), Price to Earnings Ratio (PER), and also the influence of the company’s reputation on the share price of financial sector companies listed on the Indonesia Stock Exchange from 2016 to 2020.
(2)
This study aims to determine which ratio has the most influence on the share price of financial sector companies listed on the Indonesia Stock Exchange and the reasons why.

2. Theory Review and Hypotheses Development

2.1. Financial Ratio

Financial ratio analysis is a financial ratio analysis that provides a framework for the relationship between balance sheet items and profit and loss calculations, allows one to trace the history of a company and assess its current financial position, and allows financial managers to predict the reaction of creditors or investors to the company's financial condition thus can find appropriate ways to raise funds [3]. Based on this statement, the researcher concludes that financial ratios are a tool used to see how the condition of a company will be in the future, so that later it will affect decision making in thepresent.

2.2. Non Financial Ratio

A good-quality company will motivate investors’ reactions to invest in shares and the share price will increase. An increase in stock prices will be followed by an increase in stock returns. The reputation of the company that is formed from the perception of the effectiveness of the company then becomes a good signal for investors. This good signal is due to the fact that the company’s reputation is the main driver of the company’s sustainable performance [8]. The reputation of the company that is driven by the perception of the effectiveness of the company is believed to increase the investors’ sentiment that the risk of investing in company shares is low. High investor reaction will result in an increase in stock prices and company stock returns. Signaling theory considers the provision of investor information about the prospect of substantial future returns. Disclosure of CSR in accordance with the wishes of stakeholders can be received as a signal in the form of good news, indicating that the company has good prospects in the future and ensuring the creation of sustainable development. The company discloses corporate social responsibility information in the hope of increasing its reputation, which in turn will increase share prices. Stakeholder theory also states that the company does not only operate for the benefit of the company itself, but must also be able to provide a benefit to other stakeholders [9]. Asserts that every company is required to demonstrate an act of responsibility to all stakeholders, not only from within the company but also from outside the company, which also includes environmental responsibility [10]. This proportion is supported by Marshall who found that companies can build a positive reputation by showing responsibility in environmental and social preservation [11]. In this case, corporate social responsibility can promote the company’s reputation. Thus, increasing quality and reputation are intrinsically intertwined with environmental quality and social responsibility [12].
Companies that have a high Corporate Image Index (CII) score illustrate their quality, performance, responsibility, and attractiveness. This reputation brings the company to have a competitive advantage over its competitors, such as the company’s ability to influence customers in choosing products, limiting potential competition, and securing social status in an industry [13].

2.3. Previous Research

Previous research conducted in (Rahayu and Masud) [14] showed that inflation can have a positive influence on stock prices. The ability of a company to create profits by using the company’s own capital or assets can be called the profitability ratio. Profitability in general can be described through the use of the Return on Equity (ROE) ratio, which provides an overview of how much equity is used to provide benefits for the company. Profitability can affect stock prices. This is because the profitability ratio also provides a point of interest for investors to invest in an issuer. The share price of an issuer will increase when there is an increase in demand made by investors [15]. However, it was found according to research by (Asmirantho and Yuliawati) that profitability has no effect on stock prices [16].
There is no effect of DER on stock prices because there are two views that investors can take. First, investors can assume that companies that have a high DER ratio will cause investor losses in the future. Second, investors can assume that the debt owned by the company can be used for future growth. The company requires a substantial amount of operational funds that cannot be met only from the company’s own capital. The results of this study are supported by previous research conducted in (Asmirantho and Yuliawati) [17] and (Christine and Dorothea) which stated that solvency had no effect on stock prices [18].
The Current Ratio has no effect on stock prices [19]. However, research (Sutapa) found different results where the Current Ratio had a significant positive effect on stock prices [20].
Net profit margin analysis has been carried out by (Fitriani R. S) [21]. NPM has no effect on stock prices. However, in (Watung and Ilat) different results were obtained, where NPM had a positive and significant effect on stock prices [22]. Another study (Murniati), obtained results stating that NPM has a significant negative effect on stock prices [23].
TATO has no significant effect on stock prices. This study is in accordance with previous research, namely (Made and Ali) [24], which showed that TATO was not proven to have a significant effect on stock prices. The results of (Fernández-Gámez, Gil-Corral, and Galán-Valdivieso) found that company reputation has a positive influence on market value [5].

2.4. Hypothesis Development

To obtain evidence of whether the influence of financial ratios and company reputation had substantial effects on the share prices of financial sector companies listed on the Indonesia Stock Exchange, several hypotheses are needed that can be used in research. The following are the hypotheses that will be used:

2.4.1. The Effect of Current Ratio on Stock Prices

The Current Ratio is the most commonly-used measure to determine the ability to meet short-term obligations, because this ratio shows how far the demands of short-term creditors are met by assets that are estimated to be cash in the same period as the debt maturity. Research (Dananti, Cahjono, and Mujiyono) [25] has obtained the result that CR has a positive and significant influence on stock prices.
H1. 
Current Ratio has a positive and significant effect on stock prices. The Effect of Debt to Equity Ratio on Stock Prices.
Debt to Equity ratio shows the composition or capital structure of the total loan (debt) to the total capital owned by the company. The higher the DER, the greater the composition of total debt (short term and long term) compared to the total equity, so that the company’s burden on external parties (creditors) is greater. So, if the DER is higher, the investor’s interest in the company’s shares will decrease, and vice versa; if the DER of the company is lower, investors will be more interested in the company’s shares which can automatically increase the company’s share price. Research (Purwanto and Agustin) [26] shows that DER has a negative and significant effect on stock prices.
H2. 
Debt to Equity Ratio has a negative and significant effect on stock prices.

2.4.2. The Effect of Total Assets Turnover Ratio on Stock Prices

The higher this ratio is, the stronger a company is, because of the effective use of assets in generating sales, so that it can be said that the profit generated is also high. Thus the company’s financial performance is getting better and can encourage an increase in the company’s share price because more investors intend to invest in shares. This is in accordance with the research conducted by Putra, Saryadi and Hidayat [27] which shows that TATO has a positive and significant effect on stock prices.
H3. 
Total Assets Turnover has a positive and significant effect on stock prices.

2.4.3. Effect of Net Profit Margin on Stock Prices

Syaffri [28] stated that the larger the net profit margin, the greater the net profit obtained by the company from sales activities. With a large net profit, there is an increasing opportunity for companies to increase their business capital without going through new debts; the income obtained increases so that the higher the NPM of a company, the more investors are attracted to the company because investors can get a better return. This is in accordance with research conducted by (Astuty) [29] which shows that NPM has a positive and significant influence on stock prices.
H4. 
Net Profit Margin has a positive and significant effect on stock prices.

2.4.4. The Effect of Return on Equity on Stock Prices

ROE is a very important ratio for shareholders, because this ratio measures the return on investment of shareholders in the company. The lower this ratio, the smaller the level of profit earned by the company’s shareholders. ROE is used to measure the level of profit from investments that have been made by the owners of their own capital or shareholders. A high ROE that exceeds the cost of capital used indicates that the company has been efficient in using its own capital, so that the profits generated have increased from previous years. In other words, with a high return on equity, the company has the opportunity to provide a large income for shareholders, which will have an impact on increasing share prices because they will be increasingly in demand by potential investors. This is in line with research (Ligocká and Stavárek) [30] which shows that ROE has a positive and significant effect on stock prices.
H5. 
Return on Equity has a positive and significant effect on stock prices.

2.4.5. The Effect of Price to Earnings Ratio on Stock Prices

According to Tandelin [31], Price to Earnings Ratio indicates the amount of rupiah that must be paid by investors to obtain one rupiah of company profits. This ratio is used by investors to compare the market value of ordinary shares relative to the profits of other companies by measuring the potential value of other companies’ shares. This ratio compares the stock price (from the capital market) with the earnings per share obtained from the owner of the company. Price to Earnings Ratio (PER) describes the market appreciation of the company’s ability to generate profits. The higher the PER value, the better the company’s ability. This will be able to attract investors to invest. A high PER indicates that the stock price will be high and vice versa. So it can be said that the Price to Earnings Ratio has a positive influence on stock prices.
H6. 
There is a significant effect between the PER ratio on stock prices.

2.4.6. The Effect of Company Reputation on Stock Prices

Company reputation has a positive influence on market value [32]. The reputation of the company that is driven by the perception of the effectiveness of the company is believed to increase investor reactions that the risk of investing in company shares is low. High investor reaction will result in an increase in stock prices and higher company stock returns. This statement shows that there is a positive relationship between company image and stock returns.
H7. 
Company reputation can have an influence on stock returns.

2.5. Thinking Framework (Concept Variable Drawing)

Changes in stock prices on the stock exchange or secondary market are influenced by several factors, one of which is the company’s internal factors. The company’s performance is an internal factor of the company that can be seen through the company’s financial ratios. Generally, the fundamental factors studied in the financial statements are in the form of financial ratios such as liquidity, leverage, profitability, and market ratios. Based on the explanation of Chapters 1 and 2, the variables in this study are Current Ratio (CR), Debt to Equity Ratio (DER), Total Assets Turnover (TATO), Net Profit Margin (NPM), Return on Equity (ROE), Price to Earnings Ratio (PER), and Company Reputation as variable X and stock price as variable Y. Systematically, the theoretical framework in this study can be shown in the following figure (Figure 1):

3. Research Methods

3.1. Research Method

The type of research conducted in this study is a quantitative approach. A quantitative approach is used to examine a particular population or sample. In this study, financial performance is used as a benchmark in determining its effect on stock prices using the calculation of the effect of the Current Ratio, Debt to Equity Ratio, Total Assets Turnover, Net Profit Margin, Return on Equity, Price to Earnings Ratio, and the company’s reputation.
The population of this study was taken from a sample of 30 banks listed on the Indonesia Stock Exchange from 2016 to 2020. In this study, the companies used as samples were selected by purposive sampling from all banks listed on the Indonesia Stock Exchange. With this method, the sample is selected based on certain criteria, namely: (1) banks listed on the IDX during the analysis period; (2) issuing financial statements as of 31 December 2016–2020; and (3) having data and financial reports related to the measurement of research variables.

3.2. Operational Variables

In this study the variables to be studied are Current Ratio (CR), Debt to Equity Ratio (DER), Total Assets Turnover (TATO), Net Profit Margin (NPM), Return on Equity (ROE), Price to Earnings Ratio (PER), and the Company’s Reputation on the share price. The objects of the research are the financial statements for the 2016–2020 period in banking sector companies listed on the Indonesia Stock Exchange (IDX). Then, operationalization of variables is needed to determine the types and indicators of the variables involved in the research and aims to determine the measurement scale of each variable.

3.3. Sample Selection

In this study, the sample is companies that meet certain criteria. The criteria used as research samples are:
  • Banking sector companies listed on the IDX during the period 2016–2020;
  • Financial sector companies that have consecutive financial statements during the 2016–2020 period;
  • Financial sector companies listed on the IDX, companies with a search based on the main board on stock prices;
  • The company has all data needed in the study in accordance with the variables studied, namely Current Ratio (CR), Debt to Equity Ratio (DER), Total Assets Turnover (TATO), Net Profit Margin (NPM), Return on Equity (ROE), Price to Earnings Ratio (PER) and the reputation of companies in the financial sector on the IDX.
Based on predetermined criteria, from the number of companies in the finance sector, 53 companies are listed on the main board and 52 companies are on the development board, with a total of 105 companies. So, companies that meet these criteria are 30 companies in the financial sector.

3.4. Data Collection

The source of data used in this research is secondary data. According to (Yulianto, 2018) “Secondary data is data that has been collected by data collection institutions and published to the public using services”. The data used in this study are annual financial reports and stock prices, where the data are taken from the Indonesia Stock Exchange website www.idx.co.id and id.investing.com for the financial sector 2016–2020. The data collection method is data collection; the data that will be used for this research and the method used in this research is to use the annual financial report documents obtained from the IDX website.

3.5. Analysis Method

This study applies an analysis that leads to inferential statistical analysis, namely by examining the effect of financial ratios such as the Current Ratio, Debt to Equity Ratio, Total Assets Turnover, Net Profit Margin, Return on Equity, Price to Earnings Ratio, and the reputation of the financial sector companies in companies that listed on the Indonesia Stock Exchange in 2016–2020.

4. Analysis and Discussion

This study will examine whether there is an effect of Current Ratio (X1), Debt to Equity Ratio (X2), Total Assets Turnover (X3), Net Profit Margin (X4), Return on Equity (X5), Price to Earnings Ratio (X6), and Company Reputation (X7), to Share Price (Y1) in financial sector companies. There are seven independent variables and one dependent variable which will be analyzed causally in this study. The data to be used is annual data from 2016 to 2020 (5 years) with a sample of 30 companies in the financial sector.
The total observations that should be used are 150 units of observation data, but because there are some incomplete data, only 137 units of observation will be analyzed. The data used is available on the attachment page. The stages in this analysis, starting from descriptive analysis to hypothesis testing (Table 1).

4.1. Statistical Analysis (Regression)

The next step of this analysis is to perform a regression analysis. The results and outputs of the regression analysis are as follows (Table 2 and Table 3):
In the ANOVA table, it can be seen that the Sig value obtained is 0.000 which is smaller than 0.05; it was then decided to reject H0 and accept H1, that is to say, that there is at least 1 variable out of 7 X variables that affect Y. To find out which X variable affects Y, the next step is to conduct an analysis using the t test as below.

4.2. Individual Test (t Test)

This test uses the COEFFICIENT table output. The table in question is the following table (Table 4).
The t-test for the CR variable obtained the regression coefficient value with a negative direction of −0.219. The result of the CR variable is t = −2.758 with a probability of 0.007. The significance value of 0.007 is smaller than 0.05. Based on the explanation above, it can be concluded that the first hypothesis which states “Current Ratio (CR) has a positive effect” is accepted.
Based on the t-test for the Debt to Equity Ratio (DER) variable, the regression coefficient value in the negative direction is −0.034. The result of the DER variable is t = −0.401 with a probability of 0.689. The value is greater than 0.05. So, it can be concluded that the second hypothesis which states “Debt to Equity Ratio (DER) has a negative effect” is accepted.
In the t-test for the Total Assets Turnover (TATO) variable, the regression coefficient value is obtained with a positive direction of 0.015. The result of the TATO variable is t = 0.189 with a probability of 0.850. The value is greater than 0.05. So, it can be concluded that the third hypothesis which states “Total Assets Turnover (TATO) has a positive effect” is rejected.
Based on the t-test for the Net Profit Margin (NPM) variable, the regression coefficient value is obtained with a positive direction of 0.009. The results of the NPM variable are t = 0.117 with a probability of 0.907. The value is greater than 0.05. So, it can be concluded that the fourth hypothesis which states “Net Profit Margin (NPM) has a positive effect” is rejected.
Based on the t-test for the Return on Equity (ROE) variable, the regression coefficient value is obtained with a positive direction of 0.353. The results of the ROE variable are t = 4.289 with a probability of 0.000. The value is smaller than 0.05. So, it can be concluded that the fifth hypothesis which states “Return on Equity (ROE) has a positive effect” is accepted.
Based on the t-test for the Price to Earnings Ratio (PER) variable, the regression coefficient value is obtained with a negative direction of −0.051. The result of the PER variable is t = −0.623 with a probability of 0.534. The value is greater than 0.05. It therefore can be concluded that the sixth hypothesis which states “Price to Earnings Ratio (PER) has a positive effect” is rejected.
In the t-test for Company Reputation, the regression coefficient value is obtained with a negative direction of −0.029. The result of the PER variable is t = −0.355 with a probability of 0.723. The value is greater than 0.05. So, it can be concluded that the seventh hypothesis which states “Company reputation has a positive effect” is rejected.
In the COEFFICIENT table, it can be seen that the Sig value which is less than 0.05 is the Sig value for the CR variable of 0.007 and the ROE of 0.000; it is concluded that only these two variables affect Variable Y or Stock Price.

4.3. Coefficient of Determination (R2)

The value of determination or influence on Variable Y or Stock Price can be seen in the R-Square value in the table below (Table 5).
The R-Square value obtained is 0.212 or 21.2% in other words, the CR and ROE variables are able to predict stock prices with an accuracy of 21.2%. This accuracy value is included in the Weak category.

4.4. Classical Assumption Test

4.4.1. Data Normality Test
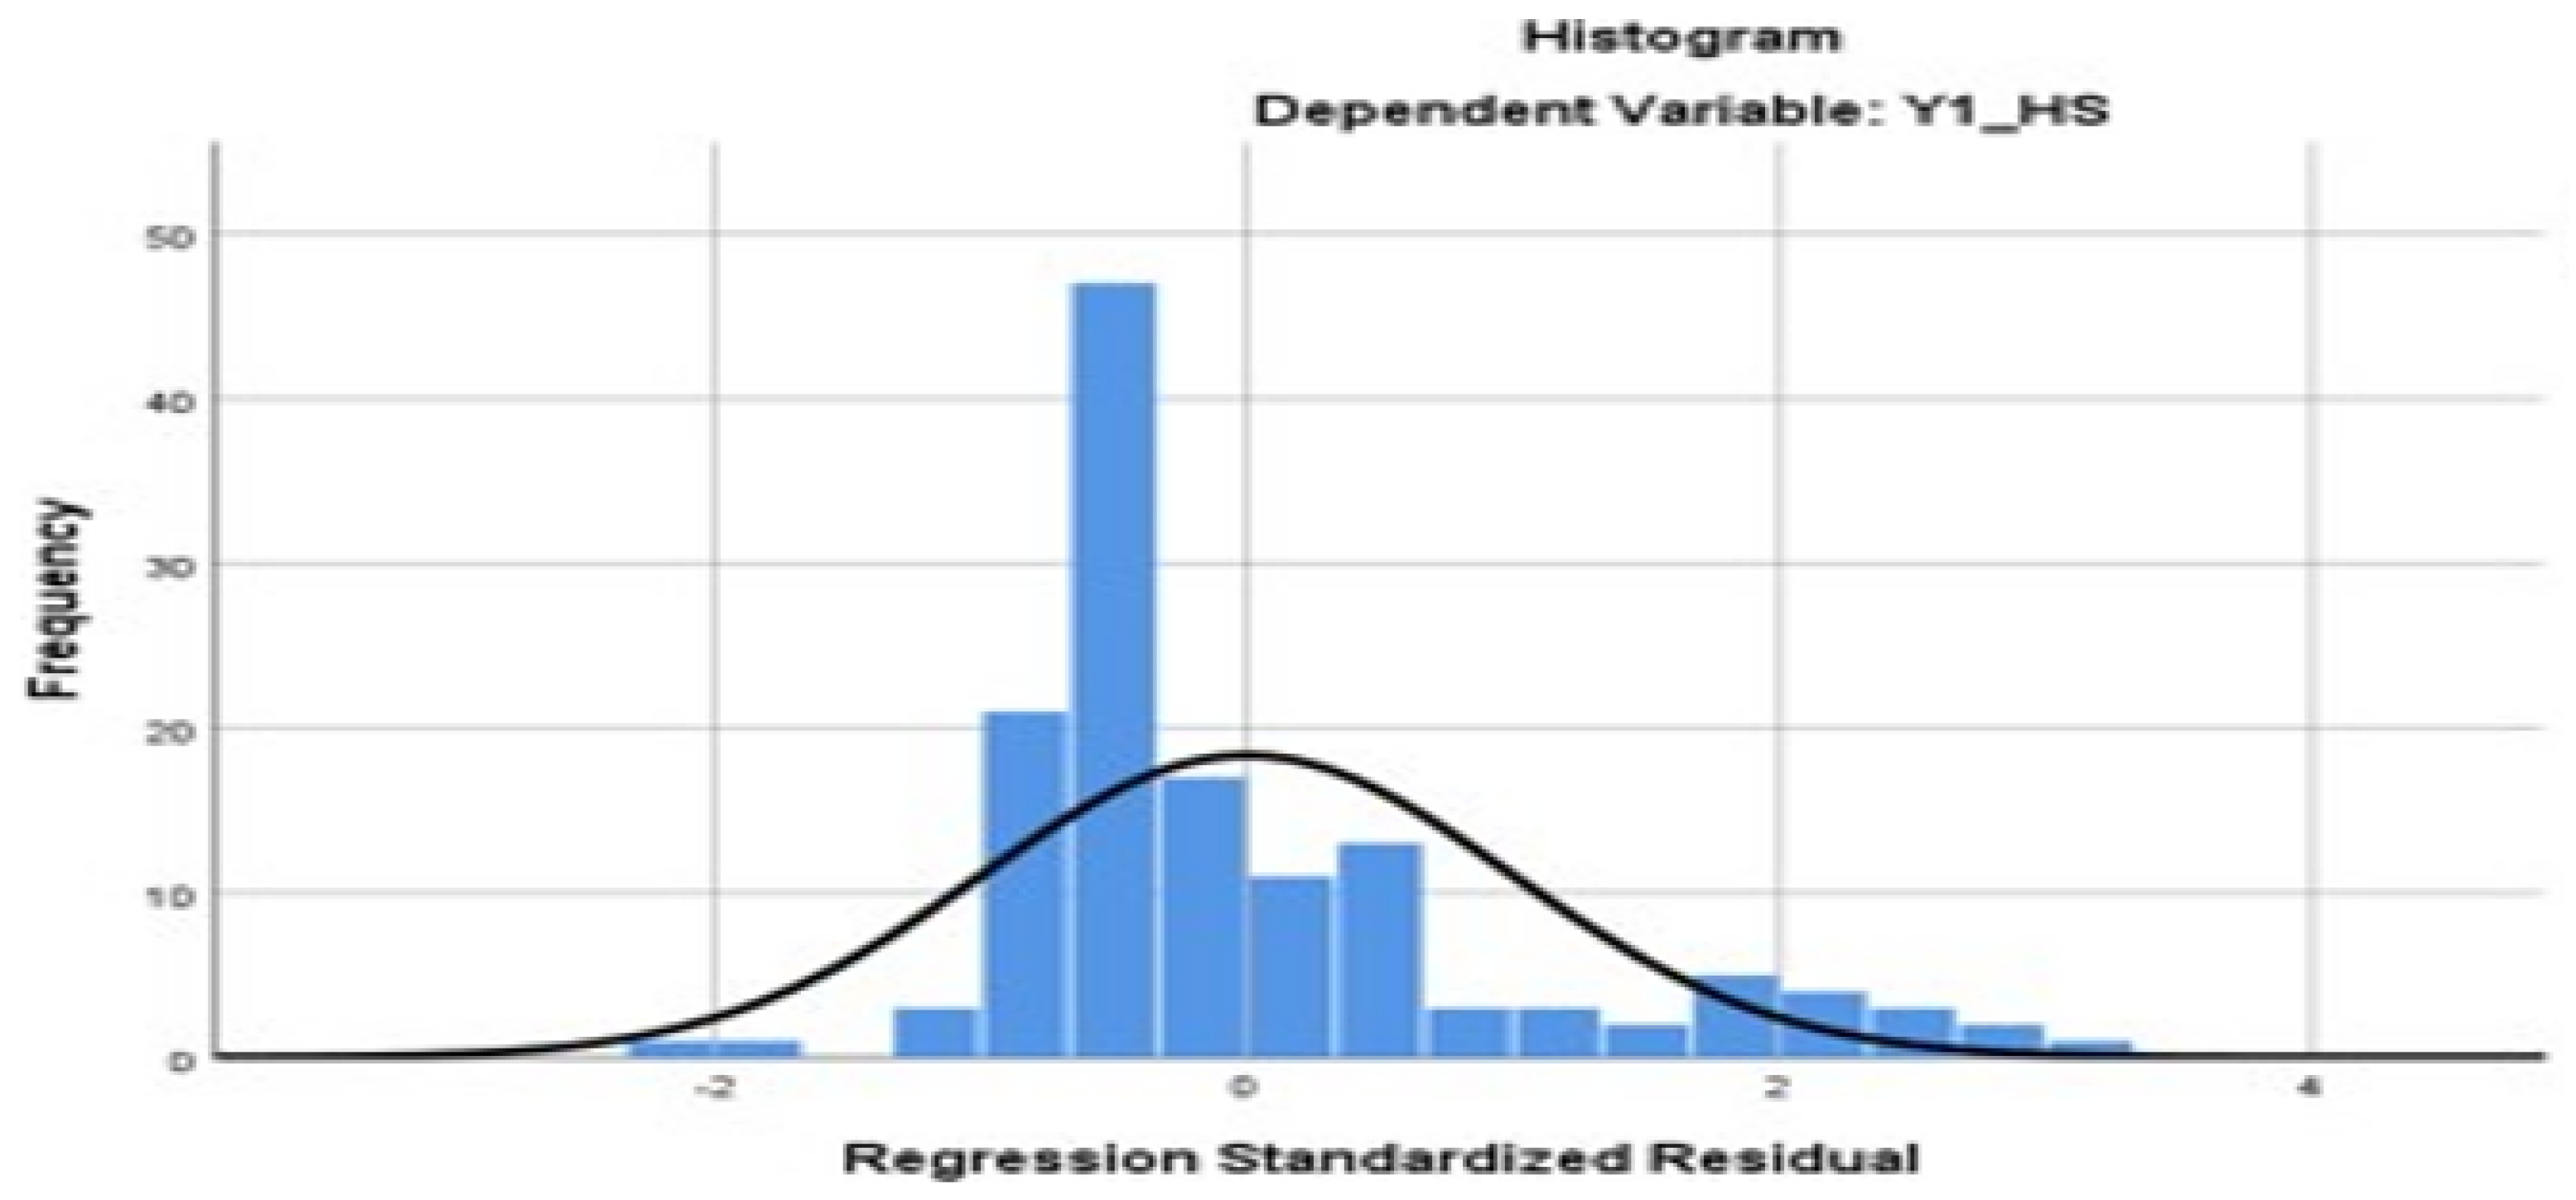
The graph below (Figure 2) shows that the data used in the analysis has met the criteria for Normality, as can be seen from the Histogram that is formed quite closely following the distribution pattern of the Normal Distribution.

4.4.2. Multicollinearity Test Non-Multicollinearity Assumption

Multicollinearity Testing uses the VIF value (Table 6). If the VIF value is greater than 10, it is stated that there is multicollinearity. In the table above, it can be seen that the VIF value for all variables is less than 10, so it is stated that there is no problem with Multicollinearity.
Non-Autocorrelation Assumption
The obtained DW value is greater than 2000. It can therefore be stated that there is no autocorrelation problem (Table 7).

4.4.3. Heteroscedasticity Test; Homoscedasticity Assumption
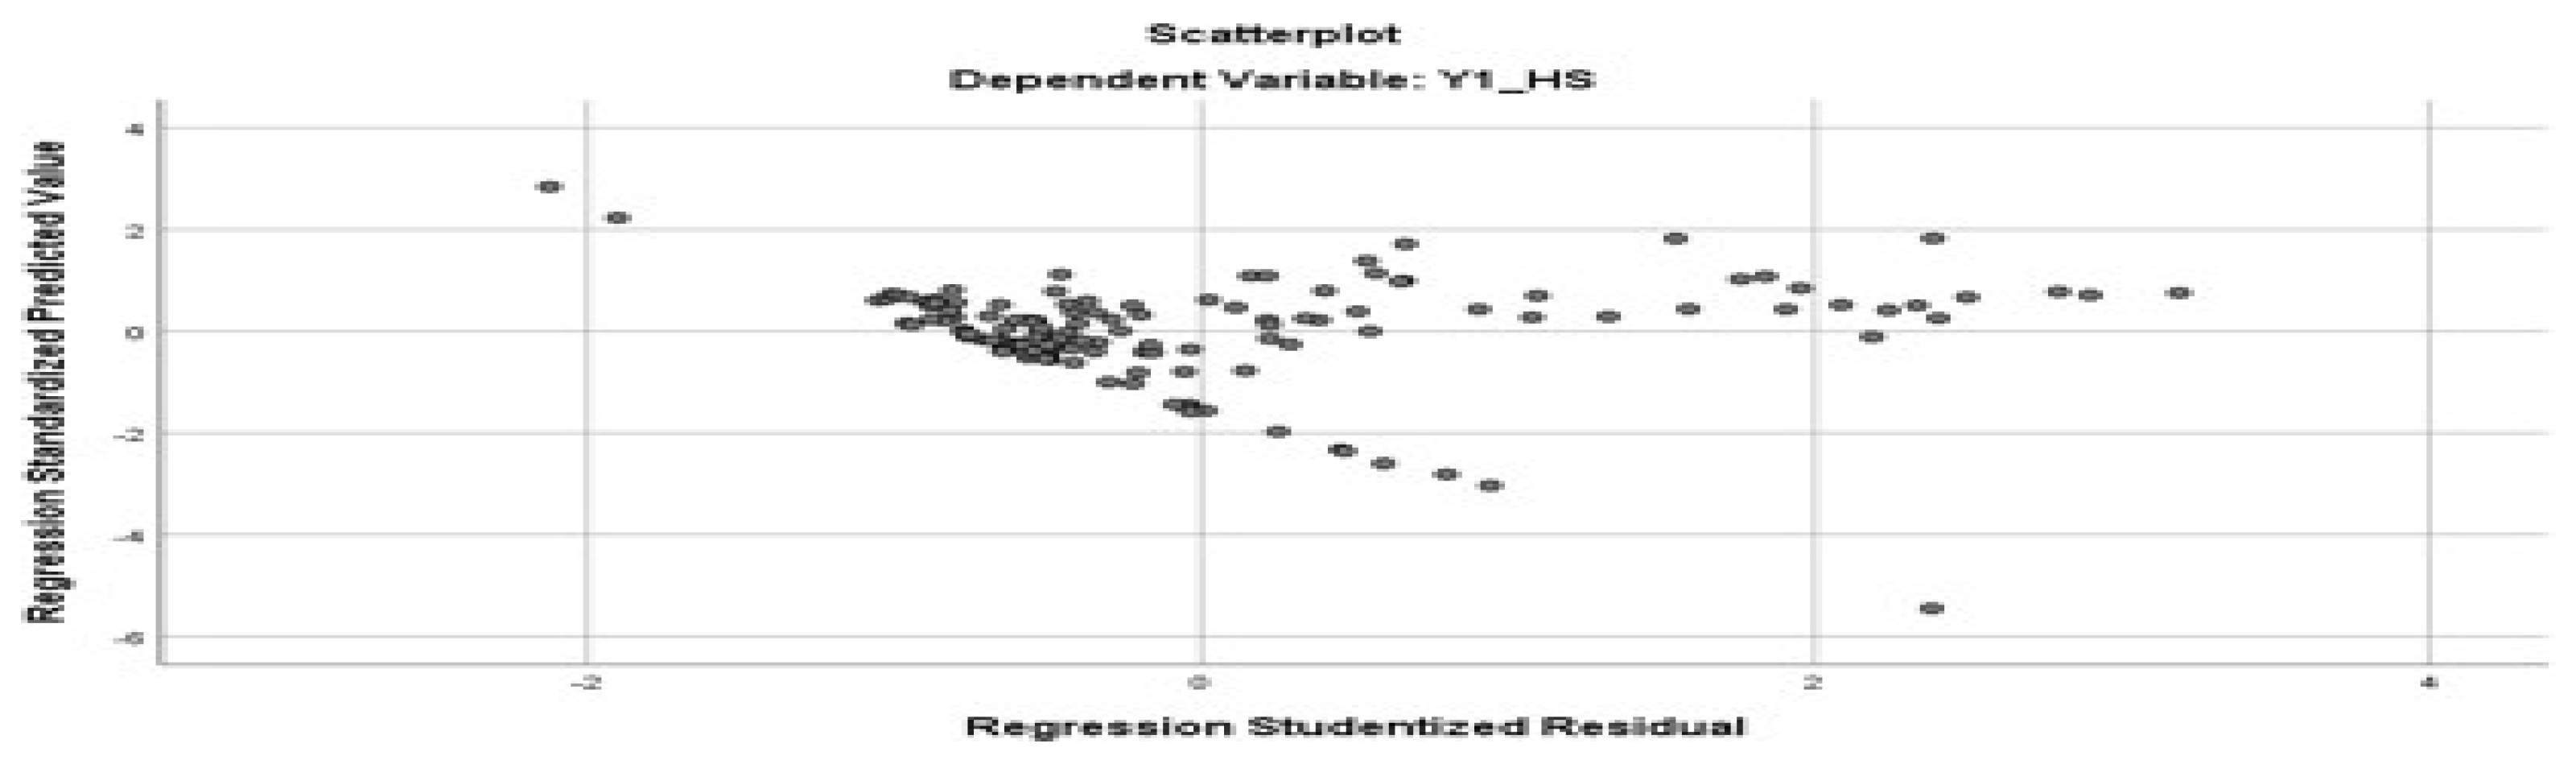
The graph below (Figure 3) shows the distribution pattern of residuals that do not follow a certain distribution pattern, or do not have a pattern. Because it has no pattern, it is concluded that this regression model meets the assumption of homoscedasticity.

5. Conclusions and Suggestions

5.1. Conclusions

Based on the above analysis, some conclusions that can be drawn are as follows: From the seven variables included in this study, there are several variables that have an influence on the Stock Price variable. Only two variables affect the Stock Price, namely Current Ratio (CR) and Return on Equity (ROE), because only these two variables have Sig values below 0.05. Current Ratio (CR) and Return on Equity (ROE) variables are able to predict stock prices with an accuracy of 21.2%. The accuracy value shown is included in the Weak category.

5.2. Suggestions

Based on the explanation above, some suggestions given by the author are as follows: Current Ratio and Return on Equity have a significant influence on stock prices. Therefore, it is important for companies to pay attention to the level of CR in order to increase. This can be done by increasing current assets such as adding short-term debt or increasing the company’s capital. Then, from the ROE side, it also needs to be maintained or increased by increasing net income.

Funding

This Research received no external funding.

Institutional Review Board Statement

Not applicable for studies not involving humans or animal.

Informed Consent Statement

Not applicable.

Data Availability Statement

Not report any data.

Conflicts of Interest

The authors declare no conflict of interest.

References

  1. Isnawati, E.; Wahidahwati, W. Overreaction Analysis of Manufacturing Stock Prices Listed on the Indonesia Stock Exchange. J. Account. Sci. Res. 2015, 4, 19. [Google Scholar]
  2. Suhadak, K.; Handayani, S.R.; Rahayu, S.M. Stock Return and Financial Performance as Moderation Variable in Influence of Good Corporate Governance towards Corporate Value. Asian J. Account. 2019, 4, 18–34. [Google Scholar] [CrossRef] [Green Version]
  3. Brigham, E.F.; Houston, J.F. Fundamentals of Financial Management, 10th ed.; Salemba Empat: Jakarta, Indonesia, 2006; Volume Book One. [Google Scholar]
  4. Velankar, D.; Chandani, A.; Ahuja, A.K. Impact of EPS and DPS on Stock Price: A study of Selected Public Sector Banks of India. Prestig. Int. J. Manag. IT-Sanchayan 2017, 6, 111–121. [Google Scholar] [CrossRef]
  5. Fernández-Gámez, M.A.; Gil-Corral, A.M.; Galán-Valdivieso, F. Corporate Reputation and Market values: Evidence with Generalized Regression Neural Networks. Expert Syst. Appl. 2015, 46, 69–76. [Google Scholar] [CrossRef]
  6. Pantow, M.S.; Murni, S.; Trang, I. Analysis of Sales Growth, Firm Size, Return on Assets, and Capital Structure on Firm Values Listed in the LQ 45 Index. J. Econ. Res. Manag. Bus. Account. 2015, 3, 961–971. [Google Scholar]
  7. Roberts, P.W.; Dowling, G.R. Corporate Reputation and Sustained Superior Financial Performance. Strateg. Manag. J. 2002, 23, 1077–1093. [Google Scholar] [CrossRef]
  8. Tischer, S.; Hildebrandt, L. Linking Corporate Reputation and Shareholder Value Using the Publication of Reputation Rankings. J. Bus. Res. 2014, 67, 1007–1017. [Google Scholar] [CrossRef] [Green Version]
  9. Ghozali, I.; Chariri, A. Accounting Theory; Diponegoro University Publishing Agency: Semarang, Indonesia, 2016. [Google Scholar]
  10. Donaldson, T.; Dunfee, T.W. Toward A Unified Conception of Business Ethics: Integrative Social Contracts Theory. Acad. Manag. Rev. 1994, 19, 252. [Google Scholar] [CrossRef]
  11. Marshall, J. The gendering of leadership in corporate social responsibility. J. Organ. Chang. Manag. 2007, 20, 165–181. [Google Scholar] [CrossRef]
  12. Galbreath, J. Are there gender-related influences on corporate sustainability? A study of women on boards of directors. J. Manag. Organ. 2011, 17, 17–38. [Google Scholar] [CrossRef]
  13. Hall, E.H., Jr.; Lee, J. Assessing the Impact of Firm Reputation on Performance: An International Point of View. Int. Bus. Res. 2014, 7, 1–13. [Google Scholar] [CrossRef] [Green Version]
  14. Rahayu, T.N.; Masud, M. The Influence of Interest Rates, Rupiah Exchange Rates and Stock Trading Volumes on Manufacturing Company Stocks. PARADOX J. Econ. 2019, 2, 35–46. [Google Scholar]
  15. Rahayu, R.; Siswantini, T.; Tri Wahyuningtyas, N. Factors Affecting Stock Prices (Case Study: Various Industries Listed on the IDX). CORRELATION I (National Research Conference on Economics, Management and Accounting). 2020, 1, 1162–1176. [Google Scholar]
  16. Asmirantho, E.; Yuliawati, E. The Effect of Dividend Per Share (DPS), Dividend Payout Ratio (DPR), Price to Book Value (PBV), Debt to Equity Ratio (DER), Net Profit Margin (NPM), Return On Assets (ROA) on Stock Prices in Manufacturing Companies Food and Beverage Sub Sector on the IDX. JIAFE Sci. J. Account. Fac. Econ. 2015, 1, 2501–4159. [Google Scholar]
  17. Christine, D.; Dorothea, G. The Effect of Profitability and Solvency on Stock Prices; Indonesian Finance and Business Forum (FKBI): Jakarta, Indonesia, 2017; pp. 9–18. [Google Scholar]
  18. Oktaviani, S.; Komalasari, D. Effect of Liquidity, Probability and Solvency on Stock Prices (Case Study on Banking Companies Listed on the Indonesia Stock Exchange). J. Account. 2017, 3, 2549–5968. [Google Scholar]
  19. Sutapa, I.N. The Effect of Ratios and Financial Performance on Stock Prices on the LQ45 Index on the IDX in the 2015–2016. KRISNA: Kumpul. Ris. Akunt. 2018, 9, 11–19. [Google Scholar]
  20. Fitriani, N.; Agustami, S. The Influence of Liquidity, Solvency, Profitability, Market Ratio and Company Size on Stock Prices in Plantation Sub-Sector Companies Listed on the Indonesia Stock Exchange in 2010–2014. J. Account. Financ. Res. 2016, 4, 2338-1507. [Google Scholar]
  21. Fitriani, R.S. The Effect of NPM, BPV, and DER on Stock Prices in Food and Beverage Sub-Sector Companies on the Indonesia Stock Exchange. E-J. Bus. Adm. 2016, 4, 2355–5408. [Google Scholar]
  22. Watung, R.W.; Ilat, V. The Effect of Return on Assets, Net Profit Margin and Earning Per Share on Stock Prices in Banking Companies on the Indonesia Stock Exchange. EMBA J. 2016, 4, 2302-1174. [Google Scholar]
  23. Murniati, S. Effect of Capital Structure, Company Size, and Probability On Stock Price Of Food and Baverage Companies Listed On The Indonesia Stock Exchange. Inf. Manag. Bus. Rev. 2016, 8, 2270–3796. [Google Scholar]
  24. Made, W.G.; Ali, M.F. The Effect of Financial Performance on Share Prices in Property and Real Estate Companies Listed on the Indonesia Stock Exchange. Focus J. 2019, 9, 206–228. [Google Scholar]
  25. Dananti, K.; Cahjono, M.P. The Best Indicator of Capital Structure to Predict Firm’s Performance. Rev. Integr. Bus. Econ. 2017, 317. [Google Scholar]
  26. Purwanto, P.; Agustin, J. Financial performance towards value of firms in basic and chemicals industry. Eur. Res. Stud. J. 2017, 20, 443–460. [Google Scholar] [CrossRef] [PubMed]
  27. Aldiansyah, P.; Saryadi, S.; Hidayat, W. The Influence of Financial Performance on Share Prices of BUMN (Non-Bank) Companies Listed on the Indonesia Stock Exchange. Dipenogoro J. Soc. Political 2013, 12, 1–9. [Google Scholar]
  28. Syaffri, H.S. Critical Analysis of Financial Statements; PT Rajagrafindo Persada: Jakarta, Indonesia, 2010. [Google Scholar]
  29. Astuty, P. The Influence of Fundamental Factors and Systematic Risk to Stock Prices on Companies Listed in the Indonesian Stock Exchange. Eur. Res. Stud. J. 2017, 20, 230–240. [Google Scholar] [CrossRef] [Green Version]
  30. Ligocká, M.; Stavárek, D. The Relationship Between Financial Ratios and the Stock Prices of Selected European Food Companies Listed on Stock Exchanges. Acta Univ. Agric. Et Silvic. Mendel. Brun. 2019, 67, 299–307. [Google Scholar] [CrossRef]
  31. Tandelilin, E. Portofolio dan Investasi Teori dan Aplikasi, 4th ed.; Kanisius: Yogyakarta, Indonesia, 2010. [Google Scholar]
  32. Erasputranto, R.A.; Hermawan, A. The Effect of Corporate Image on Company’s Stock Return. In Proceedings of the National Accounting Symposium (SNA), Medan, Indonesia, 16–19 September 2015; p. 20. [Google Scholar]
Figure 1. Conceptual Framework.
Proceedings 83 00047 g001
Figure 2. Residual Standard Regression Graph (Source: Author’s Data Processing Results).
Proceedings 83 00047 g002
Figure 3. Scatterplot.
Proceedings 83 00047 g003
Table 1. Table of Descriptive Analysis Results (Source: Author’s data processing results).
NMinimumMaximumMeanStd. Deviation
X1_CR1370.0515.151.42122.25627
X2_DER1370.62565.4513.856456.32724
X3_TATO1370.06200.901.598717.15281
X4_NPM137−841.751175.6718.2690135.43390
X5_ROE137−57.8238.646.90739.74284
X6_PER137−161.931233.8160.6488160.81639
X7_REP137−0.9627.800.40322.46890
Y1_HS1373.259054.211793.17462278.24856
Valid N (listwise)137
Table 2. Table Model Summary (Source: Author’s data processing results).
ModelRR SquareAdjusted R SquareStd. Error of the Estimate
10.460 a0.2120.1692076.68651
a Predictors: (Constant), X7_REP, X1_CR, X3_TATO, X6_PER, X4_NPM, X5_ROE, X2_DER.
Table 3. F Test and Anova.
Model Sum of SquaresdfMean SquareFSig.
1Regression149,567,777.382721,366,825.3404.9540.000 b
Residual556,328,864.9651294,312,626.860
Total705,896,642.348136
a. Dependent Variable: Y1_HS. b. Predictors: (Constant), X7_REP, X1_CR, X3_TATO, X6_PER, X4_NPM, X5_ROE, X2_DER.
Table 4. Coefficients t Test.
Unstandardized CoefficientsStandardized CoefficientstSig.
Model BStd. ErrorBeta
1(Constant)1605.225274.677 5.8440.000
X1_CR−221.18880.199−0.219−2.7580.007
X2_DER−1.3713.423−0.034−0.4010.689
X3_TATO1.97010.4070.0150.1890.850
X4_NPM0.1591.3550.0090.1170.907
X5_ROE82.53319.2440.3534.2890.000
X6_PER−0.7261.166−0.051−0.6230.534
X7_REP−26.69475.287−0.029−0.3550.723
a. Dependent Variable: Y1_HS.
Table 5. Table Model Summary (Source: Author’s data processing results).
ModelRR SquareAdjusted R SquareStd. Error of the Estimate
10.460 a0.2120.1692076.68651
a Predictors: (Constant), X7_REP, X1_CR, X3_TATO, X6_PER, X4_NPM, X5_ROE, X2_DER.
Table 6. Multicollinearity Test.
ModelCollinearity Statistics ToleranceVIF
1X1_CR 0.968 1.033
X2_DER 0.853 1.172
X3_TATO 0.995 1.005
X4_NPM 0.941 1.063
X5_ROE 0.902 1.109
X6_PER 0.902 1.109
X7_REP 0.918 1.090
a. Dependent Variable: Y1_HS.
Table 7. Table: Durbin-Watson (Source: Author’s data processing results).
Model Summary
ModelDurbin-Watson
12.177
Disclaimer/Publisher’s Note: The statements, opinions and data contained in all publications are solely those of the individual author(s) and contributor(s) and not of MDPI and/or the editor(s). MDPI and/or the editor(s) disclaim responsibility for any injury to people or property resulting from any ideas, methods, instructions or products referred to in the content.

