Proceeding Paper

Influence of Destination Attributes on Tourists’ Satisfaction and Their Impact on Tourists’ Loyalty, Pramuka Island †

by
Anisatul Auliya
1,* and
Diani Mustika Prianti
2
1
Tourism Department, Vocational Education Program, Universitas Indonesia, Depok City 16424, Indonesia
2
School of Business, IPB University, Bogor 16151, Indonesia
*
Author to whom correspondence should be addressed.
Presented at the 5th International Conference on Vocational Education Applied Science and Technology 2022, Teluk Betung, Indonesia, 26–28 October 2022.
Proceedings 2022, 83(1), 28; https://doi.org/10.3390/proceedings2022083028
Published: 27 December 2022

Abstract

:
This research aimed to determine the effect of destination attributes on tourist loyalty in Pramuka Island, through tourist satisfaction as a mediating variable. This research used a quantitative approach with descriptive analysis. The collected data were obtained through a questionnaire distributed to 50 respondents who had visited Pramuka Island. The data analysis used simple linear regression. The research results showed that the destination attributes significantly influenced tourist satisfaction. Destination attributes and tourist satisfaction also significantly influenced tourist loyalty. Topics for further research are the standardization of marine tourism and the promotion of Pramuka Island.

1. Background

Based on data from Statistics Indonesia [1], Indonesia is the largest archipelagic country in the world with as many as 16,766 islands and an area of 1,916,906.77 km2. Indonesia is rich in nature, flora and fauna, heritage history, and art and culture, from Sabang to Merauke, which make it highly competitive in the tourism sector. According to the Ministry of Tourism and Creative Economy [2], the number of foreign tourist visits in 2021 was 61.57% higher compared with 2020, due to the COVID-19 pandemic. Correspondingly, it is important to restore the tourism sector in Indonesia and develop a sustainable tourism act by adopting new habits [3].
Several studies have been conducted on tourist attractions, rural tourism, urban tourism, and other tourist activities in Indonesia in relation to tourism development and sustainable tourism [4]. Another interesting type of tourism that should be studied because it is experiencing a very fast growth is marine tourism. Orams (1999) in [5] stated that marine tourism includes tourist travel to a destination with a focus on utilizing the marine environment as a location for tourism activity and as a tourist attraction. Furthermore, Orams emphasized that the marine environment can be interpreted as a marine or maritime area that is the center of tourist activities.
Thousand Islands is one of the leading attractions in DKI Jakarta and has an extraordinary potential as a nature attraction, with its islands, coral reefs and underwater environment. [6] researched the development of transportation accessibility, and [7] studied tourism development by structuring tourist capacity. This study focused on Pramuka Island as an effort to improve and organize tourism in the Thousand Islands.
Referring to the research conducted by [8], Pramuka Island already has attractions, accessibility, and adequate amenities. This is supported by [9], who stated that Pramuka Island can be said to qualify as a leading destination in the Thousand Islands because it already has various components necessary for a tourism destination, such as in tourist attractions, accessibility, amenities (tourism support facilities), ancillaries services, and tourism institutions. In addition, according to [10], Pramuka Island has a potential as a nature attraction, thanks to the Mangrove Park which can be used for educational tours.
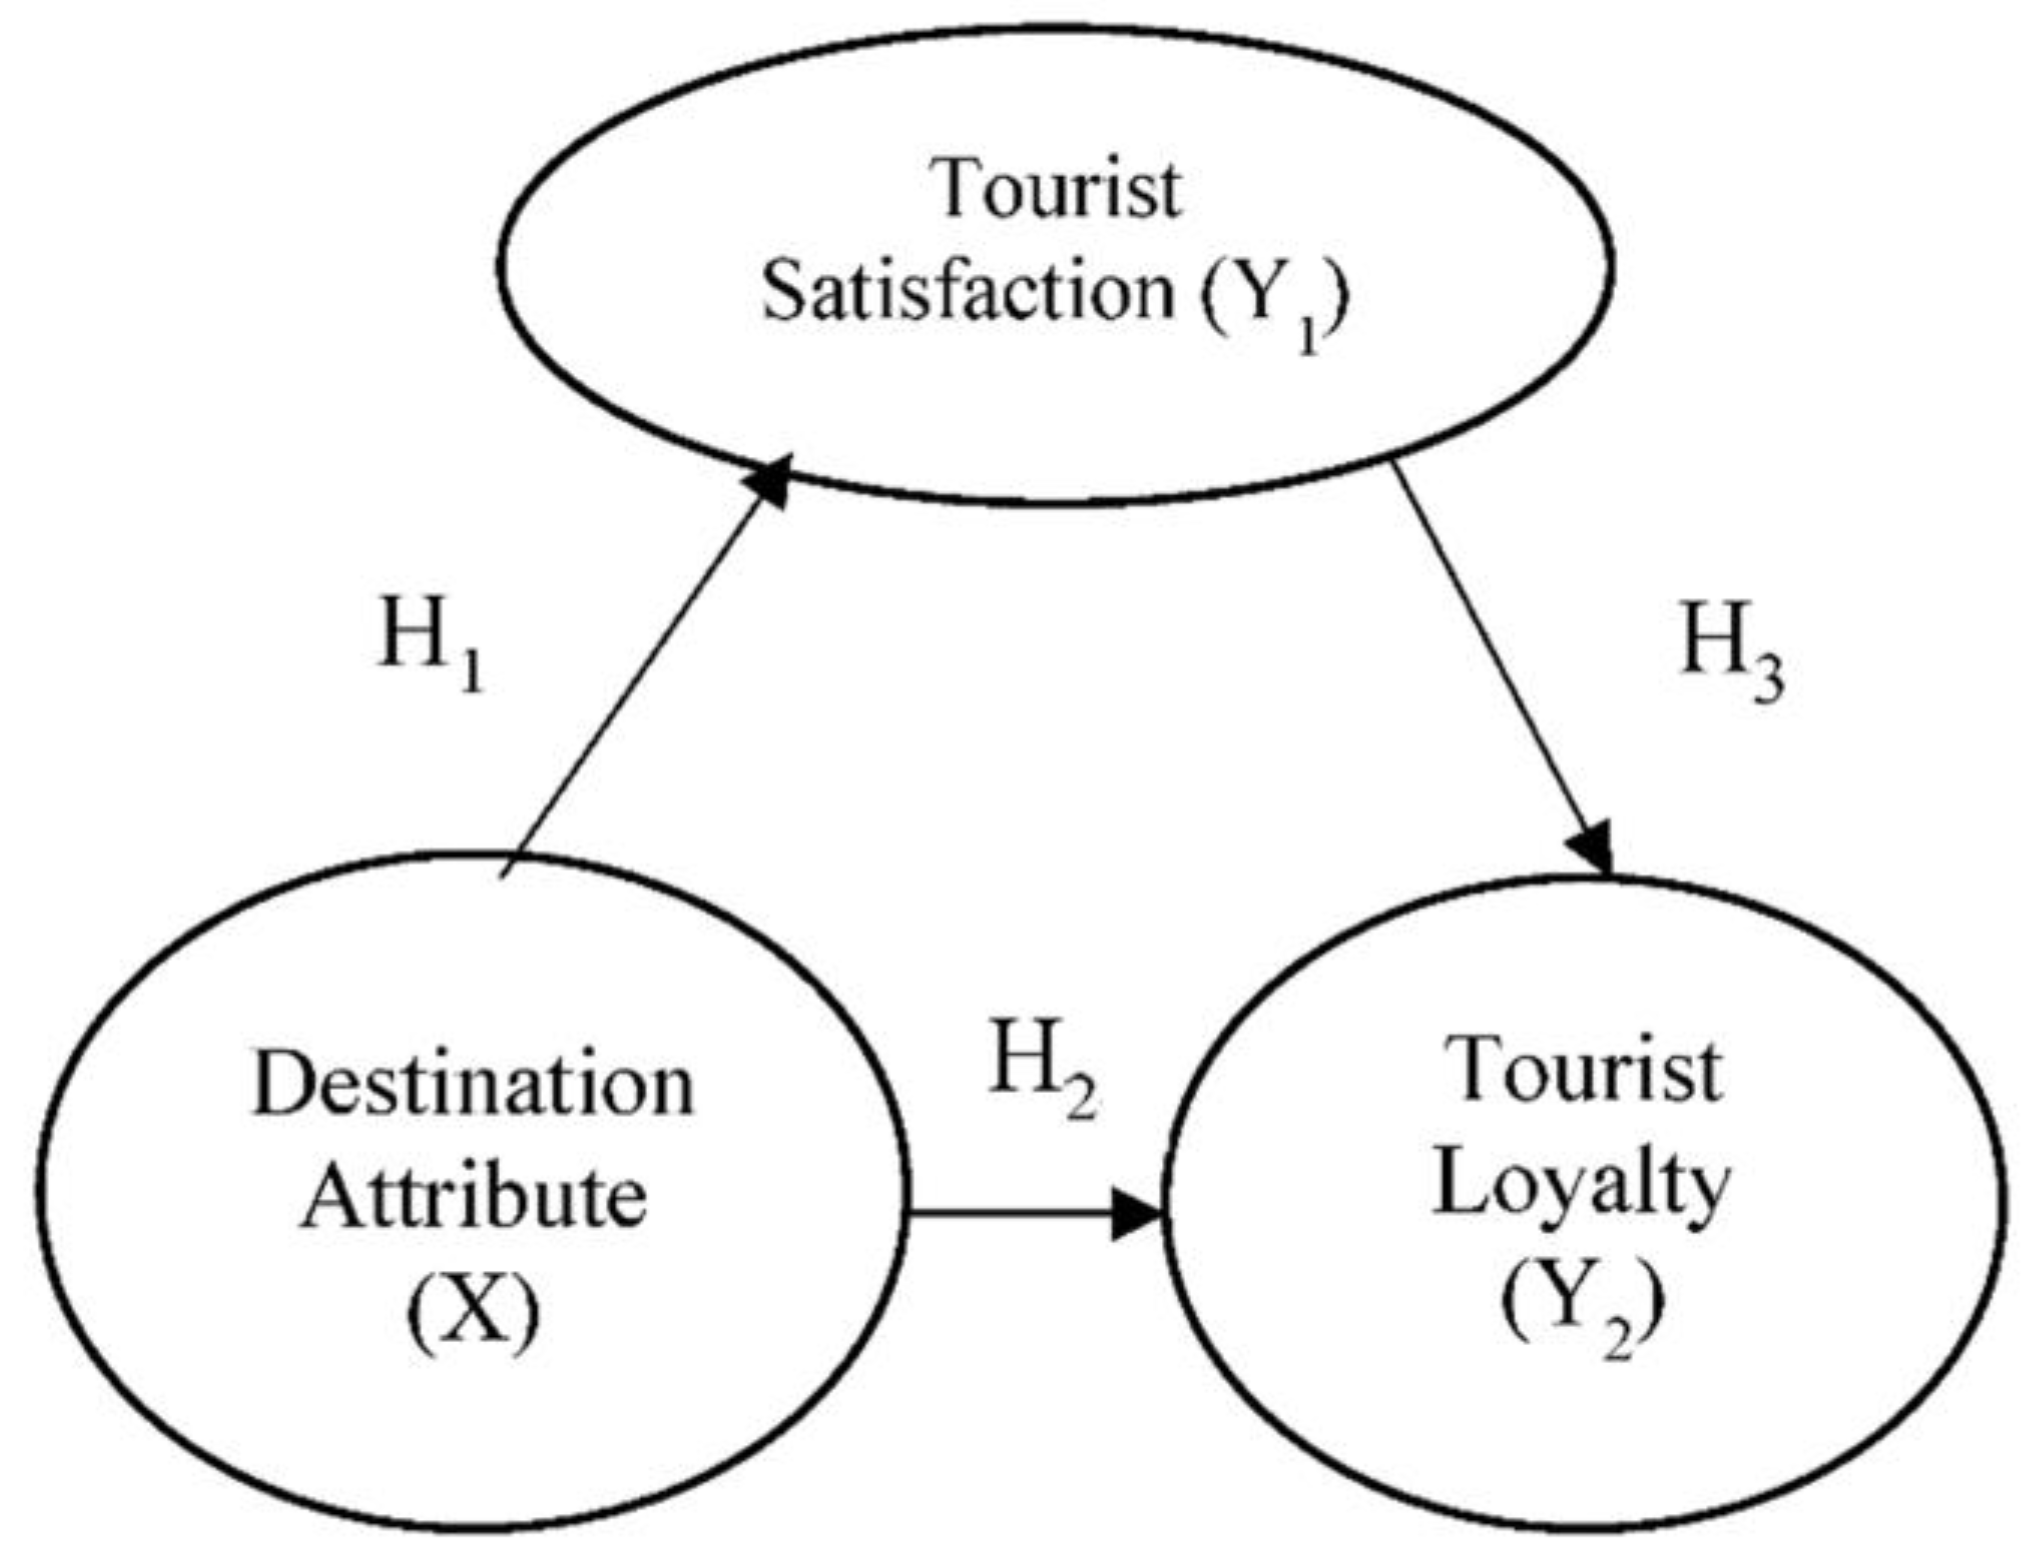
However, when considering the number of tourist arrivals, this is still not optimal. Data from Statistics Indonesia Bureau (2021) stated that in 2020, Pramuka Island was only ranked 4th (fourth), with a total of 23,149 domestic tourists, after Pari Island, with 30,531 visitors, Untung Jawa Island with 28,965 visitors, and Tidung Island with 28,842 visitors. So based on these data, it is necessary to analyze again destination attributes and factors that can affect tourist loyalty and the desire of tourists to visit Pramuka Island. Specifically, the objectives of this study were (1) to determine the effect of destination attributes on tourist satisfaction with Pramuka Island; (2) to analyze the effect of destination attributes on tourist loyalty toward Pramuka Island; and (3) to analyze the effect of tourist satisfaction on tourist loyalty toward Pramuka Island.

2. Literature Review

2.1. Tourist Destination Attributes

According to [11], tourism is the activity of traveling to obtain satisfaction, relieve fatigue, improve health, perform a pilgrimage, or fulfill a task. Moreover, according to [12], tourism is a human activity that is carried out consciously to obtain services by people within the country of origin itself or abroad and to seek and obtain satisfaction through new experiences.
Based on Undang-Undang Republik Indonesia Nomor 10 Tahun 2009, a tourist destination or tourism destination is a geographical area that is in one or more administrative areas and in which there are tourist attractions, public facilities, tourism facilities, accessibility, and communities that are interrelated and complement the realization of tourism. A destination is a characterized by its uniqueness, according to [13,14], who described the destination attributes as a collection of various destination components, which include not only the physical and natural environment but also services and facilities, which attract tourists. Furthermore, ref. [14] also emphasized that the attributes of destinations that can attract tourists are local culture or history, special activities and events, hospitality, infrastructure, destination management, accessibility, service quality, physiography, and superstructure and shopping quality.

2.2. Tourist Satisfaction

Ref [15] defined satisfaction as a person’s feeling of pleasure or disappointment that arises after comparing two perceptions, the performance of a product and the consumer expectations. In this case, a performance that meets consumer expectations will create satisfaction. This is the key to testing consumer loyalty. Conversely, a performance that is below consumer expectations will lead to consumer dissatisfaction [16]. In tourism activities, tourists seek satisfaction from the benefits of tourism. Further, tourists will make return visits and recommend a destination to others based on their satisfaction with various aspects, such as natural attractions, historical attractions, lodging, and accessibility [17].

2.3. Tourist Loyalty

Loyalty can be interpreted as someone’s loyalty to a product, both goods and certain services [18]. Customer loyalty, in this case, can be in the form of purchases or repeat visits, positive attitudes, long-term commitments, intentions to continue as affiliates, and positive word of mouth [19]. One of the main advantages of loyal customers is the guaranteed increase in profits due to repeat purchases or visits. Along with it, by spreading positive word-of-mouth advertising, loyal customers can play a role in influencing the destination preferences of potential tourists [20].

2.4. Hypothesis Model

Based on the theories above, this research’s conceptual framework describes the relationship between the independent variable and the dependent variable. The following hypothesis model (Figure 1) was considered in this study:
H1. 
There is an interaction between destination attributes and tourist satisfaction.
H2. 
There is an interaction between destination attributes and tourist loyalty.
H3. 
There is an interaction between tourist satisfaction and tourist loyalty.

3. Methods

This research was conducted from April to July 2022. The location of the research was determined purposively with the consideration that Pramuka Island is one of the islands as well as the district capital of the Thousand Islands. The sample examined consisted of 50 people who had visited Pramuka Island. The research was conducted with a quantitative approach. Data collection was carried out through questionnaires distributed via a google form; data analysis was performed taking into the literature studies related to the research topic. The variables in this study were measured using a Likert scale [21]. The Likert scale provided a score, as shown in Table 1.
Furthermore, the data from the questionnaire results were tabulated and analyzed using the SPSS (Statistical Product and Service Solution) version 26. A simple linear regression analysis technique was used in this study to test the contribution of the variables.

4. Results

4.1. Respondents Overview

In this research, the characteristics of the respondents included gender, age, place of residence, frequency of the visits, sources of information related to Pramuka Island, and the main purpose of visiting Pramuka Island. The characteristics of the respondents are described in Table 2, Table 3, Table 4, Table 5, Table 6 and Table 7.
Of the 50 respondents studied, 32 were male (64%), and 18 were female (26%).
There were 24 respondents (48%) aged 17–24 years, 8 respondents (16%) aged 25–32 years, 15 respondents (30%) aged 33–40 years, and 3 respondents (6%) older than 41 years.
Regarding the place of residence, 46 respondents (92%) lived in Jakarta and its surroundings, 3 respondents (6%) lived in Tegal, and 1 respondent (2%) lived in Yogyakarta.
Regarding the frequency of the visits, 36 respondents (72%) visited Pramuka Island 1–2 times, 4 respondents (8%) visited it 3–4 times, and 10 respondents (20%) visited it more than 5 times.
As regards the information sources, 21 respondents (42%) knew Pramuka Island from the social media, such as Google, Facebook, Instagram, and Youtube. Another 29 respondents (58%) knew about Pramuka Island from family, friends, or relatives.

4.2. Validity Test Results

The validity test was carried out by comparing the value of rcount with the critical r item correlation, which was 0.3. If the rcount is greater than the critical r item correlation, then the item or question on the questionnaire is declared valid. Based on the results in the table, the results for the indicators for all questions were rcount > rtable (0.3); therefore, the whole questionnaire was valid.

4.3. Reliability Test Results

A questionnaire is said to be reliable if a person’s answer to a question is consistent or stable over time. Furthermore, a variable is said to be reliable if it gives a Cronbach’s Alpha value of 0.70. The following (Table 8) are the results of the reliability test for each variable.
The results above indicated that a person’s answers to the questionnaire were very reliable, with a Cronbach’s Alpha greater than 0.70, corresponding to a high level of reliability.

4.4. Interpretation of the Linear Regression

The following (Table 9 and Table 10) are the results of a simple linear regression analysis performed in this study.
The table above can be described as follows:
Y1 = 0.157X
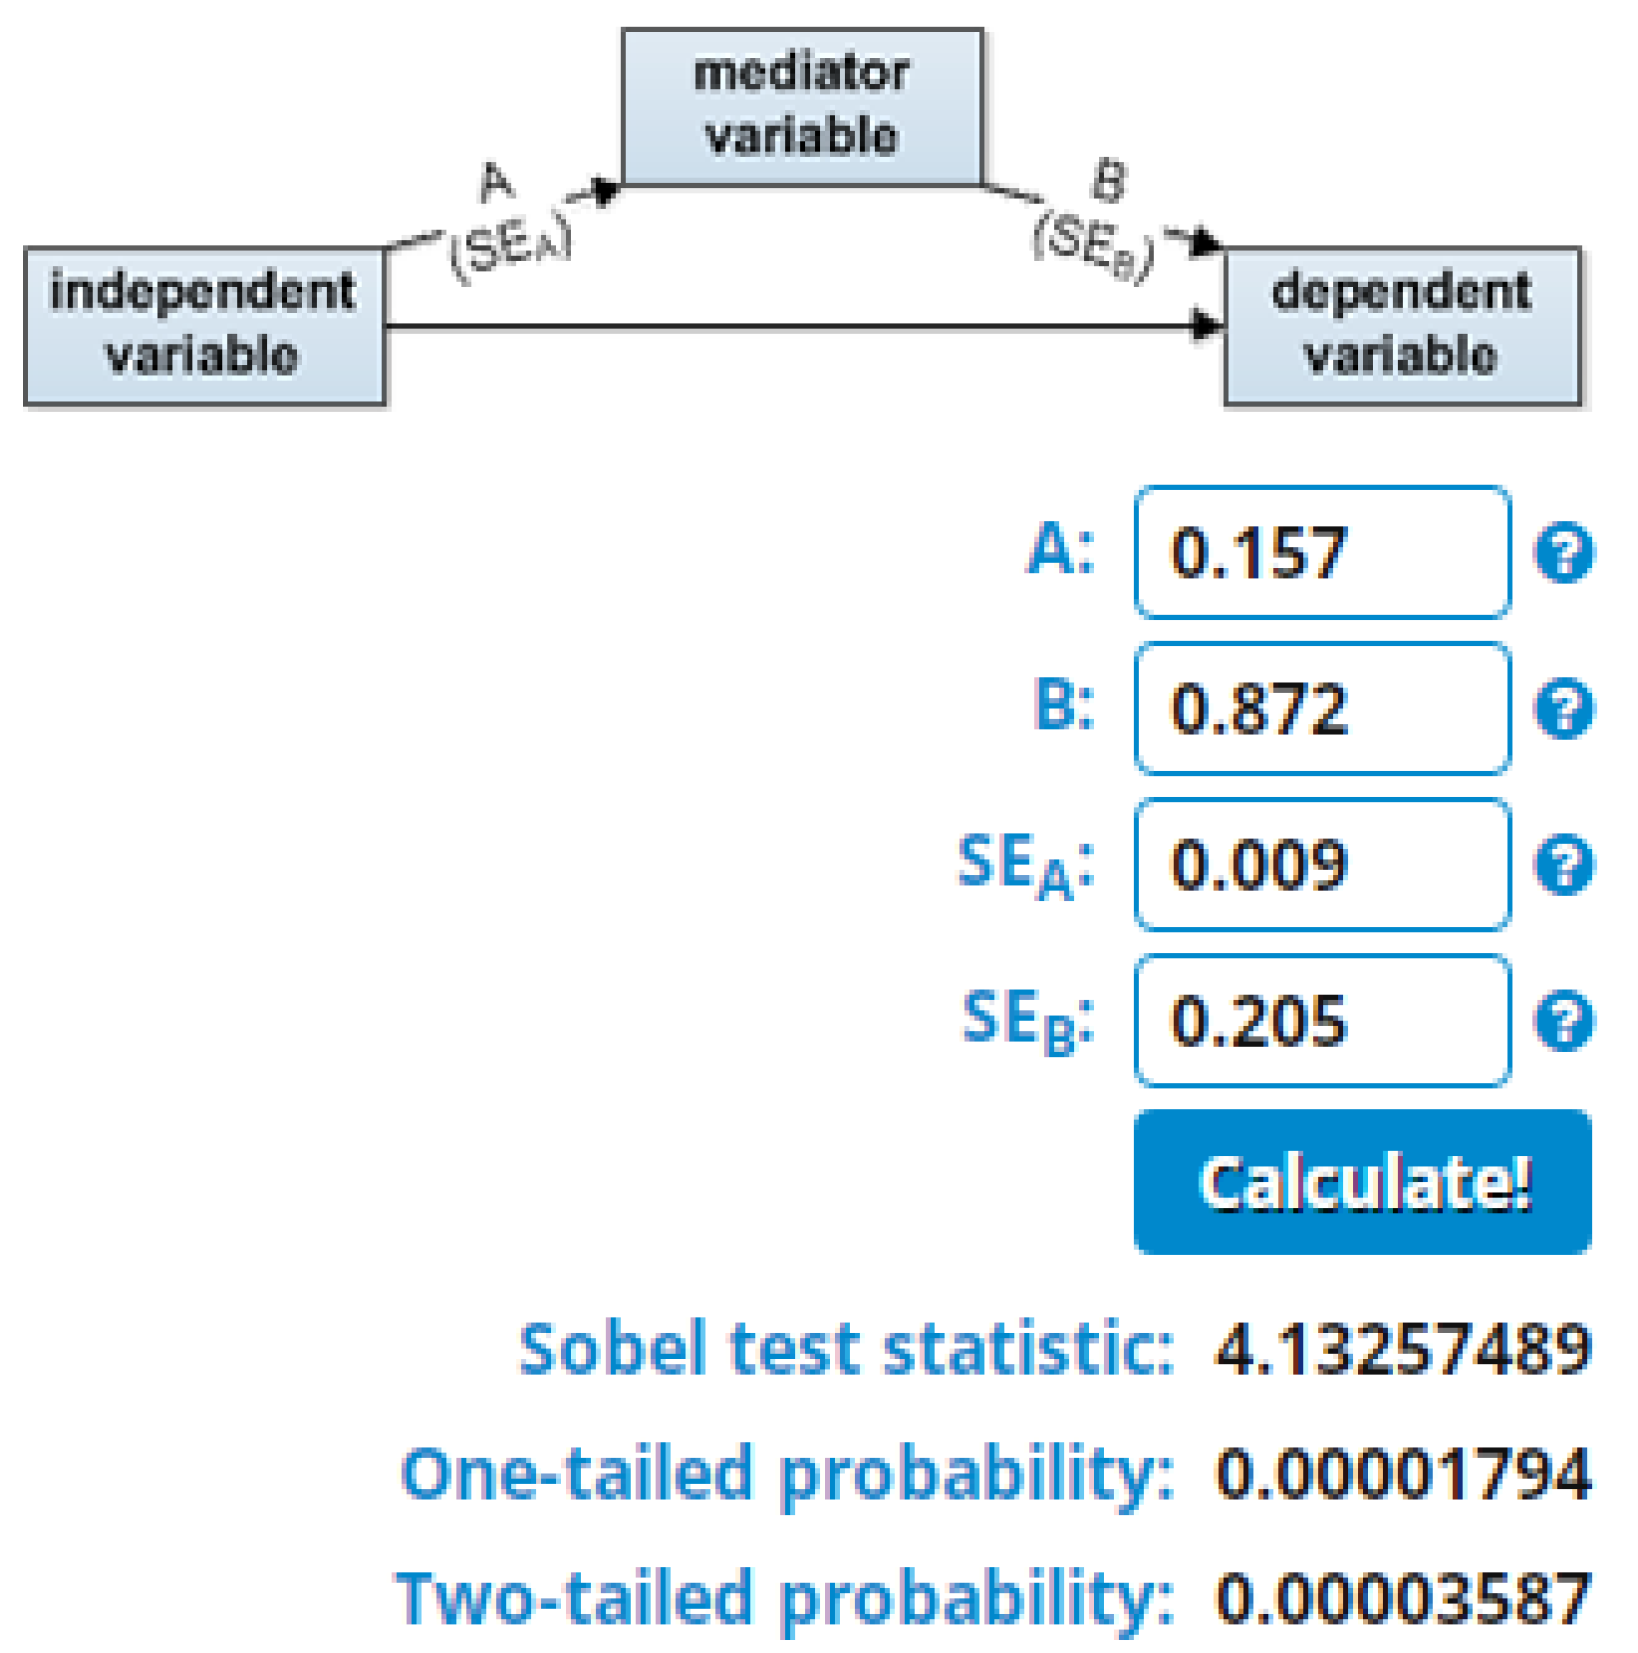
In the regression equation, the coefficient value for the destination attribute variable was 0.157, meaning that if there were an increase of one point with the assumption that other variables remained zero in value and fixed, then tourist satisfaction would increase by 0.136 points.
The table above can be described as follows:
Y = 0.136X + 0.872Y1
In the regression equation,:
  • The coefficient value of the destination attribute variable was 0.136, meaning that if there were an increase of one point assuming other variables were zero and fixed, then tourist loyalty would increase by 0.136 points.
  • The coefficient value of the tourist satisfaction variable was 0.872, meaning that if there were an increase of one point with the assumption that other variables were zero and fixed, tourist loyalty would increase by 0.872 points.

4.5. Hypothesis Test Results

Based on Table 9 and Table 10, the results of the T-test can be described, as follows:
  • H1. For the influence of the destination attributes on tourist satisfaction, we obtained a p-value of 0.000, i.e., <0.05, and a tcount of 17.486, i.e., >tTable of 2.008. Therefore, it can be said that the hypothesis was accepted, meaning that we found a positive and significant influence of the destination attribute variable (X) on tourist satisfaction (Y1).
  • H2. For the influence of the destination attributes on consumer loyalty, we obtained a p-value of 0.000, i.e., <0.05, and a tcount of 3.932, i.e., >tTable of 2.008. Therefore, it can be said that the hypothesis was accepted, meaning that we found a positive and significant influence of the destination attribute variable (X) on tourist loyalty (Y2).
  • H3. For the influence of tourist satisfaction on tourist loyalty, we obtained a p-value of 0.000, i.e., <0.05, a and tcount of 4.258, i.e., >tTable of 2.008. Therefore, it can be said that the hypothesis was accepted, meaning that we found a positive and significant influence of the variable of tourist satisfaction (Y1) on tourist loyalty (Y2).

4.6. Mediation Analysis Results

Based on the results of the calculations using the Sobel Test calculator (Figure 2), the tcount value was 4.133, i.e., >tTable of 2.008; therefore, the hypothesis stating that tourist satisfaction can be positive and significant mediator between destination attributes and tourist loyalty was proven.

4.7. Model Accuracy

The coefficient of determination test is used to describe the percentage of influence of the independent variables on the dependent variable.
The model results were obtained from the correlation coefficient of determination (R2), as follows (Table 11). The magnitude of the influence of the destination attributes and tourist satisfaction on tourist loyalty was indicated by the adjusted r square value of 0.906, meaning that 90.6% of tourist loyalty could be described by the destination attribute variables and by tourist satisfaction, and the remaining 9.4% was described by other variables not considered in this study.

5. Discussion

5.1. Influence of the Destination Attributes (X) on Tourist Satisfaction (Y1)

The results of our hypothesis testing using a simple linear regression analysis indicated that the destination attributes variable directly had a positive and significant effect on the tourist satisfaction variable. Based on these results, it can be concluded that tourist satisfaction can be obtained with positive destination attributes. Tourists who feel the completeness of the facilities in a destination, in this case, Pramuka Island, will certainly be highly satisfied. Conversely, if the available facilities are incomplete or minimal, then satisfaction will be low or negative. The influence of the destination attributes (X) on tourist satisfaction (Y1) is also supported by the sources of tourist information, which mention them as reasons for visiting a certain place. Based on the results of the questionnaire, the respondents knew about Pramuka Island through word-of-mouth information from family, friends, or relatives. Furthermore, this information was the reason or motivation encouraging the respondents to travel to Pramuka Island.

5.2. Influence of Destination Attributes (X) on Tourist Loyalty (Y2)

The simple linear regression analysis showed that the destination attributes variable had a direct and significant positive effect on the variable of tourist loyalty. This indicated that tourists see Pramuka Island positively as a marine tourist destination in the Thousand Islands and even DKI Jakarta. In this case, Pramuka Island already has tourism elements, such as tourist attractions, public facilities, tourism facilities and easy accessibility, which increase tourists’ trust, so that tourists will recommend this destination to others. Tourists’ loyalty to Pramuka Island can be seen in the results of the questionnaire, indicating that 10 respondents, or 20% of the participants, visited Pramuka island more than 5 times. This showed that the respondents thought that Pramuka Island is a tourist destination that is worth visiting, especially for family recreation or vacationing with friends.

5.3. Influence of Tourist Satisfaction (Y1) on Tourist Loyalty (Y2)

This study also showed that a positive and significant influence of tourist satisfaction on tourist loyalty. It is known that tourists who are satisfied with tourism destinations and services will tend to be loyal and make repeat purchases. This study suggests that the higher the satisfaction of tourists with tourism destinations, the higher the level of tourist loyalty.

6. Conclusions

Based on the results of the analysis and the discussion, conclusions can be drawn, as follows:
  • The destination attributes variable has a direct positive and significant effect on tourist satisfaction.
  • The destination attribute variable directly has a positive and significant effect on tourist loyalty.
  • The variable of tourist satisfaction has a direct positive and significant effect on tourist loyalty.
  • Tourist satisfaction can be a positive and significant mediator between destination attributes and tourist loyalty.
It is hoped that in the future researchers will be able to examine Pramuka Island in the context of the standardization of marine tourism and the promotion of Pramuka Island.

Author Contributions

Conceptualization, writing original draft, A.A.; methodology, data analysis, A.A.; software and running the data analysis D.M.P.; validation, A.A. and D.M.P.; formal analysis, A.A.; investigation, A.A.; resources, A.A. and D.M.P.; writing—original draft preparation, A.A.; writing—review and editing, A.A. and D.M.P.; visualization, D.M.P.; supervision, A.A., project administration, D.M.P.; funding acquisition, A.A. All authors have read and agreed to the published version of the manuscript.

Funding

This research received no external funding.

Institutional Review Board Statement

Not applicable.

Informed Consent Statement

Not applicable.

Data Availability Statement

This research didn’t report any data.

Conflicts of Interest

The authors declare no conflict of interest.

References

  1. Badan Pusat Statistik Kepulauan Seribu. Kabupaten Kepulauan Seribu Dalam Angka. 2021. Available online: https://kepulauanseribukab.bps.go.id/publication/2021/02/26/477706d03673975e65a8fc39/kabupaten-kepulauan-seribu-dalam-angka-2021.html (accessed on 3 June 2022).
  2. Kementerian Pariwisata dan Ekonomi Kreatif. Statistik Kunjungan Wisatawan Mancanegara 2021. 2022. Available online: https://kemenparekraf.go.id/statistik-wisatawan-mancanegara/Statistik-Kunjungan-Wisatawan-Mancanegara-2021 (accessed on 13 August 2022).
  3. Vinerean, S.; Opreana, A. Tileaga CM Popsa RE. The Impact of COVID-19 Pandemic on Residents’ Support for Sustainable Tourism Development. Sustainability 2021, 13, 2541. [Google Scholar] [CrossRef]
  4. Yang, J.; Ge, Y.; Ge, Q.; Xi, J.; Li, X. Determinants of Island Tourism Development: The Example of Dachangshan Island. Tour. Manag. 2016, 55, 261–271. [Google Scholar] [CrossRef]
  5. Junaid, I.; Fauziah, A.N. The Carrying Capacity for The Development of Marine Ecotourism. Masy. Kebud. Dan Polit. 2018, 31, 190–200. [Google Scholar] [CrossRef] [Green Version]
  6. Fadilla, D.N.; Darmawan, F. Pengembangan Aksesibilitas Transportasi Pariwisata Pulau Pramuka Kepulauan Seribu. J. Tour. Destin. Attract. 2018, 6, 1–15. [Google Scholar] [CrossRef]
  7. Mira, K.T. Carrying Capacity of Small Island for Tourism Development. IOP Conf. Ser. Earth Environ. Sci. 2020, 548, 1–10. [Google Scholar] [CrossRef]
  8. Mariana, S.; Baskara, T.U.N.; Susdiyanti, T. Kajian Pengembangan dan Pengelolaan Ekowisata Bahari di Pulau Pramuka Taman Nasional Kepulauan Seribu. J. Nusa Sylva 2019, 13, 48–55. Available online: https://core.ac.uk/download/pdf/230824697.pdf (accessed on 13 August 2022).
  9. Hanif, A.; Kusumawati, A.; Mawardi, M.K. Pengaruh Citra Destinasi terhadap Kepuasan Wisatawan serta Dampaknya terhadap Loyalitas Wisatawan (Studi pada Wisatawan Nusantara yang Berkunjung ke Kota Batu). J. Adm. Bisnis 2016, 38, 44–52. Available online: http://administrasibisnis.studentjournal.ub.ac.id/index.php/jab/article/view/1480 (accessed on 13 August 2022).
  10. Muzani, M.; Purwindiyanto, A.P.A.; Meylani, E.M.E.; Andika, R.A.R.; Nurfadilah, R.N.R. Potensi Taman Mangrove Pulau Pramuka sebagai Destinasi Edutourism. J. Hutan Trop. 2020, 8, 348–356. [Google Scholar] [CrossRef]
  11. Sari, F.K.; Safitri, N.; Anggraini, W. Persepsi, Sikap dan Minat Pariwisata Halal di Daerah Istimewa Yogyakarta. Ihtifaz J. Islam. Econ. Financ. Bank. 2019, 2, 137–155. [Google Scholar] [CrossRef] [Green Version]
  12. Ridwan, M.; Aini, W. Perencanaan Pengembangan Daerah Tujuan Pariwisata; Deepublish: Yogyakarta, Indonesia, 2019. [Google Scholar]
  13. Republik Indonesia. Undang-Undang Nomor 10 Tahun 2009 Tentang Kepariwisataan. Available online: https://peraturan.bpk.go.id/Home/Details/38598/uu-no-10-tahun-2009 (accessed on 13 August 2022).
  14. Moon, H.G.; Han, H. Destination Attributes Influencing Chinese Travelers’ Perceptions of Experience Quality and Intentions for Island Tourism: A Case of Jeju Island. Tour. Manag. Perspect. 2018, 28, 71–82. [Google Scholar] [CrossRef]
  15. Kotler, P. Manajemen Pemasaran, Edisi Kesebelas ed; Indeks Kelompok Gramedia: Jakarta, Indonesia, 2013. [Google Scholar]
  16. Adinegara, G.N.J. Anteseden dan Konsekuensi Kepuasan Wisatawan yang Berkunjung; Deepublish: Yogyakarta, Indonesia, 2022. [Google Scholar]
  17. Elvera. Pemasaran Pariwisata: Kepuasan dan Loyalitas Wisatawan; PT Scopindo Media Pustaka: Surabaya, Indonesia, 2020. [Google Scholar]
  18. Fatihudin, D.; Firmansyah, M.A. Pemasaran Jasa: Strategi, Mengukur Kepuasan dan Loyalitas Pelanggan; Deepublish: Yogyakarta, Indonesia, 2019. [Google Scholar]
  19. Sramek, B.D.; Stank, T.P.; Mentzer, J.T. Creating Customer Durable Retailer Customer Loyalty Through Order Fulfillment Service Operations. J. Oper. Manag. 2008, 26, 781–797. [Google Scholar] [CrossRef]
  20. Artuger, S.; Cetinsoz, B.C.; Kilic, I. The Effect of Destination Image on Destination Loyalty: An Application in Alanya. Eur. J. Bus. Manag. 2013, 5, 124–136. [Google Scholar]
  21. Sugiyono. Metode Penelitian Kuantitatif Kualitatif dan R&D; Alfabeta: Bandung, Indonesia, 2011. [Google Scholar]
Figure 1. Hypothesis Model.
Proceedings 83 00028 g001
Figure 2. Sobel Test. Source: Processed Primary Data (2022).
Proceedings 83 00028 g002
Table 1. Likert scale instrument.
NoQuestionScore
1Strongly Agree5
2Agree4
3Undecided3
4Disagree2
5Strongly Disagree1
Source: Sugiyono (2011).
Table 2. Respondents’ Gender.
SexFrequency (Person)Percent
Male3264%
Female1836%
Total50100%
Source: Processed Primary Data (2022).
Table 3. Respondents’ Age.
AgeFrequency (Person)Percent
17–242448%
25–32816%
33–401530%
>4136%
Total50100%
Source: Processed Primary Data (2022).
Table 4. Respondents’ Residence.
StayFrequency (Person)Percent
JKT4692%
TGL36%
DIY12%
Total50100%
Source: Processed Primary Data (2022).
Table 5. Respondents’ Visit Frequency.
TimeFrequency (Person)Percent
1–23672%
3–448%
>51020%
Total50100%
Source: Processed Primary Data (2022).
Table 6. Respondents’ Information Sources.
SourceFrequency (Person)Percent
Media2142%
Etc2958%
Total50100%
Source: Processed Primary Data (2022).
Table 7. Respondents’ Main Purpose.
PurposeFrequency (Person)Percent
Recreation1734%
Holiday2550%
School24%
Office612%
Total50100%
Source: Processed Primary Data (2022).
Table 8. Reliability Test.
VariableCronbach’s Alpha≥0.70
AD0.978≥0.70
KW0.943≥0.70
LW0.970≥0.70
Source: Processed Primary Data (2022).
Table 9. Regression I Test and T Test.
Coefficients a
ModelUnstandardized CoefficientsStandardized CoefficientstSig.
BStd. ErrorBeta
1(Constant)−0.5430.752 −0.7220.474
Destination attribute (X)0.1570.0090.93017.4860.000
Source: Processed Primary Data (2022). a Dependent Variable: tourist satisfaction (Y1).
Table 10. Regression II Test and T Test.
Coefficients a
ModelUnstandardized CoefficientsStandardized CoefficientstSig.Collinearity Statistics
BStd. ErrorBetaToleranceVIF
1(Constant)−1.0061.073 −0.9380.353
destination attribute (X)0.1360.0350.4663.9320.0000.1367.370
tourist satisfaction (Y1)0.8720.2050.5054.2580.0000.1367.370
Source: Processed Primary Data (2022). a Dependent Variable: tourist loyalty (Y2).
Table 11. Coefficient of Determination.
Model Summary b
ModelRR SquareAdjusted R SquareStd. Error of the EstimateDurbin-Watson
10.954 a0.9100.9061.4731.819
Source: Processed Primary Data (2022). a Predictors: (Constant), tourist satisfaction (Y1), destination attribute (X); b Dependent Variable: tourist loyalty (Y2).
Disclaimer/Publisher’s Note: The statements, opinions and data contained in all publications are solely those of the individual author(s) and contributor(s) and not of MDPI and/or the editor(s). MDPI and/or the editor(s) disclaim responsibility for any injury to people or property resulting from any ideas, methods, instructions or products referred to in the content.

