Article

Influence of Soil Type and Temperature on Nitrogen Mineralization from Organic Fertilizers

by
Hanna Ibiapina de Jesus
1,
Kate Cassity-Duffey
2,
Bhabesh Dutta
3,
Andre Luiz Biscaia Ribeiro da Silva
4 and
Timothy Coolong
2,*
1
Department of Horticultural Sciences, University of Florida, Fifield Hall, 2550 Hull Road, Gainesville, FL 32611, USA
2
Department of Horticulture, University of Georgia, 1111 Miller Plant Sciences, Athens, GA 30602, USA
3
Department of Plant Pathology, University of Georgia, 2360 Rainwater Rd., Tifton, GA 31793, USA
4
Department of Horticulture, Auburn University, 124 Funchess Hall, Auburn, AL 36849, USA
*
Author to whom correspondence should be addressed.
Nitrogen 2024, 5(1), 47-61; https://doi.org/10.3390/nitrogen5010004
Submission received: 2 January 2024 / Revised: 16 January 2024 / Accepted: 19 January 2024 / Published: 24 January 2024

Abstract

:
Organic vegetable producers in Georgia, USA, utilize a range of amendments to supply nitrogen (N) for crop production. However, differences in soil type, fertilizers and environmental conditions can result in variability in N mineralization rates among commonly utilized organic fertilizers in the region. In this study, the effects of temperature on N mineralization from three commercial organic fertilizers [feather meal (FM), pelleted poultry litter (PPL) and a mixed organic fertilizer (MIX)] in two soil types from Georgia, USA (Cecil sandy clay loam and Tifton loamy sand) were evaluated for 120 d. Net N mineralization (Net Nmin) varied with soil type, fertilizer and temperature. After 120 d, Net Nmin from the FM fertilizer ranged between 41% and 77% of total organic N applied, the MIX fertilizer ranged between 26% and 59% and the PPL fertilizer ranged between 0% and 22% across all soil types and temperatures. Incubation at higher temperatures (20 °C and 30 °C) impacted Net Nmin of FM fertilizer in the Tifton series soil. Temperature and soil type had a relatively minor impact on the potentially mineralizable N of the PPL and MIX fertilizers after 120 d of incubation; however, both factors impacted the rate of fertilizer release shortly after application, which could impact the synchronicity of N availability and plant uptake. Temperature-related differences in the mineralization of organic fertilizers may not be large enough to influence a grower’s decisions regarding N fertilizer inputs for vegetable crop production in the two soils. However, organic fertilizer source will likely play a significant role in N availability during the cropping season.

1. Introduction

Continued growth in certified organic vegetable production in the USA [1] has led to increased demand for alternatives to chemical fertilizers for plant nutritional needs. A range of organic materials are commonly used in agricultural systems to supply plant-available nitrogen (N), including cover crop residues, composts, manures and commercial organic fertilizers derived from various animal or plant sources [2,3]. However, unlike readily soluble synthetic fertilizers, the availability of nutrients from organic amendments and fertilizers can be highly variable [4]. Organic fertilizers may include some readily available inorganic N, ammonium (NH4) and nitrate (NO3), but the majority of N present is in the organic form and must undergo N mineralization to supply plant-available nitrogen during the growing season [5]. Failure to coordinate the timing of N release from organic fertilizers with the nutritional demands of crops may result in N loss and reduced productivity. Thus, it is important to accurately predict N mineralization rates from organic fertilizers and evaluate what factors may impact mineralization [6,7,8].
Organic fertilizers differ widely in physiochemical characteristics, and N mineralization rates can vary depending on these physiochemical properties. Total particle size, total N concentration, initial inorganic N levels and carbon to nitrogen (C:N) ratio can all affect the N mineralization of organic fertilizers [5,6,7,8,9,10]. In vitro incubation and field-based studies have shown that net N mineralization (Net Nmin) among different organic fertilizers can vary between 20% to 93% of the total N applied [5,11,12,13]. However, the physiochemical characteristics of the materials themselves do not explain all the variability observed in N mineralization among fertilizers, and further information is needed to properly predict N release after application [14,15].
Nitrogen release from organic fertilizers has also been shown to be impacted by environmental conditions and the properties of the soils to which they are applied [14]. Microorganisms in the soil promote N mineralization through enzymatic reactions, which are primarily controlled by temperature and water content [16,17,18]. In general, the rate of mineralization in the soil increases with temperature up to a maximum and then declines [11,19,20]. Therefore, the season in which crops are planted and weather fluctuations during the season or across regions may impact the rate of N mineralization in the soil [17]. Several studies have evaluated the effects of temperature on N mineralization from soil organic matter [17,18,21,22]. However, research on N mineralization from organic fertilizers suggests that N transformations at different temperatures are likely to be dependent on a complex interaction between soil microorganisms and the mineralizable substrates in the amendment [11,23,24]. Factors such as the C:N ratio of the organic materials have been reported to be closely linked to the N mineralization of a range of organic amendments [3]. Temperature has also been shown to influence N availability, depending on material composition [14]. Studies suggest that N mineralization of high-N-containing organic materials are primarily influenced by temperature during the initial days after incorporation, whereas low-N-containing materials are more susceptible to temperature variations over an extended period [11,12,14,25].
In addition to environmental conditions, soil physical and/or chemical properties can alter the N mineralization of organic materials due to changes in the soil microbiota and the enzymatic reactions that drive the N release [10,14,26]. Further, soil type can significantly affect N mineralization [27,28,29]. In general, fine-textured soils with high clay contents have been reported to have lower N mineralization rates than coarse-textured, sandy soils, which is likely due to factors such as physical isolation of organic matter by clay particles or entrapment in small pores, where a substrate may be inaccessible to microorganisms [28,30]. Cassity-Duffey et al. [7] determined that, after 100 d of incubation, soil texture had an impact on the rate of N release but had minimal effects on total mineralizable N for two organic fertilizers, a feather meal (FM) and a pelleted fertilizer blend. Similarly, Lazicki et al. [14] found that soil texture and management history did not consistently affect total Net Nmin from 22 different organic materials but may have influenced the rate of N release. Recently, de Jesus et al. [31] reported that location (soil type and weather conditions) impacted plant N accumulation for onions (Allium cepa L.) grown with a mixed organic (MIX) and pelletized poultry litter (PPL) fertilizers. In addition to N uptake by plants, residual soil inorganic N was greater at harvest when using a MIX fertilizer compared to a PPL product. Increased N uptake and soil accumulation were also linked to increased yields for onions grown with a MIX fertilizer in some locations and years. These results suggest that N mineralization may differ between organic fertilizer source, soil type and weather conditions, ultimately impacting the yield of the crop grown [31]. Further, mineralization of organic fertilizers at soil temperatures encountered during the production of onion during winter months in the Southeastern USA (<10 °C) have not been previously studied.
Understanding the factors affecting total mineralization and the rate of N release from organic fertilizers is important to determine the rate and timing of application [32]. Models have been proposed to simulate the N release from organic soil amendments in the field, but data are lacking specific to commonly used commercial organic fertilizers [11,23,33,34,35]. Although different kinetics may be utilized to predict N availability, first-order kinetics are often used to predict the N mineralization potential (N0) from organic amendments, where the rate at which N mineralizes is assumed to be proportional to the amount of soil N available for mineralization [26,36]. An accurate estimate of N mineralization from organic fertilizers and the impact of temperature on the rate of mineralization would be a useful tool for organic vegetable growers. Thus, the objectives of this study were to determine the effects of four incubation temperatures and two soil textures on three commercially available organic fertilizers used for vegetable production in Georgia, USA through a 120 d laboratory incubation.

2. Materials and Methods

2.1. Soil and Organic Fertilizers

The soils used in this study were representative of two common agricultural soils in Georgia, USA. Soils were collected from US Department of Agriculture (USDA) certified organic land at the University of Georgia (UGA) Durham Horticulture Farm in Watkinsville, GA, USA (33°53′4.812″ N, 83°25′9.9876″ W) and at the UGA Horticulture Farm in Tifton, GA, USA (31°28′8.112″ N, 83°32′54.348″ W). The soil of the Watkinsville, GA, USA location is a Cecil sandy clay loam series (0% to 2% slope), while the Tifton, GA, USA location was a Tifton loamy sand series (2% to 5% slope) [37]. Approximately 20 kg of soil was collected from each location (0–15 cm depth) and passed through a 4-mm sieve. Soil samples were stored in 5-gallon buckets and kept aerated at room temperature prior to initiation of the incubation.
The maximum water holding capacity (WHC) of the soils was estimated through saturation and draining over a sand bath for 48 h [38,39], and was 0.25 g H2O·g−1 soil and 0.30 g H2O·g−1 soil for the Tifton and Cecil soils, respectively. Soils were analyzed for total N, total C, phosphorous (P), potassium (K), magnesium (Mg) and calcium (Ca) concentrations, pH and cation exchange capacity (CEC) at a commercial laboratory (Waters Agricultural Laboratories, Camilla, GA, USA) (Table 1).
Three commercial fertilizers, a feather meal (FM) (13N-0P-0K; Mason City By-Products, Mason City, IA, USA), a pelleted poultry litter (PPL) (5N-1.8P-2.5K; Harmony Organic Fertilizer; Environmental Products LLC, Roanoke, VA, USA) and a mixed organic fertilizer (MIX) (10N-0.88P-6.6K; All Season Organic Fertilizer; Nature Safe, Irving, TX, USA) composed of feather-meat-bone-blood meal were sourced from a commercial supply company (7 Springs Farm Supply, Check, VA, USA). The total N and C of the organic fertilizers were determined by combustion according to the AOAC 993.13 method, while NO3 and NH4 were determined by distillation using AOC 2.068 and AOC 2.065 methods, respectively, at a commercial laboratory (Waters Agricultural Laboratories, Camilla, GA, USA) (Table 2).

2.2. Laboratory Incubation Study

To determine the rate of mineralization from the three organic fertilizers, a soil incubation study was performed for 120 d. Soil was wetted to 50% of estimated maximum WHC (0.12 g H2O·g−1 soil and 0.16 g H2O·g−1 soil for the Tifton and Cecil series soils, respectively) and allowed to pre-incubate under aerobic conditions for 48 h to mitigate the initial flux mineralization that typically occurs during soil rewetting [40]. Organic fertilizers were applied to soils at a rate to supply 100 mg N·kg−1 soil, based on the fertilizer labels, and Net Nmin was later determined using the N values determined for each fertilizer by combustion (Table 2). The organic fertilizers were added to 300 g dry equivalent soil in resealable polyethylene bags (1 Quart Ziploc Freezer Bag, SC Johnson, Racine, WI, USA) and mixed thoroughly. There were 96 individual bags representing each fertilizer treatment (three fertilizers and non-treated control), two soil types and four incubation temperatures with each combination replicated three times and arranged in a split plot randomized complete block design, with incubation temperature being the main plot and fertilizer and soil type the subplots. Bags were incubated at 4, 10, 20 and 30 °C for 120 d. These temperatures are reflective of the range of soil temperatures commonly encountered during year-round field production of vegetables in the Southeastern USA. The bags were aerated, and water content maintained gravimetrically every 2 to 3 d. To determine the rate of release of inorganic N, 5 g subsamples of soil were taken at 0, 2, 4, 7, 14, 35, 56, 85 and 120 d. Subsamples were extracted with 40 mL 1 M KCl, shaken for 30 min and passed through filter paper (Whatman 42, Maidstone, Kent, UK). Prior to subsampling, soils were thoroughly mixed to ensure that fertilizers were homogenously distributed. Inorganic N was determined colorimetrically using the soil KCl extract method [41,42].

2.3. Mineralization Kinetics and Statistics

Cumulative Net N mineralized was calculated for the control soils (unamended), where:
C o n t r o l   N e t   N m i n = I n o r g a n i c   N t = x I n o r g a n i c   N   C o n t r o l t = 0
Cumulative Net N mineralized (Net Nmin) from the materials was calculated, where:
Net   N min = Inorganic   N t = x Inorganic   N   Control t = x Inorganic   N   of   Material t = 0
where Net Nmin from the fertilizers (mg inorganic N·kg¹ dry material) was calculated as a function of the inorganic N at measured each time (t) point, the initial ammonium and nitrate present at time 0, and the N mineralization measured from the control soil (control Net Nmin). Net Nmin was calculated as a percentage of total organic N applied from each fertilizer. The Net Nmin values for each time of incubation were analyzed using the ANOVA method by least-squares fit using JMP Pro 16.0 (SAS Institute Inc., Cary, NC, USA). Soil type, fertilizer treatment and temperature were treated as fixed effects, and replication was treated as a random effect. When statistically significant differences existed according to ANOVA (p < 0.05), mean separation was performed with Tukey’s test at α = 0.05.
To determine the N mineralization kinetics the Net Nmin (mg inorganic N·kg¹ dry fertilizer) was fit to first-order kinetics using a non-linear model:
Net   N min = N 0 1 e k t
where N0 is the potentially mineralizable pool of N predicted from the model, k is the rate coefficient of net N mineralization (mg inorganic N·kg−1·d−1) and t is time (days) [5,36]. The iterations for N0 and k calculations and curve fitting of equations were carried out using a non-linear method with the G-Newton iteration using JMP Pro 16.0 (SAS Institute Inc., Cary, NC, USA). The performance of the fit of Net Nmin modeled versus measured data was evaluated using the root mean squared error (RMSE), ratio of the RMSE to the standard deviation of measured data (RSR), Nash–Sutcliffe efficiency (NSE) and Percent bias (PBias). The RMSE is a commonly used error index statistics that quantifies the average magnitude of errors between predicted values and observed values [43,44,45]. A lower RMSE indicates a better model fit:
R M S E = i = 1 n ( O i P i ) 2 n
The RSR is another way to assess the goodness of fit. The RSR standardizes RMSE by considering standard deviation of the observed data [43].
The NSE assesses the deviation between model predictions and observed values relative to the scattering of the observed data [43]. It ranges from negative infinity to 1, where an NSE of 1 indicates a perfect fit:
N S E = 1 i = 1 n ( O i P i ) 2 i = 1 n ( O i O ¯ ) 2
The PBias quantifies the systematic error or bias in a model’s predictions by calculating the average difference between predicted and observed values. If the model underestimates, on average, the PBias is positive; conversely, if the model overestimates, on the average, the PBias is negative:
P B I A S = i = 1 n O i P i 2 × ( 100 ) i = 1 n ( O i )

3. Results and Discussion

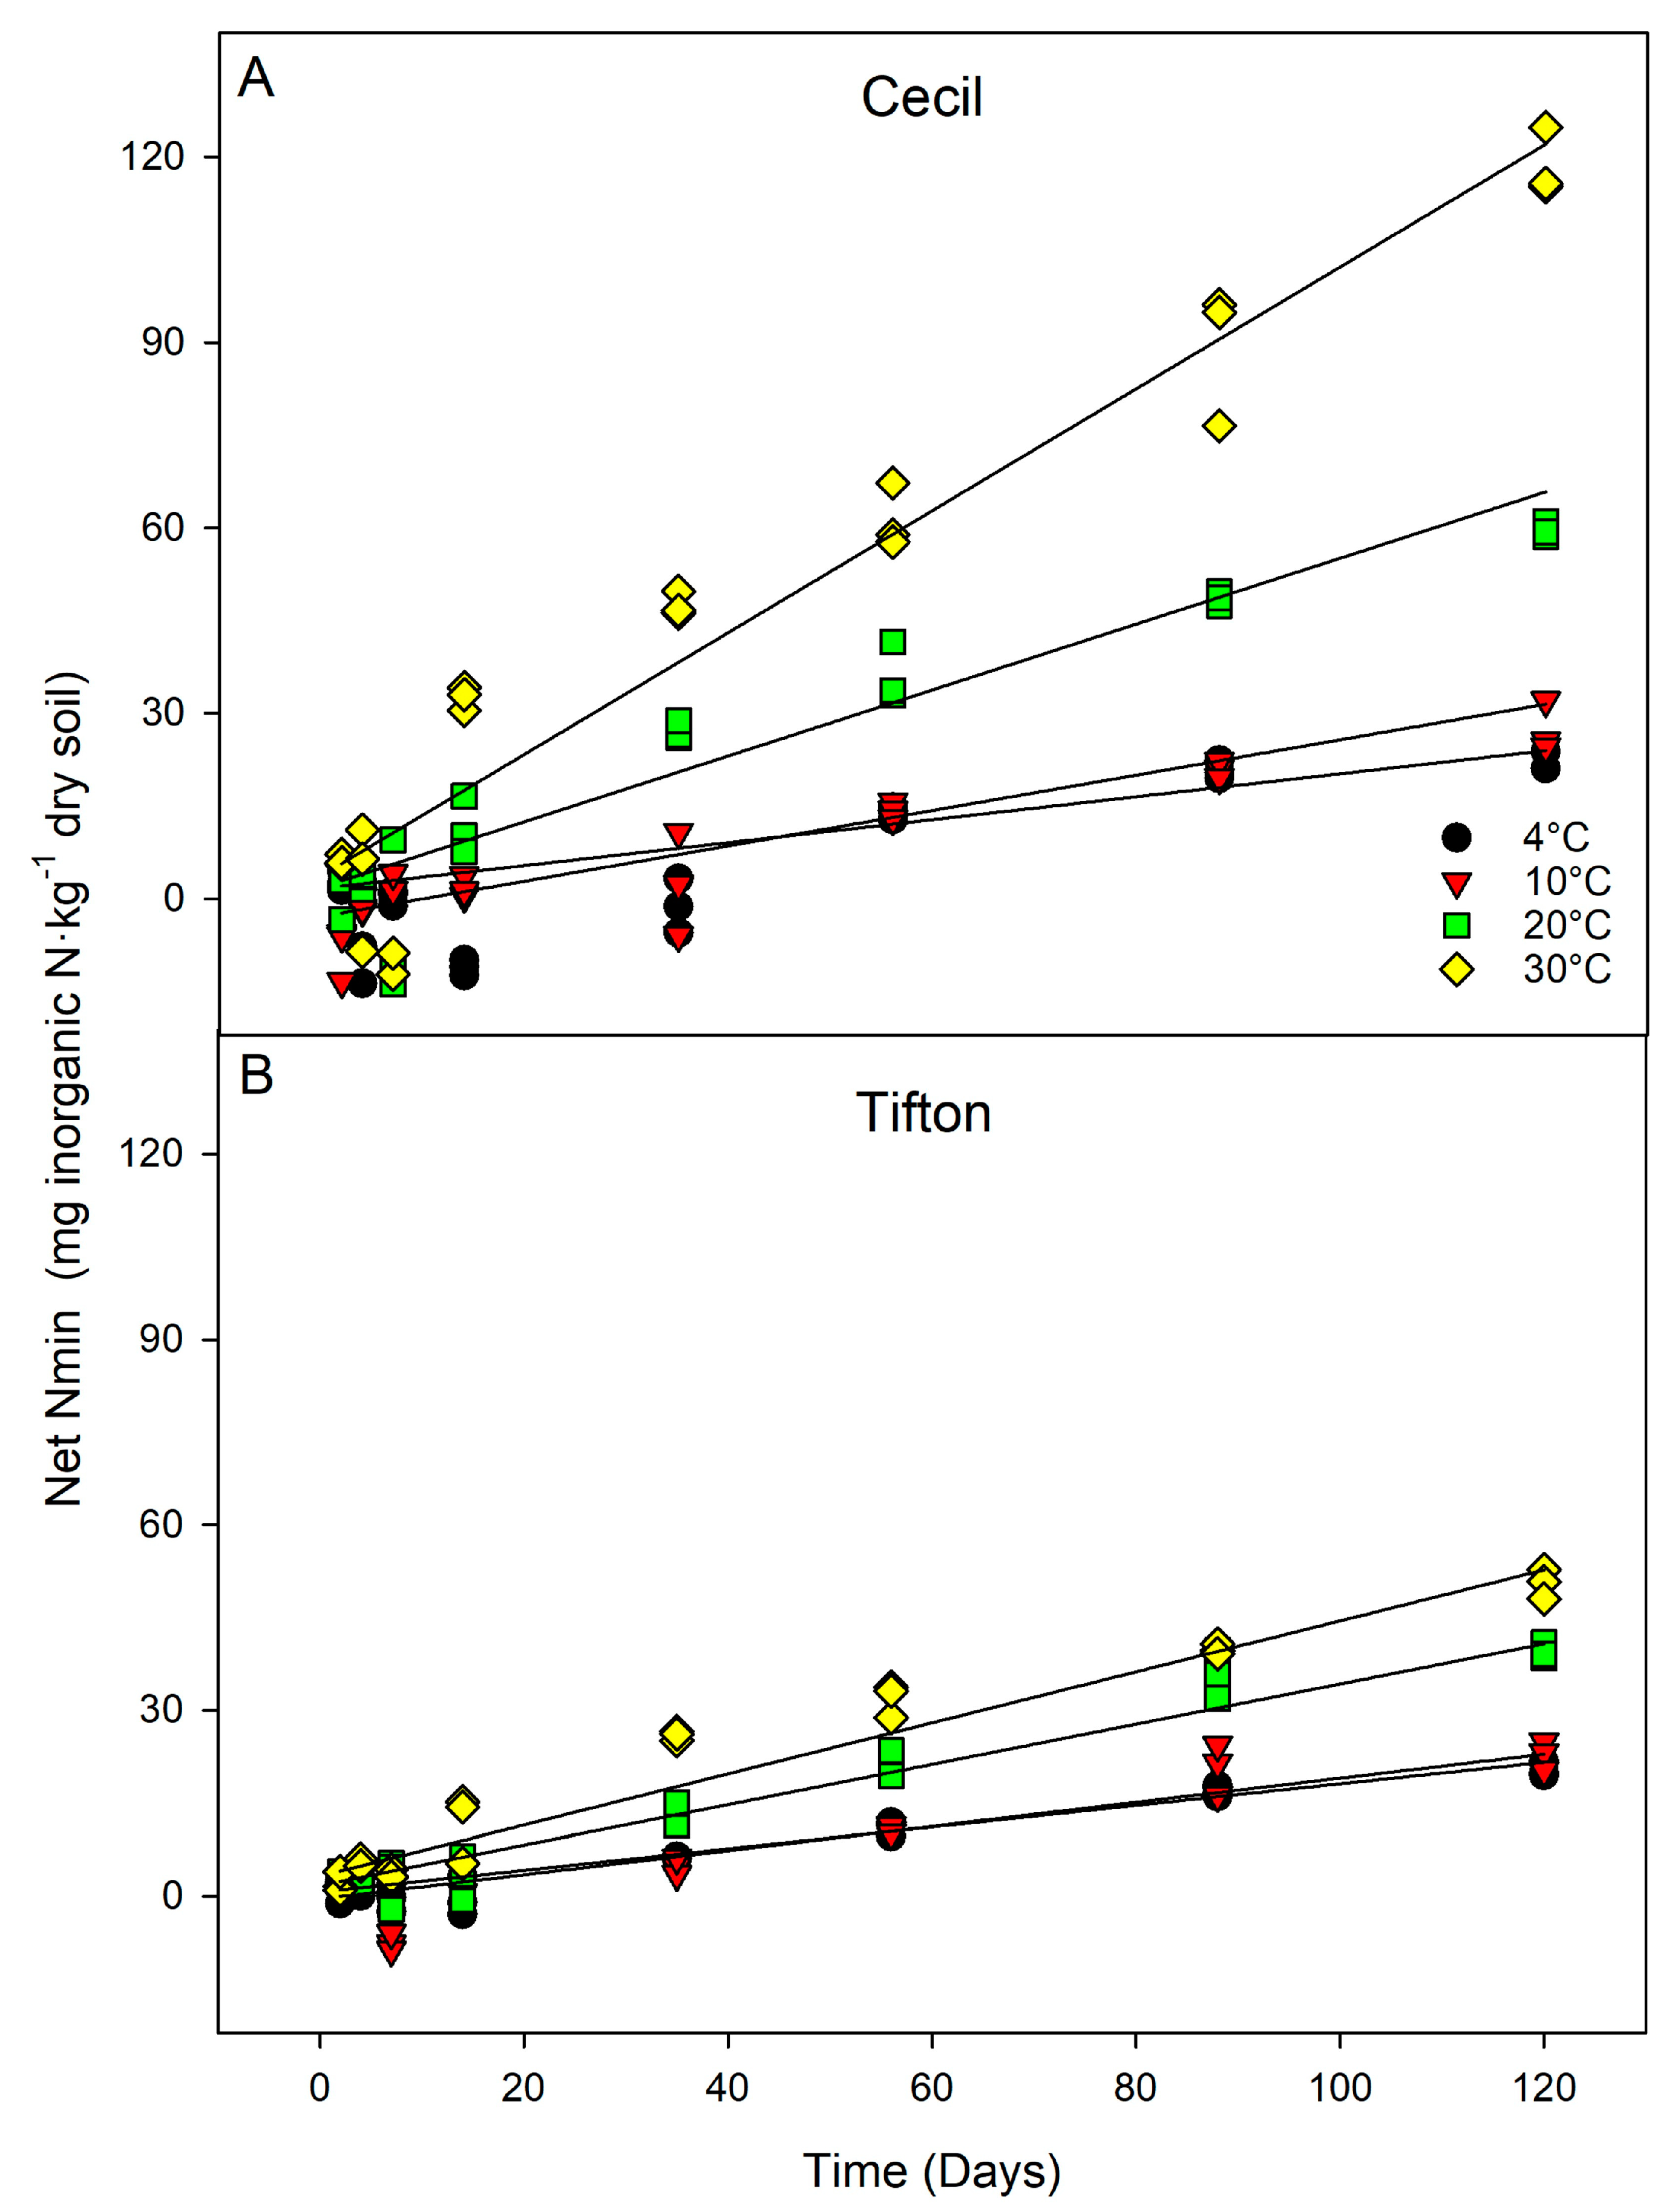
3.1. Laboratory Incubation

There was a linear correlation between incubation time and Net Nmin in control (unamended) soils (Figure 1). Net Nmin in the soil alone was significantly higher in the Cecil series soil compared to the Tifton series soil, which is likely to be related to the higher total C and total N content in the Cecil series compared to the Tifton soil (Table 1). In both soils, the Net Nmin was significantly higher when incubated at 30 °C, while minimal differences were observed in Net Nmin at 4 and 10 °C.
For the organic fertilizers, there was a trend of consistent significant differences for Net Nmin among treatment combinations beginning at 35 d of incubation. Therefore, data from selected time points during the incubation (2, 4, 14, 35 and 120 d) for both Tifton and Cecil soils are presented. Complete results for Net Nmin are available (Supplemental Tables S1 and S2). There were significant interactions between soil series, organic fertilizer and incubation temperature on Net Nmin at several time points over the 120 d incubation (Table 3 and Table 4). In the Cecil series soil, Net Nmin differences between combinations of fertilizer and temperature were evident within the first 4 d of incubation (Table 3). In the Cecil soil, FM had a greater Net Nmin compared to PPL and MIX when incubated at 20 and 30 °C from 4 to 35 d of incubation (Table 3). In contrast, minimal effects of temperatures were observed with PPL and MIX fertilizers in the first 35 d of incubation, with the exception of the PPL fertilizer at 14 d. In the Cecil soil, results suggest that high temperatures may have impacted the Net Nmin immediately after application for the FM but less for the other fertilizers. Faster rates of mineralization soon after application might have favored the occurrence of alternative processes, such as ammonia (NH3) volatilization [46,47]. At 120 d of incubation in the Cecil soil series, incubation temperature did not affect Net Nmin of FM or PPL. However, the Net Nmin of MIX fertilizer was greater at 20 °C than the other incubation temperatures at 120 d. These findings align with previous results reported by [14], which suggests that temperature has a larger impact during the first few days after incorporation of organic fertilizers, but the effects of temperature N mineralization decrease after a long period. Further, higher temperatures for some materials may also favor loss mechanisms such as NH3 volatilization [46].
Feather meal is derived from hydrolyzed, dried and ground poultry feathers. During mineralization of FM, long chains of keratin molecules are cleaved into smaller and more accessible components, which may enhance N release after relatively short incubation times [48,49]. Conversely, PPL and MIX have previously been shown to have slower mineralization rates than FM when incubated at 30 °C [5]. The PPL fertilizer had relatively low mineralization of the organic N (18 mg inorganic N·kg¹ dry material), which might be due to factors like the presence of bedding materials, moisture content and processing, which may affect the pool of mineralizable nitrogen [47]. The processing of the PPL can involve drying, grinding and compressing the material into uniform pellets, which can affect the availability and release of N [47,50,51]. It is important to note that the PPL fertilizer contained an initial 1.09% inorganic N (ammonium and nitrate) (Table 2), which was a relatively higher percentage of total N present compared to both FM and MIX sources. This inorganic N would be readily available for crop production and contribute to plant-available N in a field situation allowing for production of crops using PPL, despite having a relatively low rate of N mineralization. Several studies have reported the successful production of organic crops using PPL with a similar nutrient composition in the region where this study was conducted [31,52,53]. Total available N from the PPL fertilizer was notably greater than the organic mineralized N, suggesting that initial inorganic N from PPL may contribute to the total available N for plant uptake.
The effect of temperature on Net Nmin of different fertilizers in the Tifton series soil was variable at different time points (Table 4). The FM fertilizer after 4 d of incubation had a significantly greater Net Nmin at 20 and 30 °C (15 and 19 mg inorganic N kg−1 material, respectively) than at 4 and 10 °C (2 and 0 mg inorganic N kg−1 material, respectively). A similar trend in mineralization was observed with FM in the Cecil soil as well (Table 3). By 35 d of incubation Net Nmin of FM had increased at lower temperatures. Temperature had a lesser impact on the Net Nmin of MIX throughout the incubation period, with the greatest Net Nmin occurring at 20 °C after 120 d. The Net Nmin of PPL at higher temperatures in the Tifton soil was low, with a complete absence of Net Nmin at 30 °C starting from 14 d until 120 d, suggesting that higher temperatures favored the occurrence of other N processes in the PPL fertilizer instead of mineralization.
Our results suggest that there was potential N loss from fertilizers during incubation, resulting from NH3 volatilization or N immobilization, which may be favored by high temperatures [47]. Losses during early incubation periods from FM in the Cecil soil may be the result of a pattern of quick immobilization followed by gradual mineralization, reflecting the dynamic nature of microbial activity in response to availability of labile carbon compounds in the substrate [14,46,54]. It is also possible that NH3 volatilization occurred in the PPL at 30 °C, resulting in a lack of measurable N mineralization. However, temperature is just one of several factors that influence NH3 volatilization [46,55,56]. Soil properties such as moisture, pH, CEC and organic matter content also play a role [47,57]. In this context, NH3 volatilization may be more likely to occur in the Tifton soil rather than the Cecil soil to due to its relatively higher pH, low organic matter and high sand content [58].

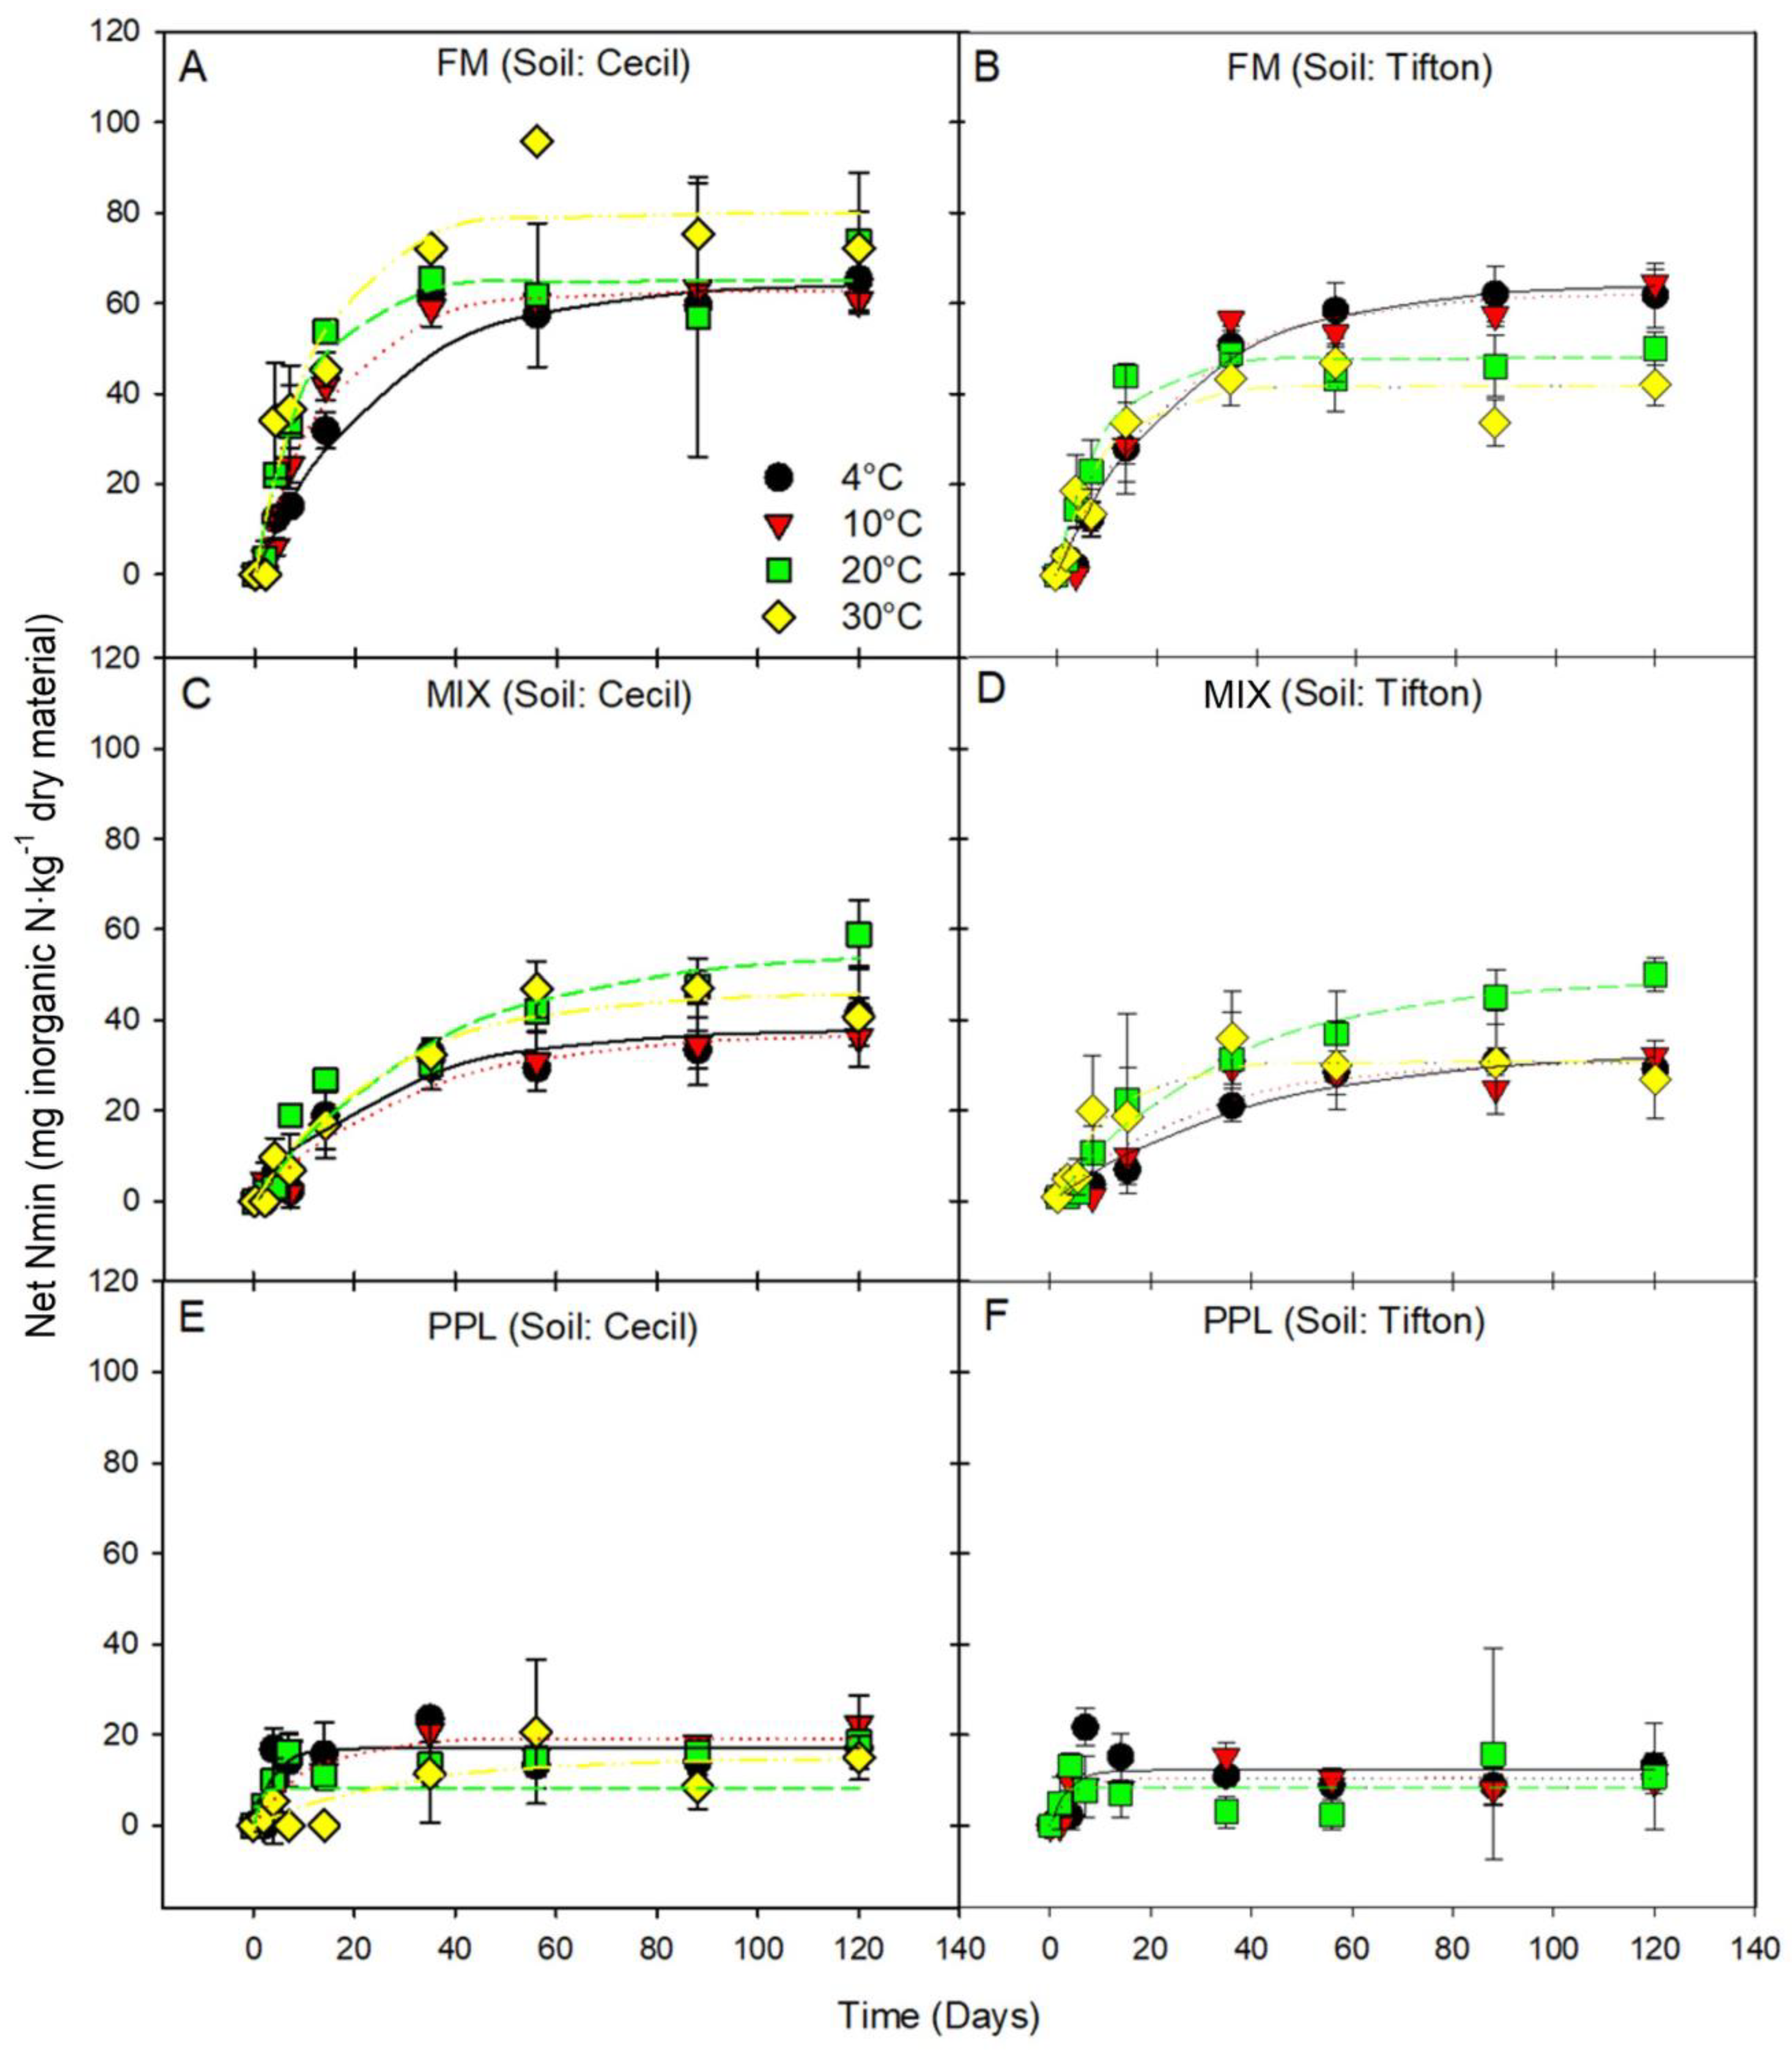
3.2. Mineralization Kinetics

A first-order model was fitted to the measured Net Nmin during the 120 d incubation for each soil, fertilizer and temperature treatment (Table 5, Figure 2). This model allowed the determination of the rate of mineralization (k) and the predicted pool of mineralizable N (N0) as a function of the temperature and the fertilizer applied. Goodness of fit of the first-order model were determined for each temperature, soil and fertilizer interaction and included RMSE, RSR, NSE and PBias.
The goodness of fit for the first-order kinetic model varied with different treatment combinations. The model demonstrated good efficiency in predicting the N mineralization of the FM and MIX fertilizers under most temperature and soil conditions, with NSE values ranging from 0.74 to 0.95 and RSR values between 0.22 and 0.51. There was an exception for model fit of the MIX fertilizer in Cecil soil at 20 °C, where the NSE value dropped below 0.50 and RSR exceeded 0.70, suggesting a weaker correlation between observed and predicted values (Table 5; Figure 2). In this specific fit, there was a tendency for the model to overestimate N mineralization, resulting in a negative PBias of −15.47. In contrast, the model efficiency for predicting the N mineralization of MIX was satisfactory and consistent across different soil and temperature combinations, with NSE values ranging from 0.59 to 0.93 and RSR values between 0.26 and 0.64.
The model’s performance was unsatisfactory for predicting the N mineralization of PPL fertilizer. In all first-order kinetic fits, RSR values exceeded 0.70, which may be attributed to the considerable variability in Net Nmin observed among the samples of this material during the 120 d incubation (Table 4 and Table 5). This variability negatively affected the correlation between observed and predicted values, which also resulted in NSE values between 0.06 and 0.46. Furthermore, the PBIAS of the models for the mineralization of PPL ranged from a positive value of 35.48 to negative values as low as −11.74, which indicates a tendency of both under- and overestimation of the model. The high initial inorganic N present in the PPL combined with low mineralization from the organic N pool (Figure 2, Table 5) also likely contributed to the poor fit of the first-order mineralization model.
The interactions between soil and temperature are necessary for understanding the rate of N mineralization of different organic fertilizers. In a previous study, Lazicki et al. [14] observed variability for potential plant-available N among 22 different organic materials trialed under warm and moist conditions (23 °C and 60% water holding capacity), with some undergoing N immobilization while others released up to 90% of applied N. The authors suggested, while the Net Nmin was well correlated with the C:N ratio of each material, the soil texture and management history of the soils influenced the timing of N release [14]. Different soil attributes, such as pH, texture, organic matter and cation exchange capacity (CEC), create distinct physical and chemical environments for microorganisms, which may influence when and how quickly microorganisms decompose organic N compounds [14]. Furthermore, the degree of which the temperature can influence microbial growth and, consequently, the N mineralization rate is likely to vary across different environmental systems [17].

3.2.1. FM Fertilizer Mineralization Kinetics

The N0 at 120 d for FM ranged from 62.75 to 79.89 mg inorganic N·kg−1 fertilizer applied in the Cecil soil (Table 5), and from 41.85 to 64.54 mg inorganic N·kg−1 fertilizer applied in the Tifton soil (Table 5). Similar N0 values have been previously reported for FM [5,14,15]. In the present study, N mineralization of FM over the 120 d incubation in the Cecil soil showed two distinct phases, starting with a rapid release during the first 14 d of incubation, followed by a slow-release phase and a plateau at approximately 80 d (Figure 2A). In the Tifton soil, a similar pattern of rapid release occurred during the early stages of incubation followed by a steady and slow release at the temperatures of 4 and 10 °C. At 20 and 30 °C, the rapid phase was followed by a plateau at approximately 35 d (Figure 2B). The rapid mineralization observed from FM fertilizer in the 14 d of incubation (Figure 2B) corresponds to previous reports [5,12], and may be attributed to the presence of readily available N-containing compounds, such as urea, and simple organic forms of N that can be easily broken down by soil enzymes, even at lower temperatures. In contrast, the slower N mineralization after 14 d indicates the predominance of microbial degradation of complex organic N forms [12]. A model proposed by Geisseler et al. [15] predicted that 61% of total N from FM would be in the mineral form after 100 d of incubation, with half of that being in the mineral form after only 5 d of incorporation.
For FM, in the Cecil series soil models, the k and N0 values were not significantly different among temperatures, with constant k values ranging between 0.04 and 0.10 and N0 values between 62.75 and 79.89 mg inorganic N·kg−1 fertilizer applied (Table 5). In contrast, in the Tifton soil, N0 was greater at the lower temperatures (4 °C and 10 °C), suggesting that temperature might affect N mineralization of FM in the Tifton soil to a greater degree compared with Cecil soil. This agrees with results reported by Dessurealt-Rompré et al. [16], who indicated that N mineralization rates in sandy loam soils were affected by temperature changes to a greater degree than predominately clay soils. Further, k and N0 values were not significantly different between soils, with the only exception with the highest temperature of 30 °C, suggesting that overall differences for the rate of mineralization and potentially mineralizable N of FM in different mineral soils may be minimal at lower temperatures.

3.2.2. PPL Fertilizer Mineralization Kinetics

The N0 for the PPL fertilizer after 120 d was less than 20 mg inorganic N·kg−1 fertilizer applied, regardless of soil type or temperature (Figure 2E,F). The model fit for both soils and temperature combinations showed most of the N release was during the first few days of incubation, followed by a plateau after the second week. On average, 10% of total N applied is predicted to be available from PPL after 7 d of incubation. Previous studies predicting N release from PPL reported higher values, with potential available N ranging between 25% to 50% of applied N [5,47], with most of the N released during the initial 7 d of incubation.
Model fits of the PPL product had a wide variability of k rates, with values ranging between 0.03 and 0.84 among treatments of soil and temperatures (Table 5). Further, N0 values ranged between 8.38 and 19.21 and no significant differences were observed among treatments of soils and temperatures. This agrees with other studies evaluating the N mineralization of organic fertilizers, which suggest that the temperature affects k rate more than the N0 [14,59]. Thus, changes in the N mineralization of PPL in response to environmental conditions are likely to be minimal.

3.2.3. MIX Fertilizer Mineralization Kinetics

The N0 for the MIX fertilizer in the Cecil and Tifton soils after 120 d ranged between 37.41 and 55.57 mg inorganic N·kg−1 fertilizer applied and 30.15 and 48.93 mg inorganic N·kg−1 fertilizer applied, respectively (Table 5; Figure 2C,D). The N release throughout the 120 d incubation steadily increased, but at a lower rate after 35 d, except when incubated at 30 °C in the Tifton series soil, in which a plateau phase was observed starting at 35 d (Figure 2D). In a previous study, Cassity-Duffey et al. [7] investigated the N mineralization of organic fertilizers across four distinct soils over a 100 d incubation period. Their results suggested that most of N mineralized from a pelletized MIX fertilizer, composed of animal-based proteins, occurred within the initial 2 weeks of incubation, with approximately 53% to 58% of the initially applied N mineralized after 14 d.
The first order model fits for MIX fertilizer had rate k values between 0.02 and 0.09, while N0 values ranged between 30.61 and 55.57 in both soils (Table 5). Further, k and N0 values for the MIX product were not significantly different between soil types or incubation temperatures, suggesting that we may expect minimal differences for the N release of MIX fertilizer between the two soils. Cassity-Duffey et al. [7] also reported that there were no significant effects of soil texture between Cecil and Tifton series soils on the Net Nmin of a MIX-type fertilizer. Interestingly, their research suggested that pH levels may have a more influential role than soil clay content in determining the potential N mineralization [7].

4. Conclusions

This study investigated N mineralization from three organic fertilizers in two soil types and soil temperatures that would be encountered during field vegetable production throughout the year in Georgia, USA. The Net Nmin varied with soil, fertilizer type and temperature, indicating that accurately predicting N mineralization from organic fertilizers may be specific for individual farms and fertilizer sources. In general, a first-order kinetic model demonstrated good efficiency in predicting the N mineralization of FM and MIX fertilizers but was inefficient for predicting N mineralization of PPL. Temperature and soil type had a relatively minor impact on the potentially mineralizable N of the MIX and PPL fertilizers at 120 d. However, incubation at higher temperatures (20 °C and 30 °C) impacted the Net Nmin of FM fertilizer in the Tifton series soil. Temperature-related differences may not be substantial enough to influence grower decisions regarding N fertilizer inputs for vegetable crop production in the two soils. However, organic fertilizer source will likely play a significant role in N availability during the cropping season. Further research is needed to determine how temperature may impact NH3 volatilization and other loss mechanisms, as these processes may play a role in plant-available N at high soil temperatures.

Supplementary Materials

The following supporting information can be downloaded at: https://www.mdpi.com/article/10.3390/nitrogen5010004/s1, Table S1: Net N mineralization in a Cecil sandy clay loam soil. Table S2: Net N mineralization in a Tifton loamy sand soil.

Author Contributions

Conceptualization, K.C.-D. and T.C.; methodology, K.C.-D.; software, H.I.d.J.; formal analysis, H.I.d.J. and K.C.-D.; resources, H.I.d.J. and T.C.; data curation H.I.d.J. and K.C.-D.; writing—original draft preparation, H.I.d.J., K.C.-D. and T.C.; writing—review and editing, A.L.B.R.d.S., B.D., H.I.d.J., K.C.-D. and T.C.; project administration, H.I.d.J.; funding acquisition, B.D. and T.C. All authors have read and agreed to the published version of the manuscript.

Funding

This research was funded by the US Department of Agriculture, National Institute of Food and Agriculture Project Number GEOW-2019-03518; Evaluation of integrated bacterial disease management options for organic onion production in the Southeastern and Northcentral United States.

Data Availability Statement

The data presented in this study are available on request from the corresponding author.

Conflicts of Interest

The authors declare no conflicts of interest.

References

  1. US Department of Agriculture. Results from the 2021 Organic Survey. 2022. Available online: https://www.nass.usda.gov/Publications/Highlights/2022/2022_Organic_Highlights.pdf (accessed on 11 November 2023).
  2. Bergstrand, K.J. Organic fertilizers in greenhouse production systems—A review. Sci. Hortic. 2022, 295, 110855. [Google Scholar] [CrossRef]
  3. Gale, E.S.; Sullivan, D.M.; Cogger, C.G.; Bary, A.I.; Hemphill, D.D.; Myhre, E.A. Estimating plant-available nitrogen release from manures, composts, and specialty products. J. Environ. Qual. 2006, 35, 2321–2332. [Google Scholar] [CrossRef] [PubMed]
  4. Wortman, S.E.; Holmes, A.A.; Miernicki, E.; Knoche, K.; Pittelkow, C.M. First-season crop yield response to organic soil amendments: A meta-analysis. Agron. J. 2017, 109, 1210–1217. [Google Scholar] [CrossRef]
  5. Cassity-Duffey, K.; Cabrera, M.; Gaskin, J.; Franklin, D.; Kissel, D.; Saha, U. Nitrogen mineralization from organic materials and fertilizers: Predicting N release. Soil Sci. Soc. Am. J. 2020, 84, 522–533. [Google Scholar] [CrossRef]
  6. Cabrera, M.L.; Kissel, D.E.; Vigil, M.F. Nitrogen mineralization from organic residues: Research opportunities. J. Environ. Qual. 2005, 34, 75–79. [Google Scholar] [CrossRef] [PubMed]
  7. Cassity-Duffey, K.; Cabrera, M.; Franklin, D.; Gaskin, J.; Kissel, D. Effect of soil texture on nitrogen mineralization from organic fertilizers in four common southeastern soils. Soil Sci. Soc. Am. J. 2020, 84, 534–542. [Google Scholar] [CrossRef]
  8. Reganold, J.P.; Wachter, J.M. Organic agriculture in the twenty-first century. Nat. Plants 2016, 2, 1–8. [Google Scholar] [CrossRef]
  9. Calderón, F.J.; McCarty, G.W.; Van Kessel, J.A.S.; Reeves III, J.B. Carbon and nitrogen dynamics during incubation of manured soil. Soil Sci. Soc. Am. J. 2004, 68, 1592–1599. [Google Scholar] [CrossRef]
  10. Geisseler, D.; Horwath, W.R.; Joergensen, R.G.; Ludwig, B. Pathways of nitrogen utilization by soil microorganisms—A review. Soil. Biol. Biochem. 2010, 42, 2058–2067. [Google Scholar] [CrossRef]
  11. Agehara, S.; Warncke, D.D. Soil moisture and temperature effects on nitrogen release from organic nitrogen sources. Soil Sci. Soc. Am. J. 2005, 69, 1844–1855. [Google Scholar] [CrossRef]
  12. Hartz, T.K.; Johnstone, P.R. Nitrogen availability from high-nitrogen-containing organic fertilizers. HortTechnology 2006, 16, 39–42. [Google Scholar] [CrossRef]
  13. Wild, P.L.; Van Kessel, C.; Lundberg, J.; Linquist, B.A. Nitrogen availability from poultry litter and pelletized organic amendments for organic rice production. Agron. J. 2011, 103, 1284–1291. [Google Scholar] [CrossRef]
  14. Lazicki, P.; Geisseler, D.; Lloyd, M. Nitrogen mineralization from organic amendments is variable but predictable. J. Environ. Qual. 2020, 49, 483–495. [Google Scholar] [CrossRef] [PubMed]
  15. Geisseler, D.; Smith, R.; Cahn, M.; Muramoto, J. Nitrogen mineralization from organic fertilizers and composts: Literature survey and model fitting. J. Environ. Qual. 2021, 50, 1325–1338. [Google Scholar] [CrossRef] [PubMed]
  16. Dessureault-Rompré, J.; Zebarth, B.J.; Georgallas, A.; Burton, D.L.; Grant, C.A.; Drury, C.F. Temperature dependence of soil nitrogen mineralization rate: Comparison of mathematical models, reference temperatures and origin of the soils. Geoderma 2010, 157, 97–108. [Google Scholar] [CrossRef]
  17. Guntiñas, M.E.; Leirós, M.C.; Trasar-Cepeda, C.; Gil-Sotres, F. Effects of moisture and temperature on net soil nitrogen mineralization: A laboratory study. Eur. J. Soil Biol. 2012, 48, 73–80. [Google Scholar] [CrossRef]
  18. Sierra, J. Temperature and soil moisture dependence of N mineralization in intact soil cores. Soil Biol. Biochem. 1997, 29, 1557–1563. [Google Scholar] [CrossRef]
  19. Bowles, T.M.; Acosta-Martínez, V.; Calderón, F.; Jackson, L.E. Soil enzyme activities, microbial communities, and carbon and nitrogen availability in organic agroecosystems across an intensively managed agricultural landscape. Soil Biol. Biochem. 2014, 68, 252–262. [Google Scholar] [CrossRef]
  20. Miller, K.S.; Geisseler, D. Temperature sensitivity of nitrogen mineralization in agricultural soils. Biol. Fertil. Soils 2018, 54, 853–860. [Google Scholar] [CrossRef]
  21. Clivot, H.; Mary, B.; Valé, M.; Cohan, J.P.; Champolivier, L.; Piraux, F.; Justes, E. Quantifying in situ and modeling net nitrogen mineralization from soil organic matter in arable cropping systems. Soil Biol. Biochem. 2017, 111, 44–59. [Google Scholar] [CrossRef]
  22. Knoepp, J.D.; Swank, W.T. Using soil temperature and moisture to predict forest soil nitrogen mineralization. Biol. Fertil. Soils 2002, 36, 177–182. [Google Scholar] [CrossRef]
  23. Cassity-Duffey, K.B.; Moore, A.; Satterwhite, M.; Leytem, A. Nitrogen mineralization as affected by temperature in calcareous soils receiving repeated applications of dairy manure. Soil Sci. Soc. Am. J. 2018, 82, 235–242. [Google Scholar] [CrossRef]
  24. Sims, J.T. Nitrogen transformations in a poultry manure amended soil: Temperature and moisture effects. J. Environ. Qual. 1986, 15, 59–63. [Google Scholar] [CrossRef]
  25. Hartz, T.K.; Smith, R.; Gaskell, M. Nitrogen availability from liquid organic fertilizers. HortTechnology 2010, 20, 169–172. [Google Scholar] [CrossRef]
  26. Stanford, G.; Smith, S.J. Nitrogen mineralization potentials of soils. Soil Sci. Soc. Am. J. 1972, 36, 465–472. [Google Scholar] [CrossRef]
  27. Gordillo, R.M.; Cabrera, M.L. Mineralizable nitrogen in broiler litter: II. Effect of selected soil characteristics. J. Environ. Qual. 1997, 26, 1679–1686. [Google Scholar] [CrossRef]
  28. Hassink, J.; Bouwman, L.A.; Zwart, K.B.; Bloem, J.; Brussaard, L. Relationships between soil texture, physical protection of organic matter, soil biota, and C and N mineralization in grassland soils. Geoderma 1993, 57, 105–128. [Google Scholar] [CrossRef]
  29. Abdelhafez, A.A.; Abbas, M.H.; Attia, T.M.; El Bably, W.; Mahrous, S.E. Mineralization of organic carbon and nitrogen in semi-arid soils under organic and inorganic fertilization. Environ. Technol. Innov. 2018, 9, 243–253. [Google Scholar] [CrossRef]
  30. Soinne, H.; Keskinen, R.; Räty, M.; Kanerva, S.; Turtola, E.; Kaseva, J.; Nuutinen, V.; Simojoki, A.; Salo, T. Soil organic carbon and clay content as deciding factors for net nitrogen mineralization and cereal yields in boreal mineral soils. Eur. J. Soil Sci. 2021, 72, 1497–1512. [Google Scholar] [CrossRef]
  31. De Jesus, H.I.; Ribeiro da Silva, A.L.B.; Dutta, B.; Cassity-Duffey, K.; Coolong, T. Influence of Organic Fertilizer Sources and Application Rates on Onion Production in Georgia, USA. HortTechnology 2023, 33, 398–406. [Google Scholar] [CrossRef]
  32. Masunga, R.H.; Uzokwe, V.N.; Mlay, P.D.; Odeh, I.; Singh, A.; Buchan, D.; De Neve, S. Nitrogen mineralization dynamics of different valuable organic amendments commonly used in agriculture. Appl. Soil Ecol. 2016, 101, 185–193. [Google Scholar] [CrossRef]
  33. Honeycutt, C.W. Nitrogen mineralization from soil organic matter and crop residues: Field validation of laboratory predictions. Soil Sci. Soc. Am. J. 1999, 63, 134–141. [Google Scholar] [CrossRef]
  34. Kaupa, P.; Rao, B.R. Nitrogen mineralization and efficiency from co-applied animal manures and mineral fertilizer in sweetpotato under humid tropical conditions. Field Crops Res. 2014, 168, 48–56. [Google Scholar] [CrossRef]
  35. Lei, L.; McDonald, L.M. Soil moisture and temperature effects on nitrogen mineralization in a high tunnel farming system. Commun. Soil Sci. Plant Anal. 2019, 50, 2140–2150. [Google Scholar] [CrossRef]
  36. Cabrera, M.; Molina, J.A.; Vigil, M. Modeling the nitrogen cycle. In Nitrogen in Agricultural Systems; Schepers, J.S., Raun, W., Eds.; ASA: Madison, WI, USA, 2008; pp. 695–730. [Google Scholar]
  37. US Department of Agriculture. 2022b. Soil Survey. Web Soil Survey—Soil Survey of Oconee and Tift Counties, Georgia. Available online: https://websoilsurvey.sc.egov.usda.gov/App/WebSoilSurvey.aspx (accessed on 28 March 2023).
  38. Priha, O.; Smolander, A. Nitrogen transformations in soil under Pinus sylvestris, Picea abies and Betula pendula at two forest sites. Soil Biol. Biochem. 1999, 31, 965–977. [Google Scholar] [CrossRef]
  39. Wyngaard, N.; Cabrera, M.L.; Shober, A.; Kanwar, R. Fertilization strategy can affect the estimation of soil nitrogen mineralization potential with chemical methods. Plant Soil 2018, 432, 75–89. [Google Scholar] [CrossRef]
  40. Cabrera, M.L. Modeling the flush of nitrogen mineralization caused by drying and rewetting soils. Soil Sci. Soc. Am. J. 1993, 57, 63–66. [Google Scholar] [CrossRef]
  41. Crooke, W.M.; Simpson, W.E. Determination of ammonium in Kjeldahl digests of crops by an automated procedure. J. Sci. Food Agric. 1971, 22, 9–10. [Google Scholar] [CrossRef]
  42. Keeney, D.R.; Nelson, D.W. Nitrogen—Inorganic forms. In Methods of Soil Analysis: Part 2 Chemical and Microbiological Properties; Page, A., Ed.; American Society of Agronomy, Soil Science Society of America: Madison, WI, USA, 1983; pp. 643–698. [Google Scholar]
  43. Moriasi, D.N.; Arnold, J.G.; Van Liew, M.W.; Bingner, R.L.; Harmel, R.D.; Veith, T.L. Model evaluation guidelines for systematic quantification of accuracy in watershed simulations. Trans. ASABE 2007, 50, 885–900. [Google Scholar] [CrossRef]
  44. Singh, J.; Knapp, H.V.; Arnold, J.G.; Demissie, M. Hydrological modeling of the Iroquois river watershed using HSPF and SWAT 1. J. Am. Water Resour. Assoc. 2005, 41, 343–360. [Google Scholar] [CrossRef]
  45. Vazquez-Amábile, G.G.; Engel, B.A. Use of SWAT to compute groundwater table depth and streamflow in the Muscatatuck River watershed. Trans. Am. Soc. Agric. Eng. 2005, 48, 991–1003. [Google Scholar] [CrossRef]
  46. Erwiha, G.M.; Ham, J.; Sukor, A.; Wickham, A.; Davis, J.G. Organic fertilizer source and application method impact ammonia volatilization. Commun. Soil Sci. Plant Anal. 2020, 51, 1469–1482. [Google Scholar] [CrossRef]
  47. Hadas, A.; Bar-Yosef, B.; Davidov, S.; Sofer, M. Effect of pelleting, temperature, and soil type on mineral nitrogen release from poultry and dairy manures. Soil Sci. Soc. Am. J. 1983, 47, 1129–1133. [Google Scholar] [CrossRef]
  48. Hadas, A.; Kautsky, L. Feather meal, a semi-slow-release nitrogen fertilizer for organic farming. Fert. Res. 1994, 38, 165–170. [Google Scholar] [CrossRef]
  49. Jan, M.T.; Roberts, P.; Tonheim, S.K.; Jones, D.L. Protein breakdown represents a major bottleneck in nitrogen cycling in grassland soils. Soil Biol. Biochem. 2009, 41, 2272–2282. [Google Scholar] [CrossRef]
  50. Mazeika, R.; Staugaitis, G.; Baltrusaitis, J. Engineered pelletized organo-mineral fertilizers (OMF) from poultry manure, diammonium phosphate and potassium chloride. ACS Sustain. Chem. Eng. 2016, 4, 2279–2285. [Google Scholar] [CrossRef]
  51. Purnomo, C.W.; Indarti, S.; Wulandari, C.; Hinode, H.; Nakasaki, K. Slow-release fertilizer production from poultry manure. Chem. Eng. Trans. 2017, 56, 1531–1536. [Google Scholar] [CrossRef]
  52. Boyhan, G.E.; Hicks, R.; Torrance, R.; Riner, C.M.; Hill, C.R. Evaluation of poultry litter and organic fertilizer rate and source for production of organic short-day onions. HortTechnology 2010, 20, 304–307. [Google Scholar] [CrossRef]
  53. Díaz-Pérez, J.C.; Bautista, J.; Gunawan, G.; Bateman, A.; Riner, C.M. Sweet onion (Allium cepa L.) as influenced by organic fertilization rate: 2. Bulb yield and quality before and after storage. HortScience 2018, 53, 459–464. [Google Scholar] [CrossRef]
  54. Quan, Z.; Huang, B.; Lu, C.; Su, C.; Song, L.; Zhao, X.; Fang, Y. Effects of ryegrass amendments on immobilization and mineralization of nitrogen in a plastic shed soil: A 15N tracer study. Catena 2021, 203, 105325. [Google Scholar] [CrossRef]
  55. Cabrera, M.L.; Chiang, S.C.; Merka, W.C.; Thompson, S.A.; Pancorbo, O.C. Nitrogen transformations in surface-applied poultry litter: Effect of litter physical characteristics. Soil Sci. Soc. Am. J. 1993, 57, 1519–1525. [Google Scholar] [CrossRef]
  56. Hargrove, W.L. Evaluation of ammonia volatilization in the field. J. Prod. Agric. 1988, 1, 104–111. [Google Scholar] [CrossRef]
  57. Zhenghu, D.; Honglang, X. Effects of soil properties on ammonia volatilization. Soil Sci. Plant Nutr. 2020, 46, 845–852. [Google Scholar] [CrossRef]
  58. Wang, F.L.; Alva, A.K. Ammonium adsorption and desorption in sandy soils. Soil Sci. Soc. Am. J. 2000, 64, 1669–1674. [Google Scholar] [CrossRef]
  59. Griffin, T.S.; Honeycutt, C.W. Using growing degree days to predict nitrogen availability from livestock manures. Soil Sci. Soc. Am. J. 2000, 64, 1876–1882. [Google Scholar] [CrossRef]
Figure 1. Net nitrogen mineralization (Net Nmin) from control Cecil (A) and Tifton (B) series soils at 4, 10, 20 and 30 °C over 120 d of incubation.
Nitrogen 05 00004 g001
Figure 2. Nitrogen mineralization from the feather meal (FM) (A,B), mixed source (MIX) (C,D) and pelleted poultry litter (PPL) (E,F) fertilizers incubated at 4, 10, 20 and 30 °C for 120 d in Cecil and Tifton series soils. Regression lines show predicted first order regressions for N mineralization (N0) and symbols show actual mineralized N (Net Nmin) (error bars indicate standard deviation).
Nitrogen 05 00004 g002
Table 1. Chemical characteristics, including total nitrogen (N) and carbon (C), phosphorous (P), potassium (K), magnesium (Mg) and calcium (Ca) of the Cecil sandy clay loam (Cecil) and Tifton loamy sand (Tifton) used in this study. Units expressed per unit dry soil.
SoilTotal NTotal CPKMgCapHw 1CEC i
(%)(mg·kg−1)(mEq·100 g−1)
Cecil0.311.7933.5116.563.56775.57.0
Tifton0.211.139.538.030.53205.44.3
1 Water pH = pHw measured using a 1:1 water:soil mixture, i Cation Exchange Capacity = CEC.
Table 2. Characteristics, including total nitrogen (N), nitrate N (NO3-N), ammonium N (NH4-N), total carbon (C) and carbon to nitrogen (C:N) ratio of feather meal (FM), pelleted poultry litter (PPL) and mixed source (MIX) organic fertilizers used.
MaterialInorganic NNO3-NNH4-NTotal NTotal CC:N Ratio
%
FM1.180.850.3313.6148.173.54
PPL1.040.900.144.3627.746.36
MIX0.490.350.149.4434.353.64
Table 3. Net N mineralized (Net Nmini) from the feather meal (FM) and pelleted poultry litter (PPL), mixed source (MIX) fertilizers incubated at 4, 10, 20 and 30 °C for 120 d in a Cecil sandy clay loam soil. Differences in sampling time are noted by uppercase letters, while differences among temperatures are noted by lowercase letters.
Time of Incubation (Days)FertilizerTemperature
4 °C10 °C20 °C30 °C
Net Nmin (mg Inorganic N·kg¹ Dry Material) 1
2FM0.56A a 23.72A a3.66A a0.00A a
PPL0.00A a0.00A a4.20A a1.77A a
MIX0.00A a4.61A a2.00A a0.00A a
4FM12.31AB ab6.17A b22.02A ab34.09A a
PPL16.91A a1.31A a10.17B a5.45B a
MIX6.01B ab2.08A b3.08C b9.71AB a
14FM31.84A c41.66A b53.71A a45.22A ab
PPL15.70A a11.97B a11.06C a0.06C b
MIX18.87A a-- 26.69B a16.88B a
35FM62.00A b58.90A b65.43A ab72.04A a
PPL23.61C a20.72B a13.47C a11.53C a
MIX32.67B a29.42B a30.20B a32.36B a
120FM65.22A a60.53A a73.70A a72.14A a
PPL17.15C a22.46C a18.48B a14.98C a
MIX41.29B ab36.24B b58.85A a40.67B ab
1  Net   N min = Inorganic   N d = x Inorganic   N   Control t = x Inorganic   N   of   Material t = 0 . 2 Different uppercase letters represent significant differences between fertilizers at each sampling time, and different lowercase letters represents significant differences among temperatures for each fertilizer and incubation time according to Tukey’s honest significant difference test (p < 0.05).
Table 4. Net N mineralized (Net Nmini) from the feather meal (FM), mixed source (MIX) and pelleted poultry litter (PPL) fertilizers incubated at 4, 10, 20 and 30 °C for 120 d in a Tifton loamy sand soil. Differences in sampling time are noted by uppercase letters, while differences among temperatures are noted by lowercase letters.
Time of Incubation (Days)FertilizerTemperature
4 °C10 °C20 °C30 °C
Net Nmin (mg Inorganic N·kg¹ Dry Material) 1
2FM3.15A a 23.51A a3.38A a4.15B a
PPL2.77A ab0.00A b4.94A ab11.26A a
MIX0.24A b3.31A ab0.00A b4.02B a
4FM1.86A bc0.00B c14.46A ab18.60A a
PPL2.24A b9.65A ab13.26A a8.57A ab
MIX1.15A a1.10B a0.91B a4.39A a
14FM28.06A a28.68A a44.01A a33.82A a
PPL15.21AB a7.95B ab6.97B ab0.00B b
MIX6.04B a9.20B a21.71AB a17.88AB a
35FM50.74A ab56.51A a48.93A ab43.39A b
PPL11.04C a15.33C a3.08B b0.00B b
MIX20.31B a28.73B a30.62A a35.51A a
120FM61.91A a64.55A a50.09A b42.13A b
PPL13.22C a9.74C a10.76B a0.00B a
MIX28.43B b31.55B b49.49A a26.24A b
1   Net   N min = Inorganic   N d = x Inorganic   N   Control t = x Inorganic   N   of   Material t = 0 . 2 Different uppercase letters represent significant differences within fertilizer type at each sampling point, and different lowercase letters represent significant differences among temperatures for each fertilizer and incubation time according to Tukey’s honest significant difference test (p < 0.05).
Table 5. First order fit characteristics, root mean squared error (RMSE), ratio of the root mean square error to the standard deviation of measured data (RSR), Nash–Sutcliffe efficiency (NSE) and Percent bias (PBias) for net mineralized nitrogen (Net Nmin) for feather meal (FM), pelleted poultry litter (PPL) and mixed source (MIX) organic fertilizers incubated in Cecil sandy clay loam (Cecil) and Tifton loamy sand (Tifton) soils at several temperatures.
SoilFertilizerTemperatureNet Nmin at 120 dN03First Order Rate Coef. k 4RMSERSRNSEPBIAS
°C% 1mg Inorganic N·kg−1 Dry Soil 2d−1
CecilFM468.2265.2264.540.044.640.260.931.42
1063.3160.5362.750.074.390.260.93−5.52
2077.0873.7065.120.1013.460.720.49−15.47
3075.4572.1479.890.0811.100.500.75−4.83
PPL425.8317.1517.170.265.140.850.28−11.74
1033.8322.4619.210.094.460.730.46−24.97
2027.8318.488.380.844.150.970.0635.48
3022.5514.9815.040.038.210.820.33−1.55
MIX446.1441.2938.010.044.590.360.87−8.84
1040.4936.2437.410.034.700.410.83−12.30
2065.7658.8555.570.036.140.350.88−0.70
3045.4440.6746.310.046.230.390.85−6.91
TiftonFM464.7561.9164.540.045.560.220.95−2.98
1067.5264.5562.550.045.210.250.94−6.00
2052.3950.0948.030.115.550.330.89−2.06
3044.0742.1341.850.107.140.510.74−3.77
PPL419.9113.2212.280.295.600.870.25−2.32
1014.669.7410.560.224.130.800.36−5.90
2016.2110.768.380.848.951.000.01−0.27
3000------
MIX431.7628.4332.720.023.250.260.93−5.42
1035.2631.5530.610.034.820.380.86−4.79
2055.2949.4948.930.037.850.410.83−1.90
3029.3226.2430.150.098.390.640.59−1.23
1 Net mineralized N after 120 d of incubation as a percentage of organic N in the fertilizer applied. 2 Net measured mineralized N after 120 d of incubation. 3 N0 is the amount of net mineralized N predicted from a first order kinetics model. 4 k is the rate coefficient of the first order model.
Disclaimer/Publisher’s Note: The statements, opinions and data contained in all publications are solely those of the individual author(s) and contributor(s) and not of MDPI and/or the editor(s). MDPI and/or the editor(s) disclaim responsibility for any injury to people or property resulting from any ideas, methods, instructions or products referred to in the content.

