Article

Effect of Methyl Jasmonate Plus Urea Foliar Application on the Polysaccharide and Monosaccharide Composition of Tempranillo Grapes and Wines and on the Wine’s Quality

by
Miriam González-Lázaro
,
Leticia Martínez-Lapuente
,
Teresa Garde-Cerdán
*,
Mikel Landín Ross-Magahy
,
Lesly L. Torres-Díaz
,
Eva P. Pérez-Álvarez
,
Zenaida Guadalupe
and
Belén Ayestarán
*
Instituto de Ciencias de la Vid y del Vino (Universidad de La Rioja, CSIC, Gobierno de La Rioja), Ctra. de Burgos, Km. 6, 26007 Logroño, Spain
*
Authors to whom correspondence should be addressed.
Nitrogen 2023, 4(3), 263-278; https://doi.org/10.3390/nitrogen4030019
Submission received: 23 February 2023 / Revised: 4 July 2023 / Accepted: 6 July 2023 / Published: 8 July 2023

Abstract

:
Polysaccharides are the main group of macromolecules in wines. Climate change is a major problem for viticulturists as it leads to the production of unbalanced grapes. This is attributed to a mismatch between the technological maturity and phenolic maturity of grapes, which can negatively impact the production of high quality wines. To mitigate this effect, biostimulants can be applied to grapevines. For the first time in the literature, this work studied the foliar application of methyl jasmonate plus urea (MeJ + Ur) on the vineyard and its effect on the monosaccharide and polysaccharide composition of Tempranillo grapes and wines over two consecutive seasons. To achieve this, the extraction and precipitation of polysaccharides was conducted, and the identification and quantitation of monosaccharides was performed via GC–MS. The effect of MeJ + Ur foliar treatment in both the grapes and wines was season-dependent. The MeJ + Ur treatment had a slight impact on the monosaccharide composition of the grapes and also demonstrated a small effect on the wines. Multifactor and discriminant analysis revealed that the season had a greater influence on the monosaccharide and polysaccharide composition of grapes and wines compared to the influence of MeJ + Ur treatment. Interestingly, the MeJ + Ur-treated wines exhibited a higher sensory evaluation than the control wines in the second vintage. To gain further insights into the effect of MeJ + Ur foliar application on the monosaccharide and polysaccharide composition of grapes and wines, further investigations should be conducted.

1. Introduction

The quality of wines depends on a multitude of metabolites extracted from grapes, including polyphenols, amino acids, volatile compounds, and polysaccharides [1]. Among these, polysaccharides are one of the most important groups of macromolecules in wines [2] since these compounds act as colloidal protectors. Polysaccharides have various impacts on wine characteristics; for example, they influence anthocyanin extractability [3], affect astringency by reducing salivary-protein interactions [4], and potentially modify wine aromas through interactions with volatile compounds, altering their volatility [5]. Polysaccharides originate from both the cell walls and microorganisms, including yeasts, involved in the winemaking process [6].
Different families of polysaccharides have been distinguished, including polysaccharides rich in arabinose and galactose (PRAGs), such as type II arabinogalactan-proteins (AGPs), arabinans, rhamnogalacturonans type I (RG-I) and type II (RG-II), and homogalacturonans (HLs), which originate from grapes. Additionally, yeast fermentation releases glucans (GLs), mannans, and mannoproteins (MPs) [7]. In summary, the presence of AGP/PRAG, RG-II and MP contributes to the specific wine matrix and influences the perceived quality of the wine by affecting the colloidal state of the red wine and interacting with phenolic and volatile compounds. The grape cell wall is composed of polysaccharides (celluloses, hemicelluloses, and pectins), phenolic compounds, and proteins [3,6]. The cell wall acts as a barrier for the diffusion of aroma and phenolic compounds, including grape polysaccharides (RG-II, PRAG, HL), into wines. Therefore, polysaccharides are released to red wines during maceration and alcoholic fermentation [6]. In recent years, climate change has emerged as a significant concern for winemakers since it modifies vine development and fruit maturation patterns [8]. Grapes reach technological maturity when their berries attain maximum sugar concentration, indicating that they are ready to be harvested. However, phenolic maturity, characterized by an increase in the content of phenolic compounds in grapes, including total phenols and especially anthocyanins, occurs after technological maturity. This imbalance in grape development is a result of climate change, which, consequently, affects the quality of wine [9,10]. One potential strategy to alleviate the effects of climate change on grape composition is the foliar application of biostimulants [11,12,13]. Among the biostimulants sprayed on grapevines, elicitors and nitrogen compounds are particularly noteworthy. Elicitors are compounds capable of triggering a defensive response in plants, leading to the increased production of certain secondary metabolites [14,15]. Methyl jasmonate is an elicitor thoroughly employed as a foliar spray on grapevines. Its effects on enhancing volatile compounds [16,17], phenolic compounds [18,19], and amino acids [20,21] in grapes and wines have been well-documented. However, it should be noted that the increase in grape phenolic content achieved by methyl jasmonate does not always result in wines with a higher phenolic content [18,22].
The application of elicitors to grapevines produces a tightening of the cell walls in grape skins, making it more challenging to extract polyphenols, especially anthocyanins, from the skins into the must [23]. Regarding the impact of methyl jasmonate on the polysaccharide content of grapes, Paladines-Quezada et al. [24] reported that the cellulose content in the cell walls of MeJ-treated grapes was lower compared to control grapes, whereas Apolinar-Valiente et al. [23] indicated that the cell wall of grapes was reinforced after MeJ treatment. Paladines-Quezada et al. [25] concluded that the application of MeJ did not affect the concentration of MPs in the resulting wine, although MeJ treatment did reduce the content of RG-II and total polysaccharides in the wine. However, in a recent study examining the foliar application of MeJ and nanoparticles doped with MeJ [26], it was observed that foliar treatment had only a slight impact on the content of monosaccharides and polysaccharides in grapes, prompting the authors to conclude that the elicitors did not reinforce the skin cell walls of Tempranillo grapes. These studies suggest that the extent of skin cell wall reinforcement depends on the composition and morphology of the cell wall material, which varies among grape varieties. The effect on wine is influenced by the type of polysaccharide family and the vintage climate. On the other hand, the foliar application of nitrogen compounds in vineyards has also been investigated. Urea foliar application offers advantages over other fertilizers as it is inexpensive, reduces soil fixation, requires lower fertilizer amounts, improves crop quality, and accelerates plant uptake, response, and assimilation. Indeed, urea foliar application at veraison does not lead to increased vegetative growth or grapevine vigor. However, it does improve the sensory quality of grapes and the content of yeast-assimilable nitrogen (YAN) [27]. Studies have reported an increase in nitrogen [28,29] and phenolic [12,30] and aromatic compounds [31,32] in grapes following urea foliar application. However, to the best of the authors’ knowledge, there are no papers related to the effect of urea foliar treatment on the monosaccharide and polysaccharide content of grapes and wines, nor on the effects of methyl jasmonate and urea (combined) foliar treatment in vineyards.
Therefore, based on the information discussed above, this study aimed to investigate the effect of methyl jasmonate and urea foliar application on the composition of monosaccharides and polysaccharides in grapes and wine derived Tempranillo grapevines over two consecutive vintages, something which has not been reported in the literature until now.

2. Materials and Methods

2.1. Vineyard Site, Experimental Design, and Vinification

The experiment was conducted in two consecutive vintages (2019–2020) using grapes from Tempranillo (Vitis vinifera L.) grapevines grown in the experimental vineyard of Finca La Grajera. This vineyard is located in Logroño, La Rioja (Spain) (Lat: 42°26′25.36″ North; Long: 2°30′56.41″ West; 456 m above sea level). The study was performed on grapevines planted in 1997; these vines were trained to a vertical shoot positioned (VSP) trellis system with a grapevine spacing of 2.80 m × 1.25 m and grafted onto an R-110 rootstock. For this study, two foliar applications were carried out: (i) control (sprayed with aqueous solution of Tween© (Polyethylene Glycol Sorbitan Monooleate) 80 alone) (Sigma-Aldrich, Madrid, Spain) and (ii) treatment with methyl jasmonate plus urea (MeJ + Ur). The products employed to facilitate foliar application were dissolved in water in a concentration of 10 mM of methyl jasmonate (Sigma-Aldrich, Madrid, Spain) and a dose of 6 kg N/ha of urea (Sigma-Aldrich), according to a protocol outlined in previous works [20,27]. Tween© 80 (1 mL/L) was used as a wetting agent. Treatments were carried out at veraison and one week later. In all cases, treatment was carried out by spraying 200 mL of solution over the leaves, and this was performed in triplicate. Ten vines were sprayed for each replication and treatment (n = ten vines treated in each treatment × two treatments × three replicates per treatment). The experimental design was arranged in a complete randomized block.
Grapes were harvested at their optimum technological maturity, i.e., when the weight of 100 berries remained constant and the potential alcohol content reached 13 (% v/v). For each replicate and treatment, a random sample of 100 berries were collected and immediately frozen at −20 °C for the subsequent analysis of grape polysaccharides. At the winery, the complete grape clusters, weighing approximately 25 kg, were destemmed and crushed. Grapes from the control treatment and the MeJ + Ur treatment, along with their respective replicates, were processed separately. General parameters were then determined in the resulting must. The resulting paste–must was introduced into individual 30 L-tanks, resulting in a total of 6 tanks corresponding to the six fermentations performed (two treatments × three repetitions/treatment). Alcoholic fermentation (AF) was carried out by inoculating the musts with a commercial Saccharomyces cerevisiae strain (Safoeno SC22, Fermentis, Marcq-en-Barœul, France) at a dosage of 20 g/hL. AF was carried out under a controlled temperature of 20 +/−2 °C. Once AF was complete (residual sugar content in must below 2.5 g/L), a commercial Oenococcus oeni strain (Viniflora CiNe, CHR Hansen, Hørsholm, Denmark) was inoculated into the wine at a rate of 1 g/hL to initiate malolactic fermentation (MLF) at a temperature of 17 ± 1 °C. Once MLF was complete, aliquot samples were frozen and stored at −20 °C until it was time to analyze the monosaccharide and polysaccharide compounds and general parameters of the wine.

2.2. General Parameters of Must and Wines

The general parameters (°Brix, potential alcohol, pH, and total acidity) of must were determined using the official methods outlined by the OIV [33]. Glucose, fructose, and their sum malic acid, ammonium nitrogen, amino nitrogen, yeast-assimilable nitrogen, and total phenols were analyzed using enzymatic equipment (Miura One, TDI, Barcelona, Spain). After malolactic fermentation, the wines were analyzed to determine their alcoholic concentration, pH, total acidity, volatile acidity, color intensity (CI), and total polyphenol index (TPI) [33]. The total anthocyanin content was studied following the methodology described by Ribéreau-Gayon and Stonestreet [34].

2.3. Analysis of Soluble Polysaccharides from Grapes and Wine via GC–MS

2.3.1. Extraction of Soluble Polysaccharides from Grapes

The grapes were defrosted and then were homogenized using an Ultra-Turrax T-18 (IKA, Staufen, Germany) at 18,000–20,000 rpm in static conditions. Moreover, 1 g of homogenate was employed for the extraction. Extraction was carried out for 18 h in tartaric acid (2.5 g/L) with a pH = 1 and in a 1:4 solid/liquid ratio following the extraction method outlined by Canalejo et al. [35].

2.3.2. Precipitation of Total Soluble Polysaccharides from Grapes and Wines

A method of recovery via precipitation after ethanolic dehydration was employed with grape extracts and wines [36,37]. Precipitation was carried out in triplicate (n = 3).

2.3.3. Identification and Quantification of Monosaccharides by GC–MS in Grapes and Wines

The monosaccharide contents of the grape and wine samples were analyzed via gas chromatography–spectrometry (GC–MS) using an Agilent 7890A gas chromatograph (Agilent Technologies, Waldbronn, Germany) coupled to a 5975C VL quadrupole mass detector. The methodology we followed was that described by Martínez-Lapuente et al. [26]. Each sample was injected in triplicate. A capillary chromatographic column of Teknokroma fused silica (30 m × 0.25 mm × 0.25 µm) of phase 5% phenyl–95% methylpolysiloxane was employed. The oven was initially heated to 120 °C, and the temperature was increased at a rate of 1 °C/min to 145 °C, then to 180 °C. The rate of temperature increase was then adjusted to 0.9 °C/min and later to 40 °C/min until a temperature of 230 °C was reached. The temperature of the injector, equipped with a 3.4 mm I.D. in a split ratio of 1:20, was 250 °C. Helium (99.996%) was employed as carrier gas at a flow rate of 1 mL/min. The ionization voltage was 70 eV. The temperature for the MS Quad was 150 °C, the temperature for the MS Source was 230 °C, and the temperature for the transfer line was 250 °C. The monosaccharide composition was determined by examining the trimethylsilyl-ester O-methyl glycosyl residues obtained after acid methanolysis and derivatization via GC–MS [37]. The content of each family of polysaccharides was estimated from the concentration of individual glycosyl residues, which are characteristic of structurally identified must and wine polysaccharides [2,36].

2.4. Sensory Analysis of the Wines

A sensory evaluation of the wines was carried out by a panel of 12 specialized panelists one month after the completion of malolactic fermentation. The evaluation took place in a designated test room following the guidelines outlined by the International Organization for Standardization. Prior to the evaluation, the panelists underwent training to familiarize themselves with sensory analysis terminology. The wine samples were evaluated in a totally random order using a blind tasting and comparison system. A tasting sheet approved by the OIV [38] was employed, and evaluations were made on a scale of 40 (insufficient) to 100 (excellent). Quantitative assessments of the olfactory attributes (compote, red fruit, black fruit, floral, spicy, smoked, alcoholic, vegetal/herbaceous, balsamic, lactic, oxidized, and reduced) along with the gustatory characteristics (sweet, acid, bitter, alcohol, astringency, and overall balance) were also performed, using a scale ranging from 1 (low intensity) to 10 (high intensity).

2.5. Statistical Analysis

Statistical analysis was performed using SPSS Version 21.0 statistical package for Windows (SPSS, Chicago, IL, USA). General parameters, monosaccharide and polysaccharide composition, and sensory analysis data were assessed using analysis of variance (ANOVA). The differences between means were compared using the Duncan test (p ≤ 0.05). Multifactor analysis of the general parameters, monosaccharide, polysaccharide, and sensory data was carried out to study the effects of treatment, the season, and the interaction between these two factors. To classify samples, a discriminant analysis carried out by using the monosaccharide data of wines was conducted.

3. Results and Discussion

3.1. General Parameters of Must and Wines

Table 1 and Table 2 show the general parameters of the control and MeJ + Urea (MeJ + Ur) grapes and wines for the two seasons studied.
Regarding the general parameters of grapes in 2019, MeJ + Ur grapes showed a lower °Brix and potential alcohol concentration in comparison with the control grapes. The glucose and fructose content was also lower in the MeJ + Ur-treated grapes than in the control grapes. This finding can be attributed to the delay in grape ripening caused by the MeJ + Ur foliar treatment during this season [24]. On the other hand, the MeJ + Ur grapes showed a higher content of ammonium nitrogen, amino nitrogen, YAN, and total phenols compared to the control grapes. Therefore, MeJ + Ur foliar treatment seems to improve the biosynthesis of the phenolic compounds in grapes. This effect has been previously described in the literature, albeit with respect to applying MeJ and Ur to Tempranillo grapes individually (not in tandem) [12,19]. Likewise, an increase in nitrogen content has also been previously observed in Tempranillo grapes after the individual foliar application of Ur [27,28]. However, in the second vintage, different results were observed. Treatment with MeJ + Ur did not seem to affect grape maturation, as the only difference observed between the control and MeJ + Ur-treated grapes was in regard to the concentration of malic acid, which was higher in the MeJ + Ur-treated grapes. In addition, in contrast to the findings for 2019, MeJ + Ur did not improve the phenolic concentration of grapes in the second season studied (2020). Therefore, the effectiveness of MeJ + Ur foliar treatment appears to be dependent on the specific season, which, in the case of MeJ, has been previously established in both Tempranillo grapes and other grape varieties [24,39]. Notable differences in the weight of 100 berries and the nitrogen content of grapes were observed between the seasons, probably due to the higher pre-harvest rainfalls recorded in 2020 than in the 2019 vintage season (11.5 L/m2 in 2019 versus 32.9 L/m2 in 2020). In addition, there was a change in the time interval between the initial application of MeJ + Ur and the harvest date between the two vintages. In the 2019 season, one month elapsed between the initial application and the harvest date, while in 2020, this period was longer, lasting 1 month and 20 days. Turning to the general parameters of the wines (Table 2), it was observed that, in the first season, the control wines exhibited a higher alcohol content than MeJ + Ur wines, which is consistent with the results observed in the grapes. This effect is of particular interest in mitigating the effects of climate change, which, as previously stated, poses ongoing challenges to viticulture. However, no differences in the alcohol content of the wines from the second vintage were observed. Therefore, further studies should be conducted to elucidate this effect. In agreement with the higher concentration observed in MeJ + Ur-treated grapes in the 2019 vintage season, the MeJ + Ur-treated wines exhibited a higher YAN concentration. In the second vintage season, slight differences were noted between the control and MeJ + Ur-treated wines. The MeJ + Ur-treated wines displayed a higher CI compared to the control wines, which could have a significant effect on the quality of the wines. However, the MeJ + Ur-treated wines showed a higher lactic acid concentration than the control wines.
Therefore, treatment with MeJ + Ur had a limited effect on the general parameters of the wines in both of the seasons studied.

3.2. Monosaccharide Composition and the Polysaccharide Families of Tempranillo Grapes

Table 3 presents the glycosyl composition of the monosaccharide and the polysaccharide concentrations in both sets of grapes. According to Martínez-Lapuente et al. [26], glucose is the main component of various grape cell walls’ polysaccharides, such as arabinoglucans, cellulose, and mannans. However, during the 2019 season and in both the control and MeJ samples, galactose was the predominant monosaccharide, followed by glucose, galacturonic acid, and arabinose. In contrast, in 2020, galactose, galacturonic acid, arabinose, and glucose were the main monosaccharides, as observed in Tempranillo grapes by Martínez-Lapuente et al. [26]. The concentration of monosaccharides varied significantly between seasons, which can be attributed to factors such as ripening and the structural properties of the skin cell walls [6]. In the first vintage season, the MeJ + Ur-treated grapes showed a higher concentration of 2-O-methyl-fucose, arabinose, and fucose while displaying a lower concentration of Kdo compared to the control grapes. No differences were recorded concerning the other monosaccharide compounds; thus, no variations in total monosaccharide content were observed.
In the first vintage season studied, Martínez-Lapuente et al. [26] found a lower concentration of Kdo in MeJ-treated grapes compared to control grapes.
However, in the 2020 season, no differences in inmonosaccharide content were observed between the control and MeJ + Ur-treated grapes, indicating that the foliar treatment did not affect the monosaccharide composition of grapes during this season. The different effects of MeJ + Ur foliar treatment on the monosaccharide concentration of Tempranillo grapes can be attributed to the season-dependent nature of elicitor effects [24,39]. The absence of differences in glucose concentration between the control and MeJ + Ur-treated grapes can be explained by the insignificant cell wall remodeling induced by the elicitor in the two seasons studied, as observed by Martínez-Lapuente et al. [26] following Tempranillo grapevine foliar treatment with MeJ. When plants are exposed to elicitors, they initiate a response that involves the accumulation of phenolic compounds, the depositing of callose in the cell wall, or the formation of lignin polymers to reinforce the skin cell wall [14]. Callose contains a high proportion of glucose [26]. However, the in MeJ + Ur-treated samples an increase in glucose content was not observed in either of the seasons studied. Hemicellulosic fractions are mainly composed of xyloglucans, mannans, and xylans. Xylose residues come from xyloglucans, mannose is derived from mannans, and hemicelluloses are present in the pericarp of grapes [40,41]. As was the case with glucose content, there were no differences in mannose and xylose content between the MeJ + Ur-treated samples and the control samples. Martínez-Lapuente et al. [26] observed that foliar treatment with MeJ did not induce any changes in the content of the major pectic monosaccharides in Tempranillo cell walls. Overall, foliar treatment with MeJ + Ur did not affect the concentration of monosaccharides in the grapes, which is consistent with the results reported in the literature for Tempranillo grapes following MeJ treatment [7]. Therefore, MeJ + Ur did not exhibit a synergetic effect on the biosynthesis of grape monosaccharides. Additionally, MeJ + Ur foliar treatment did not modify the polysaccharide composition of grapes. However, total polysaccharide concentration was approximately three times higher in the 2020 grapes compared to the 2019 grapes, which can be attributed to climatic differences. Across all seasons and samples, the polysaccharides rich in arabinose and galactose (PRAG) constituted the main family (64–74%), followed by HL (16–28%), mannans (4–6%), and RGII (3–4%). This result also aligns with the findings of Martínez-Lapuente et al. [26]. None of the polysaccharide families displayed differences between treatments in grape composition. These results indicate that MeJ + Ur foliar treatment did not reinforce the strength of the grape skin cell wall, which is antithetical to what has been described in the literature for MeJ-treated Monastrell grapes [23,25].

3.3. Monosaccharide Composition and the Polysaccharide Families of Tempranillo Wines

Table 4 presents the monosaccharide and polysaccharide composition of the Tempranillo-derived wines. In the 2019 season, the wines exhibited higher concentrations of galactose, followed by galacturonic acid, mannose, arabinose, and glucose. This is in agreement with the results reported by Paladines-Quezada et al. [25], which showed that the main macromolecules in wines were PRAGs from berry cell walls and MP from yeast cell walls (in accordance with the monosaccharide composition of wines). Both wines contained rare sugars, namely, 2-O-methyl-fucose and 2-O-methyl-xylose, which serve as markers for RG-II [25,42]. Xylose was also present in the wines, indicating the solubilization of hemicellulose from grape cell walls [2]. No differences in the inmonosaccharide and polysaccharide concentrations were observed between the control and MeJ + Ur-treated wines. However, slight differences were observed in the grapes (Table 1). The absence of differences in the wines could be due to the fermentation process, which may have minimized the potential for differences [18]. As described by Martinez-Lapuente et al. [26] in their study on the effect of MeJ foliar treatment on Tempranillo vines, the total monosaccharide content was higher in the wines than in the grapes during both seasons studied.
In control wines RG-II accounted for 6.65%, MP for 20.43%, PRAG for 55.33%, and HL for 17.59% of the polysaccharide composition. Similar percentages were observed in the MeJ + Ur-treated wines, with RG-II accounting for 5.17%, MP accounting for 22.23%, PRAG accounting for 53.81% and HL accounting for 18.79%. Polysaccharides from Tempranillo grapes (RG-II, PRAG, and HL) represented 79.57% of the total of polysaccharides in the control wines and 77.77% of the total of polysaccharides in the MeJ + Ur-treated wines, which is in agreement with the figures described for Tempranillo wines in the literature [36]. Regarding the content of MP, no differences were observed between the control and MeJ + Ur-treated wine samples in both seasons (Table 4). This result is noteworthy as MP are primarily released by yeast, and the yeast strain used in the winemaking was the same for both the control group and MeJ + Ur-treated group. Martínez-Lapuente et al. [26] also described the effect of just MeJ treatment on the release of MP in wines. Likewise, they did not observe any differences in the PRAG and HL concentration between control and MeJ-treated wines in both seasons studied. To summarize, no differences in total polysaccharide content were found between the control and MeJ + Ur-treated wines in the 2019 season. In 2020, there was a slight variation in the distribution of monosaccharides in wines compared to the 2019 season. Galactose remained the monosaccharide with the highest concentration in both wines, followed by mannose, arabinose, glucose, and galacturonic acid. The control wines showed a higher concentration of 2-O-methyl-fucose, 2-O-methyl-xylose, apiose, fucose, and Kdo than the MeJ + Ur-treated wines. These results agree with those observed by Martínez-Lapuente et al. [26] in MeJ-treated wines in their second season studied, except for Kdo, which did not show any differences in the control wines. These differences in the monosaccharide concentrations of wines were relatively small, suggesting that the foliar application of MeJ + Ur did not significantly strengthen the skin cell wall of the Tempranillo grapes; therefore, the extraction of monosaccharides from grapes to wines was minimally affected. However, other studies have reported a strengthening of Monastrell grape cell walls due to MeJ treatment [24], resulting in greater difficulty in extracting saccharides from the skin cell wall [23,25]. Although the wines showed slight differences in the concentration of certain monosaccharides, the total monosaccharide contents of the control and MeJ + Ur-treated wines did not significantly differ, which is in agreement with what Martínez-Lapuente et al. [26] observed in their first vintage season studied for MeJ-treated wines. In addition, in 2020, the grapes did not show any differences concerning the monosaccharide concentration of control and MeJ + Ur treated grapes from MeJ + Ur (Table 3). Regarding the polysaccharide families, the distribution in control wines was as follows: RG-II represented 3.08% of the polysaccharides, MP represented 38.75%, PRAG represented 56.85%, and HL represented 1.32%. In the MeJ + Ur-treated wines, the percentages were as follows: RG-II accounted for 0.84%, MP for 33.39%, PRAG for 62.99%, and HL for 2.78%. The distribution of polysaccharide families varied significantly between vintages. In 2020, the percentage of MP was higher compared to 2019, whereas RG-II and HL content was lower in 2020 than in 2019. Polysaccharides from Tempranillo grapes represented 61.25% of the total polysaccharides in the control wines, whereas, in the MeJ + Ur-treated wines, this figure was 66.61%. The control wines showed a higher concentration of RG-II, which could be related to the higher concentration of 2-O-methyl-fucose, 2-O-methyl-xylose, and fucose in the control wines. Paladines-Quezada et al. [25] proposed that an increase in the rigidity of the Monastrell grape cell walls could hinder the extraction of RG-II. Consequently, MeJ + Ur treatment might have led to greater rigidity in the skin cell walls of the Tempranillo grapes in this vintage, as evidenced by the lower extraction of RG-II in the MeJ + Ur-treated wines compared to the control wines. The PRAG content in the control and MeJ + Ur-treated wines did not differ, which is consistent with previous observations in Monastrell wines obtained from grapevines treated solely with with MeJ [25], and Martínez-Lapuente et al. [26] also reported a lack of differences regarding polysaccharide families (except for RG-II) between control and MeJ-treated Tempranillo wines. Conversely, the MeJ + Ur-treated wines were characterized by a higher concentration of HL compared to the control wines. No differences were observed in MP, PRAG, and total polysaccharide content between the control and MeJ + Ur-treated wines. Therefore, a synergistic effect between MeJ and Ur regarding wine monosaccharides and polysaccharides was not observed.
The total monosaccharide and polysaccharide content in wines was higher in 2019 than in 2020. However, in grapes, the total monosaccharide and polysaccharide content was higher in 2020 compared to 2019. This can be attributed to skin cell wall polysaccharides contributing more to the total monosaccharides in the 2019 wines than those from the pulp [26]. This phenomenon occurs when berries are small, which can be explained by the higher recorded pre-harvest rainfall in 2020, which resulted in larger grape sizes compared to the 2019 vintage.

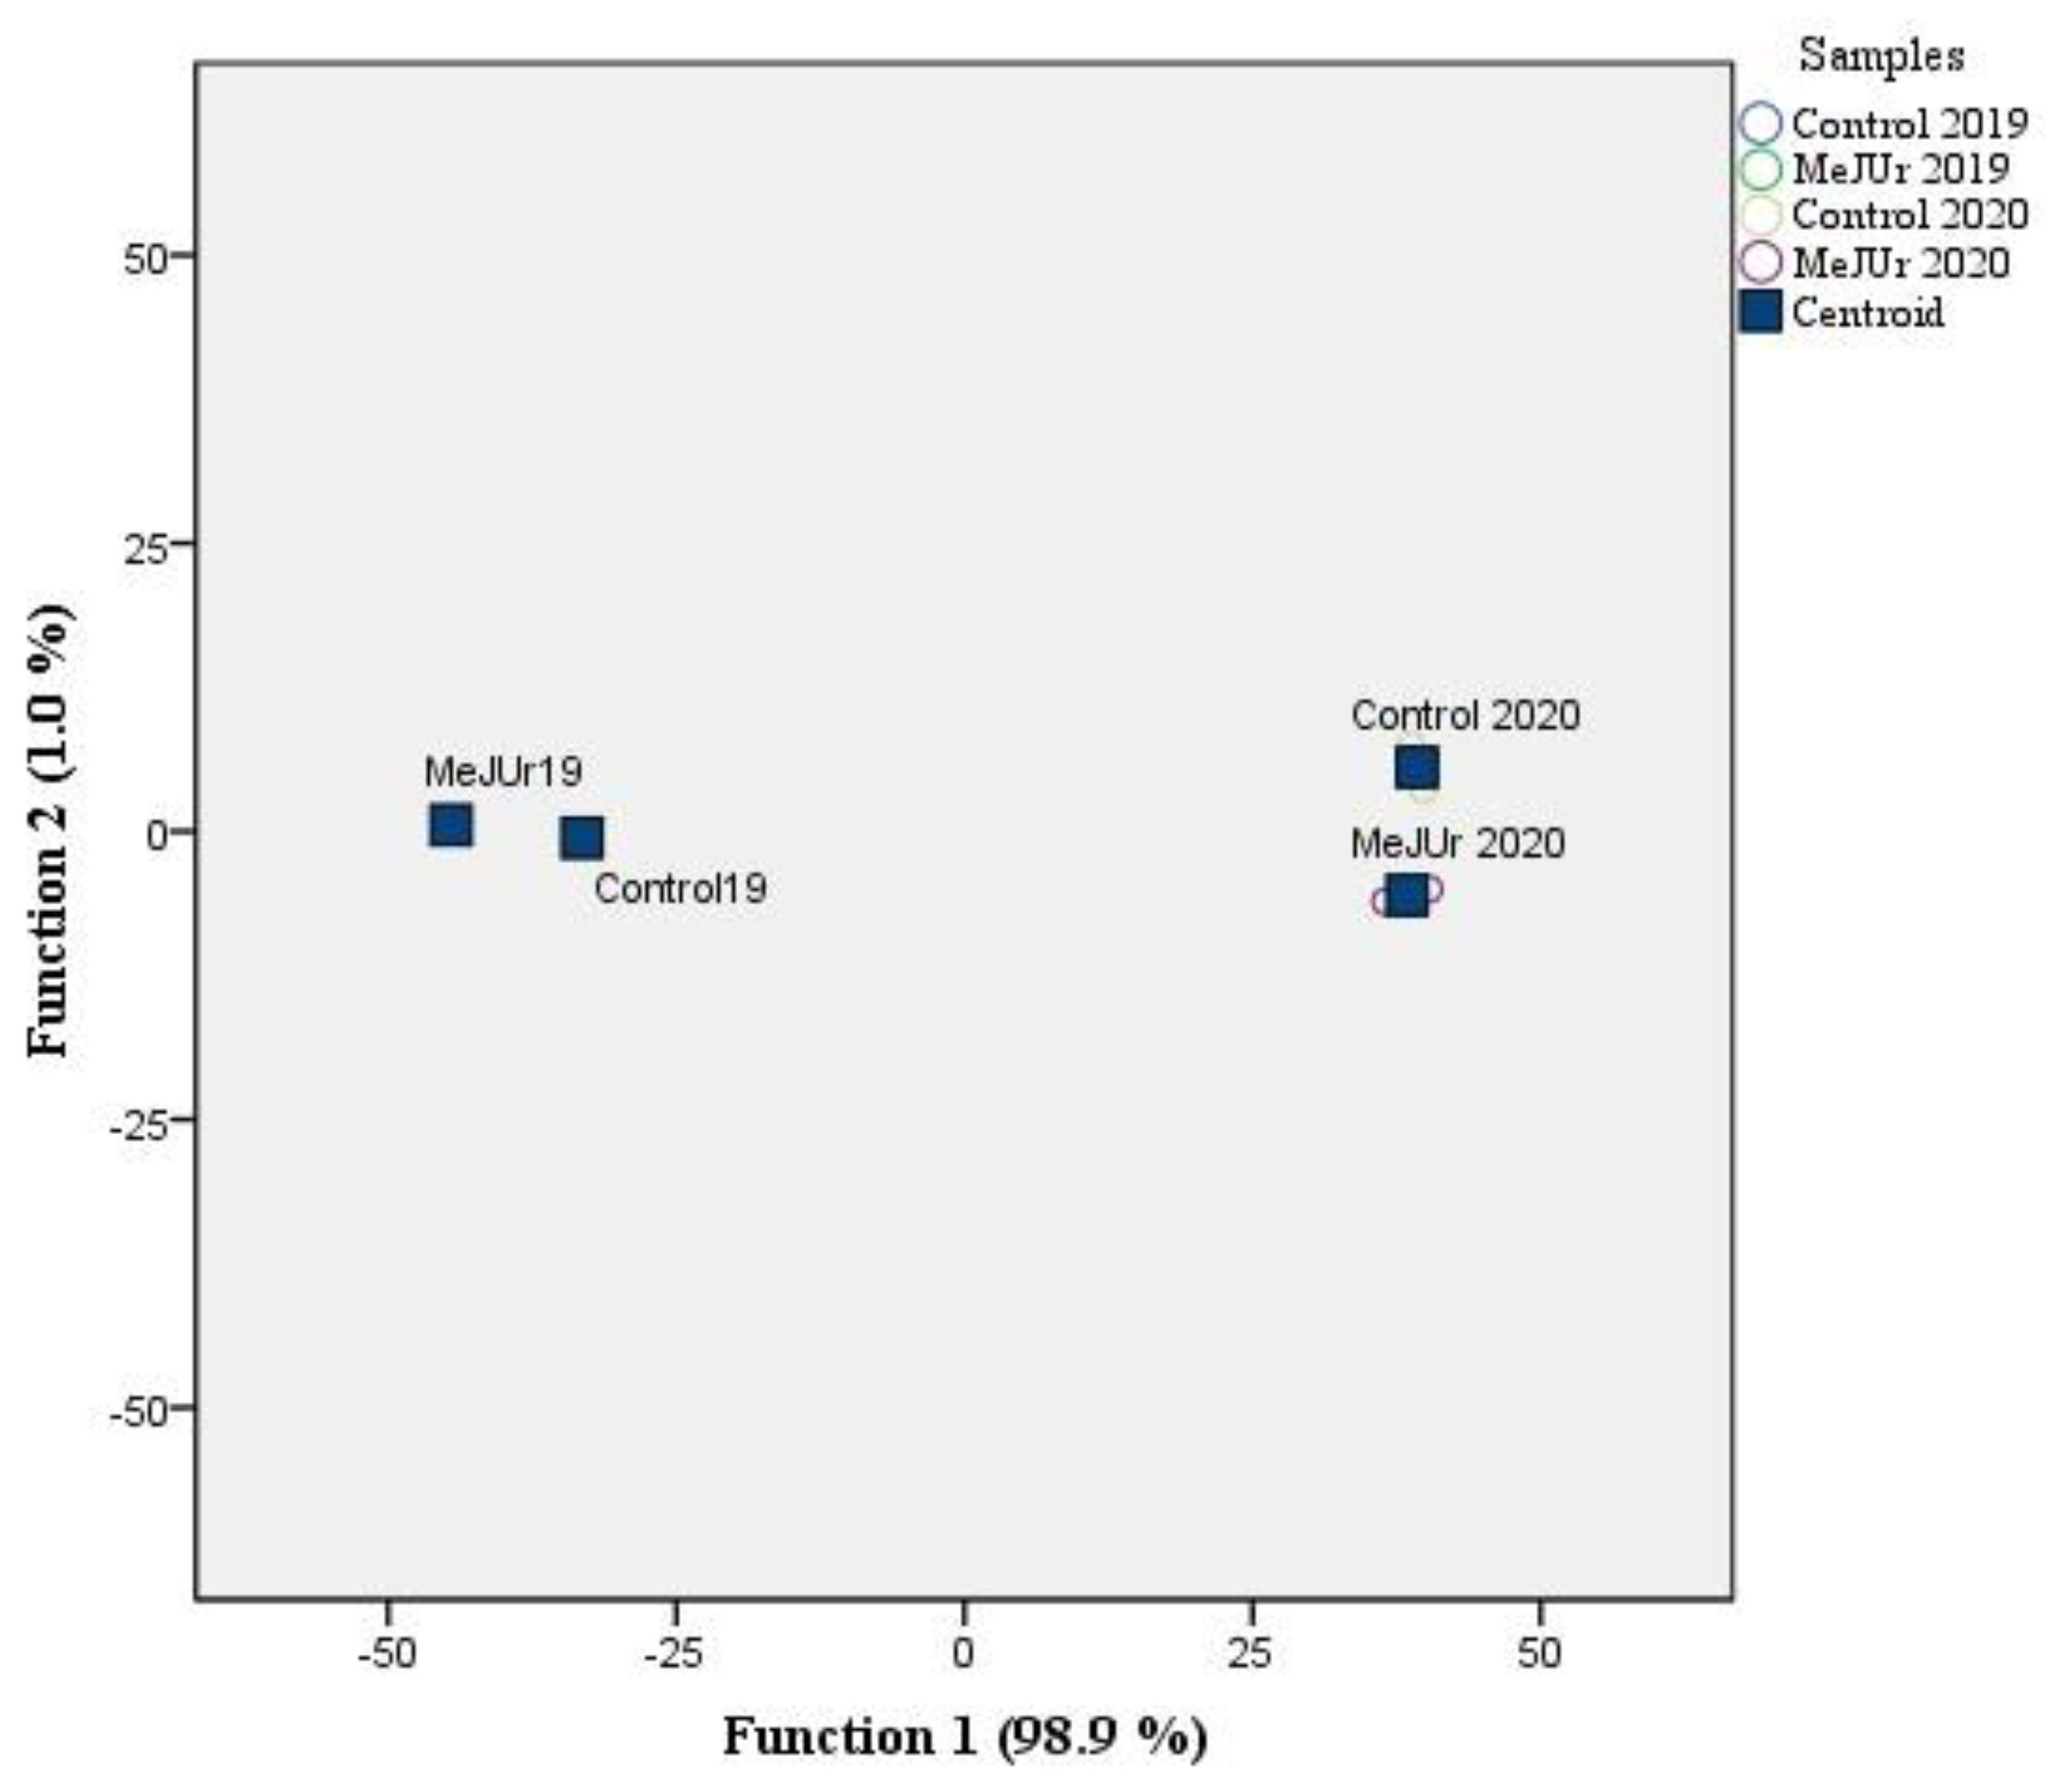
3.4. Multifactor Analysis of Variance of Monosaccharide Composition and the Polysaccharide Families of Tempranillo Grapes and Wines and Discriminant Analysis of Monosaccharide Compounds in Wines

A multifactor analysis was carried out the using general parameters data of grapes to study the impacts of treatment, season, and the interaction between these two factors (Table 5). It is noteworthy that the season effect was significant for all general parameters except for the YAN content in grapes. However, treatment had an effect on total phenols, ammonium and amino nitrogen, and the YAN concentration in grapes. This result is likely attributable to MeJ + Ur foliar treatment enhancing the biosynthesis of phenolic compounds and the accumulation of nitrogen in the grapes. The interaction between season and treatment significantly affected all general parameters studied in grapes, except for the weight of 100 berries, pH, malic acid, and total phenols, which are more influenced by the season.
Multifactor analysis of variance was carried out using the general parameter data of the wines to study the effect of treatment, season, and the interaction between these two factors (Table 6). The season had an effect on all of the general parameters of the wines, except for total acidity, volatile acidity, and YAN concentration. Nevertheless, the treatment only affected the YAN content in wines, as well as the total anthocyanins and color intensity of wines. Therefore, the foliar treatment of MeJ + Ur appears to have a slight influence on the wine’s quality. The interaction of these two factors was only significant for the YAN content of the wines.
Multifactor analysis of variance was conducted using monosaccharide and polysaccharide data to examine the impact of treatment, season, and the interaction between these two factors (Table 7). In grapes, the season had an effect on the concentration of all monosaccharides and polyssacharides. However, treatment only affected the concentration of aceric acid and xylose in grapes. The interaction between these factors had a significant impact on the contents of aceric acid, 2-O-methyl-fucose, and 2-O-methyl-xylose in grapes. In wines, the season also affected all of the monosaccharide compounds and polysaccharide families, except for aceric acid, mannose, and MP. Treatment only significantly impacted RG-II content. There was no significant interaction between these two factors for any compound. Therefore, as previously observed in the analytical data (Table 3 and Table 4), MeJ + Ur foliar treatment had a limited effect on the monosaccharide and polysaccharide concentration in Tempranillo grapes and wines.
To classify the different samples, a discriminant analysis was performed on monosaccharide compound data from both the control and MeJ + Ur-treated wines in the two consecutive vintages (Figure 1). Function 1 accounted for 98.9% of the variance, while function 2 accounted for 1.0% (total variance = 99.9%). The variables that contributed the most to the discriminant model were galacturonic acid, Kdo, and aceric acid in function 1, whereas in function 2, Kdo, 2-O-methyl-fucose, and aceric acid contributed the most. Wine samples were separated along function 1 according to a seasonal criterion, confirming the results observed in the multifactor analysis (Table 4). The control and MeJ + Ur-treated samples were located close to each other within each vintage, as the differences in monosaccharide composition observed in wines were minor (Table 4).

3.5. Sensory Analysis of Tempranillo Wines

Table 8 presents a sensory evaluation of the control and MeJ + Ur wines. Wines from both vintages achieved a total evaluation above or near to 72 points, which, according to the scale used, means they can be classified as “good”. In 2019, the wines only exhibited differences in persistence, with the control wines receiving higher scores than the MeJ + Ur-treated wines.
However, in 2020, the sensory evaluation of the wines revealed more pronounced differences. The MeJ + Ur-treated wines were characterized by a higher evaluation in terms of the frankness of smell, frankness and quality of taste, harmony, and overall evaluation compared to the control wines. Therefore, the foliar treatment applied during the 2020 season resulted in wines that showed better results following the sensory analysis than the control wines. Interestingly, although the monosaccharide and polysaccharide concentrations of the wines did not show intense differences compared to the control wines, the CI of the MeJ + Ur-treated wines in 2020 was higher than that of the control wines (Table 2).
In the multifactorial analysis of the sensory evaluation (Table 9), it was found that treatment had a greater impact than the season. Treatment significantly influenced the intensity, frankness, and quality of the olfactory phase, as well as the frankness and quality of gustatory phase, with the MeJ + Ur-treated wines obtaining higher scores in these aspects. On the other hand, the season only had an effect on cleanness, and in any case, the interaction between these two factors did not significantly affect the sensory analysis.

4. Conclusions

The effect of MeJ + Ur foliar treatment was found to be season-dependent. In the first season, a reduction in the alcohol content of the MeJ + Ur-treated wines was observed, which is an interesting finding for mitigating the effects of climate change, a major global issue. This study, in addition to being novel, provides valuable information in addressing this problem. Additionally, in the first season, treatment with MeJ + Ur led to an increase in certain monosaccharides in the grapes, while no significant differences were observed in the MeJ + Ur-treated wines compared to the control wines. However, in the second season, the grapes from grapevines treated with MeJ + Ur did not exhibit differences compared to the control grapes, whereas the MeJ + Ur-treated wines showed lower concentrations of certain monosaccharides and polysaccharides. Multifactor analysis of variance indicated that the season had the largest influence on the monosaccharide and polysaccharide content of the grapes and wines studied, whereas treatment had only a slight effect on these compounds. The discriminant analysis of wines showed that the separation of wines was based on the seasonal criterion rather than the treatment. Furthermore, all of the wines studied were classified as “good” in the sensory analysis, and the multifactor analysis of sensory data revealed that the MeJ + Ur-treated wines had higher overall evaluations than the control wines, but this difference was only significant in the second vintage. Further studies should be carried out to elucidate the effects of MeJ + Ur foliar treatment on the monosaccharide and polysaccharide content of grapes and wines.

Author Contributions

Conceptualization, T.G.-C., E.P.P.-Á., and B.A.; methodology, T.G.-C., E.P.P.-Á., B.A., and L.M.-L.; formal analysis, L.M.-L. and M.L.R.-M.; investigation, M.G.-L. and L.L.T.-D.; resources, T.G.-C., E.P.P.-Á., and L.M.-L.; data curation, M.G.-L.; writing—original draft preparation, M.G.-L.; writing—review and editing, L.M.-L., T.G.-C., M.L.R.-M., L.L.T.-D., E.P.P.-Á., Z.G., and B.A.; funding acquisition, T.G.-C., E.P.P.-Á., B.A., and L.M.-L. All authors have read and agreed to the published version of the manuscript.

Funding

This work was made possible by funding from the Ministerio de Ciencia, Innovación y Universidades through the Project RTI2018-096549-B-I00.

Institutional Review Board Statement

Not applicable.

Informed Consent Statement

Not applicable.

Data Availability Statement

All data generated or analyzed during this study are included in the published paper.

Acknowledgments

M.G.-L. thanks to the Universidad de La Rioja for her Margarita Salas contract funding by the Ministerio de Universidades and the European Union (Financed by the European Union-Next GenerationEU). E.P.P.-Á. thanks the Ministerio de Ciencia, Innovación y Universidades for her Juan de la Cierva-Incorporación contract.

Conflicts of Interest

The authors declare no conflict of interest.

References

  1. Unterkofler, J.; Muhlack, R.A.; Jeffery, D.W. Processes and purposes of extraction of grape components during winemaking: Current state and perspectives. Appl. Microbiol. Biotechnol. 2020, 104, 4737–4755. [Google Scholar] [CrossRef]
  2. Doco, T.; Quellec, N.; Moutounet, M.; Pellerin, P. Polysaccharide patterns during the aging of Carignan noir red wines. Am. J. Enol. Vitic. 1999, 50, 25–32. [Google Scholar] [CrossRef]
  3. Ortega-Regules, A.; Romero-Cascales, I.; Ros-García, J.M.; López-Roca, J.M.; Gómez-Plaza, E. A first approach towards the relationship between grape skin cell-wall composition and anthocyanin extractability. Anal. Chim. Acta 2006, 563, 26–32. [Google Scholar] [CrossRef]
  4. Brandão, E.; Silva, M.S.; García-Estévez, I.; Williams, P.; Mateus, N.; Doco, T.; de Freitas, V.; Soares, S. The role of wine polysaccharides on salivary protein-tannin interaction: A molecular approach. Carbohydr. Polym. 2017, 177, 77–85. [Google Scholar] [CrossRef]
  5. Jouquand, C.; Ducruet, V.; Giampaoli, P. Partition coefficients of aroma compounds in polysaccharide solutions by the phase ratio variation method. Food Chem. 2004, 85, 467–474. [Google Scholar] [CrossRef]
  6. Martínez-Lapuente, L.; Guadalupe, Z.; Ayestarán, B. Properties of Wine Polysaccharides. In Pectins—Extraction, Purification, Characterization and Applications; IntechOpen: Rijeka, Croatia, 2020. [Google Scholar] [CrossRef] [Green Version]
  7. Martínez-Lapuente, L.; Guadalupe, Z.; Ayestarán, B.; Ortega-Heras, M.; Pérez-Magariño, S. Changes in polysaccharide composition during sparkling wine making and aging. J. Agric. Food Chem. 2013, 61, 12362–12373. [Google Scholar] [CrossRef] [PubMed]
  8. Mira de Orduña, R. Climate change associated effects on grape and wine quality and production. Food Res. Int. 2010, 43, 1844–1855. [Google Scholar] [CrossRef]
  9. Gutiérrez, N.; López-De-silanes, L.; Escott, C.; Loira, I.; del Fresno, J.M.; Suárez-Lepe, J.A.; Morata, A. The effect of elicitors and canopy management in the chemical composition of vitis vinifera red varieties in warm and hot areas in spain. Agronomy 2021, 11, 1192. [Google Scholar] [CrossRef]
  10. van Leeuwen, C.; Destrac-Irvine, A. Modified grape composition under climate change conditions requires adaptations in the vineyard. Oeno One 2017, 51, 147–154. [Google Scholar] [CrossRef]
  11. Frioni, T.; VanderWeide, J.; Palliotti, A.; Tombesi, S.; Poni, S.; Sabbatini, P. Foliar vs. soil application of Ascophyllum nodosum extracts to improve grapevine water stress tolerance. Sci. Hortic. 2021, 277, 109807. [Google Scholar] [CrossRef]
  12. Portu, J.; López-Alfaro, I.; Gómez-Alonso, S.; López, R.; Garde-Cerdán, T. Changes on grape phenolic composition induced by grapevine foliar applications of phenylalanine and urea. Food Chem. 2015, 180, 171–180. [Google Scholar] [CrossRef]
  13. Portu, J.; López, R.; Santamarıá, P.; Winterhalter, P.; Garde-Cerdán, T. Methyl jasmonate effect on Tempranillo (Vitis vinifera L.) grape phenolic content: A 2-year study. Acta Hortic. 2017, 1188, 127–134. [Google Scholar] [CrossRef]
  14. Benhamou, N. Elicitor-induced plant defence pathways. Trends Plant Sci. 1996, 1, 233–240. [Google Scholar] [CrossRef]
  15. Ruiz-García, Y.; Gómez-Plaza, E. Elicitors: A tool for improving fruit phenolic content. Agriculture 2013, 3, 33–52. [Google Scholar] [CrossRef] [Green Version]
  16. D’Onofrio, C.; Matarese, F.; Cuzzola, A. Effect of methyl jasmonate on the aroma of Sangiovese grapes and wines. Food Chem. 2018, 242, 352–361. [Google Scholar] [CrossRef] [PubMed]
  17. Gómez-Plaza, E.; Mestre-Ortuño, L.; Ruiz-García, Y.; Fernández-Fernández, J.I.; López-Roca, J.M. Effect of benzothiadiazole and methyl jasmonate on the volatile compound composition of Vitis vinifera L. Monastrell grapes and wines. Am. J. Enol. Vitic. 2012, 63, 394–401. [Google Scholar] [CrossRef]
  18. Portu, J.; López, R.; Santamaría, P.; Garde-Cerdán, T. Methyl jasmonate treatment to increase grape and wine phenolic content in Tempranillo and Graciano varieties during two growing seasons. Sci. Hortic. 2018, 240, 378–386. [Google Scholar] [CrossRef]
  19. Portu, J.; Santamaría, P.; López-Alfaro, I.; López, R.; Garde-Cerdán, T. Methyl jasmonate foliar application to tempranillo vineyard improved grape and wine phenolic content. J. Agric. Food Chem. 2015, 63, 2328–2337. [Google Scholar] [CrossRef] [PubMed]
  20. Garde-Cerdán, T.; Portu, J.; López, R.; Santamaría, P. Effect of methyl jasmonate application to grapevine leaves on grape amino acid content. Food Chem. 2016, 203, 536–539. [Google Scholar] [CrossRef]
  21. Gil-Muñoz, R.; Giménez-Bañón, M.J.; Moreno-Olivares, J.D.; Paladines-Quezada, D.F.; Bleda-Sánchez, J.A.; Fernández-Fernández, J.I.; Parra-Torrejón, B.; Ramírez-Rodríguez, G.B.; Delgado-López, J.M. Effect of methyl jasmonate doped nanoparticles on nitrogen composition of monastrell grapes and wines. Biomolecules 2021, 11, 1631. [Google Scholar] [CrossRef]
  22. Gil-Muñoz, R.; Bautista-Ortín, A.B.; Ruiz-García, Y.; Fernández-Fernández, J.I.; Gómez-Plaza, E. Improving phenolic and chromatic characteristics of monastrell, merlot and syrah wines by using methyl jasmonate and benzothiadiazole. Oeno One 2017, 51, 17–27. [Google Scholar] [CrossRef] [Green Version]
  23. Apolinar-Valiente, R.; Ruiz-García, Y.; Williams, P.; Gil-Muñoz, R.; Gómez-Plaza, E.; Doco, T. Preharvest Application of Elicitors to Monastrell Grapes: Impact on Wine Polysaccharide and Oligosaccharide Composition. J. Agric. Food Chem. 2018, 66, 11151–11157. [Google Scholar] [CrossRef] [PubMed]
  24. Paladines-Quezada, D.F.; Moreno-Olivares, J.D.; Fernández-Fernández, J.I.; Bautista-Ortín, A.B.; Gil-Muñoz, R. Influence of methyl jasmonate and benzothiadiazole on the composition of grape skin cell walls and wines. Food Chem. 2019, 277, 691–697. [Google Scholar] [CrossRef] [PubMed]
  25. Paladines-Quezada, D.F.; Gil-Muñoz, R.; Apolinar-Valiente, R.; Williams, P.; Fernández-Fernández, J.I.; Doco, T. Effect of applying elicitors to Vitis vinifera L. cv. Monastrell at different ripening times on the complex carbohydrates of the resulting wines. Eur. Food Res. Technol. 2022, 248, 2369–2381. [Google Scholar] [CrossRef]
  26. Martínez-Lapuente, L.; Garde-Cerdan, T.; Pérez-Álvarez, E.P.; Guadalupe, Z.; Parra-Torrejón, B.; Ayestarán, B. Foliar applications to vines of methyl jasmonate and nanoparticles doped with methyl jasmonate: Impact on grape and wine polysaccharide composition. OENO One 2023, 57, 1–14. [Google Scholar] [CrossRef]
  27. Pérez-Álvarez, E.P.; Ramírez-Rodríguez, G.B.; Carmona, F.J.; Martínez-Vidaurre, J.M.; Masciocchi, N.; Guagliardi, A.; Garde-Cerdán, T.; Delgado-López, J.M. Towards a more sustainable viticulture: Foliar application of N-doped calcium phosphate nanoparticles on Tempranillo grapes. J. Sci. Food Agric. 2021, 101, 1307–1313. [Google Scholar] [CrossRef]
  28. Garde-Cerdán, T.; López, R.; Portu, J.; González-Arenzana, L.; López-Alfaro, I.; Santamaría, P. Study of the effects of proline, phenylalanine, and urea foliar application to Tempranillo vineyards on grape amino acid content. Comparison with commercial nitrogen fertilisers. Food Chem. 2014, 163, 136–141. [Google Scholar] [CrossRef]
  29. Pérez-Álvarez, E.P.; Garde-Cerdán, T.; García-Escudero, E.; Martínez-Vidaurre, J.M. Effect of two doses of urea foliar application on leaves and grape nitrogen composition during two vintages. J. Sci. Food Agric. 2017, 97, 2524–2532. [Google Scholar] [CrossRef]
  30. Garde-Cerdán, T.; Portu, J.; López, R.; Santamaría, P. Effect of foliar applications of proline, phenylalanine, urea, and commercial nitrogen fertilizers on stilbene concentrations in tempranillo musts and wines. Am. J. Enol. Vitic. 2015, 66, 542–547. [Google Scholar] [CrossRef]
  31. Garde-Cerdán, T.; Gutiérrez-Gamboa, G.; López, R.; Rubio-Bretón, P.; Pérez-Álvarez, E.P. Influence of foliar application of phenylalanine and urea at two doses to vineyards on grape volatile composition and amino acids content. Vitis J. Grapvine Res. 2018, 57, 137–141. [Google Scholar] [CrossRef]
  32. Garde-Cerdán, T.; Santamaría, P.; Rubio-Bretón, P.; González-Arenzana, L.; López-Alfaro, I.; López, R. Foliar application of proline, phenylalanine, and urea to Tempranillo vines: Effect on grape volatile composition and comparison with the use of commercial nitrogen fertilizers. LWT-Food Sci. Technol. 2015, 60, 684–689. [Google Scholar] [CrossRef]
  33. OIV. Compendium of Internationals Methods of Wine and Must Analysis; OIV: Paris, France, 2009. [Google Scholar]
  34. Ribéreau-Gayon, P.; Stonestreet, E. Determination of anthocyanins in red wine. Bull. Soc. Chim. Fr. 1965, 9, 2649–2652. [Google Scholar]
  35. Canalejo, D.; Guadalupe, Z.; Martínez-Lapuente, L.; Ayestarán, B.; Pérez-Magariño, S. Optimization of a method to extract polysaccharides from white grape pomace by-products. Food Chem. 2021, 365, 130445. [Google Scholar] [CrossRef]
  36. Ayestarán, B.; Guadalupe, Z.; León, D. Quantification of major grape polysaccharides (Tempranillo v.) released by maceration enzymes during the fermentation process. Anal. Chim. Act. 2004, 513, 29–39. [Google Scholar] [CrossRef]
  37. Guadalupe, Z.; Martínez-Pinilla, O.; Garrido, A.; Carrillo, J.D.; Ayestarán, B. Quantitative determination of wine polysaccharides by gas chromatography-mass spectrometry (GC-MS) and size exclusion chromatography (SEC). Food Chem. 2012, 131, 367–374. [Google Scholar] [CrossRef]
  38. OIV. OIV Standard for International Wine and Spirituous Beverages of Vitivinicultural Origin Competitions. Annex 3.1. Score Sheet. 2009 In RESOLUTION OIV/CONCOURS 332A/2009. Available online: https://www.oiv.int/public/medias/4661/oiv-concours-332a-2009-en.pdf (accessed on 31 January 2023).
  39. Garde-Cerdán, T.; Gutiérrez-Gamboa, G.; Baroja, E.; Rubio-Bretón, P.; Pérez-Álvarez, E.P. Influence of methyl jasmonate foliar application to vineyard on grape volatile composition over three consecutive vintages. Food Res. Int. 2018, 112, 274–283. [Google Scholar] [CrossRef]
  40. Arnous, A.; Meyer, A.S. Quantitative prediction of cell wall polysaccharide composition in grape (Vitis vinifera L.) and apple (Malus domestica) skins from acid hydrolysis monosaccharide profiles. J. Agric. Food Chem. 2009, 57, 3611–3619. [Google Scholar] [CrossRef] [PubMed]
  41. Minjares-Fuentes, R.; Femenia, A.; Garau, M.C.; Candelas-Cadillo, M.G.; Simal, S.; Rossell’o, C. Ultrasound-assisted extraction of hemicelluloses from grape pomace using response surface methodology. Carbohydr. Polym. 2016, 138, 180–191. [Google Scholar] [CrossRef]
  42. Pellerin, P.; Doco, T.; Vidal, S.; Williams, P.; Brillouet, J.M.; O’Neill, M.A. Structural characterization of red wine rhamnogalacturonan II. Carbohydr. Res. 1996, 290, 183–197. [Google Scholar] [CrossRef]
Figure 1. Discriminant analysis of the monosaccharide concentration of Tempranillo wines (control and MeJ + Ur) from both vintages studied.
Nitrogen 04 00019 g001
Table 1. General parameters of control and MeJ + Urea (MeJ + Ur)-treated Tempranillo grapes from a vineyard located in La Rioja, Spain, in 2019 and 2020.
20192020
ControlMeJ + UrControlMeJ + Ur
Weight of 100 berries (g)113.68 ± 11.07131.52 ± 25.19199.57 ± 7.27222.83 ± 25.25
°Brix24.7 ± 0.7 b23.0 ± 0.6 a22.3 ± 0.9 a22.8 ± 0.7 a
Potential alcohol (% v/v)14.63 ± 0.49 b13.48 ± 0.42 a12.97 ± 0.6313.29 ± 0.51
pH3.83 ± 0.053.80 ± 0.043.76 ± 0.013.71 ± 0.03
Total acidity (g/L) *4.61 ± 0.115.11 ± 0.364.12 ± 0.333.83 ± 0.13
Glu (g/L)120.18 ± 5.13 b107.43 ± 3.65 a107.31 ± 4.54113.11 ± 6.85
Fru (g/L)129.68 ± 4.84 b119.25 ± 2.52 a109.11 ± 6.53115.75 ± 3.49
Malic acid (g/L)2.24 ± 0.242.45 ± 0.461.21 ± 0.08 a1.42 ± 0.05 b
Ammonium nitrogen (mg N/L)78.00 ± 8.22 a118.30 ± 6.54 b121.16 ± 3.52109.72 ± 8.59
Amino nitrogen (mg N/L)118.51 ± 14.33 a237.60 ± 30.51 b152.53 ± 14.33149.89 ± 7.06
YAN (mg N/L)196.51 ± 21.18 a355.90 ± 31.59 b273.69 ± 17.69259.61 ± 13.65
Total phenols (mg/L)1185.33 ± 72.31 a1351.83 ± 29.05 b541.60 ± 64.02578.17 ± 82.64
* As g/L of tartaric acid. All parameters are listed with their standard deviation (n = 3). For each season and parameter, different letters indicate significant differences between the samples (p ≤ 0.05). Glu: glucose; Fru: fructose; YAN: yeast assimilable nitrogen.
Table 2. General parameters of control and MeJ + Urea (MeJ + Ur)-treated wines derived from Tempranillo grapes in 2019 and 2020.
20192020
ControlMeJ + UrControlMeJ + Ur
Alcohol (% v/v)13.97 ± 0.31 b12.80 ± 0.40 a12.47 ± 0.7012.53 ± 0.81
pH3.96 ± 0.073.94 ± 0.133.66 ± 0.083.73 ± 0.13
Total acidity (g/L) *4.27 ± 0.10 b3.92 ± 0.06 a4.43 ± 0.594.02 ± 0.23
V A 1 (g/L) **0.23 ± 0.020.20 ± 0.010.22 ± 0.020.22 ± 0.03
Lactic acid (g/L)1.32 ± 0.101.28 ± 0.120.86 ± 0.07 a1.05 ± 0.09 b
YAN 2 (mg N/L)18.06 ± 2.08 a67.89 ± 8.90 b30.36 ± 0.5439.34 ± 10.65
T P 3 (mg/L)2440.83 ± 123.162460.73 ± 124.741116.63 ± 106.691333.47 ± 153.38
T A 4 (mg/L)1117.33 ± 69.971289.67 ± 102.00130.99 ± 20.13168.00 ± 18.68
CI 518.27 ± 1.0319.01 ± 1.146.05 ± 0.55 a8.62 ± 1.10 b
TPI 670.83 ± 3.4773.32 ± 5.0036.82 ± 4.0544.73 ± 5.62
1 V A: Volatile acidity, 2 YAN: yeast assimilable nitrogen, 3 T P: Total phenols, 4 T A: Total anthocyanins, 5 CI: Color index, 6 TPI: Total polyphenol index. * As g/L tartaric acid. ** As g/L acetic acid. All parameters are listed with their standard deviation (n = 3). For each season and compound, different letters indicate significant differences between the samples (p ≤ 0.05).
Table 3. Monosaccharide and polysaccharide composition of both the control and treated (MeJ + Ur) grapes derived from Tempranillo grapevines (mg/L) in 2019 and 2020 in a vineyard located in La Rioja, Spain.
20192020
ControlMeJ + UrControlMeJ + Ur
* 2-Omefu0.04 ± 0.00 a0.06 ± 0.00 b0.14 ± 0.020.12 ± 0.03
* 2-OmeXyl0.02 ± 0.000.03 ± 0.000.08 ± 0.000.06 ± 0.01
Apiose0.01 ± 0.000.01 ± 0.000.04 ± 0.000.03 ± 0.01
Arabinose1.59 ± 0.01 a2.45 ± 0.45 b4.74 ± 0.354.60 ± 0.81
Rhamnose0.60 ± 0.080.69 ± 0.101.66 ± 0.141.33 ± 0.27
Fucose0.02 ± 0.00 a0.03 ± 0.00 b0.05 ± 0.000.05 ± 0.01
Xylose0.36 ± 0.080.29 ± 0.020.84 ± 0.070.72 ± 0.06
Mannose0.72 ± 0.000.73 ± 0.051.46 ± 0.231.63 ± 0.37
Galactose5.72 ± 0.246.31 ± 1.7116.34 ± 0.9016.01 ± 2.71
Galacturonic acid2.81 ± 0.042.66 ± 0.5211.32 ± 0.599.17 ± 2.04
Glucose5.91 ± 1.104.92 ± 1.763.93 ± 0.753.09 ± 0.66
Glucuronic acid0.53 ± 0.090.61 ± 0.031.52 ± 0.161.52 ± 0.19
Kdo0.03 ± 0.00 b0.02 ± 0.01 a0.04 ± 0.000.05 ± 0.02
* TOTAL ms18.38 ± 1.1418.81 ± 2.5542.16 ± 1.4038.37 ± 3.59
* RGII0.44 ± 0.020.46 ± 0.031.23 ± 0.071.03 ± 0.15
* Mannans0.72 ± 0.000.73 ± 0.051.46 ± 0.231.63 ± 0.37
* PRAG8.10 ± 0.449.59 ± 1.9723.09 ± 1.1122.51 ± 3.25
* HL2.44 ± 0.152.14 ± 0.5110.02 ± 0.628.11 ± 1.96
* PST11.70 ± 0.4712.92 ± 2.0335.80 ± 1.2933.28 ± 3.82
* 2-Omefu: 2-O-methyl-fucose; 2-OmeXyl: 2-O-methyl-xylose; Kdo: 3-deoxy-D-manooctuIosonic acid; Total ms: total monosaccharides; RGII: rhamnogalacturonans-II; PRAG: polysaccharide rich in arabinose and galactose; HL: homogalacturonans; PST: total polysaccharides. For each compounds different letter indicate significant differences among treatments according to ANOVA test (p ≤ 0.05). Absence of letters indicate no differences (p > 0.05).
Table 4. Monosaccharide and polysaccharide compositions of the control and treated (MeJ + Ur) Tempranillo wines (mg/L) in the 2019 and 2020 vintage seasons.
20192020
ControlMeJ + UrControlMeJ + Ur
Aceric acid0.01 ± 0.000.23 ± 0.31N.DN.D.
* 2-Omefu19.37 ± 5.6815.87 ± 3.095.38 ± 0.56 b1.46 ± 0.07 a
* 2-OmeXyl9.29 ± 4.098.33 ± 1.773.28 ± 0.53 b0.71 ± 0.28 a
Apiose3.88 ± 2.294.25 ± 0.261.51 ± 0.32 b0.58 ± 0.01 a
Arabinose323.71 ± 116.87326.83 ± 62.11206.14 ± 45.21170.41 ± 2.78
Rhamnose161.22 ± 73.57149.11 ± 19.0243.00 ± 2.5933.68 ± 12.39
Fucose7.56 ± 2.287.05 ± 1.291.84 ± 0.29 b0.93 ± 0.15 a
Xylose22.77 ± 7.2424.72 ± 4.569.84 ± 2.0617.14 ± 4.83
Mannose542.37 ± 171.67653.40 ± 154.28582.66 ± 108.83510.12 ± 75.20
Galactose1103.55 ± 427.711176.07 ± 219.70623.81 ± 75.30746.23 ± 59.81
Galacturonic acid641.24 ± 73.45695.02 ± 100.6968.28 ± 4.3055.60 ± 12.37
Glucose178.68 ± 53.51203.25 ± 14.3878.06 ± 13.9975.66 ± 27.47
Glucuronic acid35.15 ± 17.4256.76 ± 16.3124.96 ± 7.6423.97 ± 6.13
Kdo11.61 ± 5.029.32 ± 5.001.42 ± 0.03 b0.45 ± 0.08 a
* TOTAL ms3060.41 ± 487.143330.21 ± 294.541650.18 ± 140.871636.94 ± 101.80
* RGII176.64 ± 35.68152.01 ± 24.6146.34 ± 1.31 b12.78 ± 1.40 a
* MP542.37 ± 171.67653.40 ± 154.28582.66 ± 108.83510.12 ± 75.20
* PRAG1468.67 ± 466.281581.82 ± 247.49854.90 ± 29.56962.60 ± 68.95
* HL466.91 ± 91.56552.20 ± 93.7319.89 ± 0.78 a42.44 ± 11.94 b
* PST2654.58 ± 506.502939.43 ± 307.311503.79 ± 79.801527.94 ± 147.76
* 2-Omefu: 2-O-methyl-fucose; 2-OmeXyl: 2-O-methyl-xylose; Kdo: 3-deoxy-D-manooctuIosonic acid; Total ms: total monosaccharides; RGII: rhamnogalacturonans-II; MP: mannoproteins; PRAG: polysaccharide rich in arabinose and galactose; HL: homogalacturonans; PST: total polysaccharides. For each compounds different letter indicate significant differences among treatments according to ANOVA test (p ≤ 0.05). Absence of letters indicate no differences (p > 0.05). N.D: Not detected.
Table 5. Percentage of variance attributable to season, treatment, and the interaction of both (season × treatment) regarding each general parameter studied in the Tempranillo grapes obtained from a vineyard in La Rioja, Spain.
Grapes
Season (%)Treatment (%)S × T (%)Residual (%)
Weight of 100 berries (g)84.91 ***4.570.0810.44
°Brix37.14 *7.5223.77 *31.57
Potential alcohol (% v/v)37.19 *7.5423.87 *31.40
pH59.44 **10.320.9329.31
Total acidity69.25 ***0.9813.82 *15.96
Glu7.156.6947.61 *38,55
Fru52.17 **1.3026.24 *20.29
Malic acid82.20 ***3.420.0014.38
Total phenols95.10 ***1.95 *0.802.15
Ammonium nitrogen (mg N/L)22.86 **15.93 **51.19 ***10.02
Amino nitrogen (mg N/L)8.37 *39.41 ***43.06 ***9.16
YAN (mg N/L)0.6437.20 ***53.02 ***9.14
Glu: glucose; Fru: fructose; YAN: yeast assimilable nitrogen. Statistically significant at: * p ≤ 0.05, ** p ≤ 0.01, *** p ≤ 0.001; the absence of * indicates that the factor had no significant effect (p > 0.05).
Table 6. Percentage of variance attributable to season, treatment, and the interaction of both (season × treatment) regarding each general parameter studied in the Tempranillo wines.
Wines
Season (%)Treatment (%)S × T (%)Residual (%)
Alcohol % v/v32.56 *12.6215.8738.95
pH67.95 **0.712.1929.15
Total acidity3.6432.790.2463.32
V.A. 11.9617.655.4574.95
Lactic acid73.46 ***3.178.1615.21
YAN 24.4658.45 ***28.20 ***8.88
TP 395.70 ***0.890.622.79
TA 497.69 ***0.96 *0.400.94
CI 595.39 ***2.04 *0.631.93
TPI 691.49 ***2.530.695.29
1 V A: Volatile acidity, 2 YAN: yeast assimilable nitrogen, 3 T P: Total phenols, 4 T A: Total anthocyanins, 5 CI: Color index, 6 TPI: Total polyphenol index. Statistically significant at: * p ≤ 0.05, ** p ≤ 0.01, *** p ≤ 0.001; the absence of * indicates that the factor had no significant effect (p > 0.05).
Table 7. Percentage of variance attributable to season, treatment, and the interaction of both (season × treatment) regarding the monosaccharide and polysaccharide content of Tempranillo grapes and wines.
GrapesWines
Season (%)Treatment (%)S × T (%)Season (%)Treatment (%)S × T (%)
Aceric acid83.31 ***5.17 *5.17 *14.1111.5211.52
* 2-Omefu84.47 ***0.376.17 *82.79 ***5.640.02
* 2-OmeXyl88.62 ***1.974.39 *72.93 ***4.891.02
Apiose85.32 ***4.113.0968.81 **0.603.25
Arabinose87.09 ***1.613.1257.83 **0.821.16
Rhamnose84.45 ***1.665.1777.02 ***0.650.01
Fucose80.39 ***0.335.7887.08 ***1.270.10
Xylose91.31 ***3.83 *0.3152.35 **10.663.56
Mannose82.45 ***0.940.804.520.6314.37
Galactose93.08 ***0.020.1954.83 *2.520.16
Galacturonic acid91.09 ***2.131.6296.84 ***0.110.29
Glucose45.25 ***10.510.0881.35 ***0.771.14
Glucuronic acid94.64 ***0.200.1840.54 *9.3411.21
Kdo45.73 ***2.6411.2571.30 **2.080.34
* TOTAL ms95.45 ***0.570.9189.83 ***0.610.75
* RGII92.26 ***1.532.4689.54 ***4.17 *0.10
* Mannans in grapes MP in wines82.45 ***0.940.804.520.6314.37
* PRAG94.25 ***0.100.5265.33 *2.100.00
* HL90.43 ***2.381.2793.68 ***1.190.40
* PST96.55 ***0.080.6884.82 ***1.230.88
* 2-Omefu: 2-O-methyl-fucose; 2-OmeXyl: 2-O-methyl-xylose; Kdo: 3-deoxy-D-manooctuIosonic acid; Total ms: total monosaccharides; RGII: rhamnogalacturonans-II; MP: mannoproteins; PRAG: polysaccharide rich in arabinose and galactose; HL: homogalacturonans; PST: total polysaccharides. Statistically significant at: * p ≤ 0.05, ** p ≤ 0.01, *** p ≤ 0.001; the absence of * indicates that the factor had no significant effect (p > 0.05).
Table 8. Sensory evaluation of the control (C) and methyl jasmonate plus urea (MeJ + Ur)-treated Tempranillo wines one month later of the end of malolactic fermentation.
20192020
ControlMeJ + UrControlMeJ + Ur
AppearenceCleanness3.71 ± 0.743.63 ± 0.853.97 ± 0.824.13 ± 0.67
Color7.87 ± 1.267.67 ± 1.187.63 ± 1.547.87 ± 1.71
AromaIntensity5.81 ± 1.406.33 ± 1.095.81 ± 1.186.32 ± 0.98
Frankness3.81 ± 0.954.13 ± 0.683.50 ± 0.88 a4.10 ± 0.79 b
Quality11.74 ± 2.1312.33 ± 1.3011.25 ± 1.8811.94 ± 1.59
TasteIntensity5.81 ± 1.176.07 ± 0.835.56 ± 1.445.81 ± 1.08
Frankness3.81 ± 0.604.07 ± 0.693.56 ± 0.76 a4.03 ± 0.71 b
Quality15.29 ± 2.2815.97 ± 1.7714.44 ± 2.40 a15.71 ± 2.10 b
Persistence6.13 ± 0.88 b5.63 ± 0.81 a5.75 ± 1.085.90 ± 0.91
Harmony 8.68 ± 0.708.97 ± 0.568.56 ± 0.80 a8.97 ± 0.66 b
Total valuation 72.65 ± 8.6674.80 ± 4.6770.03 ± 8.41 a74.77 ± 8.23 b
For each sensory attribute, different letters indicate significant differences between treatments (p ≤ 0.05). The absence of letters indicates no differences (p > 0.05). The mean values (n = 3) are shown with their standard deviation.
Table 9. Multifactorial analysis of the sensory evaluation of the control (C) and methyl jasmonate plus urea (MeJ + Ur)-treated Tempranillo wines one month later of the end of malolactic fermentation.
TreatmentSeasonTreatment xSeason
ControlMeJ + Ur20192020
ViewCleanness3.843.883.67 a4.05 bN.S.
Color7.757.777.777.75N.S.
SmellIntensity5.81 a6.33 b6.076.07N.S.
Frankness3.65 a4.12 b3.973.80N.S.
Quality11.50 a12.13 b12.0411.59N.S.
TasteIntensity5.685.945.945.68N.S.
Frankness3.68 a4.05 b3.943.80N.S.
Quality14.86 a15.84 b15.6315.07N.S.
Persistence5.945.775.885.83N.S.
Harmony 8.62 a8.97 b8.828.77N.S.
Total valuation 71.34 a74.79 b73.7272.40N.S.
For each sensory attribute different, letters indicate significant differences between samples (p ≤ 0.05). The absence of letters indicates no differences (p > 0.05). N.S., not significant (p > 0.05).
Disclaimer/Publisher’s Note: The statements, opinions and data contained in all publications are solely those of the individual author(s) and contributor(s) and not of MDPI and/or the editor(s). MDPI and/or the editor(s) disclaim responsibility for any injury to people or property resulting from any ideas, methods, instructions or products referred to in the content.

