
Using the Haney Soil Test to Predict Nitrogen Requirements in Winter Wheat (Triticum aestivum L.)


Abstract
:1. Introduction
2. Materials and Methods
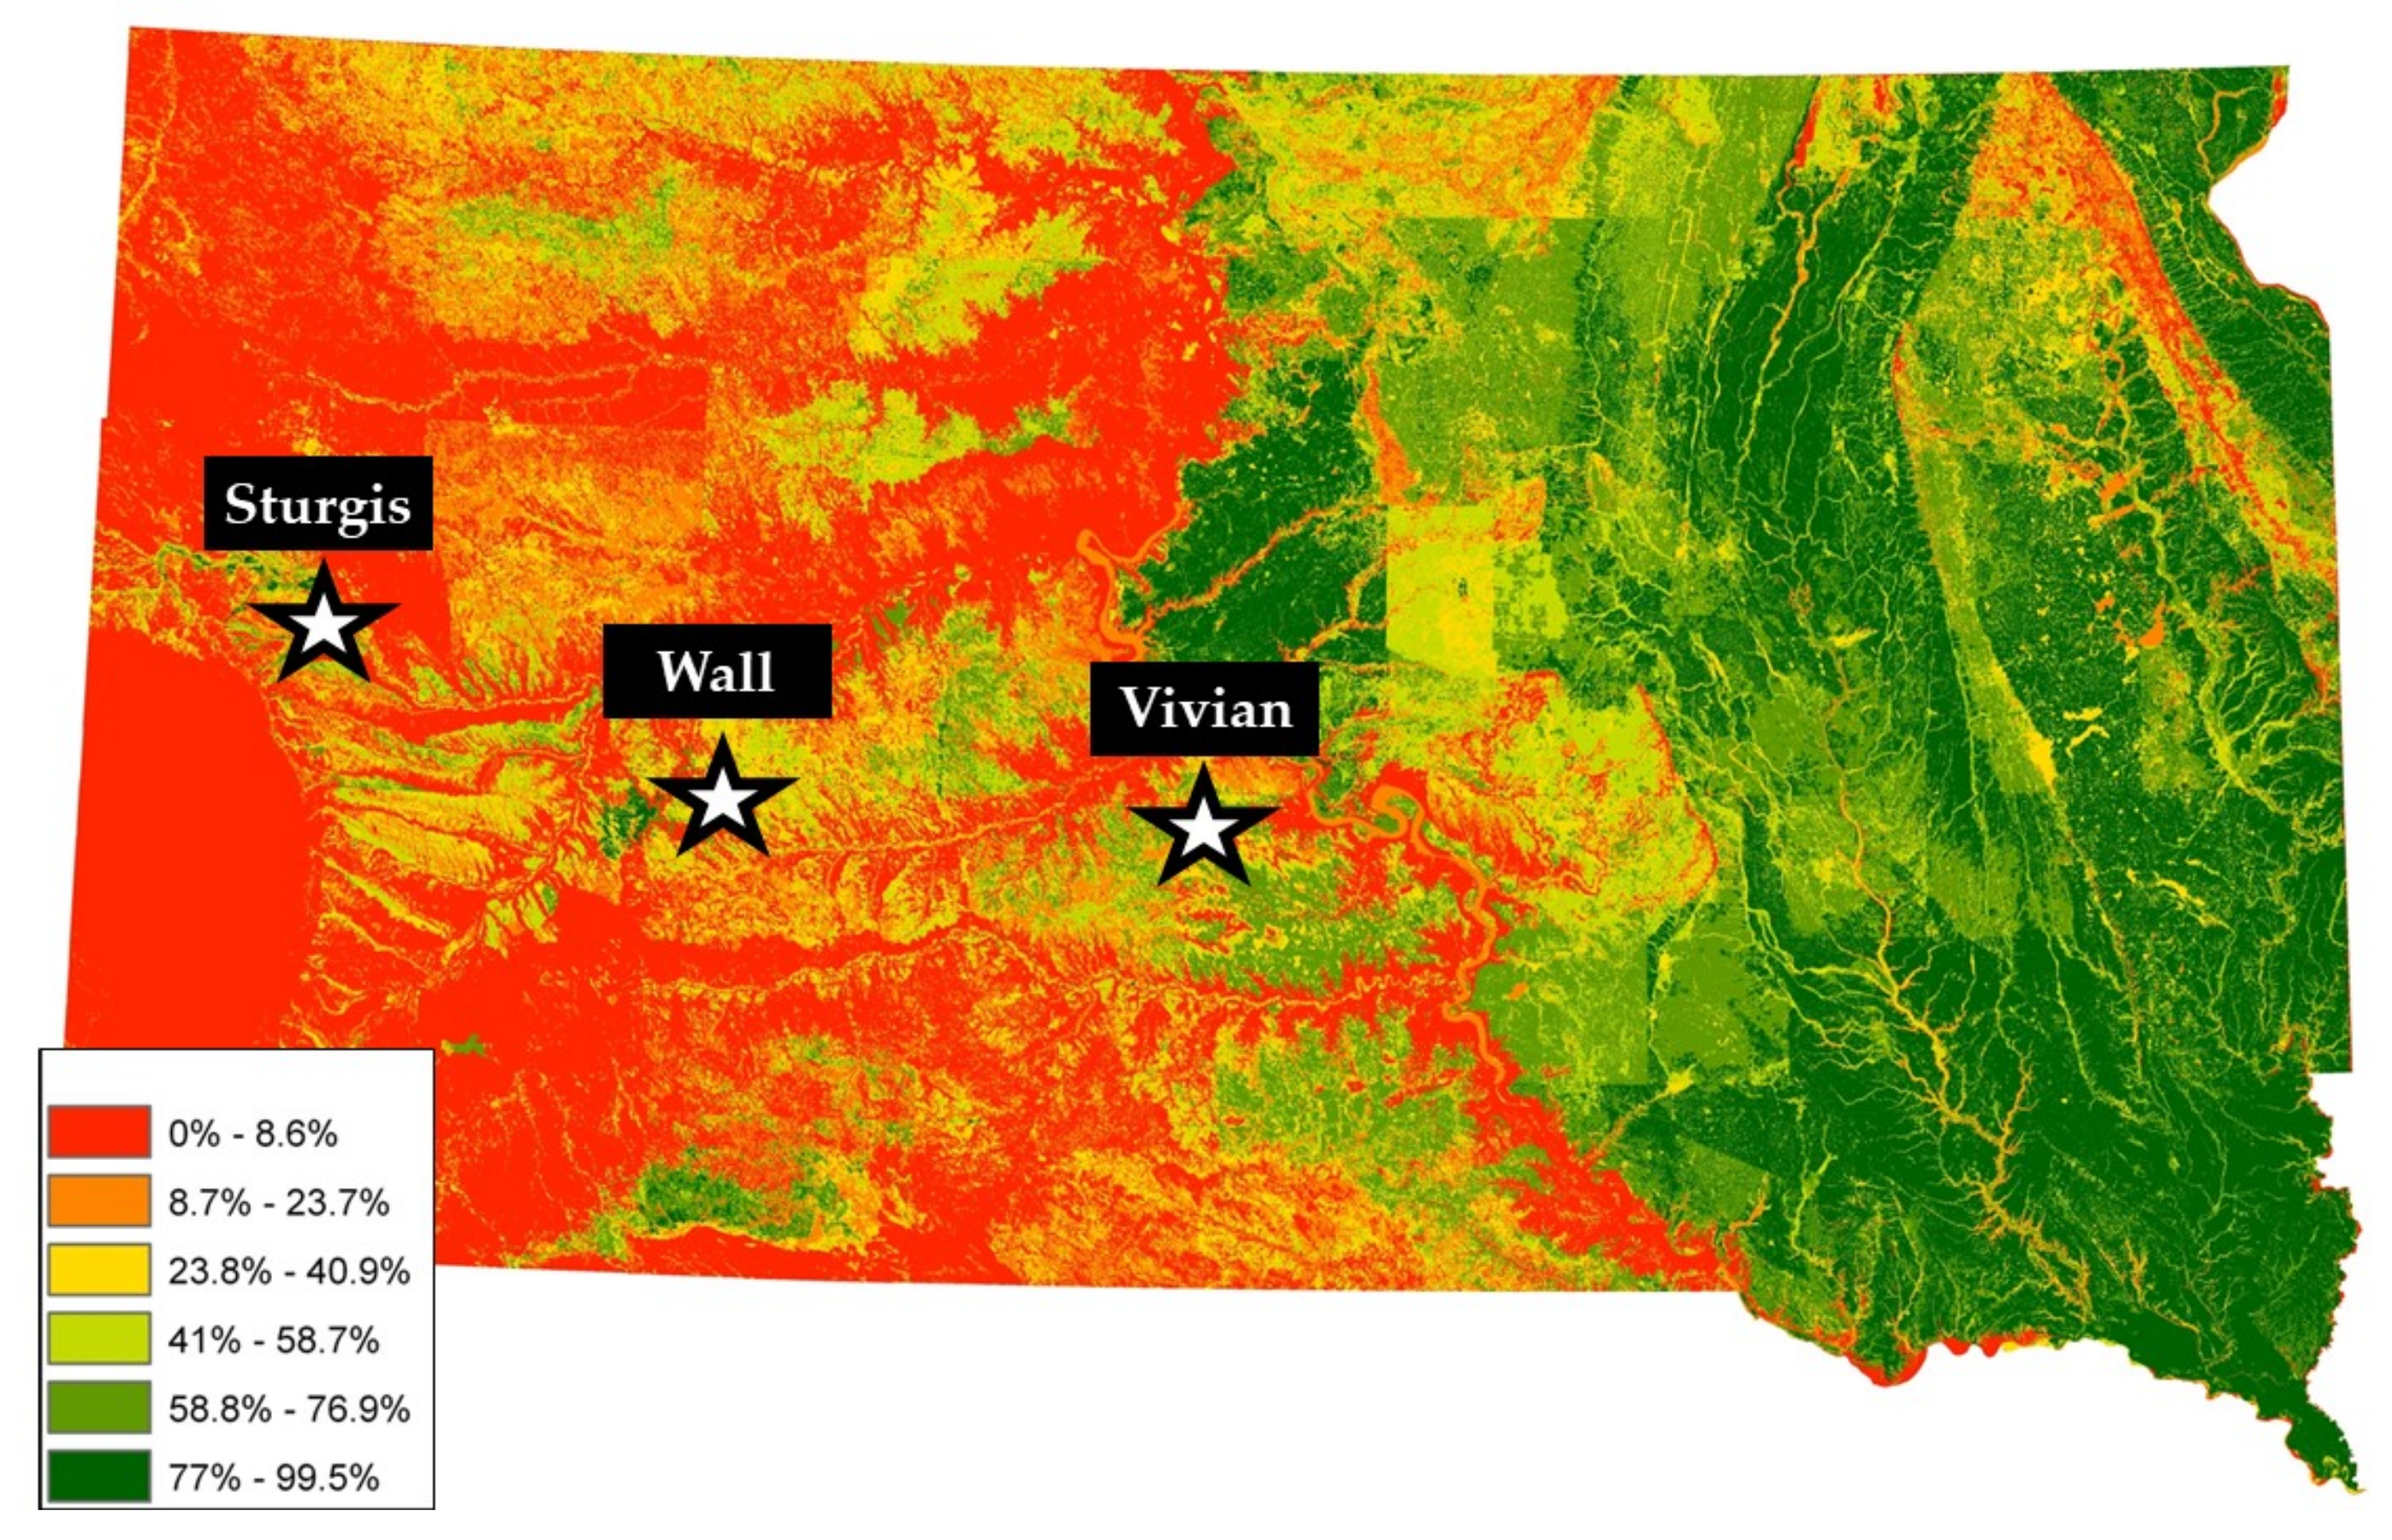
2.1. Experimental Design and Setup
2.2. Soil Sampling and Haney N Recommendations
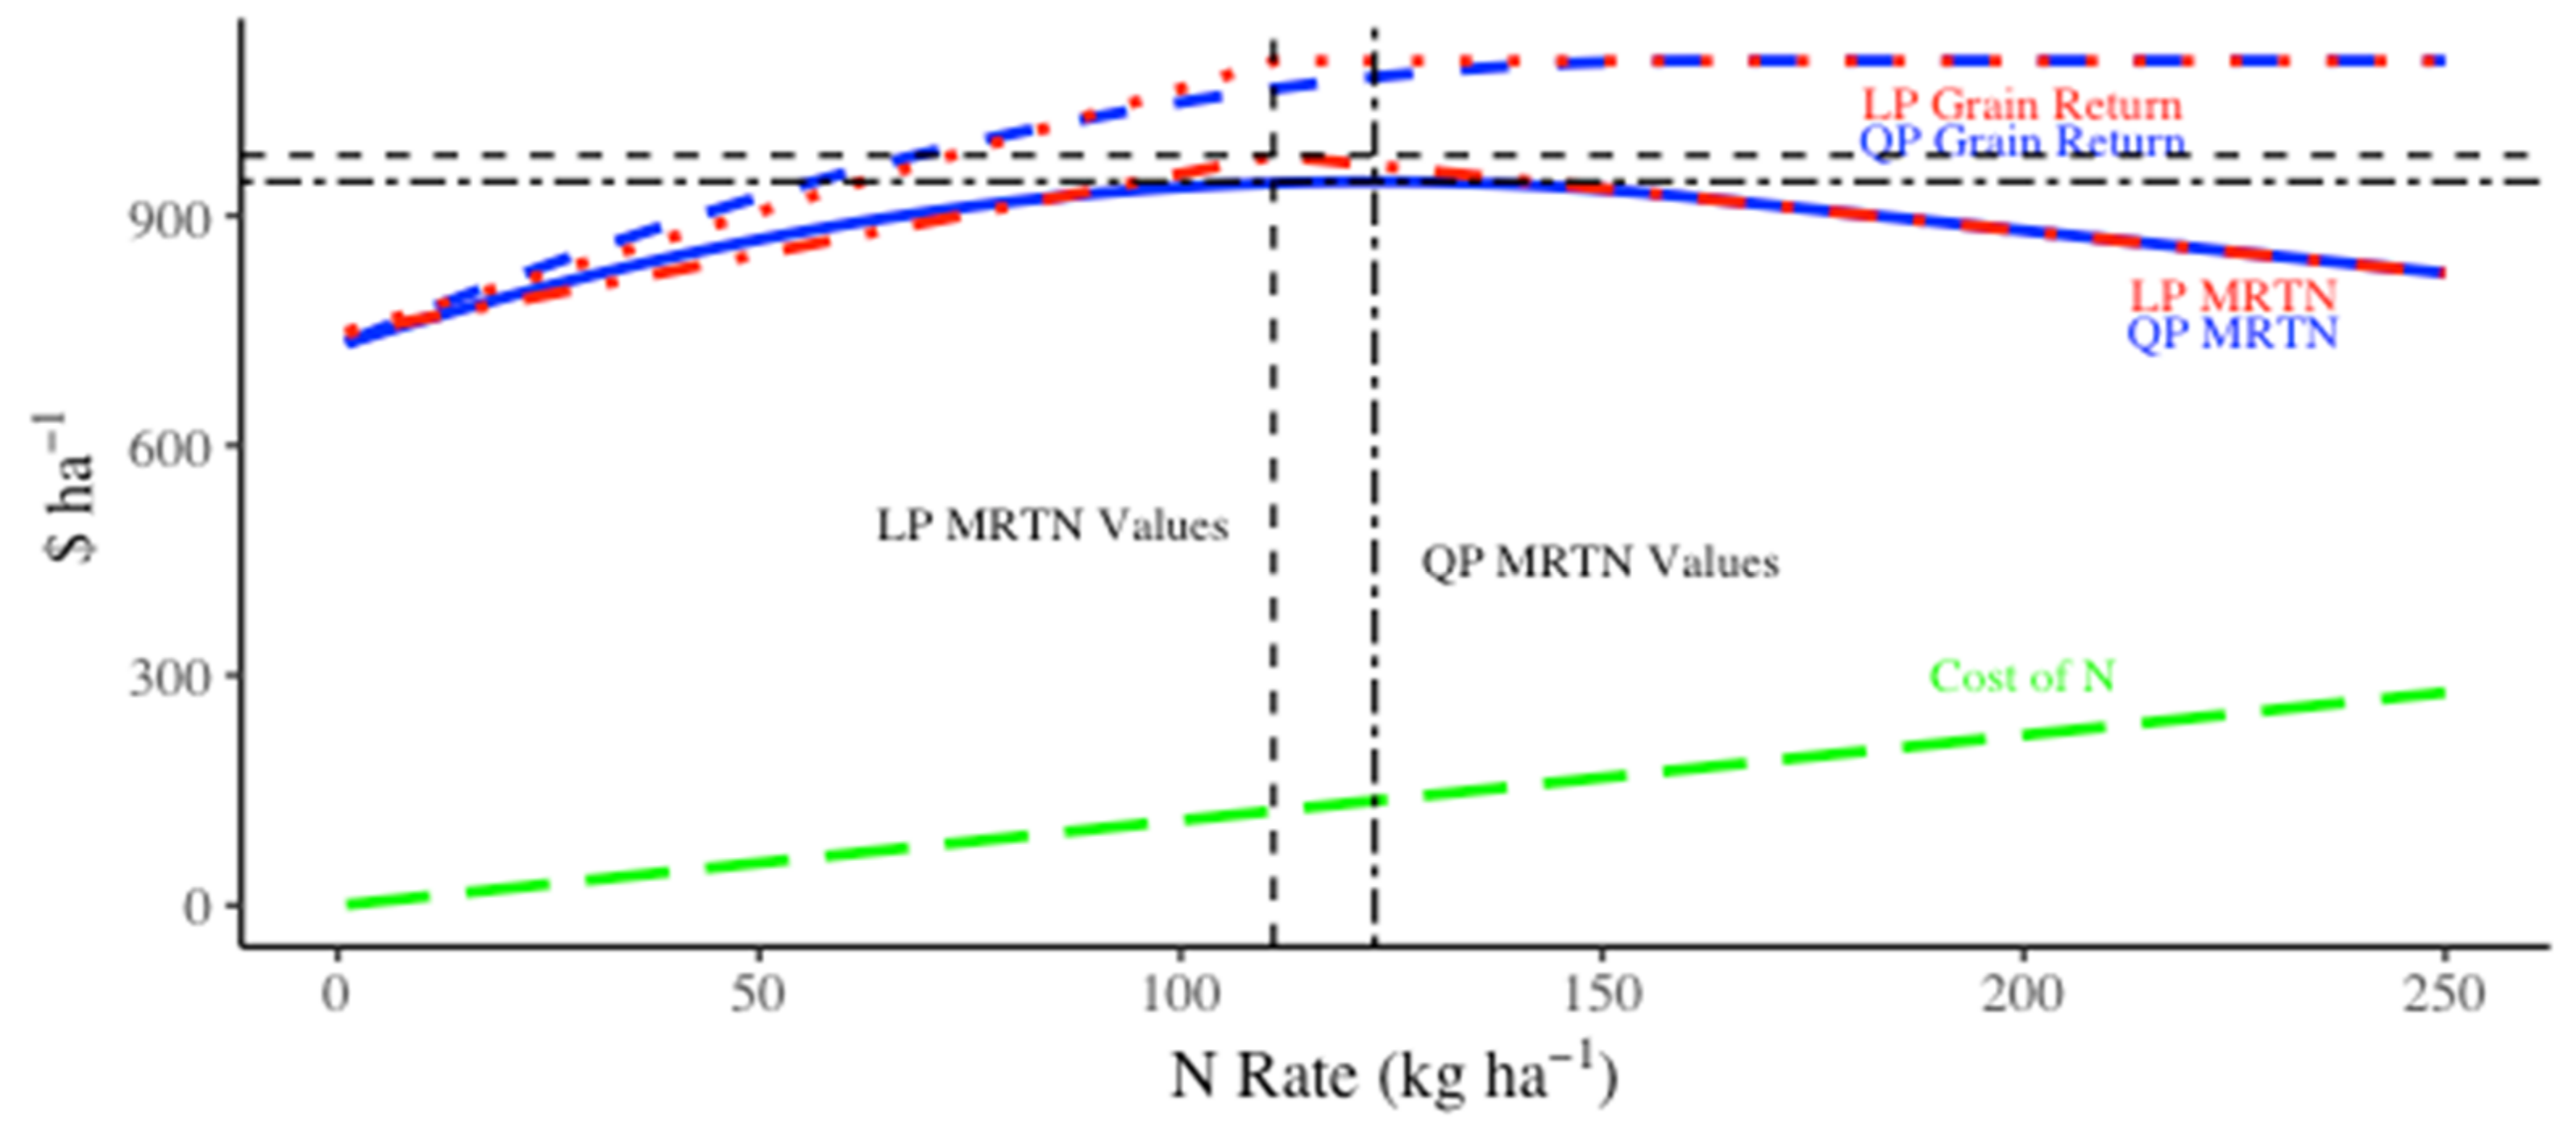
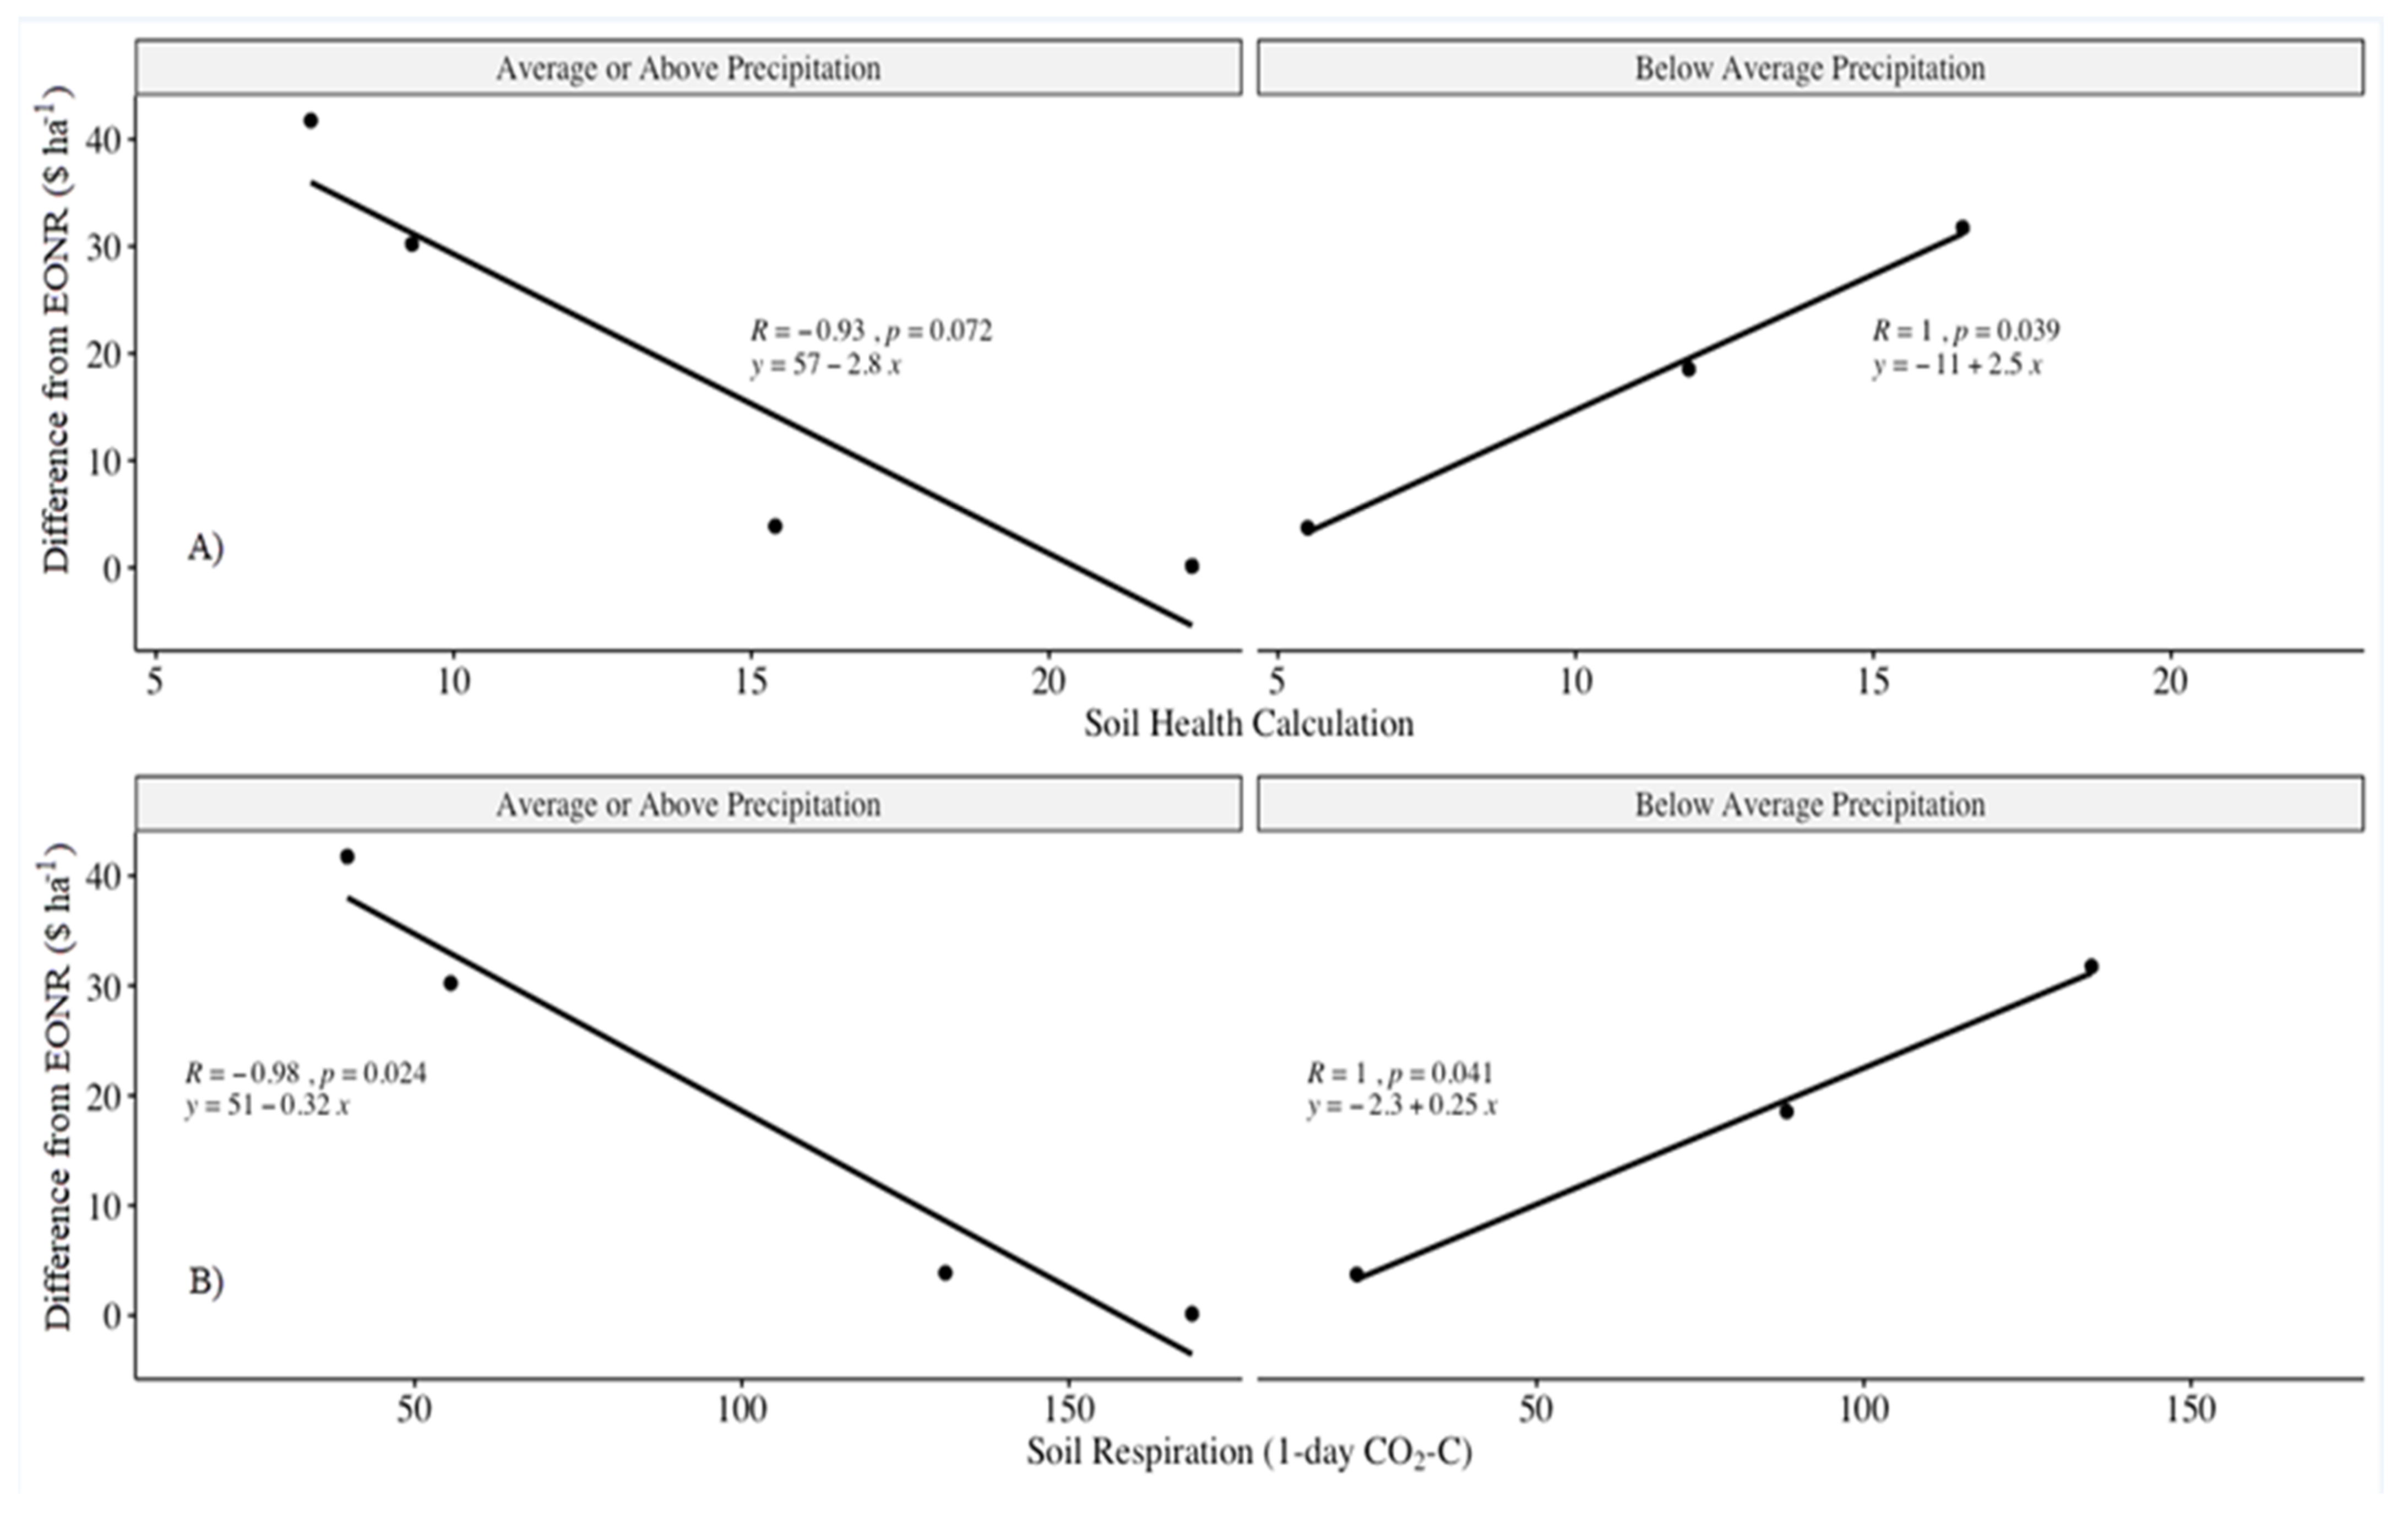
3. Results and Discussion
4. Conclusions
Author Contributions
Funding
Institutional Review Board Statement
Informed Consent Statement
Data Availability Statement
Acknowledgments
Conflicts of Interest
References
- Gu, B.; van Grinsven, H.J.; Lam, S.K.; Oenema, O.; Sutton, M.A.; Mosier, A.; Chen, D. A credit system to solve agricultural nitrogen pollution. Innovation 2021, 2, 100079. [Google Scholar] [CrossRef] [PubMed]
- Harindintwali, J.D.; Zhou, J.; Muhoza, B.; Wang, F.; Herzberger, A.; Yu, X. Integrated eco-strategies towards sustainable carbon and nitrogen cycling in agriculture. J. Environ. Manag. 2021, 293, 112856. [Google Scholar] [CrossRef] [PubMed]
- Wan, X.; Wu, W.; Shah, F. Nitrogen fertilizer management for mitigating ammonia emission and increasing nitrogen use efficiencies by 15N stable isotopes in winter wheat. Sci. Tot. Environ. 2021, 790, 147587. [Google Scholar] [CrossRef] [PubMed]
- Sawyer, J.; Nafziger, E.; Randall, G.; Bundy, L.; Rehm, G.; Joern, B. Concepts and rationale for regional nitrogen rate guidelines for corn. PM 2015. Iowa State Univ. -Univ. Ext. Ames Iowa 2006, 28. [Google Scholar]
- Yost, M.A.; Pound, C.A.; Creech, J.E.; Cardon, G.E.; Pace, M.G.; Kitchen, B.; Nelson, M.; Russell, K. Nitrogen requirements of first-year small grains after alfalfa. Soil Sci. Soc. Am. J. 2021, 85, 1698–1709. [Google Scholar] [CrossRef]
- Haney, R.L.; Hons, F.M.; Sanderson, M.A.; Franzluebbers, A.J. A rapid procedure for estimating nitrogen mineralization in manured soil. Biol. Fert. Soils 2001, 33, 100–104. [Google Scholar] [CrossRef]
- Haney, R.; Brinton, W.; Evans, E. Estimating soil carbon, nitrogen, and phosphorus mineralization from short-term CO2 respiration. Commun. Soil Sci. Plant Anal. 2008, 39, 2706–2720. [Google Scholar] [CrossRef]
- Haney, R.L.; Haney, E.B.; Hossner, L.H.; Arnold, J.G. Modifications to the new soil extractant H3A-1: A multinutrient extractant. Commun. Soil Sci. Plant Anal. 2010, 41, 1513–1523. [Google Scholar] [CrossRef]
- Haney, R.L.; Franzluebbers, A.J.; Jin, V.L.; Johnson, M.V.; Haney, E.B.; White, M.J.; Harmel, R.L. Soil organic C:N vs. water-extractable organic C:N. Open J. Soil Sci. 2012, 2, 269–274. [Google Scholar] [CrossRef] [Green Version]
- Franzluebbers, A.J. Short-term C mineralization (aka the flush of CO2) as an indicator of soil biological health. CAB Reviews: Pers Agric. Vet. Sci. Nutr. Nat. Res. 2018, 13, 14. [Google Scholar] [CrossRef]
- Harmel, R.D.; Haney, R.L. Initial field evaluation of the agro-economic effects of determining nitrogen fertilizer rates with a recently-developed soil test methodology. Open J. Soil Sci. 2013, 3, 91–99. [Google Scholar] [CrossRef] [Green Version]
- Yost, M.A.; Veum, K.S.; Kitchen, N.R.; Sawyer, J.E.; Camberato, J.J.; Carter, P.R.; Ferguson, R.B.; Fernández, F.G.; Franzen, D.W.; Laboski, C.A.; et al. Evaluation of the Haney Soil Health Tool for corn nitrogen recommendations across eight Midwest states. J. Soil Water Conserv. 2018, 73, 587–592. [Google Scholar] [CrossRef] [Green Version]
- Large, E.C. Growth stages in cereals. Plant Patholog. 1954, 3, 128–129. [Google Scholar] [CrossRef]
- Graham, C.J.; Stockton, M. Winter wheat response to fertilizer type and timing in western South Dakota. Agron. J. 2019, 11, 1433–1440. [Google Scholar] [CrossRef]
- Gerwing, J.; Gelderman, R. Fertilizer Recommendations Guide—EC 750; United States Department of Agriculture: Brookings, SD, USA; Available online: http://agbiopubs.sdstate.edu/articles/EC750.pdf.
- Haney, R.L.; Haney, E.B.; Smith, D.R.; White, M.J. Estimating potential nitrogen mineralisation using the Solvita soil respiration system. Open J. Soil Sci. 2015, 5, 319–323. [Google Scholar] [CrossRef] [Green Version]
- Franzluebbers, A.J. Should soil testing services measure soil biological activity? Agric. Environ. Lett. 2016, 1, 150009. [Google Scholar] [CrossRef]
- Singh, S.; Jagadamma, S.; Yoder, D.; Yin, X.; Walker, F. Agroecosystem management responses to Haney soil health test in the southeastern United States. Soil Sci. Soc. Am. J. 2020, 84, 1705–1721. [Google Scholar] [CrossRef]
- Pan, W.L.; Kidwell, K.K.; McCracken, V.A.; Bolton, R.P.; Allen, M. Economically optimal wheat yield, protein and nitrogen use component responses to varying N supply and genotype. Front. Plant Sci. 2020, 10, 1790. [Google Scholar] [CrossRef]
- Schwalbert, R.A.; Amado, T.J.C.; Reimche, G.B.; Gebert, F. Fine-tuning of wheat (Triticum aestivum, L.) variable nitrogen rate by combining crop sensing and management zones approaches in southern Brazil. Precis. Agric. 2019, 20, 56–77. [Google Scholar] [CrossRef]
- Cerrato, M.E.; Blackmer, A.M. Comparison of Models for Describing Corn Yield Response to Nitrogen Fertilizer. Agron. J. 1990, 82, 132–143. [Google Scholar] [CrossRef] [Green Version]
- Fierer, N.; Schimel, J.P. A proposed mechanism for the pulse in carbon dioxide production commonly observed following the rapid rewetting of a dry soil. Soil Sci. Soc. Am. J. 2003, 67, 798–805. [Google Scholar] [CrossRef]
- Maithani, K.; Arunachalam, A.; Tripathi, R.S.; Pandey, H.N. Nitrogen mineralization as influenced by climate, soil and vegetation in a subtropical humid forest in northeast India. For. Ecol. Manag. 1998, 109, 91–101. [Google Scholar] [CrossRef]
- Song, W.; Chen, S.; Zhou, Y.; Lin, G. Rainfall amount and timing jointly regulate the responses of soil nitrogen transformation processes to rainfall increase in an arid desert ecosystem. Geoderma 2020, 364, 114197. [Google Scholar] [CrossRef]
- Zhang, X.Y.; Li, Q.W.; Gao, J.Q.; Hu, Y.H.; Song, M.H.; Yue, Y. Effects of rainfall amount and frequency on soil nitrogen mineralization in Zoigê alpine wetland. Eur. J. Soil Biol. 2020, 97, 103170. [Google Scholar] [CrossRef]
- Bean, G.M.; Kitchen, N.R.; Veum, K.S.; Camberato, J.J.; Ferguson, R.B.; Fernandez, F.G.; Franzen, D.W.; Laboski, C.A.; Nafziger, E.D.; Sawyer, J.E.; et al. Relating four-day soil respiration to corn nitrogen fertilizer needs across 49 US Midwest fields. Soil Sci. Soc. Am. J. 2020, 84, 1195–1208. [Google Scholar] [CrossRef]
- Sanyal, D.; Wolthuizen, J.; Bly, A. Influence of Nitrogen Fertilization Rate on Soil Respiration: A Study Using a Rapid Soil Respiration Assay. Nitrogen 2021, 2, 218. [Google Scholar] [CrossRef]
- Liang, G.; Cai, A.; Wu, H.; Wu, X.; Houssou, A.A.; Ren, C.; Wang, Z.; Gao, L.; Wang, B.; Li, S.; et al. Soil biochemical parameters in the rhizosphere contribute more to changes in soil respiration and its components than those in the bulk soil under nitrogen application in croplands. Plant Soil 2019, 435, 111–125. [Google Scholar] [CrossRef]
- Bly, A.; Woodard, H.J. Nitrogen management: Foliar nitrogen application timing influence on grain yield and protein concentration of hard red winter and spring wheat. Agron. J. 2003, 95, 335–338. [Google Scholar] [CrossRef]
- Wilson, T.L.; Guttieri, M.J.; Nelson, N.O.; Fritz, A.; Tilley, M. Nitrogen and sulfur effects on hard winter wheat quality and asparagine concentration. J. Cereal Sci. 2020, 93, 102969. [Google Scholar] [CrossRef]
- Xue, C.; Matros, A.; Mock, H.P.; Mühling, K.H. Protein composition and baking quality of wheat flour as affected by split nitrogen application. Front. Plant Sci. 2019, 10, 642. [Google Scholar] [CrossRef]


| Site | SOM % | pH | EC | ON Release 0–15 cm | ON Release 15–60 cm | Total Haney Available N | SHC 0–15 cm | SHC 15–60 cm |
|---|---|---|---|---|---|---|---|---|
| dS m−1 | Kg N ha−1 | |||||||
| Sturgis 2017 | 3.1 | 6.8 | 0.5 | 22 | - | 33 | 16.5 | - |
| Vivian 2017 | 4.4 | 7.3 | 0.8 | 7 | - | 33 | 5.5 | - |
| Wall 2017 | 1.8 | 6.4 | 0.3 | 21 | - | 63 | 11.9 | - |
| Sturgis 2018 | 3.6 | 6.1 | 0.3 | 30 | 25 | 67 | 15.4 | 10.7 |
| Wall 2018 | 2.7 | 6.9 | 1.0 | 50 | 27 | 92 | 15.6 | 7.9 |
| Vivian 2019 | 2.6 | 6.5 | 0.3 | 25 | 22 | 56 | 7.6 | 6.1 |
| Wall 2019 | 5.2 | 7.8 | 0.7 | 36 | 35 | 116 | 22.4 | 20.4 |
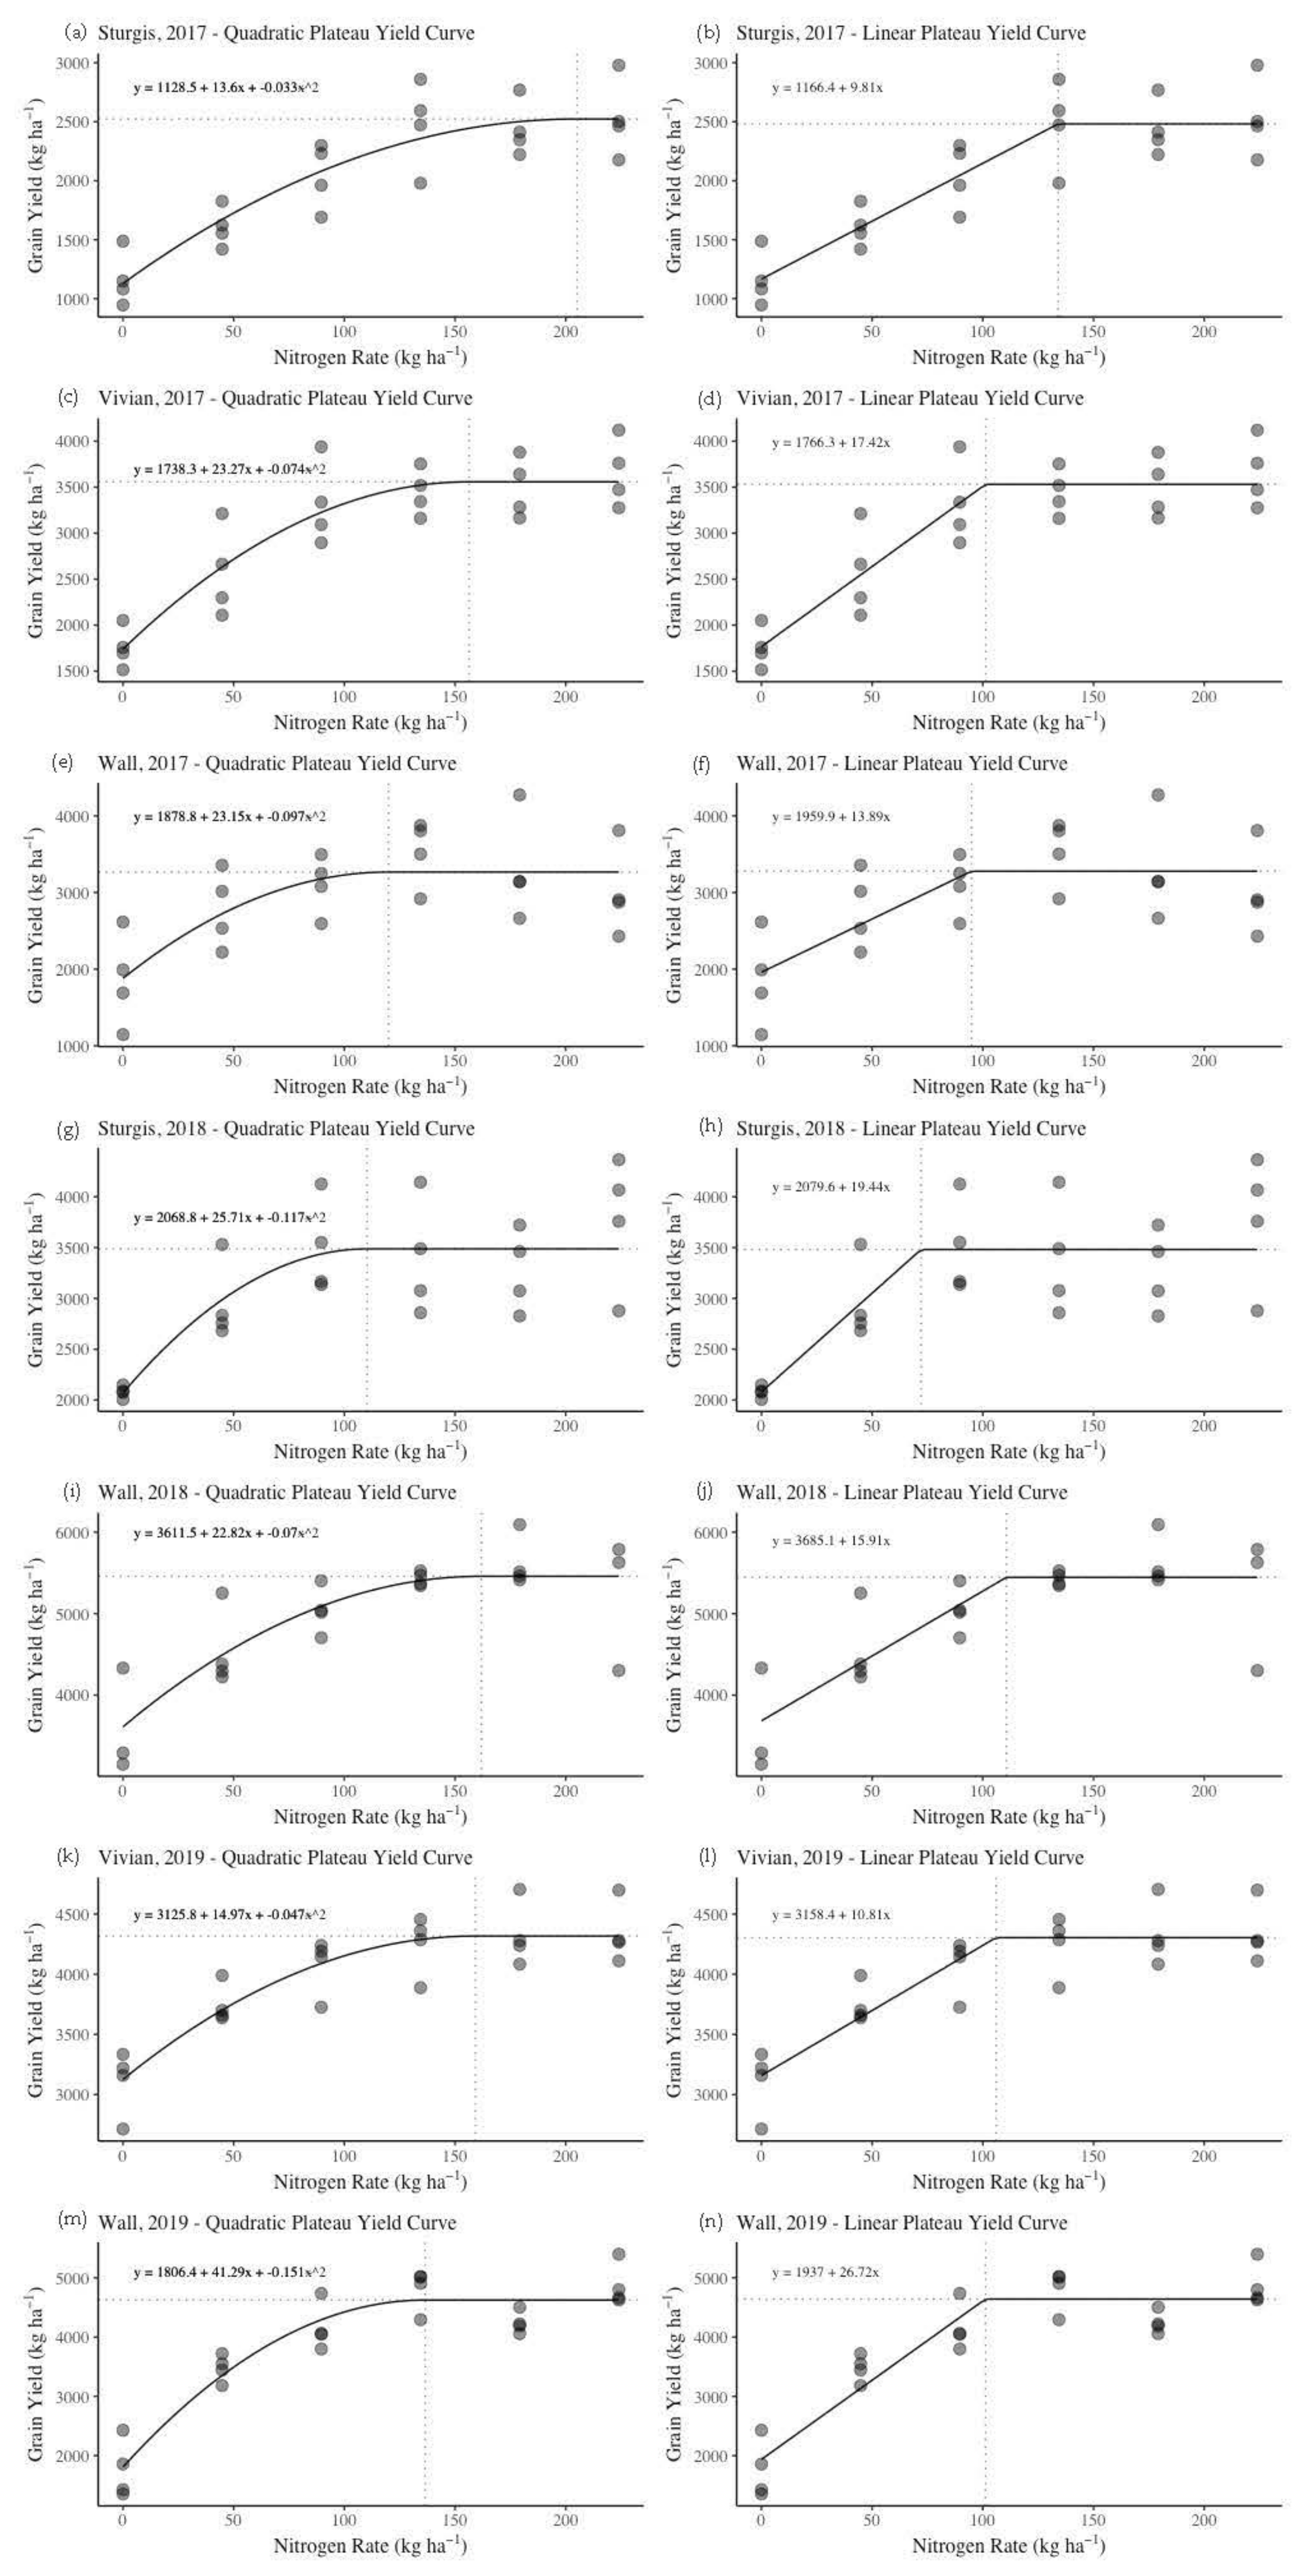
| Location | Year | LP R2 | QP R2 | LP RMSE | QP RMSE | LP AIC | QP AIC | LP Plateau N | QP Plateau N | LP Plateau Grain Yield | QP Plateau Grain Yield |
|---|---|---|---|---|---|---|---|---|---|---|---|
| kg ha−1 | |||||||||||
| Sturgis | 2017 | 0.81 | 0.80 | 241 | 248 | 339 | 341 | 134 | 204 | 2481 | 2523 |
| Sturgis | 2018 | 0.60 | 0.60 | 424 | 425 | 366 | 367 | 72 | 109 | 3481 | 3487 |
| Vivian | 2017 | 0.81 | 0.81 | 322 | 324 | 353 | 354 | 101 | 155 | 3531 | 3558 |
| Vivian | 2019 | 0.80 | 0.81 | 218 | 212 | 335 | 333 | 106 | 159 | 4304 | 4318 |
| Wall | 2017 | 0.50 | 0.51 | 495 | 495 | 375 | 374 | 95 | 120 | 3278 | 3267 |
| Wall | 2018 | 0.70 | 0.71 | 414 | 410 | 336 | 335 | 111 | 162 | 5446 | 5458 |
| Wall | 2019 | 0.87 | 0.89 | 402 | 372 | 364 | 360 | 101 | 136 | 4641 | 4624 |
| Average | 0.73 | 0.73 | 359 | 355 | 353 | 352 | 103 | 149 | 3880 | 3891 | |
| Site | Estimated Available N (0–15 cm) | Estimated Available N (0–60 cm) | HSTNR QP (0–15 cm) | HSTNR LP (0–15 cm) | HSTNR QP (0–60 cm) | HSTNR LP (0–60 cm) | QP MRTN | LP MRTN |
|---|---|---|---|---|---|---|---|---|
| kg N ha−1 | ||||||||
| Sturgis 2017 | 37 | - | 58 | 66 | - | - | 122 | 134 |
| Vivian 2017 | 37 | - | 106 | 109 | - | - | 119 | 101 |
| Wall 2017 | 71 | - | 61 | 65 | - | - | 91 | 95 |
| Sturgis 2018 | 39 | 75 | 103 | 105 | 67 | 69 | 87 | 72 |
| Wall 2018 | 31 | 63 | 191 | 195 | 159 | 163 | 123 | 111 |
| Vivian 2019 | 62 | 130 | 110 | 117 | 42 | 49 | 101 | 106 |
| Wall 2019 | 27 | 41 | 163 | 166 | 149 | 152 | 118 | 101 |
| Average | 113 | 118 | 104 | 108 | 109 | 103 | ||
| Site | HST QP Yield (0–15 cm) | HST LP Yield (0–15 cm) | HST QP Yield (0–60 cm) | HST LP Yield (0–60 cm) | QP MRTN Yield | LP MRTN Yield |
|---|---|---|---|---|---|---|
| kg grain ha−1 | ||||||
| Sturgis 2017 | 1806 | 1814 | - | - | 2294 | 2481 |
| Vivian 2017 | 3369 | 3531 | - | - | 3454 | 3531 |
| Wall 2017 | 2932 | 2863 | - | - | 3186 | 3278 |
| Sturgis 2018 | 3481 | 3481 | 3268 | 3421 | 3424 | 3481 |
| Wall 2018 | 5458 | 5456 | 5450 | 5456 | 5352 | 5446 |
| Vivian 2019 | 4204 | 4304 | 3672 | 3688 | 4158 | 4304 |
| Wall 2019 | 4625 | 4641 | 4625 | 4641 | 4572 | 4641 |
| Average | 3696 | 3727 | 4254 | 4302 | 3777 | 3880 |
| Site | HSTN QP Return (0–15 cm) | HSTN LP Return (0–15 cm) | HSTN QP Return (0–60 cm) | HSTN LP Return (0–60 cm) | QP MRTN Return | LP MRTN Return |
|---|---|---|---|---|---|---|
| USD ha−1 | ||||||
| Sturgis 2017 | 300.38 | 293.14 | - | - | 328.01 | 352.42 |
| Vivian 2017 | 562.87 | 592.27 | - | - | 565.59 | 601.15 |
| Wall 2017 | 524.49 | 506.13 | - | - | 542.57 | 556.71 |
| Sturgis 2018 | 588.85 | 586.61 | 585.86 | 614.44 | 595.05 | 623.24 |
| Wall 2018 | 890.51 | 885.66 | 933.28 | 921.18 | 944.54 | 978.90 |
| Vivian 2019 | 727.03 | 739.54 | 695.04 | 690.6 | 727.84 | 751.75 |
| Wall 2019 | 753.26 | 768.8 | 753.22 | 768.76 | 792.66 | 825.37 |
| Average | 621.06 | 624.59 | 741.85 | 748.75 | 642.32 | 669.93 |
| Site-year | Regression Equation | R2 | HSTN QP | HSTN LP | HSTN QP | HSTN LP | EONR QP | EONR LP |
|---|---|---|---|---|---|---|---|---|
| 0–15 cm | 0–60 cm | |||||||
| Sturgis 2017 | y = 0.016x + 11.26 | 0.80 | 12.2 | 12.3 | - | - | 13.2 | 13.4 |
| Vivian 2017 | y = 0.017x + 11.15 | 0.78 | 13.0 | 13.0 | - | - | 13.2 | 12.9 |
| Wall 2017 | y = 0.024x + 9.55 | 0.87 | 11.0 | 11.1 | - | - | 11.7 | 11.8 |
| Sturgis 2018 | y = 0.013x + 12.13 | 0.61 | 13.5 | 13.5 | 13.0 | 13.0 | 13.3 | 13.1 |
| Wall 2018 | y = 0.021x + 9.05 | 0.92 | 13.1 | 13.1 | 12.4 | 12.5 | 11.6 | 11.4 |
| Vivian 2019 | y = 0.010x + 11.99 | 0.89 | 13.1 | 13.2 | 12.4 | 12.5 | 13.0 | 13.1 |
| Wall 2019 | y = 0.011x + 10.49 | 0.65 | 12.3 | 12.3 | 12.1 | 12.2 | 11.8 | 11.6 |
| Average | y = 0.016x + 10.80 | 0.79 | 12.6 | 12.7 | 12.5 | 12.5 | 12.5 | 12.4 |
Publisher’s Note: MDPI stays neutral with regard to jurisdictional claims in published maps and institutional affiliations. |
© 2022 by the authors. Licensee MDPI, Basel, Switzerland. This article is an open access article distributed under the terms and conditions of the Creative Commons Attribution (CC BY) license (https://creativecommons.org/licenses/by/4.0/).
Share and Cite
Sanyal, D.; Graham, C. Using the Haney Soil Test to Predict Nitrogen Requirements in Winter Wheat (Triticum aestivum L.). Nitrogen 2022, 3, 376-386. https://doi.org/10.3390/nitrogen3020024
Sanyal D, Graham C. Using the Haney Soil Test to Predict Nitrogen Requirements in Winter Wheat (Triticum aestivum L.). Nitrogen. 2022; 3(2):376-386. https://doi.org/10.3390/nitrogen3020024
Chicago/Turabian StyleSanyal, Debankur, and Christopher Graham. 2022. "Using the Haney Soil Test to Predict Nitrogen Requirements in Winter Wheat (Triticum aestivum L.)" Nitrogen 3, no. 2: 376-386. https://doi.org/10.3390/nitrogen3020024