
Environmental Impact Assessment for Animal Waste, Organic and Synthetic Fertilizers


Laboratory Ecology & Protection of Environment, School of Veterinary Medicine, Aristotle University of Thessaloniki, 54124 Thessaloniki, Greece
Nitrogen 2023, 4(1), 16-25; https://doi.org/10.3390/nitrogen4010002
Submission received: 30 November 2022
/
Revised: 22 December 2022
/
Accepted: 3 January 2023
/
Published: 6 January 2023
(This article belongs to the Special Issue Alternatives to Mineral Nitrogen Fertilizers in Agriculture: State of the Art, Challenges and Future Prospects)
Abstract
:The use of fertilizers is of the utmost importance for food security on a global scale. However, fertilizer production and overuse may yield environmental issues. In this research, Life Cycle Assessment (LCA) was used to estimate eighteen environmental impact categories for six different fertilizer products: three synthetic (ammonium nitrate; calcium ammonium nitrate; and urea ammonium nitrate) and three organic (cattle manure; compost; and a mixture of compost and synthetic fertilizer). The processes for fertilizer production were obtained from the Agribalyse database. The system boundaries were from cradle to factory gate (or farm gate in the case of animal waste), and the impact indicators were calculated per kg of nitrogen (N). The data showed that the organo-mineral fertilizer (a mix of compost and synthetic fertilizer) had the highest environmental impact according to the results for most of the impact categories. The median values for this product regarding water consumption, fossil resource use and global warming potential were 322.5 L, 3.82 kg oil equivalent and 13.70 kg CO2 equivalent, respectively, per kg of N. The respective values for cattle manure, for which the lowest environmental impact was observed, were 0.23 L of water, 0.002 kg oil-eq and 3.29 kg of CO2-eq, respectively, per kg of N. Further research should focus on the determination of the impact from other stages of the life cycle (e.g., transportation and application to the field) which were not included in this work. This research could support the selection of N fertilizer in sustainable food production.
1. Introduction
Ensuring food security for a projected worldwide population of nearly 10 billion people by 2050 is a significant problem, particularly in an era of global climate change and land degradation [1]. Fertilizers have been crucial in providing food, and a little less than half of the world’s population is thought to be dependent on synthetic fertilizers [2]. On one hand, fertilizers can assist the environment because they can boost crop production [3], leading to less land being needed to produce food due to increased yields. However, they also harm the ecosystem [1,3]. Many nations overuse fertilizers, which causes nutrient runoff into ecosystems and water systems [4]. Negative environmental effects can result from fertilizer overuse, such as increasing environmental pollution [5], land degradation [6], chemical runoff [4], and biodiversity losses [7]. Through ammonia volatilization and/or biological processes such as nitrification and denitrification, a significant amount of fertilizer nitrogen (in some cases exceeding 50%) is ultimately lost to the environment [8], leading to environmental pollution and a low crop nitrogen use efficiency [9]. It is possible to reduce these losses and increase fertilizer efficiency with enhanced efficiency fertilizers (such as controlled release fertilizers) and urease and nitrification inhibitors [8], but their effectiveness varies depending on the soil type and climate [10,11], and some non-biodegradable polymers used in fertilizer coatings have negative environmental effects [9].
In Europe, as well as other parts of the world, nitrate-based fertilizers are the most widely used fertilizers [12]. The primary products are urea and urea ammonium nitrate (UAN) aqueous solution, which are widely used in other areas of the world, and nitrate-based fertilizers such ammonium nitrate (AN) and calcium ammonium nitrate (CAN), which are well suited to most European soils and climatic conditions [12]. Ammonium sulphate and ammonium sulphate nitrate, calcium nitrate, sodium nitrate, Chilean nitrate, and anhydrous ammonia are also classified as nitrogen fertilizers. The main types of organic fertilizers are animal waste (e.g., slurries, manures), and crop residues [3]. They vary in nutritional significance, but they are typically found on farms, where the nutrients and organic carbon they contain are recycled. Animal waste, however, contains pollutants such as heavy metals and xenobiotics, as well as harmful microorganisms [13,14]. Various nutrient sources with varying physical characteristics and nutrient concentrations are covered by animal manures and slurries. Furthermore, depending on the species of cattle and the farm management technique, their nutrient content varies [9]. There are numerous so-called fertilizing products (e.g., organic fertilizers, organo-mineral fertilizers, mineral fertilizer growing mediums, and plant biostimulants). These can assist farmers in tailoring their fertilization practices to their environmental and farm conditions [3].
According to current estimates from the International Panel on Climate Change (IPCC), the manufacture of synthetic nitrogen fertilizers alone uses around 2% of the world’s energy [15,16]. Nitrogen fertilizer use is a main source of anthropogenic non-CO2 GHG emissions [15,16]. Nitrous oxide (N2O), methane (CH4), and carbon dioxide (CO2) are the most common GHG emissions, although ammonia (NH3) emissions are also significant. According to estimates [15], agriculture is responsible for more than 80% of anthropogenic N2O emissions, and 70% of anthropogenic NH3 emissions, which are primarily caused by the application of livestock manure and inorganic fertilizer. Relevant to livestock and organic fertilizers is 40% of anthropogenic CH4 emissions which are primarily caused by enteric fermentation [15,16].
Even if the emission factors for synthetic fertilizers are known [9], other impact categories have not been studied. Life Cycle Assessment (LCA) is a useful approach to studying the environmental impact of fertilizers [9]. Defining similar system boundaries and functional units for different fertilizer types can lead to a holistic evaluation of the environmental impact of fertilizer production. This could support decision-making for reducing the GHG emissions from agriculture. In addition, the novelty of this research is related to the comparison of different fertilizers, in terms of their environmental impacts per kg of nitrogen added to the crops. Typically, the environmental impact is provided per kg of fertilizer, which is misleading as the nutrients are what the crops require.
This research aimed to evaluate the environmental impact of the production of six different fertilizers, organic and conventional. The objectives were (1) to apply LCA to determine key environmental impact indicators for each of the fertilizer types, and (2) to compare the environmental impacts due to fertilizer production. The results could be useful for GHG emission mitigation in the food production sector.
2. Materials and Methods
2.1. Fertilizers
The fertilizers used for this research were (1) ammonium nitrate (AN), (2) calcium ammonium nitrate (CAN), (3) urea ammonium nitrate (UAN), (4) cattle manure (MAN), (5) organic fertilizer (OF) and (6) organo-mineral fertilizer (OMF). Their basic properties are provided in Table 1.
Based on the UUID, these processes can be obtained via the Agribalyse database [17] and details about the production of these fertilizers can be found. The fertilizers were selected as proxies for globally used products (e.g., AN) and alternatives to synthetic fertilizers (e.g., cattle manure). Regarding the synthetic fertilizers, the processes used represented the production of 1 kg of ammonium nitrate (AN), calcium ammonium nitrate and urea ammonium nitrate, as nitrogen, at the factory gate. The organic and organo-mineral fertilizer processes that are available in Agribalyse are based on the work of Avadí [18,19]. The cattle manure process in Agribalyse represents the organic material produced after the fresh manure is stored in a pit, outside the farm facilities, for a typical period of six months before it is applied to the field.
2.2. Life Cycle Assessment
A Life Cycle Assessment was performed to determine the environmental impact of the six fertilizer products (presented in Table 1). The system boundaries were from material production to the factory gate (or farm gate, in the case of cattle manure). The functional unit was 1 kg of nitrogen. The processes for the production of the six fertilizers were obtained from the Agribalyse database [17]. The OpenLCA software was used [20], and for the environmental impact assessment, the ReCiPe 2016 midpoint (H) method was employed [21]. The following impact categories were determined:
- Fine particulate matter formation (kg PM2.5 equivalent);
- Fossil resource scarcity (kg oil-eq);
- Freshwater ecotoxicity (kg 1,4-DCB);
- Freshwater eutrophication (kg P equivalent);
- Global warming (kg CO2 equivalent);
- Human carcinogenic toxicity (kg 1,4-DCB);
- Human non-carcinogenic toxicity (kg 1,4-DCB);
- Ionizing radiation (kBq Co-60 equivalent);
- Land use (m2a crop equivalent);
- Marine ecotoxicity (kg 1,4-DCB);
- Marine eutrophication (kg N equivalent);
- Mineral resource scarcity (kg Cu equivalent);
- Ozone formation, Human health (kg NOx equivalent);
- Ozone formation, Terrestrial ecosystems (kg NOx equivalent);
- Stratospheric ozone depletion (kg CFC11 equivalent);
- Terrestrial acidification kg (SO2 equivalent);
- Terrestrial ecotoxicity (kg 1,4-DCB);
- Water consumption (m3).
The above-presented indicators were expressed per kg of nitrogen, based on the nitrogen content of each of the six fertilizers: AN (33.5% N), CAN (26%), UAN (46%), OF (3%), OMF (5%) and MAN (0.77%). Therefore, the indicators provide the environmental impact per kg of N applied in the field.
2.3. Data Treatment and Statistical Analysis
Uncertainty calculation was performed using a Monte Carlo simulation (10,000 runs) in OpenLCA, according to Hsu [22]. All uncertainty distributions that were defined in the flows (e.g., inputs for machinery production) that were used in the LCA were considered for the simulation. Accordingly, for the impact categories reported for each of the 6 fertilizers, the median value and range were reported. Cluster analysis was used to group the 6 fertilizers according to the values obtained for the 18 impact categories. Euclidean distance was used for the grouping.
2.4. LCA Assumptions and Limitations
The models for fertilizer production (Table 1), as presented in the Agribalyse database, should be treated as proxies for fertilizer production. The main assumptions that were made in this work are: (1) The geographic location of the processes for the fertilizers was Central Europe (France). (2) Emissions or C storage due to soil processes, after fertilizer application, were not considered. (3) Emissions due to organic material degradation in the manure pit (storage) were not considered. (4) Nitrogen content in the cattle manure was 0.77% wet weight [23].
3. Results
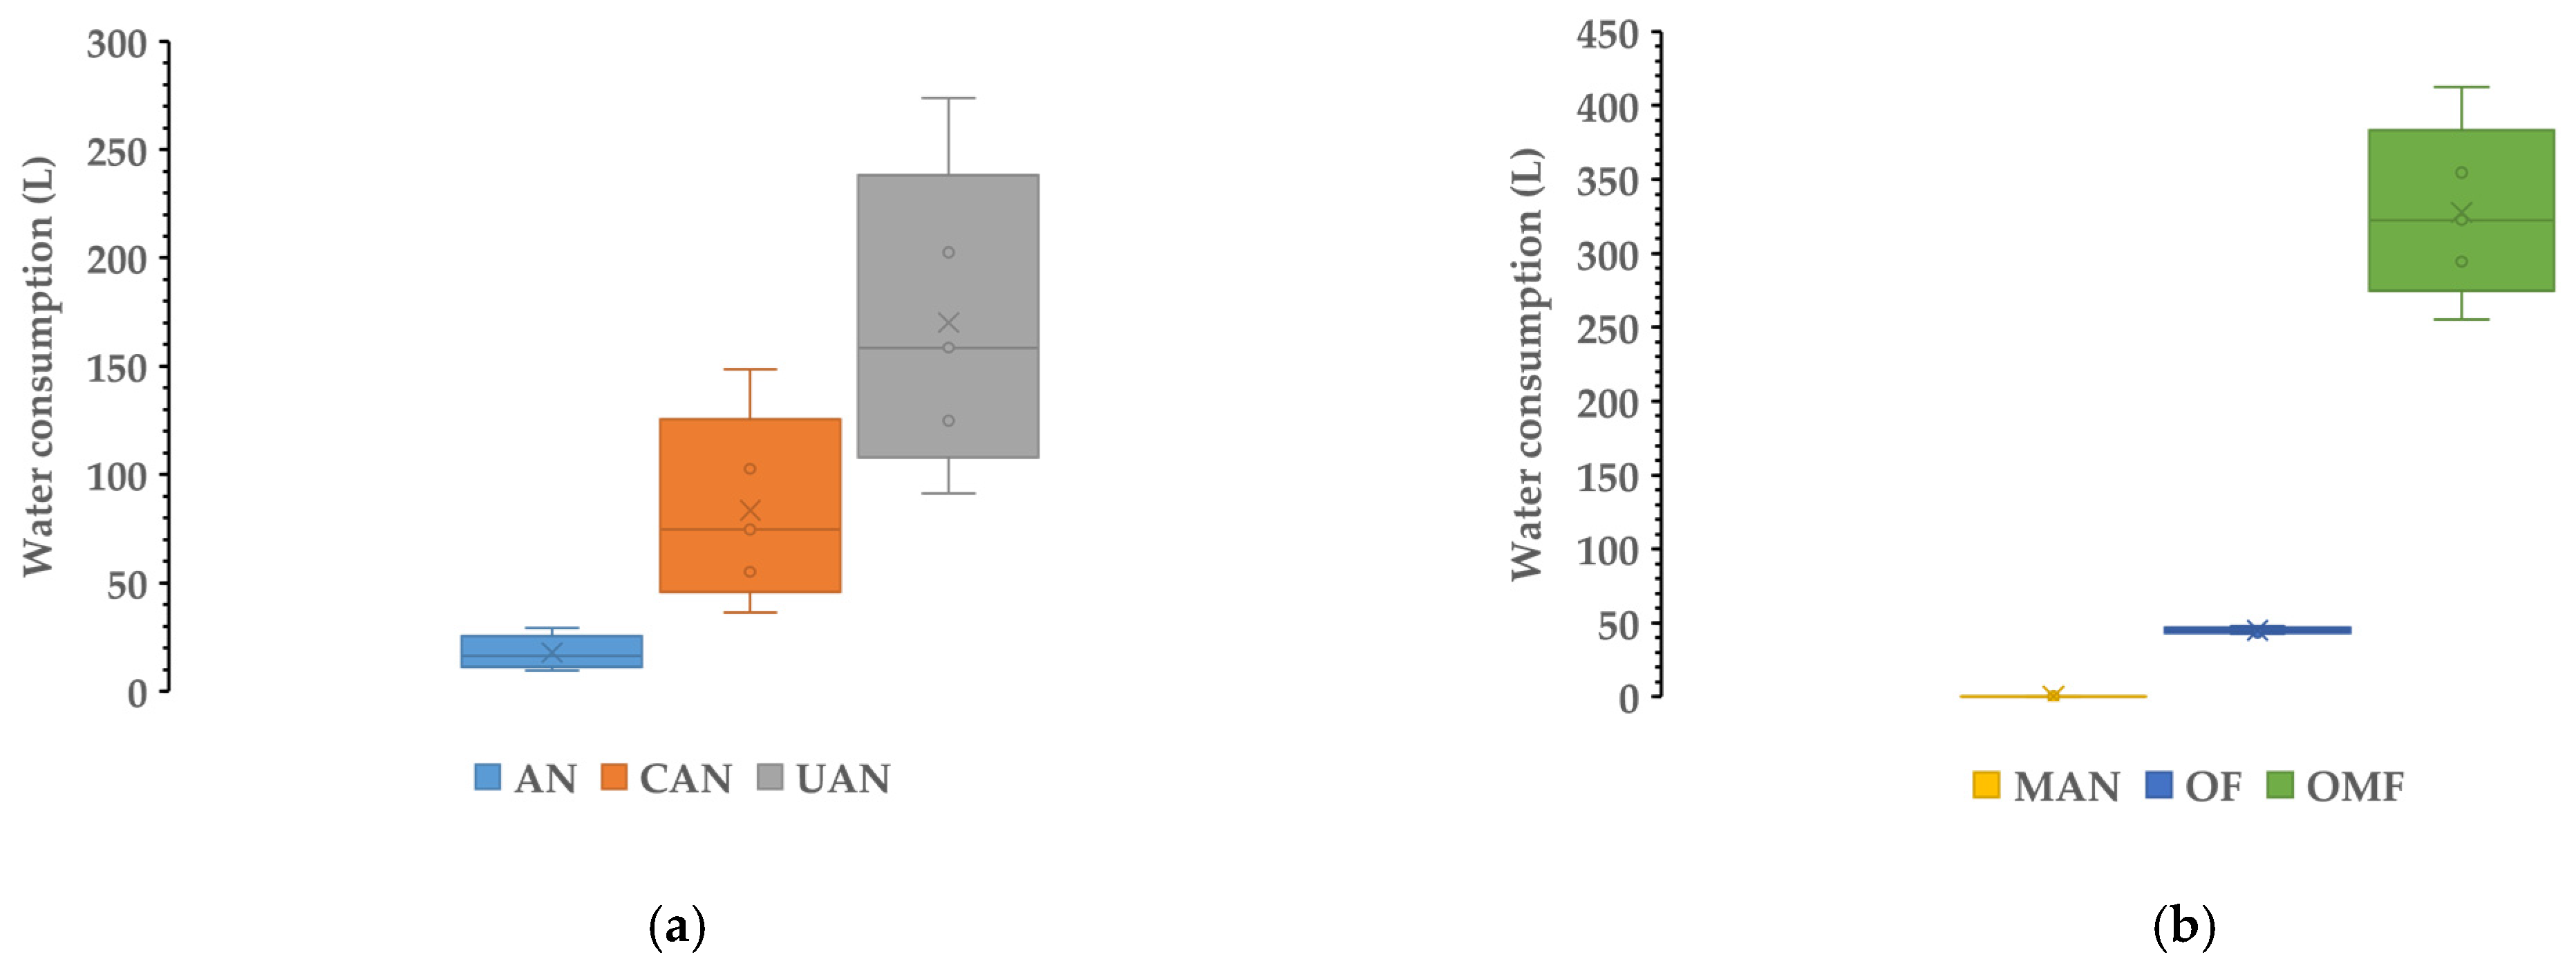
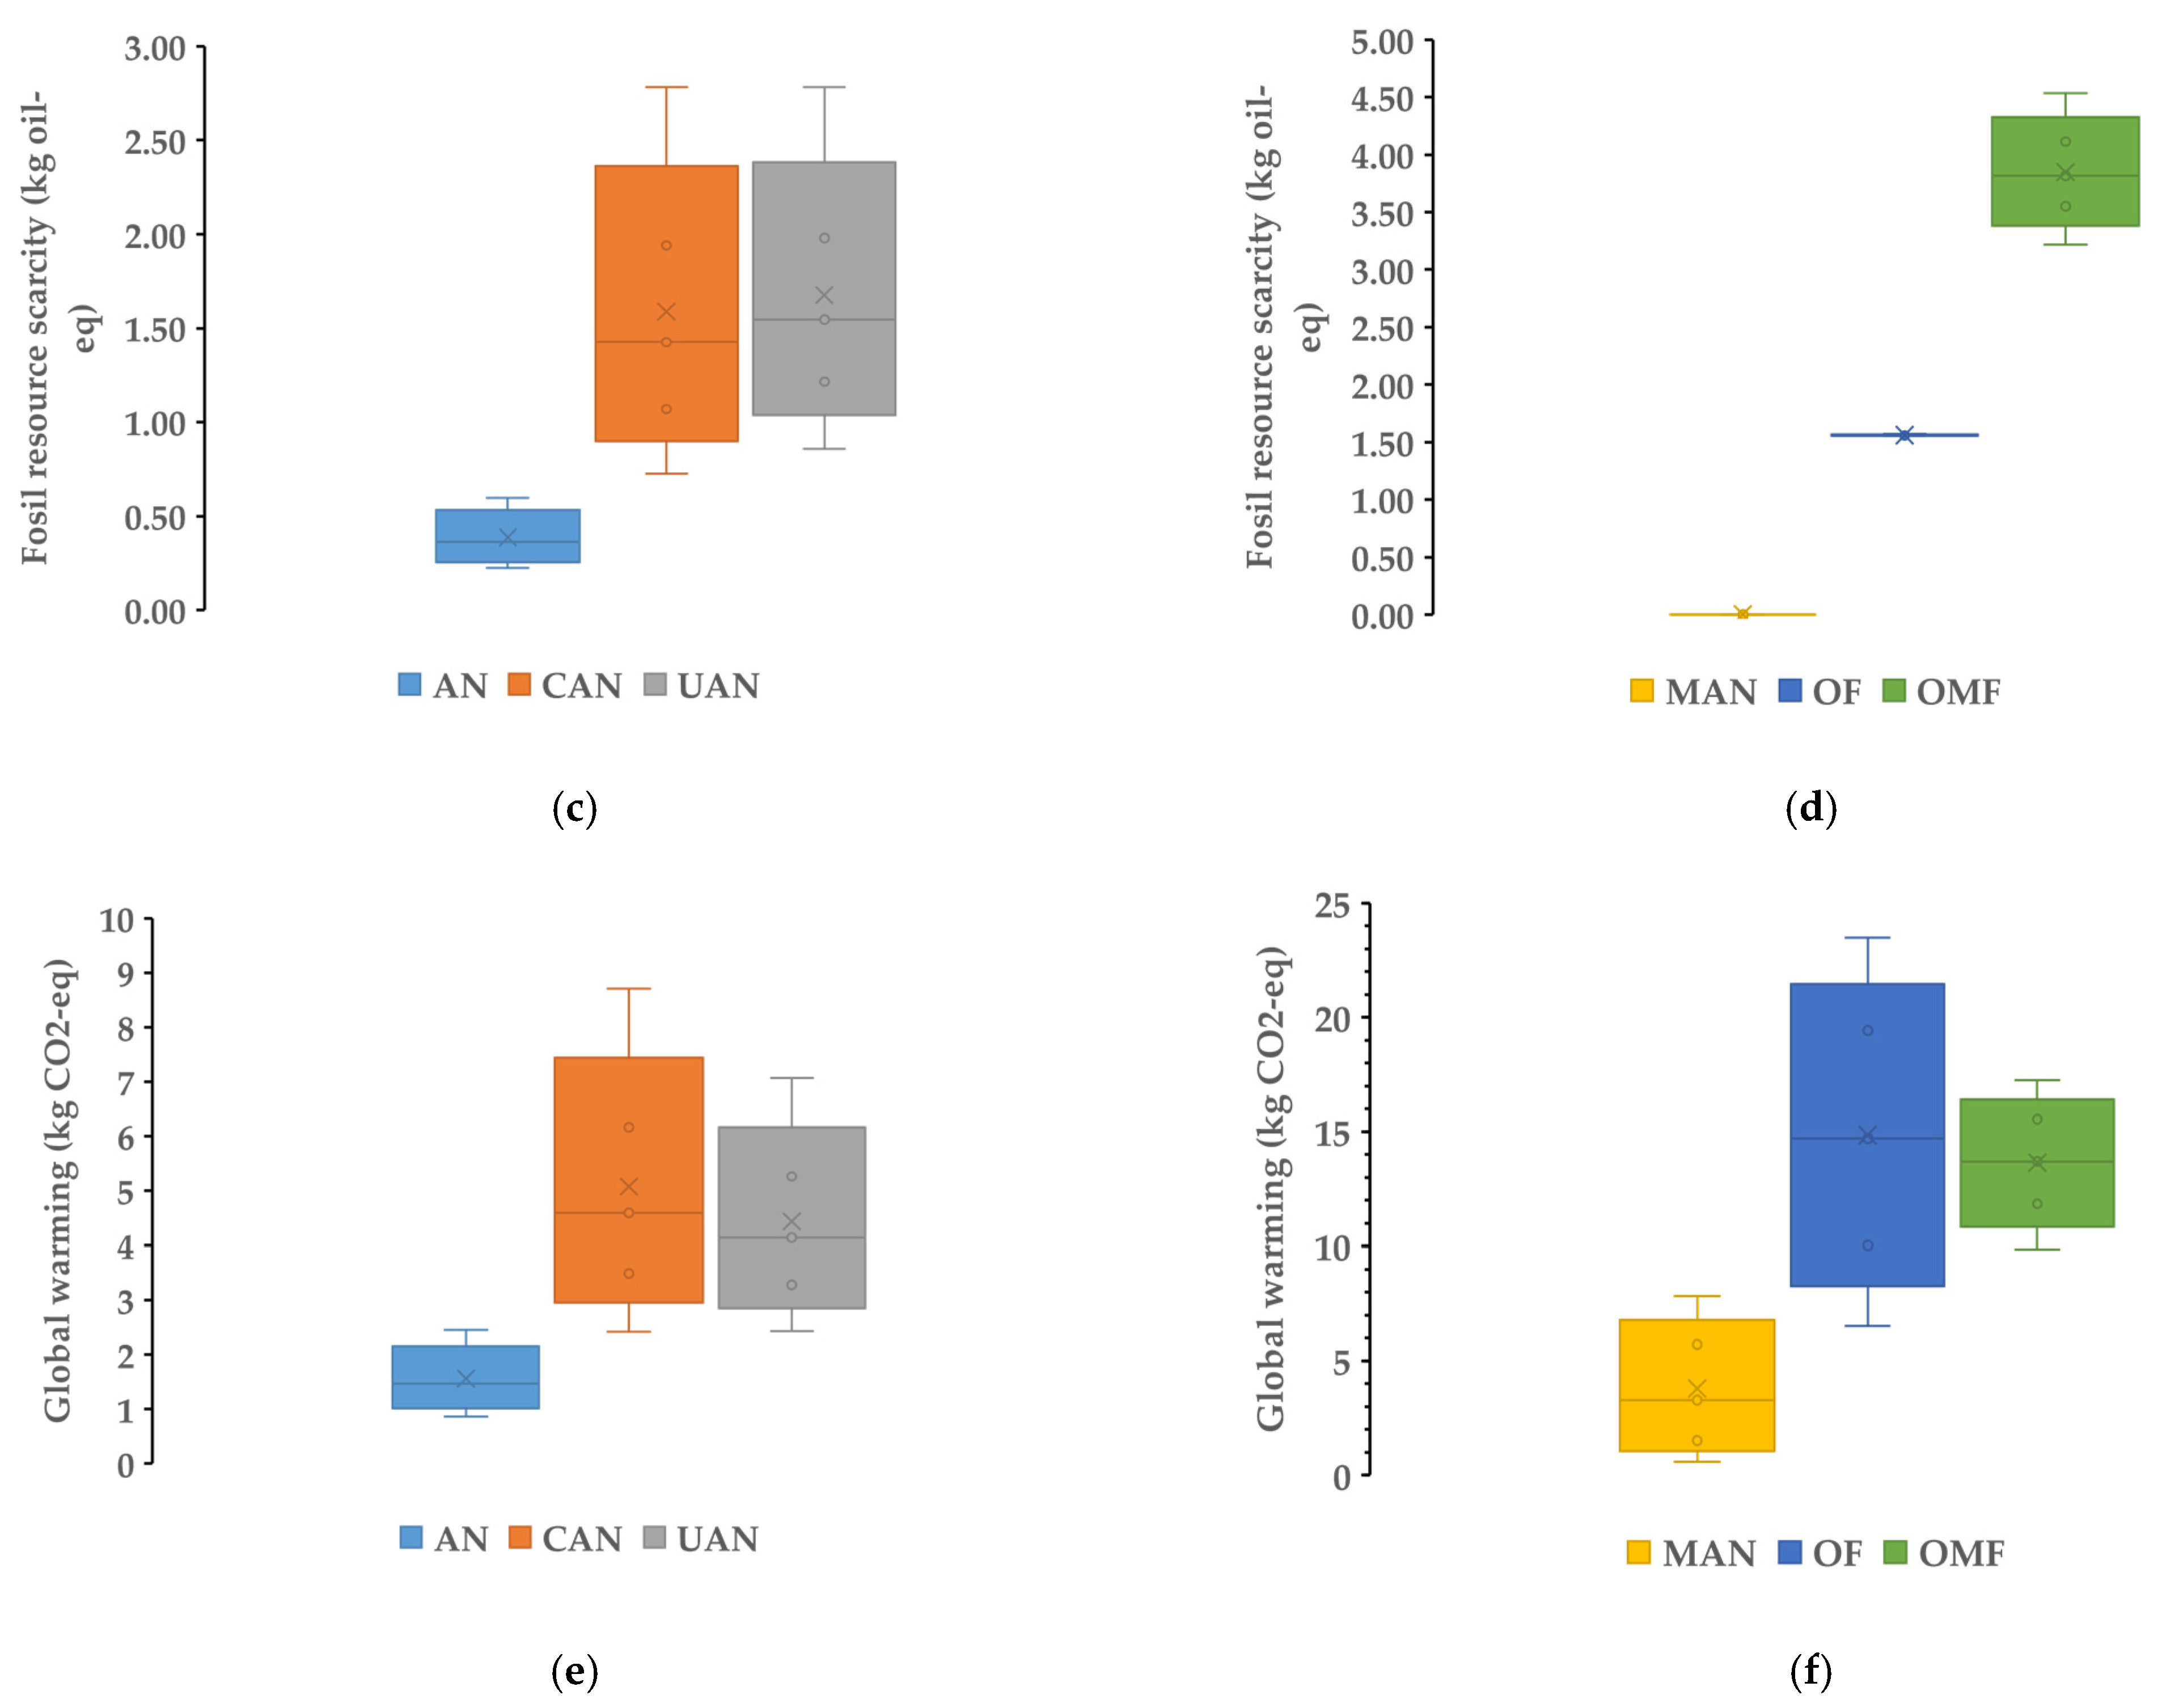
In Figure 1, the impact categories—water consumption (L), fossil resource scarcity (kg oil equivalent) and global warming potential (kg CO2-equivalent)—are presented for synthetic (a, c, e) and organic (b, d, f) fertilizers (per kg of N). In the case of water consumption and fossil resource scarcity, the lowest median values were observed for manure and the highest for organo-mineral fertilizer.
The median values for water consumption (Figure 1a,b) due to the production of fertilizer were 16.37, 74.52, 158.58, 0.23, 45.01 and 322.54 L per 1 kg of N for AN, CAN, UAN, MAN, OF and OMF, respectively. Regarding fossil resource scarcity (Figure 1c,d) the respective median values were 0.36, 1.43, 1.55, 0.002, 1.56 and 3.82 kg oil equivalent per 1 kg of N for AN, CAN, UAN, MAN, OF and OMF, respectively. For global warming potential, median values for the six different fertilizers were 1.47, 4.59, 4.14, 3.29, 14.71 and 13.70 per 1 kg of N for AN, CAN, UAN, MAN, OF and OMF, respectively. For water consumption, the lowest median value was found for manure while the highest was observed for the organo-mineral fertilizer. In the case of resource scarcity, the same was observed. For the global warming potential (per kg of N), the lowest median value was observed for ammonium nitrate while the highest was for the organic fertilizer. In Table 2, the remaining (15) impact categories (median values; range) are presented for the six different fertilizer types.
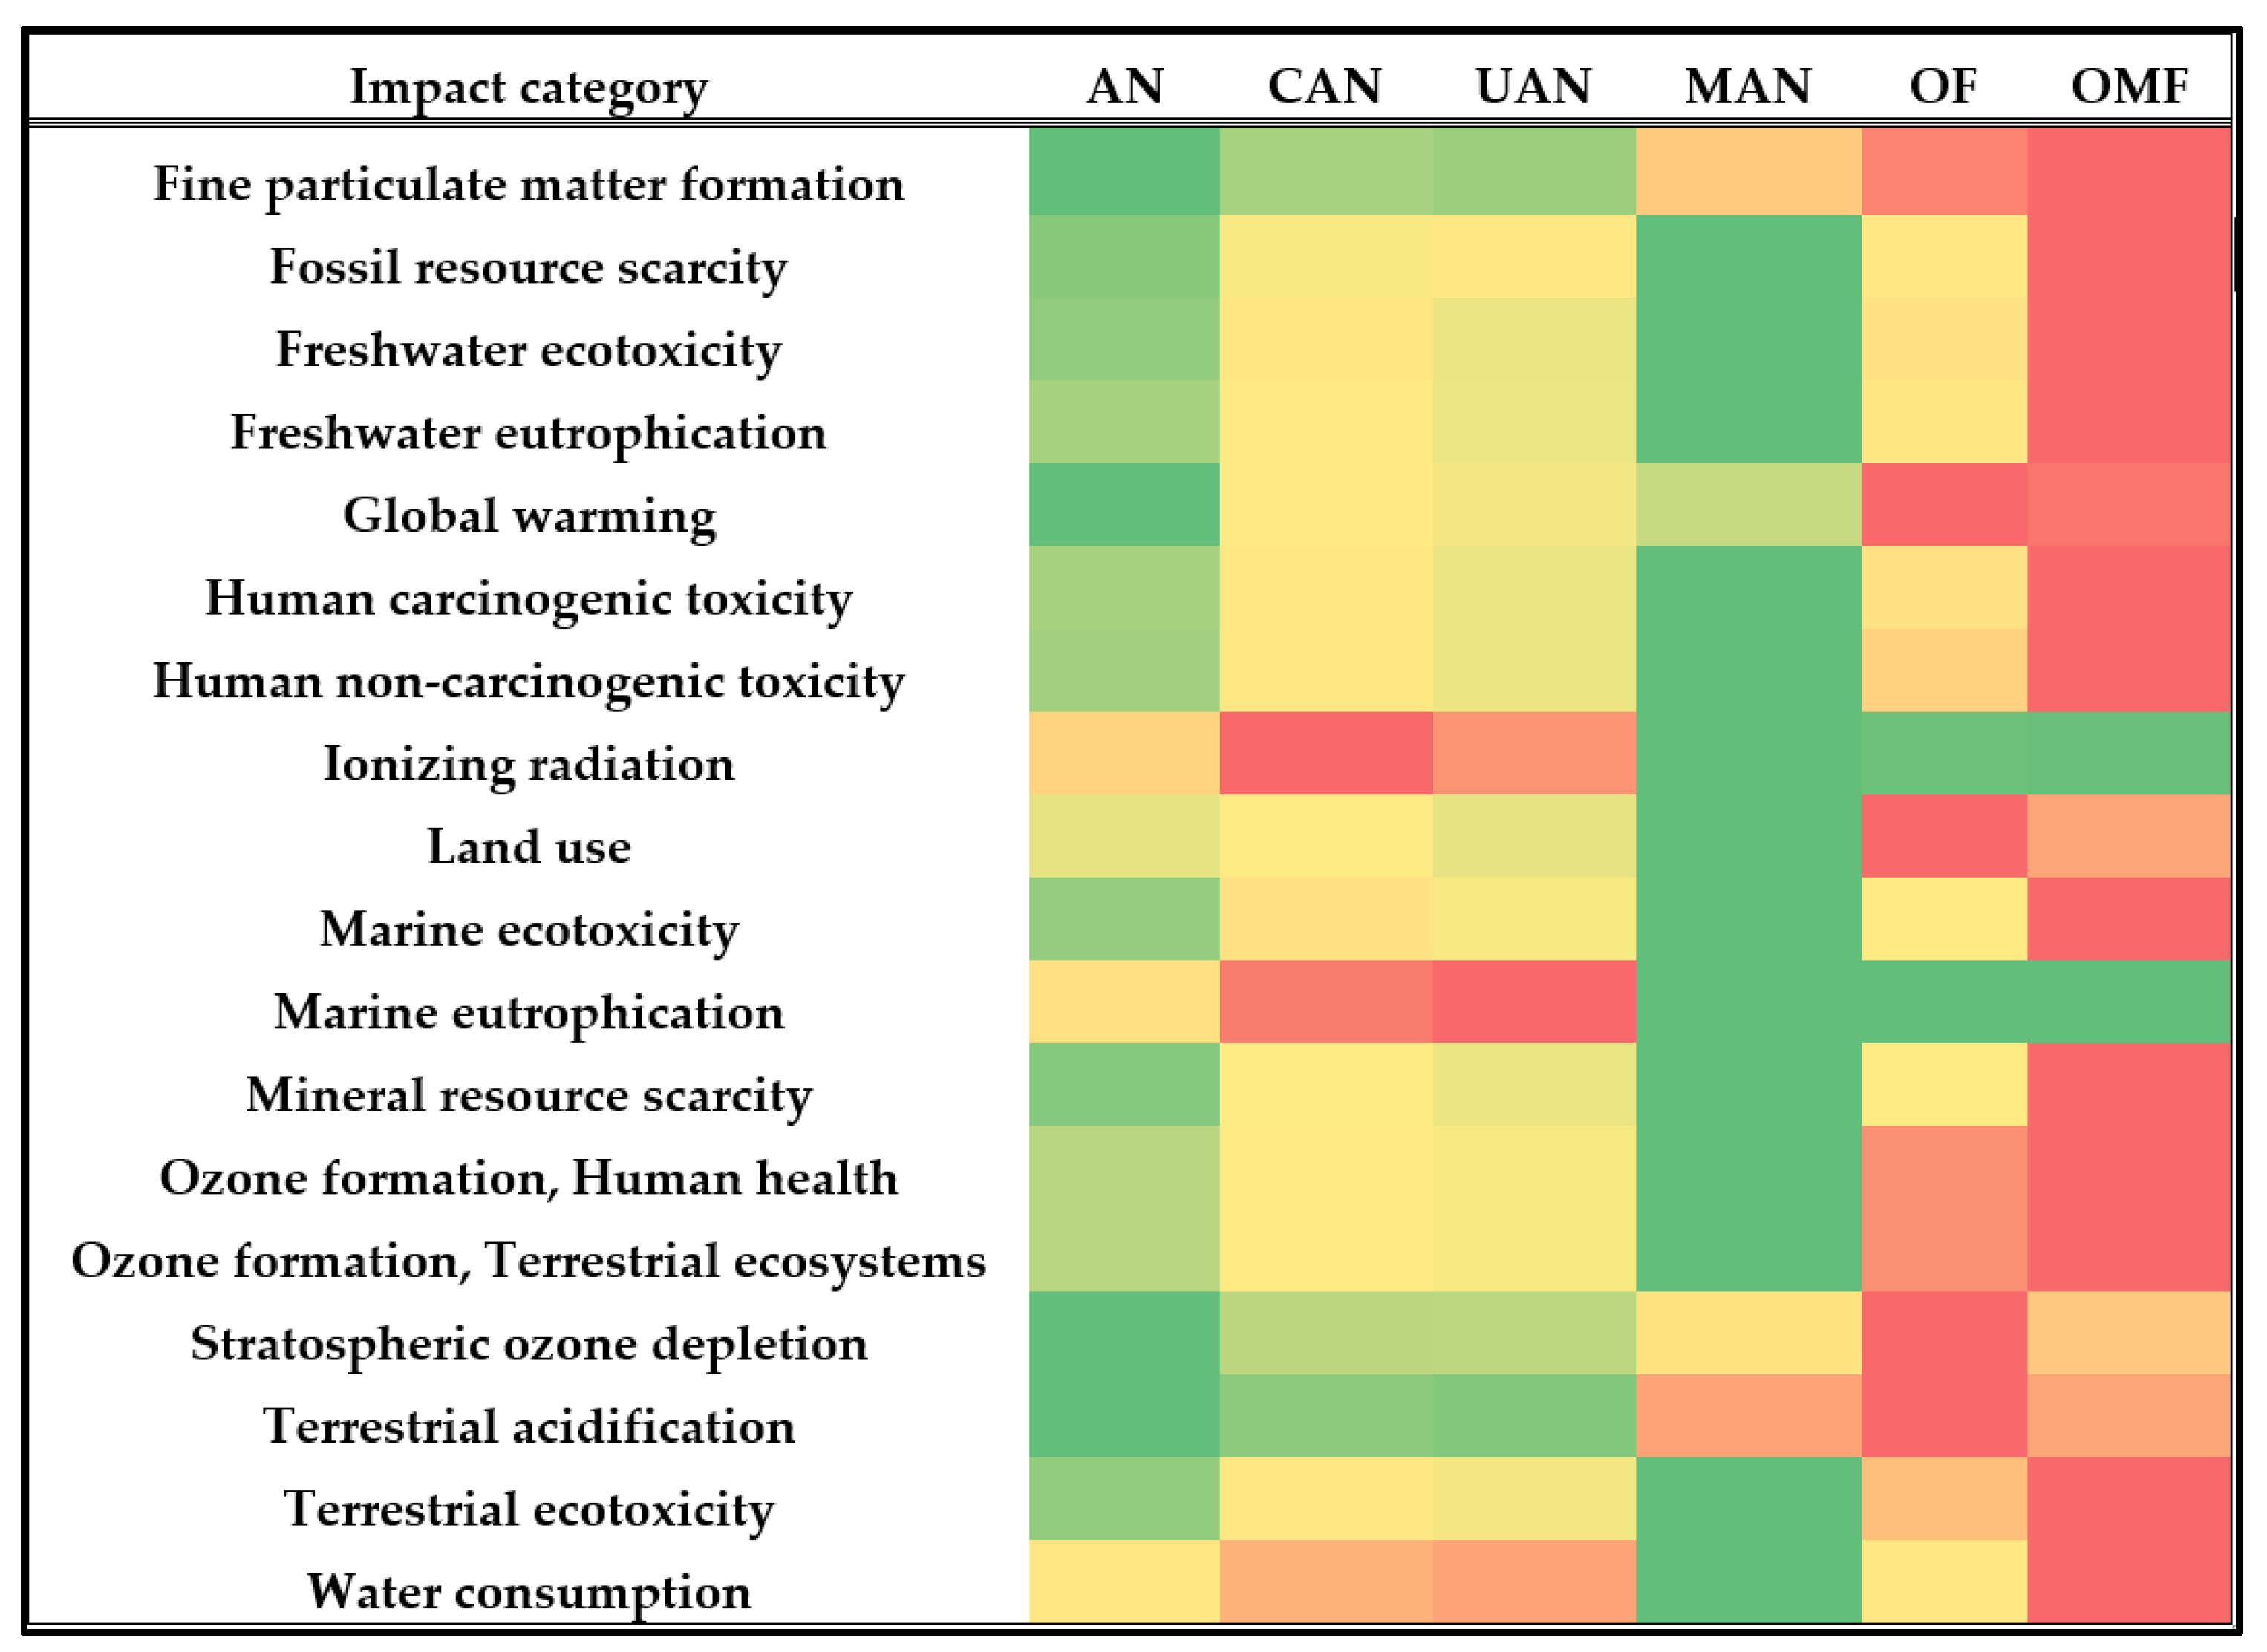
In Figure 2, the comparison of the six fertilizers for the 18 impact categories is presented. Based on the values provided in Figure 1 and Table 2, the lowest median value is coloured green and the highest red. In this sense, fertilizers with a green colour for most of the impact categories are better in terms of environmental impact. It can be observed that in comparison to the other (5) fertilizer types, the organo-mineral fertilizer has the highest values (red colour) in the most impact categories. Therefore, this fertilizer has the highest environmental impact.
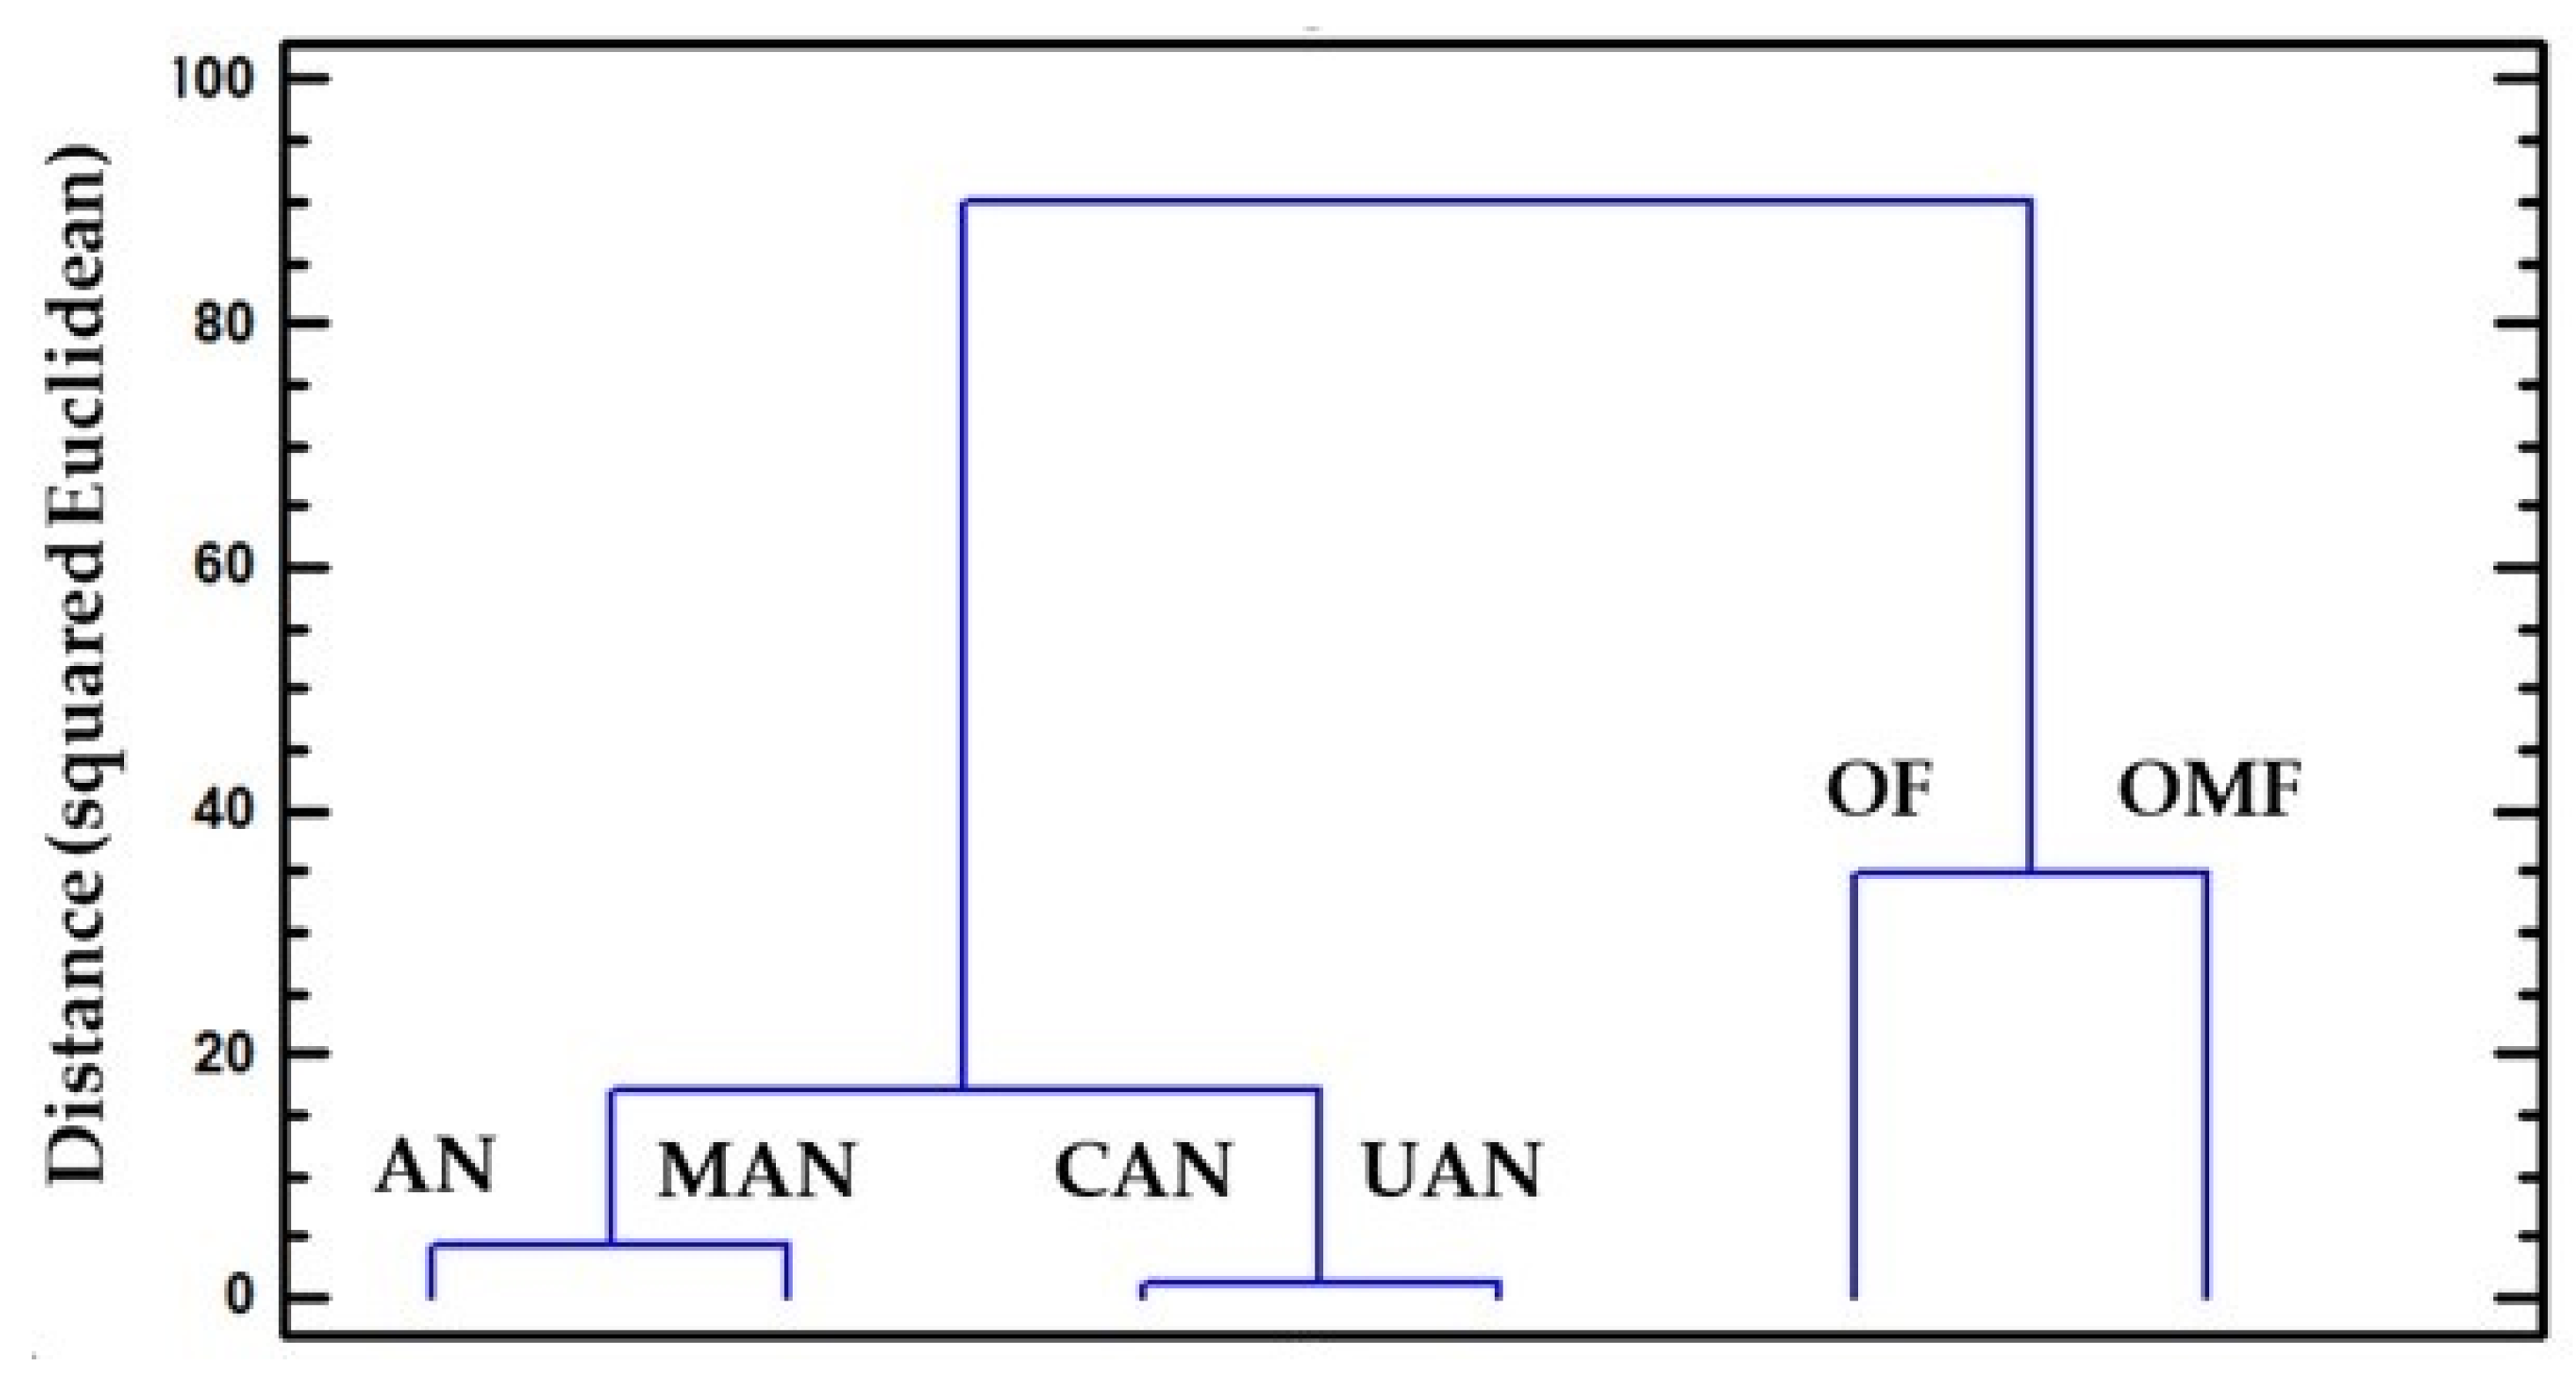
In Figure 3, cluster analysis was used to group the six fertilizers according to the median values for the 18 impact categories. Two groups were observed: one containing ammonium nitrate, calcium ammonium nitrate, manure, and urea, and the second containing organic and organo-mineral fertilizers. This means that these groups have similar values in respect of the indicators’ values.
4. Discussion
Life Cycle Assessment was performed on six fertilizers typically used in global agriculture [9]. The system boundaries for the LCA were from cradle to factory (or farm) gate. The impact categories of the ReCiPe (2016 Midpoint H) method captured the effects on resource use (e.g., fossil resource scarcity; water consumption; land use), ecotoxicity (e.g., marine, and terrestrial), atmosphere (e.g., fine particulate matter formation; ionizing radiation, stratospheric ozone), human health (e.g., non-carcinogenic toxicity), climate change (e.g., global warming potential), eutrophication and acidification. The functional unit selected for the assessment was 1 kg of N. This means that the environmental impact of six different fertilizers (products) was compared based on providing 1 kg of nitrogen to the crop.
One of the most recognized environmental impact indicators is global warming potential (or carbon footprint), expressed as kg of CO2 equivalent per functional unit [24]. The results showed that the range for the fertilizers was 1.47–14.71 kg CO2-eq/kg N. The lowest value was observed for ammonium nitrate, while the highest values were observed for the organic (3-2-3) and organo-mineral fertilizers. Ammonium nitrate had a lower global warming potential even when compared to manure. This is due to the low N content of cattle manure [23]. It should be stressed that these values only account for fertilizer production. Fertilizer application in the field leads to greenhouse gas emissions (e.g., N2O) [24] which were not taken into consideration in this research. It should also be stressed that C storage in the soil, due to organic material application, was not taken into consideration. The addition of organic material in the soil could decrease greenhouse gas emissions and benefit soil functions [25]. The results of this study, regarding the CO2 emissions of synthetic N fertilizers, are per the review of Walling and Vaneeckhaute [9], which report values of 1.3–7.2 kg CO2-eq/kg of N for urea and ammonium nitrate fertilizers produced in several countries/continents. However, this work provides the emissions of organic fertilizers per ton of material produced, thus making direct comparison difficult. Our results stress the importance of making similar comparisons among N fertilizers of different types before recommending several types to be broadly used. Additionally, LCA is a useful tool for holistic assessment of the environmental impact of fertilizers (Figure 2 and Figure 3).
Besides the CO2 emissions, data in the literature for the other impact categories (Table 2) remain scarce. In this study, manure, which is a byproduct of cattle-raising, showed a smaller environmental impact in comparison to the other five fertilizer types (Figure 1; Table 2). On the other hand, it was observed that per kg of nitrogen, the organic fertilizers, especially the organic and organo-mineral fertilizers, have higher impacts compared to the conventional in terms of particulate matter, ecotoxicity, eutrophication, human health, and stratospheric ozone depletion (Table 2; Figure 2). The higher impacts for many of the categories for the organic and organo-mineral fertilizers are related to the inputs used for their production and the low N content. This results in increased impact when data are expressed per kg of N and not per kg or ton of product, which is the typical functional unit of organic fertilizers in LCA studies [9,18]. For instance, electricity and fuel are used for the production and packaging of both organic and synthetic fertilizers. The lower N content of organic fertilizers (5% for organo-mineral and 3% for compost) compared to the respective content in synthetic fertilizers (e.g., 33.5% for ammonium nitrate), results in higher values of the indicators, such as particulate matter emissions, when the impact is expressed per kg of N.
Further research should include the other life cycle stages (e.g., transportation, application to the field, soil processes) to obtain a complete picture of fertilizer use impacts on the environment. Transportation over large distances (e.g., aeroplanes, trains, ships) increases the environmental impact of products due to fuel consumption [26,27,28]. To reduce the environmental impact, fertilizers produced and distributed at the national scale have a lower impact due to decreased values in almost all categories of the LCA [9].
The results of this work favour the use of ammonium nitrate and cattle manure (Figure 2) in comparison to the other four fertilizers, due to lower values in many of the impact categories of the LCA study. It should be highlighted that the nitrogen release from manure is much slower than from the ammonium nitrate fertilizer [29,30]. In the long term, however, the use of organic material supports soil health [25,30].
Finally, LCA for the determination of the environmental impact of fertilizers could be a useful tool for the selection of products that support food security with the lowest environmental impact. In this case, the impacts should be provided per kg of nutrient and not per kg of the final product.
5. Conclusions
The use of fertilizers is of the utmost importance for food security on a global scale. However, fertilizer production and overuse could yield environmental issues. This research shows that the fertilizers with the lowest environmental impacts were cattle manure, followed by ammonium nitrate. Our work stresses that the comparison for the values of the indicators should be carried out per kg of nutrient, not per kg of product, as is typically used in LCA research. According to this study, organic materials such as animal waste are promising to ensure food security in combination with low environmental impact. The use of packaged organic fertilizers could result in a higher environmental impact than that of simpler synthetic fertilizers, such as ammonium nitrate. Further work is required to consider LCA stages, such as transportation, soil functions, and N2O release due to N application.
Funding
This research received no external funding.
Data Availability Statement
Not applicable.
Conflicts of Interest
The author declares no conflict of interest.
References
- Wang, X. Managing Land Carrying Capacity: Key to Achieving Sustainable Production Systems for Food Security. Land 2022, 11, 484. [Google Scholar] [CrossRef]
- Liang, G. Nitrogen Fertilization Mitigates Global Food Insecurity by Increasing Cereal Yield and Its Stability. Glob. Food Secur. 2022, 34, 100652. [Google Scholar] [CrossRef]
- Bebber, D.P.; Richards, V.R. A Meta-Analysis of the Effect of Organic and Mineral Fertilizers on Soil Microbial Diversity. Appl. Soil Ecol. 2022, 175, 104450. [Google Scholar] [CrossRef]
- Xu, Y.; Elbakidze, L.; Yen, H.; Arnold, J.G.; Gassman, P.W.; Hubbart, J.; Strager, M.P. Integrated Assessment of Nitrogen Runoff to the Gulf of Mexico. Resour. Energy Econ. 2022, 67, 101279. [Google Scholar] [CrossRef]
- Badrzadeh, N.; Samani, J.M.V.; Mazaheri, M.; Kuriqi, A. Evaluation of Management Practices on Agricultural Nonpoint Source Pollution Discharges into the Rivers under Climate Change Effects. Sci. Total Environ. 2022, 838, 156643. [Google Scholar] [CrossRef]
- Hossain, M.E.; Islam, M.S.; Sujan, M.H.K.; Tuhin, M.M.-U.-J.; Bekun, F.V. Towards a Clean Production by Exploring the Nexus between Agricultural Ecosystem and Environmental Degradation Using Novel Dynamic ARDL Simulations Approach. Environ. Sci. Pollut. Res. 2022, 29, 53768–53784. [Google Scholar] [CrossRef]
- Wang, Y.; Lu, Y.; Yuan, J.; He, G. Evaluating the Risks of Nitrogen Fertilizer-Related Grain Production Processes to Ecosystem Health in China. Resour. Conserv. Recycl. 2022, 177, 105982. [Google Scholar] [CrossRef]
- Besen, M.R.; Minato, E.A.; Cassim, B.M.A.R.; Macon, C.R.; de Oliveira Zampar, E.J.; Inoue, T.T.; Batista, M.A. The Efficiency of Stabilized Fertilizers in Reducing Ammonia Loss Is Influenced by Liming Method. Commun. Soil Sci. Plant Anal. 2022, 53, 1552–1564. [Google Scholar] [CrossRef]
- Walling, E.; Vaneeckhaute, C. Greenhouse Gas Emissions from Inorganic and Organic Fertilizer Production and Use: A Review of Emission Factors and Their Variability. J. Environ. Manag. 2020, 276, 111211. [Google Scholar] [CrossRef]
- Vangeli, S.; Posse, G.; Beget, M.E.; Otero Estrada, E.; Valdettaro, R.A.; Oricchio, P.; Kandus, M.; Di Bella, C.M. Effects of Fertilizer Type on Nitrous Oxide Emission and Ammonia Volatilization in Wheat and Maize Crops. Soil Use Manag. 2022, 38, 1519–1531. [Google Scholar] [CrossRef]
- Fan, D.; He, W.; Smith, W.N.; Drury, C.F.; Jiang, R.; Grant, B.B.; Shi, Y.; Song, D.; Chen, Y.; Wang, X.; et al. Global Evaluation of Inhibitor Impacts on Ammonia and Nitrous Oxide Emissions from Agricultural Soils: A Meta-Analysis. Glob. Change Biol. 2022, 28, 5121–5141. [Google Scholar] [CrossRef]
- Fertilizers Europe Types of Fertilizer. Available online: https://www.fertilizerseurope.com/fertilizers-in-europe/types-of-fertilizer/ (accessed on 22 November 2022).
- Sui, Q.; Zhang, J.; Chen, M.; Wang, R.; Wang, Y.; Wei, Y. Fate of Microbial Pollutants and Evolution of Antibiotic Resistance in Three Types of Soil Amended with Swine Slurry. Environ. Pollut. 2019, 245, 353–362. [Google Scholar] [CrossRef]
- Xu, Y.; Li, J.; Zhang, X.; Wang, L.; Xu, X.; Xu, L.; Gong, H.; Xie, H.; Li, F. Data Integration Analysis: Heavy Metal Pollution in China’s Large-Scale Cattle Rearing and Reduction Potential in Manure Utilization. J. Clean. Prod. 2019, 232, 308–317. [Google Scholar] [CrossRef]
- IPCC AR5 Climate Change 2014: Mitigation of Climate Change 2014. Available online: https://www.ipcc.ch/report/ar5/wg3/ (accessed on 29 November 2022).
- IPCC Climate Change 2022: Mitigation of Climate Change. Available online: https://www.ipcc.ch/report/ar6/wg3/ (accessed on 29 November 2022).
- Lemberger, P. Agribalyse 3.0.1—An Update!|OpenLCA.Org. Available online: https://www.openlca.org/agribalyse-3-0-1-update/ (accessed on 29 November 2022).
- Avadí, A.; Aissani, L.; Pradel, M.; Wilfart, A. Life Cycle Inventory Data on French Organic Waste Treatments Yielding Organic Amendments and Fertilisers. Data Brief 2020, 28, 105000. [Google Scholar] [CrossRef]
- Avadí, A. Screening LCA of French Organic Amendments and Fertilisers. Int. J. Life Cycle Assess. 2020, 25, 698–718. [Google Scholar] [CrossRef]
- OpenLCA.Org | OpenLCA Is a Free, Professional Life Cycle Assessment (LCA) and Footprint Software with a Broad Range of Features and Many Available Databases, Created by GreenDelta since 2006. Available online: https://www.openlca.org/ (accessed on 20 November 2022).
- Huijbregts, M.A.; Steinmann, Z.J.; Elshout, P.M.; Stam, G.; Verones, F.; Vieira, M.D.M.; Hollander, A.; Zijp, M.; van Zelm, R. ReCiPe 2016: A Harmonized Life Cycle Impact Assessment Method at Midpoint and Endpoint Level Report I: Characterization; Rijksinstituut voor Volksgezondheid en Milieu RIVM: Utrecht, The Netherlands, 2016.
- Hsu, D.D. Life Cycle Assessment of Gasoline and Diesel Produced via Fast Pyrolysis and Hydroprocessing. Biomass Bioenergy 2012, 45, 41–47. [Google Scholar] [CrossRef] [Green Version]
- Loyon, L. Overview of Animal Manure Management for Beef, Pig, and Poultry Farms in France. Front. Sustain. Food Syst. 2018, 2, 36. [Google Scholar] [CrossRef] [Green Version]
- Litskas, V.; Mandoulaki, A.; Vogiatzakis, I.N.; Tzortzakis, N.; Stavrinides, M. Sustainable Viticulture: First Determination of the Environmental Footprint of Grapes. Sustainability 2020, 12, 8812. [Google Scholar] [CrossRef]
- Ioannidou, S.C.; Litskas, V.D.; Stavrinides, M.C.; Vogiatzakis, I.N. Linking Management Practices and Soil Properties to Ecosystem Services in Mediterranean Mixed Orchards. Ecosyst. Serv. 2022, 53, 101378. [Google Scholar] [CrossRef]
- Yao, X.; Shah, W.U.H.; Yasmeen, R.; Zhang, Y.; Kamal, M.A.; Khan, A. The Impact of Trade on Energy Efficiency in the Global Value Chain: A Simultaneous Equation Approach. Sci. Total Environ. 2021, 765, 142759. [Google Scholar] [CrossRef]
- Adedoyin, F.F.; Alola, A.A.; Bekun, F.V. The Alternative Energy Utilization and Common Regional Trade Outlook in EU-27: Evidence from Common Correlated Effects. Renew. Sustain. Energy Rev. 2021, 145, 111092. [Google Scholar] [CrossRef]
- Dou, G.; Choi, T.-M. Does Implementing Trade-in and Green Technology Together Benefit the Environment? Eur. J. Oper. Res. 2021, 295, 517–533. [Google Scholar] [CrossRef]
- Lawrencia, D.; Wong, S.K.; Low, D.Y.S.; Goh, B.H.; Goh, J.K.; Ruktanonchai, U.R.; Soottitantawat, A.; Lee, L.H.; Tang, S.Y. Controlled Release Fertilizers: A Review on Coating Materials and Mechanism of Release. Plants 2021, 10, 238. [Google Scholar] [CrossRef]
- Bergstrand, K.-J. Organic Fertilizers in Greenhouse Production Systems—A Review. Sci. Hortic. 2022, 295, 110855. [Google Scholar] [CrossRef]
Figure 1.
Water consumption (L), fossil resource scarcity (kg oil equivalent) and global warming potential (kg CO2-eq) for synthetic (a,c,e) and organic (b,d,f) fertilizers. The boxplots provide the range, upper (5%) and lower (95%) percentile, median (line) and average (X) values.
Figure 1.
Water consumption (L), fossil resource scarcity (kg oil equivalent) and global warming potential (kg CO2-eq) for synthetic (a,c,e) and organic (b,d,f) fertilizers. The boxplots provide the range, upper (5%) and lower (95%) percentile, median (line) and average (X) values.


Figure 2.
Comparison of the six fertilizers for 18 environmental impact categories. The lowest value per impact category is coloured green while the highest is red. AN: ammonium nitrate; CAN: calcium ammonium nitrate; UAN: urea ammonium nitrate MAN: cattle manure; OF: organic fertilizer; OMF: organo-mineral fertilizer.

Figure 3.
Cluster analysis for the grouping of six fertilizers, according to the values of the 18 impact categories. Two clusters appear, one containing AN, MAN, CAN and UAN and the other OF and OMF.
Figure 3.
Cluster analysis for the grouping of six fertilizers, according to the values of the 18 impact categories. Two clusters appear, one containing AN, MAN, CAN and UAN and the other OF and OMF.


Table 1.
Characteristics of the fertilizers used for this research and identification code in the Agribalyse database.
Table 1.
Characteristics of the fertilizers used for this research and identification code in the Agribalyse database.
| Fertilizer | NPK | Agribalyse Process—UUID |
|---|---|---|
| Ammonium Nitrate (AN) | 33.5-0-0 | Ammonium Nitrate, as N (00b72b4a-0121-47f4-b0a6-8994ea3045cb) |
| Calcium Ammonium Nitrate (CAN) | 26-0-0 | Calcium Ammonium Nitrate, as N (951a335f-1630-4363-8248-552951786331) |
| Urea Ammonium Nitrate (UAN) | 46-0-0 | Urea Ammonium Nitrate, as N (c0e960a7-33bd-457d-9645-0f5baaa9412b) |
| Cattle manure (MAN) | 0.77% N w.w. | Manure from cattle, stocked in surface or pit (ccbe7eec-2d09-464c-ab89-2fb771142a6d) |
| Organic fertilizer (OF) | 3-2-3 | Organic fertilizer, 3-2-3, granulate, packaged (fef98b5f-e133-4b75-916b-a27990b6f4b1) |
| Organo-mineral (OMF) | 5-5-10 | Organo-mineral fertilizer, 5-5-10, granulate, packaged (1178a3f6-cd65-4f27-bc03-f1deb4c437f7) |
Table 2.
Median values (minimum and maximum) for impact categories (ReCiPe 2016 Midpoint H), for synthetic (AN, CAN, UAN) and organic fertilizers (MAN, OF, OMF).
Table 2.
Median values (minimum and maximum) for impact categories (ReCiPe 2016 Midpoint H), for synthetic (AN, CAN, UAN) and organic fertilizers (MAN, OF, OMF).
| Impact Category | AN | CAN | UAN | MAN | OF | OMF |
|---|---|---|---|---|---|---|
| Particulate matter (g PM2.5 eq) | 1.42 (0.88–2.49) | 4.41 (2.29–8.53) | 3.91 (2.26–6.88) | 11.80 (0.93–20.80) | 19.71 (7.40–31.46) | 22.75 (16.41–29.17) |
| Freshwater ecotoxicity (g 1,4-DCB) | 32.01 (17.95–63.93) | 117.56 (57.44–233.47) | 92.99 (49.65–173) | 0.271 (0.269–0.275 | 126.63 (107.83–166.17) | 393.82 (335.26–482.73 |
| Freshwater eutrophication (g P eq) | 0.38 (0.20–0.77) | 0.95 (0.46–1.90) | 0.76 (0.40–1.44) | 0.003 (0.001–0.012) | 1.026 (0.795–1.659) | 5.164 (4.273–6.301) |
| Human carcinogenic toxicity (g 1,4-DCB) | 39.57 (21.69–79.69) | 99.12 (49.19–195.38) | 78.81 (42.79–145.15) | 1.112 (1.119–1.125) | 111.6 (110.45–111.6) | 386.61 (328.26–478.25) |
| Human non-carcinogenic toxicity (g 1,4-DCB) | 1293.77 (725.7–2642.2) | 3453.19 (1720.9–6790) | 2737.64 (1497.1–5019.2) | 8.13 (8.03–8.25) | 5149.3 (3298.1–8778.1) | 12,883 (10,884–16,186) |
| Ionizing radiation (Bq Co-60 eq) | 65.41 (32.14–145.92) | 208.62 95.62–423.25) | 150.22 (71.94–303.87) | 0.001 (0.0002–0.03) | 2.29 (2.26–2.29) | 1.71 (1.60–1.86) |
| Land use (m2a crop eq) | 0.04 (0.02–0.11) | 0.06 (0.03–0.11) | 0.04 (0.02–0.08) | 0.007 (0.001–0.012) | 6.07 (4.77–8.31) | 3.32 (2.77–4.14) |
| Marine ecotoxicity (g 1,4-DCB) | 45.38 (25.87–89.72) | 170.12 (83.35–337.33) | 135.57 (72.45–252.33) | 0.387 (0.383–0.398) | 144.69 (138.33–157.88) | 552.04 (466.7–679.1) |
| Marine eutrophication (mg N eq) | 81.16 (45.01–142.87) | 454.27 (219.65–907.02) | 519.56 (276.79–965.38) | 0.0001 (0.0001–0.005) | 0.003 (0.002–0.007) | 0.002 (0.001–0.003) |
| Mineral resource scarcity (g Cu eq) | 2.96 (1.76–5.63) | 14.31 (7.06–28.31) | 11.39 (6.07–20.97) | 0.090 0.089–0.091) | 21.08 (15.58–35.18) | 3966.34 (2645.5–6165.4) |
| Ozone formation, human health (g NOx eq) | 3.09 (1.92–5.51) | 5.86 (3.27–10.85) | 5.38 (3.29–9.17) | 0.036 (0.028–0.055) | 18.55 (17.58–20.51) | 23.92 (20.74–28.26) |
| Ozone formation, terrestrial ecosystems (g NOx eq) | 3.13 (1.95–5.58) | 5.98 (3.34–11.08) | 5.52 (3.38–9.40) | 0.037 (0.029–0.056) | 18.94 (17.97–20.90) | 24.44 (21.21–28.86) |
| Stratospheric ozone depletion (mg CFC11 eq) | 11.88 (5.21–24.97) | 26.33 (14.77–44.33) | 26.511 (15.21–49.28) | 48.88 (10.73–111.22) | 211.25 (14.80–404.78) | 84.25 (12.85–154.75) |
| Terrestrial acidification (g SO2 eq) | 4.90 (2.97–8.59) | 19.13 (9.58–37.58) | 15.30 (8.55–27.58) | 96.28 (7.51–201.3) | 127.6 (28.11–224.13) | 94.5 (53.87–135.61) |
| Terrestrial ecotoxicity (kg 1,4-DCB) | 3.62 (2.69–5.79) | 12.21 (6.87–22.56) | 10.35 (6.19–17.87) | 0.026 (0.025–0.050) | 22.19 (22.03–24.53) | 42.47 (36.06–52.63) |
Disclaimer/Publisher’s Note: The statements, opinions and data contained in all publications are solely those of the individual author(s) and contributor(s) and not of MDPI and/or the editor(s). MDPI and/or the editor(s) disclaim responsibility for any injury to people or property resulting from any ideas, methods, instructions or products referred to in the content. |
© 2023 by the author. Licensee MDPI, Basel, Switzerland. This article is an open access article distributed under the terms and conditions of the Creative Commons Attribution (CC BY) license (https://creativecommons.org/licenses/by/4.0/).
Share and Cite
MDPI and ACS Style
Litskas, V.D. Environmental Impact Assessment for Animal Waste, Organic and Synthetic Fertilizers. Nitrogen 2023, 4, 16-25. https://doi.org/10.3390/nitrogen4010002
AMA Style
Litskas VD. Environmental Impact Assessment for Animal Waste, Organic and Synthetic Fertilizers. Nitrogen. 2023; 4(1):16-25. https://doi.org/10.3390/nitrogen4010002
Chicago/Turabian StyleLitskas, Vassilis D. 2023. "Environmental Impact Assessment for Animal Waste, Organic and Synthetic Fertilizers" Nitrogen 4, no. 1: 16-25. https://doi.org/10.3390/nitrogen4010002