Article

Analysis and Experimental Verification of the Sealing Performance of PEM Fuel Cell Based on Fractal Theory

1
School of Mechanical Engineering, Beijing Institute of Technology, Beijing 100081, China
2
Chongqing Innovation Center, Beijing Institute of Technology, Chongqing 401120, China
*
Author to whom correspondence should be addressed.
Fractal Fract. 2023, 7(5), 401; https://doi.org/10.3390/fractalfract7050401
Submission received: 7 April 2023 / Revised: 5 May 2023 / Accepted: 8 May 2023 / Published: 15 May 2023

Abstract

:
Aiming to accurately predict the leakage rate of the sealing interface, this work proposes a two-dimensional finite element model of a proton exchange membrane fuel cell, which includes the microscopic surface morphology and the asperity contact process of the components. First of all, we constructed the surface morphology of the seal by the two-dimensional W-M (Weierstrass–Mandelbrot) fractal function and explored the influence of fractal dimension (D) and scale parameter (G) on the surface profile. Furthermore, the finite element method and Poiseuille fluid theory were adopted to obtain the deformation variables of the asperity under different clamping pressures and leakage rates. Moreover, we quantitatively analyzed the impact of surface roughness on the clamping pressure and leakage rate. It was found that both the surface amplitude and surface roughness are positively correlated with G and negatively correlated with D. Surface morphology is proportional to D but has no relationship with G. Additionally, the deformation asperity decreases exponentially with growing clamping pressure, and the leakage rate is consistent with the experimental values at a clamping pressure of 0.54 MPa. With the same leakage rate, when the seal surface roughness value is less than 1 μm, a doubled roughness value leads to an increase of 31% in the clamping pressure. In contrast, when the surface roughness of the seal is greater than 1 μm, a doubled roughness value induces an increase of 50% in the corresponding clamping pressure.

1. Introduction

The proton exchange membrane fuel cell (PEMFC) is considered a green energy conversional device due to its high efficiency, zero emissions, and low noise [1,2]. PEMFC is assembled from multiple components, and it is necessary to set a seal on the bipolar plate and match the appropriate clamping pressure of PEMFC to prevent the leakage or mixing of reactive gases [3]. The seal faces stress relaxation due to various mechanics during PEMFC operation [4,5,6]. The failure mechanism of the sealing can be attributed to the fluctuation of internal pressure, the temperature cycle, the acid corrosion, the dynamic condition, and the interfacial leakage [7,8,9,10,11,12]. Among these influencing factors, interfacial leakage is the most appealing one, which is affected by clamping pressure and surface roughness. On one hand, unsuitable clamping pressure causes the deformation of components and uneven interfacial contact pressure. Accordingly, the leakage gaps and the leakage of gases increase [13]. On the other hand, the leakage gaps inevitably stem from the rough surface in practical situations. In general, the leakage rate is one of the significant parameters for judging the sealing performance of PEMFC. Therefore, the accurate evaluation of the leakage rate is extremely critical for the precise estimation of the PEMFC performance. To the best of our knowledge, the impact of leakage rate on PEMFC has been taken into account in only a few investigations to date.
Persson et al. [14,15,16,17] proposed a lattice leakage model based on percolation theory and analyzed the leakage gaps from multiple scales. The results validated the accuracy of the lattice leakage model with experimental data and confirmed the effectiveness in describing the leakage of the contact interfaces. Bottiglione et al. [18] evaluated the leakage mechanism of fluid through percolation theory and contacted mechanics theory. Marie et al. [19] performed an experiment to describe fluid leakage through rough metal interfaces. The aforementioned studies revealed that the leakage depended on the clamping pressure, surface topography, and sealing material. Restricted by measurement technologies, the characterization of surface topography together with the contact efficiency and leakage gaps remains challenging. Normally, the effect of surface topography on leakage rate is the most important to consider. Haruyama et al. [20] obtained the formula between the metal gasket (with surface topography parameters) and the volume leakage rate through experiments. Liu et al. [21] constructed an anisotropic W-M function based on ubiquitiform theory. They established a model of the grinding surface that can accurately characterize the fractal features of the grinding surface. Putignano et al. [22] employed a micro-surface contact model between a smooth flange and a metal gasket with roughness. Yang et al. [23] constructed a microscopic three-dimensional model of the sealing interface with mathematical tools and introduced two criteria to describe the interface damage. The accuracy of the microscopic model was verified with experimental results and the formation mechanism of the leakage gaps was revealed. Bora et al. [24] provided a method of simulating a rough surface with high computational convergence. The model considered the long-range surface displacement response effect of load on the rough surface and improved the calculation efficiency by 55.7%. Other studies [25,26,27,28] adopted fractal theory to describe the contact characteristics of the rough interface. They considered the elastoplastic deformation of the asperity and the change in the contact stiffness and corrected the distribution function of the truncated area. Despite the fact that previous investigations shed light on the cause of interfacial leakage and the characterization method of rough interfaces, the relationship between leakage rate and surface topography is unclear and remains to be explored.
Seals with different roughness values should be matched with the appropriate clamping pressure to ensure the same leakage rate. The effects of load on transport and performance are mainly considered in the clamping mechanism of PEMFC [29,30,31]. For example, Wen et al. [32] investigated the effects of clamping force and various bolt configurations of clamping mechanisms on a unit cell and a ten-cell stack. They showed that the uniform contact pressure distribution led to a significant reduction in ohmic resistance and mass transport losses in the PEMFC. Imdat et al. [33] employed a three-dimensional model of a single channel to analyze the effect of clamping force on gas diffusion layers. The results showed that the thickness and porosity of the gas diffusion layer decreased with the increase in the clamping force with an optimal clamping force of 0.5–1.0 MPa. Alizadeh et al. [34] analyzed the effects of different materials, sealant hardness, and the number of stacks on the contact pressure on the MEA by the finite element method. Irmscher et al. [35] designed three combinations of clamping pressure and materials of a gas diffusion layer, and scanned the topography with an electron microscope. It indicated that the performance of a stack is optimal with 0.6 N/mm2 and TPG-H. The above-mentioned studies demonstrated the significant effect of clamping pressure on PEMFC performance.
However, the interaction between the surface topography and clamping pressure has not been fully revealed up to now. Previous studies only focused on the one-way interaction of clamping pressure, surface topography, and sealing performance. The coupled interactions among these three factors are unclear and worthy of investigation [36]. The main objective of this work is to investigate the effect of surface topography and clamping pressure on sealing performance. In this work, the W-M function is developed to construct the surface of a seal, and the effects of fractal dimension and characteristic scale coefficient on roughness are analyzed. Then, we obtained the relationship between clamping pressure and shrinkage height of sealing and calculated the leakage rate by a two-dimensional model of PEMFC in Abaqus. Moreover, the relationship between the clamping pressure and the roughness of the sealing was constructed. Finally, we provide comments on the selection of sealing for PEMFC.

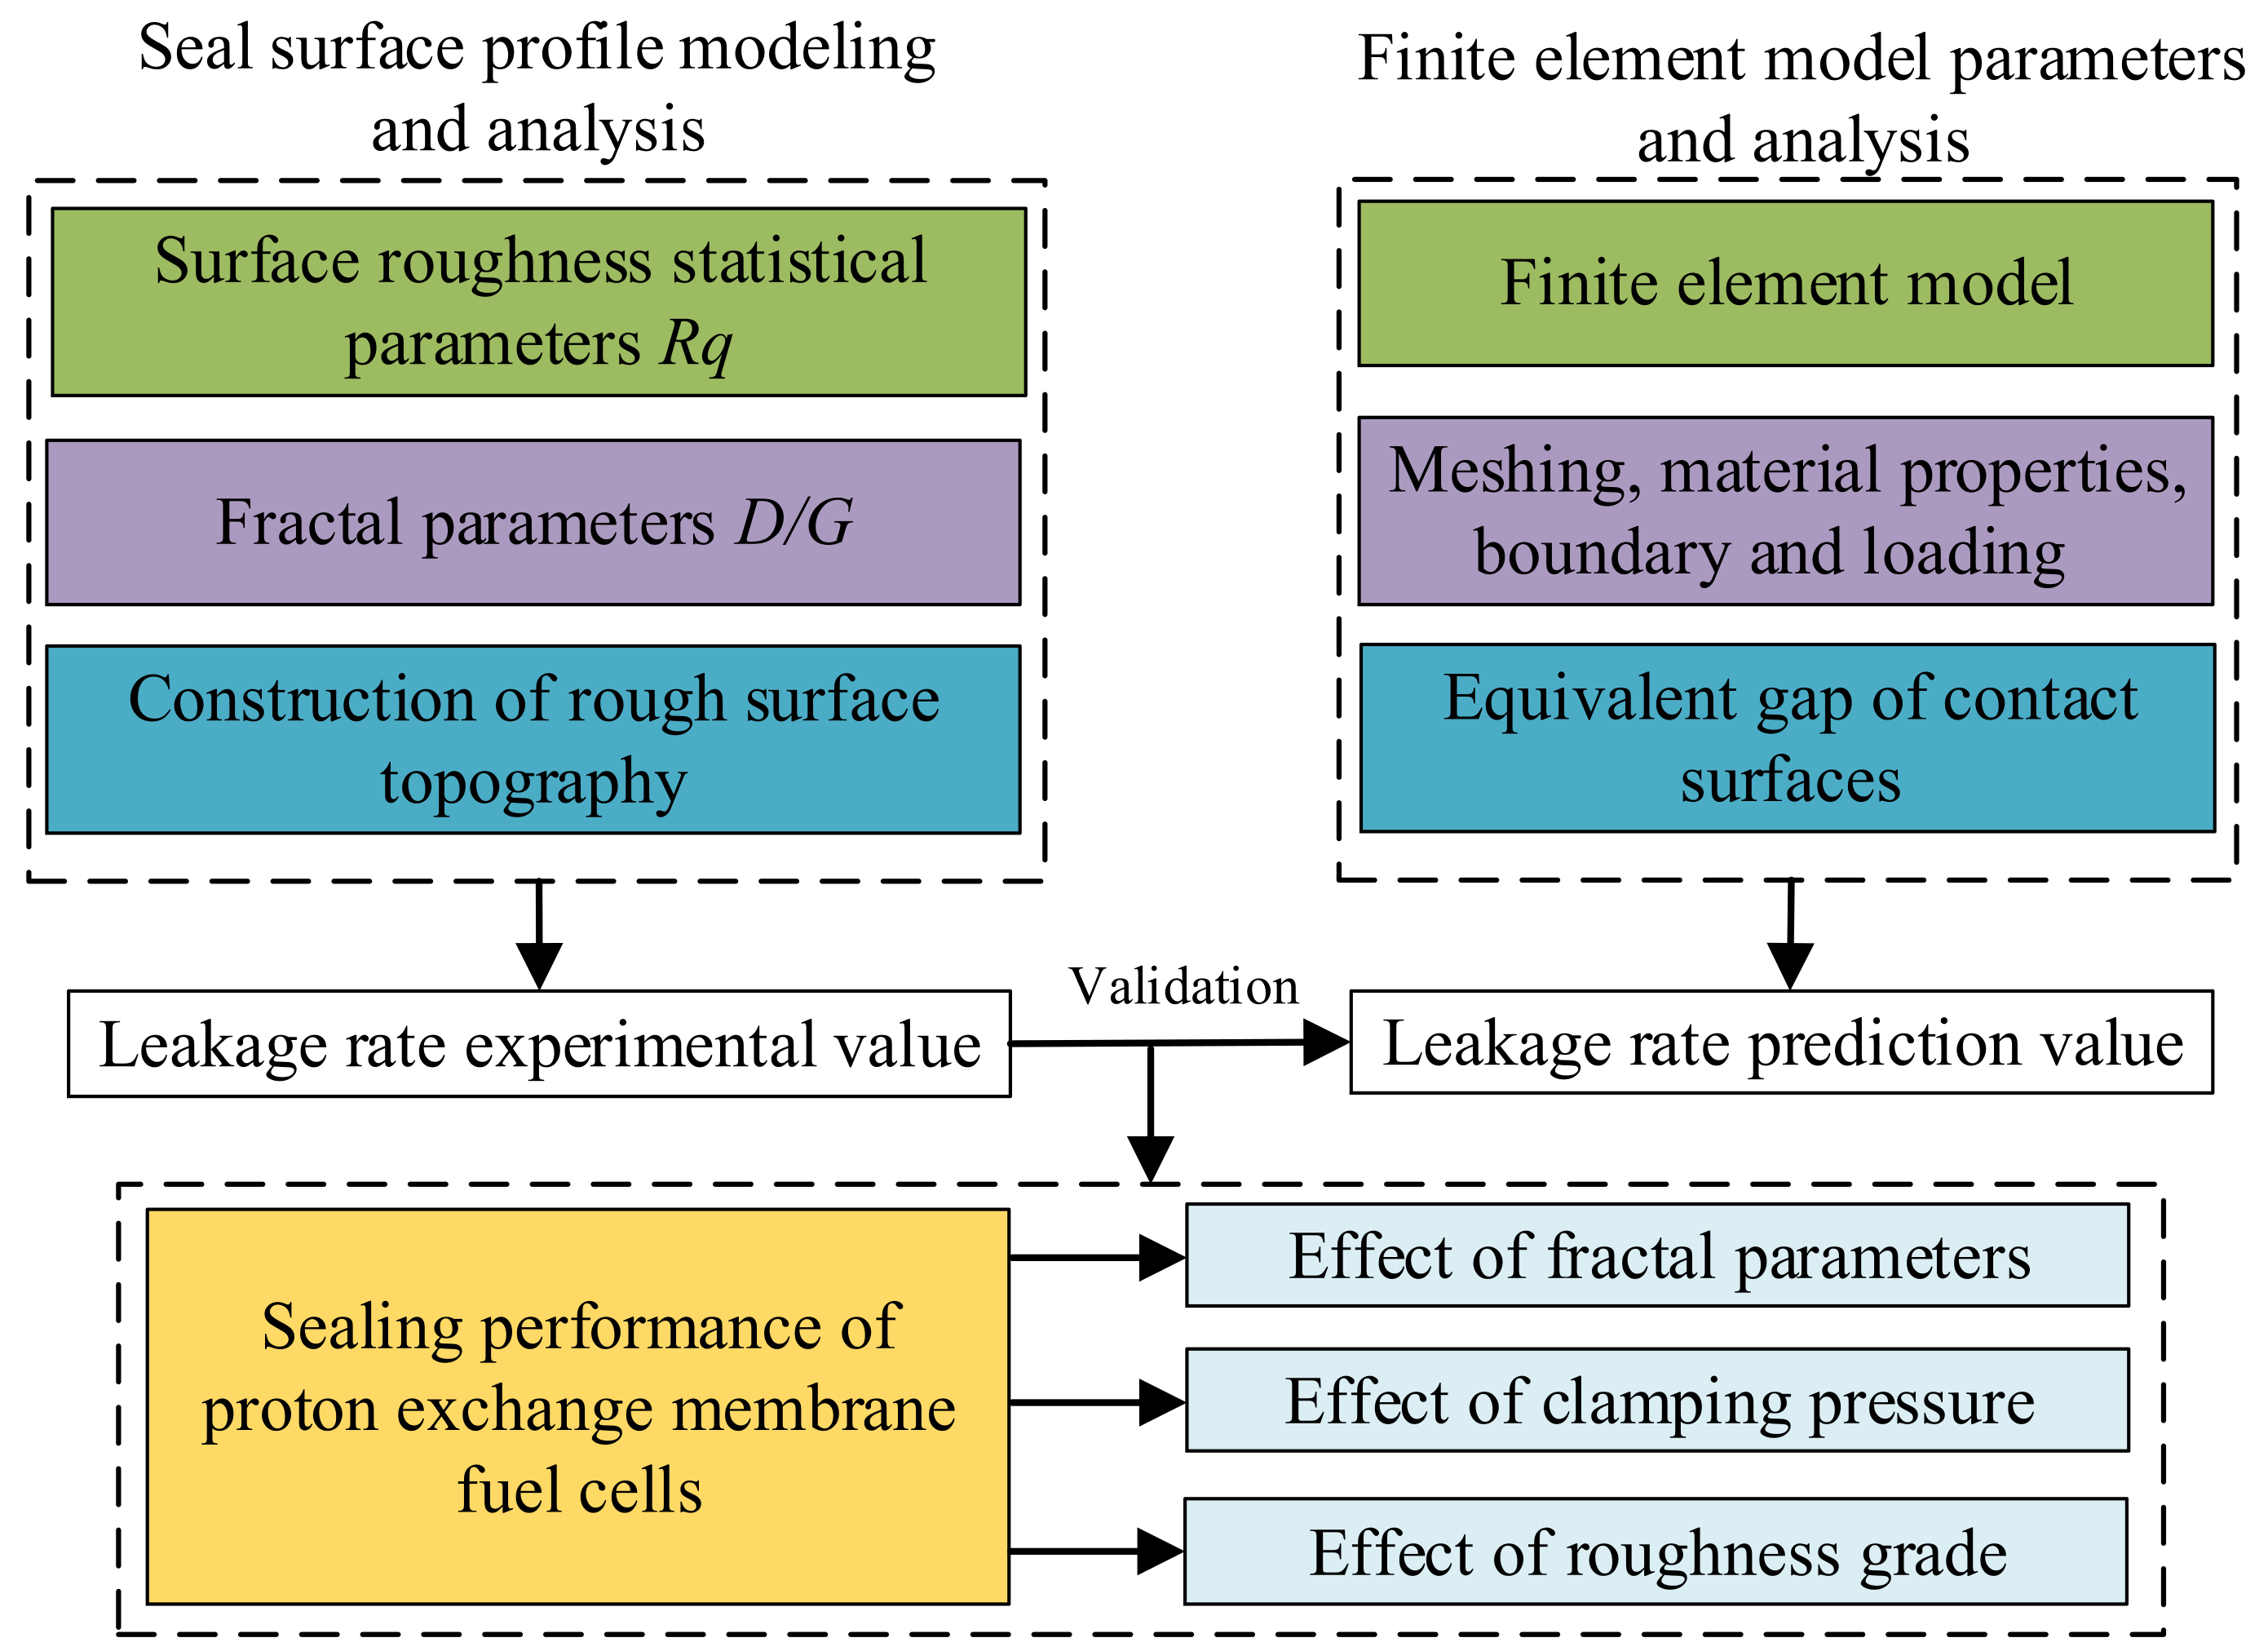
2. Materials and Methods

2.1. Model Developments

The objective of this work is to propose an effective approach to predict the leakage rate. A schematic diagram of the methodology is presented in Figure 1. First, we obtained the actual seal surface statistical parameters Rq from an experiment, applied the power spectral density method to obtain the fractal parameters D and G, selected the W-M function to characterize the rough surface topography, and measured the actual surface leakage rate. Then, a finite element model with microscopic morphology was established to simulate the mechanical contact properties between BPP and the gasket. We chose a suitable strategy for meshing, and provide realistic material and boundary conditions. Based on the simulation results, calculated the surface equivalent gap and the leakage rate by the combined Poiseuille theory. We compared the differences between the simulation and experimental results. After that, by using the evaluation for leakage rate, the parameters, namely fractal parameters, clamping pressure, and roughness class, were investigated to guide the leakage rate refinement calculation based on the finite element model.

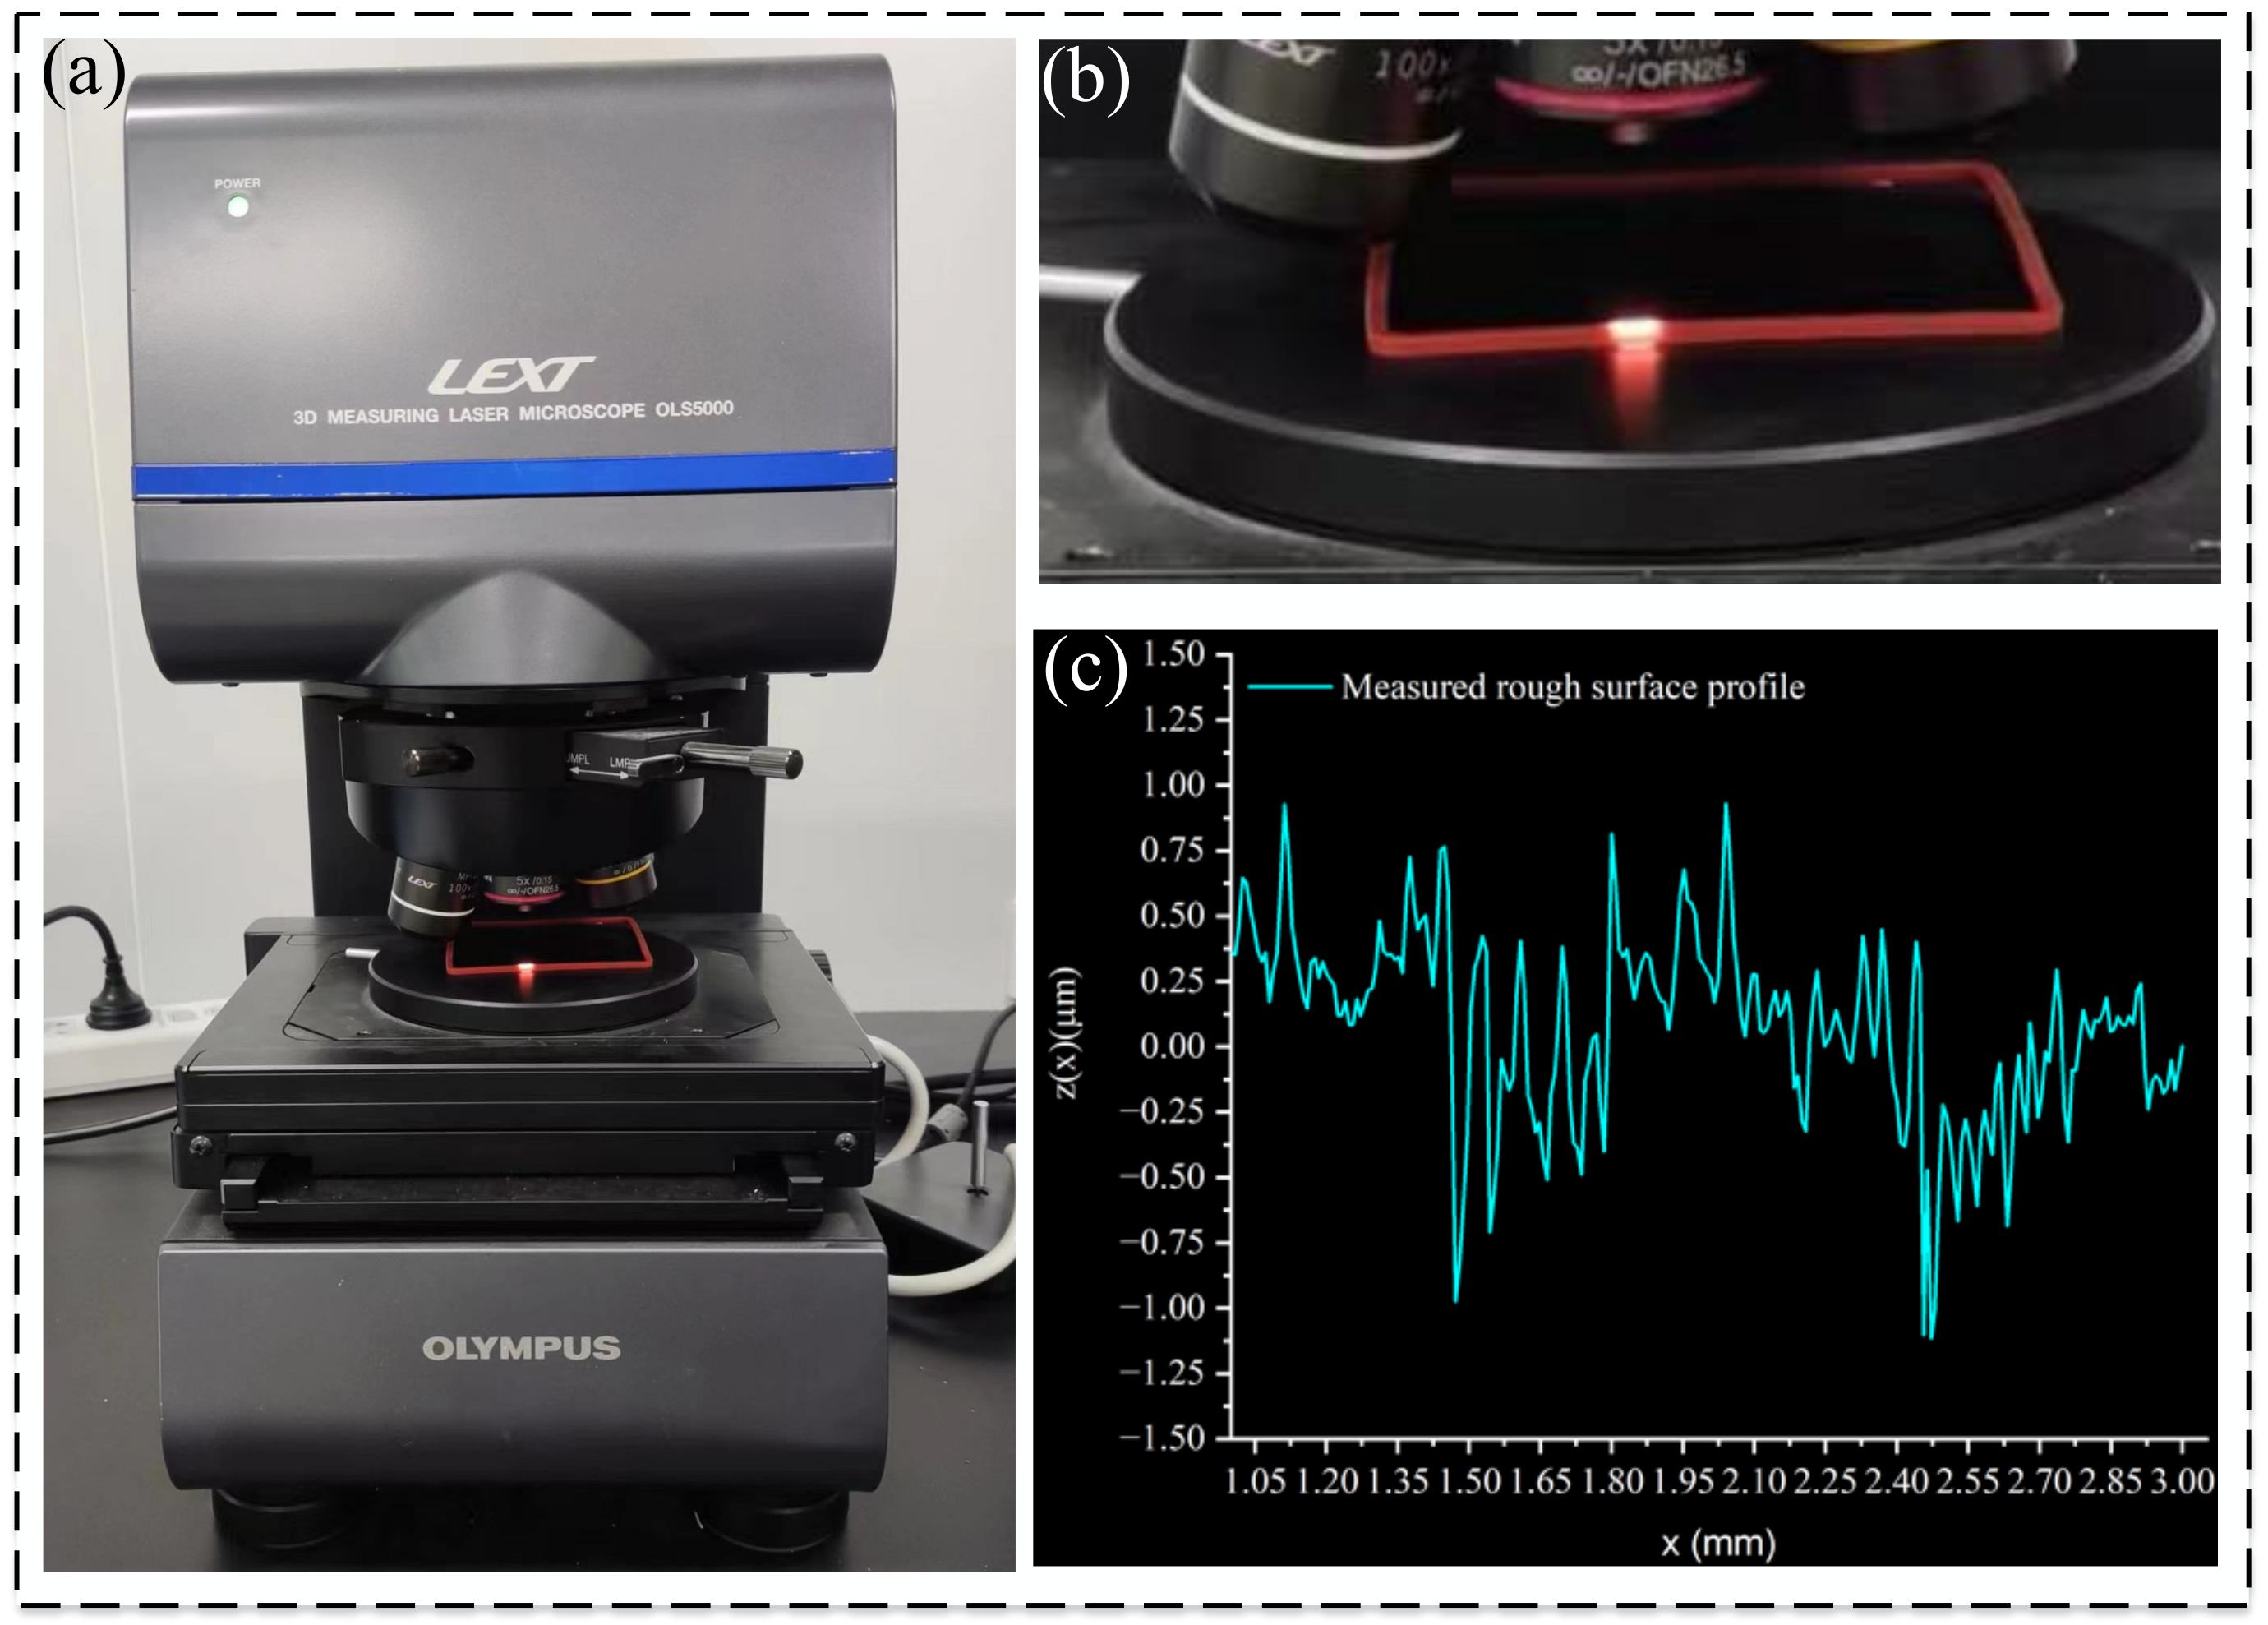
2.2. Dual Characterization Method to Construct Seal Surface Micromorphology

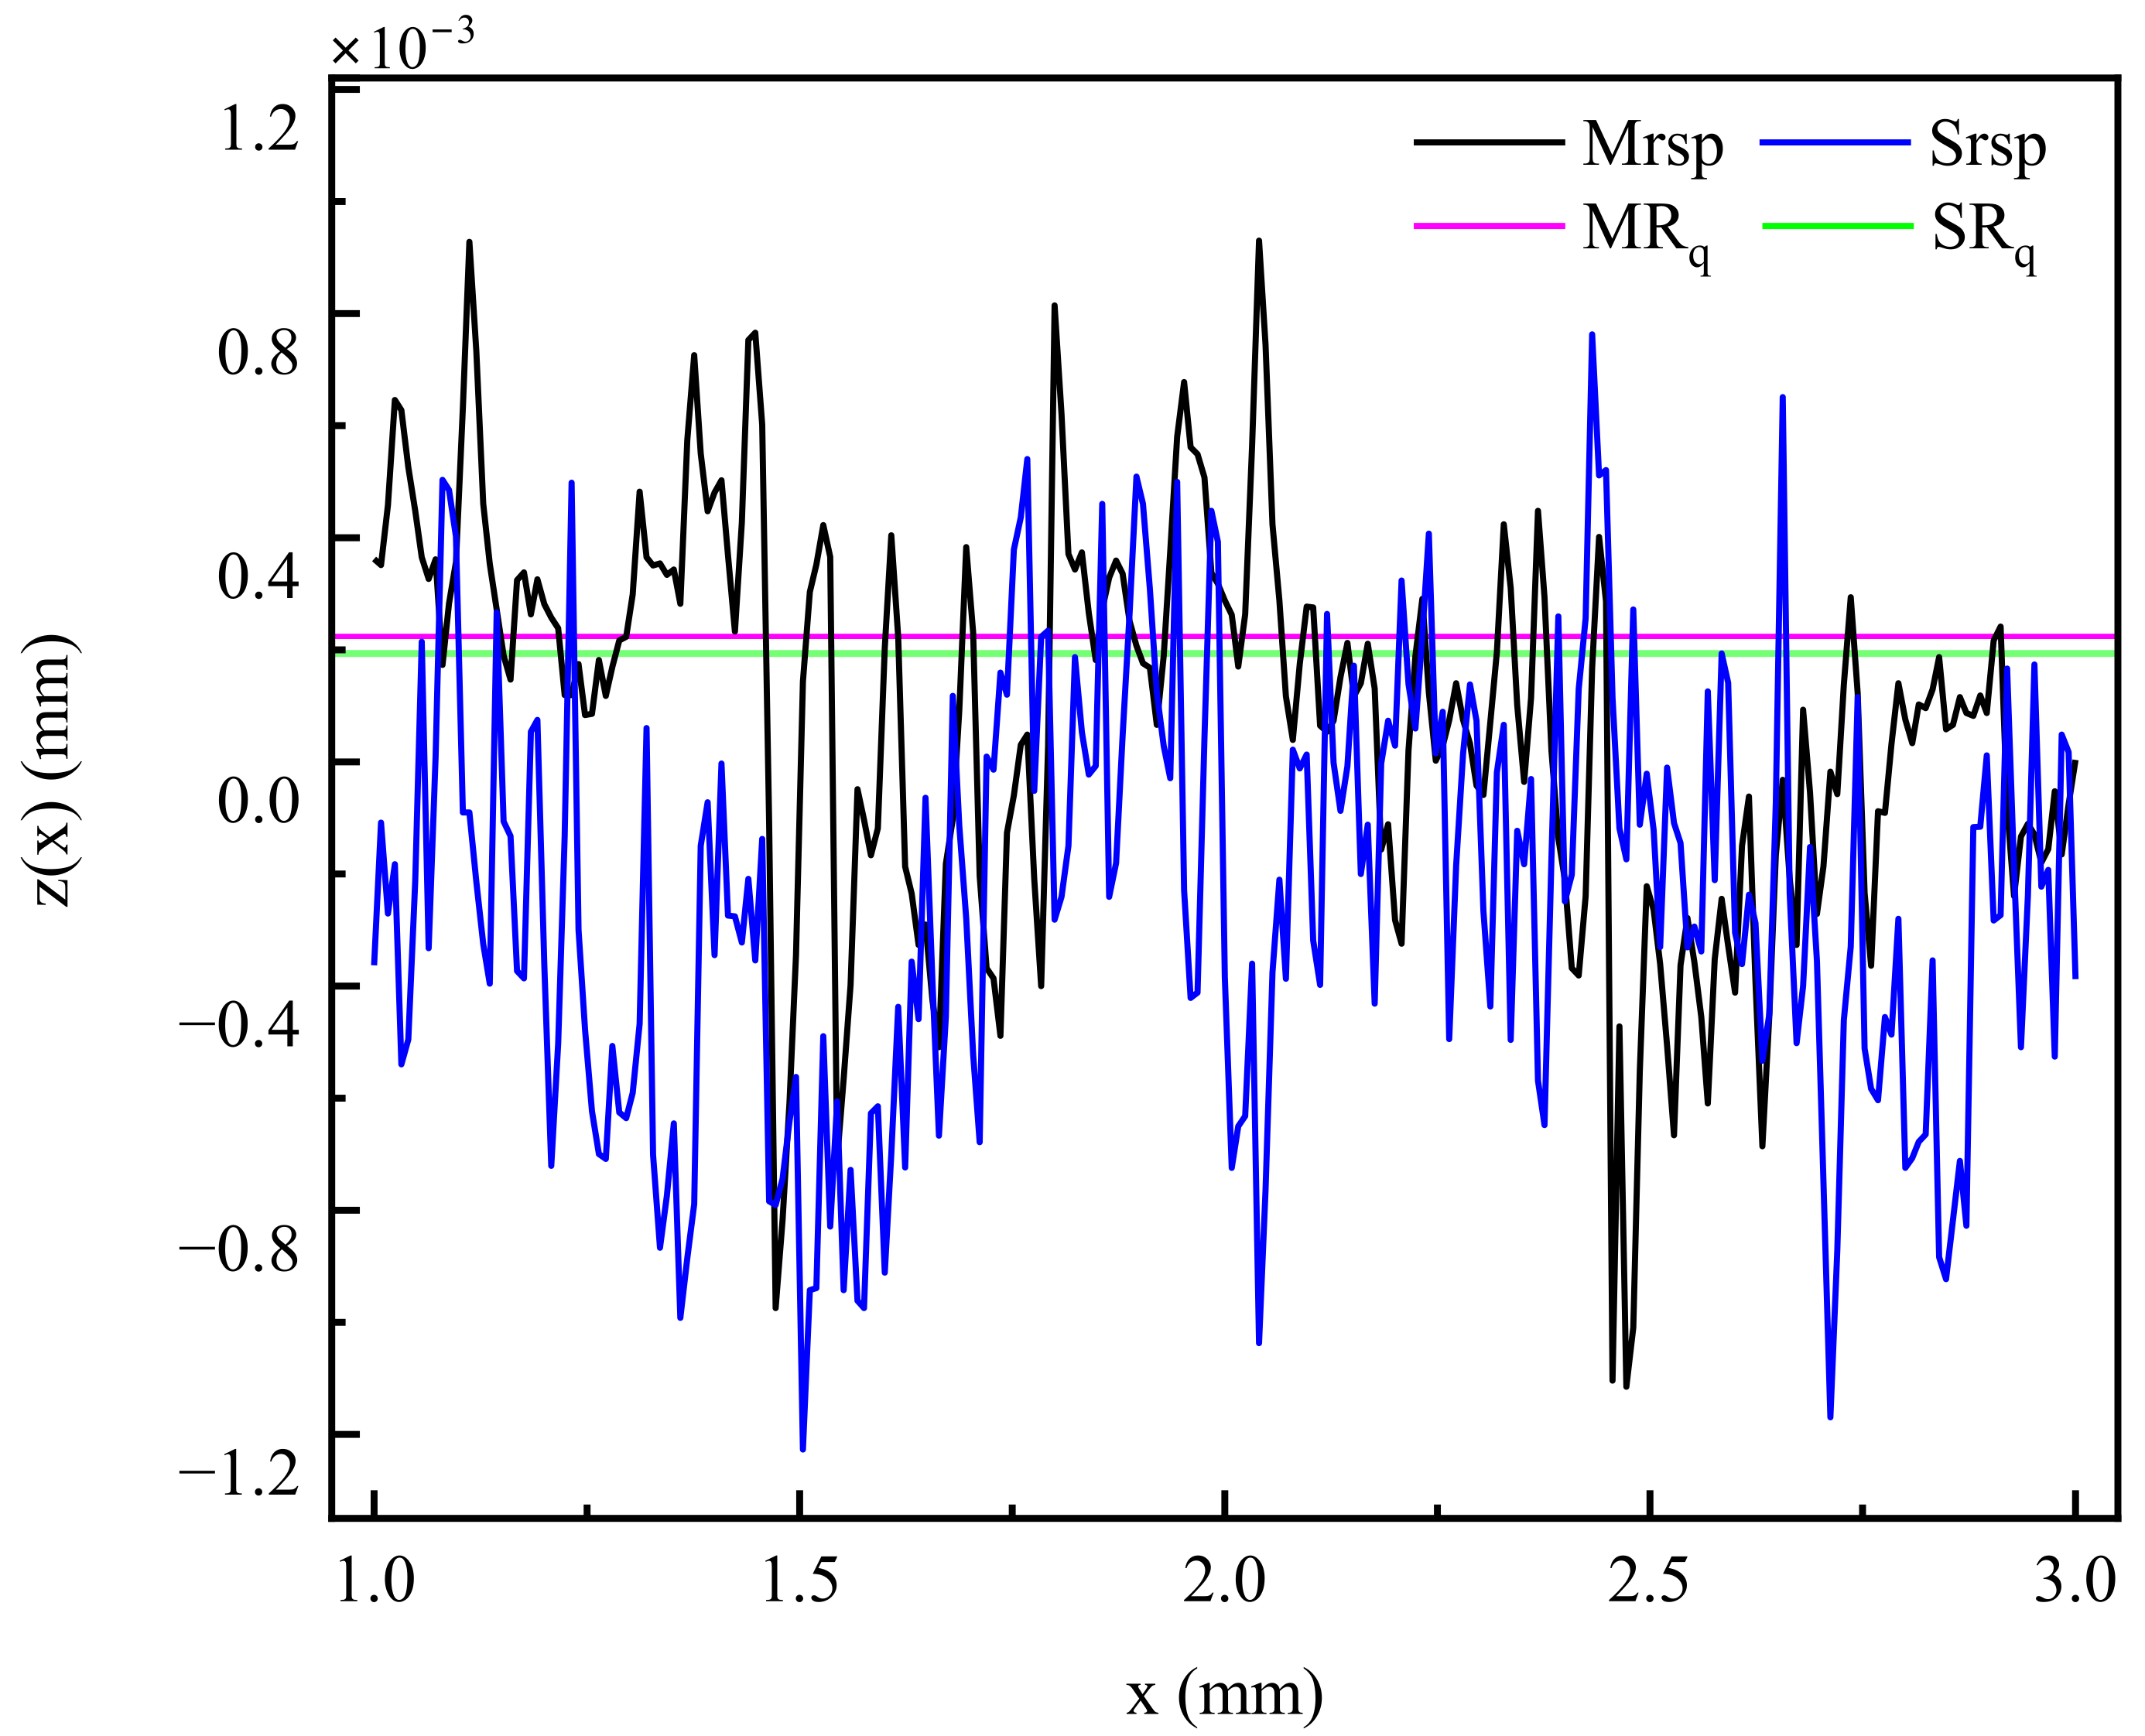
2.2.1. Root Mean Square Deviation Method

In practical cases, the process specification and processing method determine the surface morphology of the component to be an irregular geometry consisting of a series of peaks and valleys of different heights and spacing. The fluctuating spacing on the surface profile cross-section of less than 1 mm is called surface roughness, and its characterization method mainly contains statistical parameters and fractal parameters. The statistical parameters are generally adopted in practical engineering applications to characterize the height characteristics of surface roughness, expressed as follows:
R q = 1 L 0 L y 2 ( x ) d x
where R q is the root mean square of surface roughness, L is the sampling length, and y ( x ) is the distance between the contour point and the reference line.

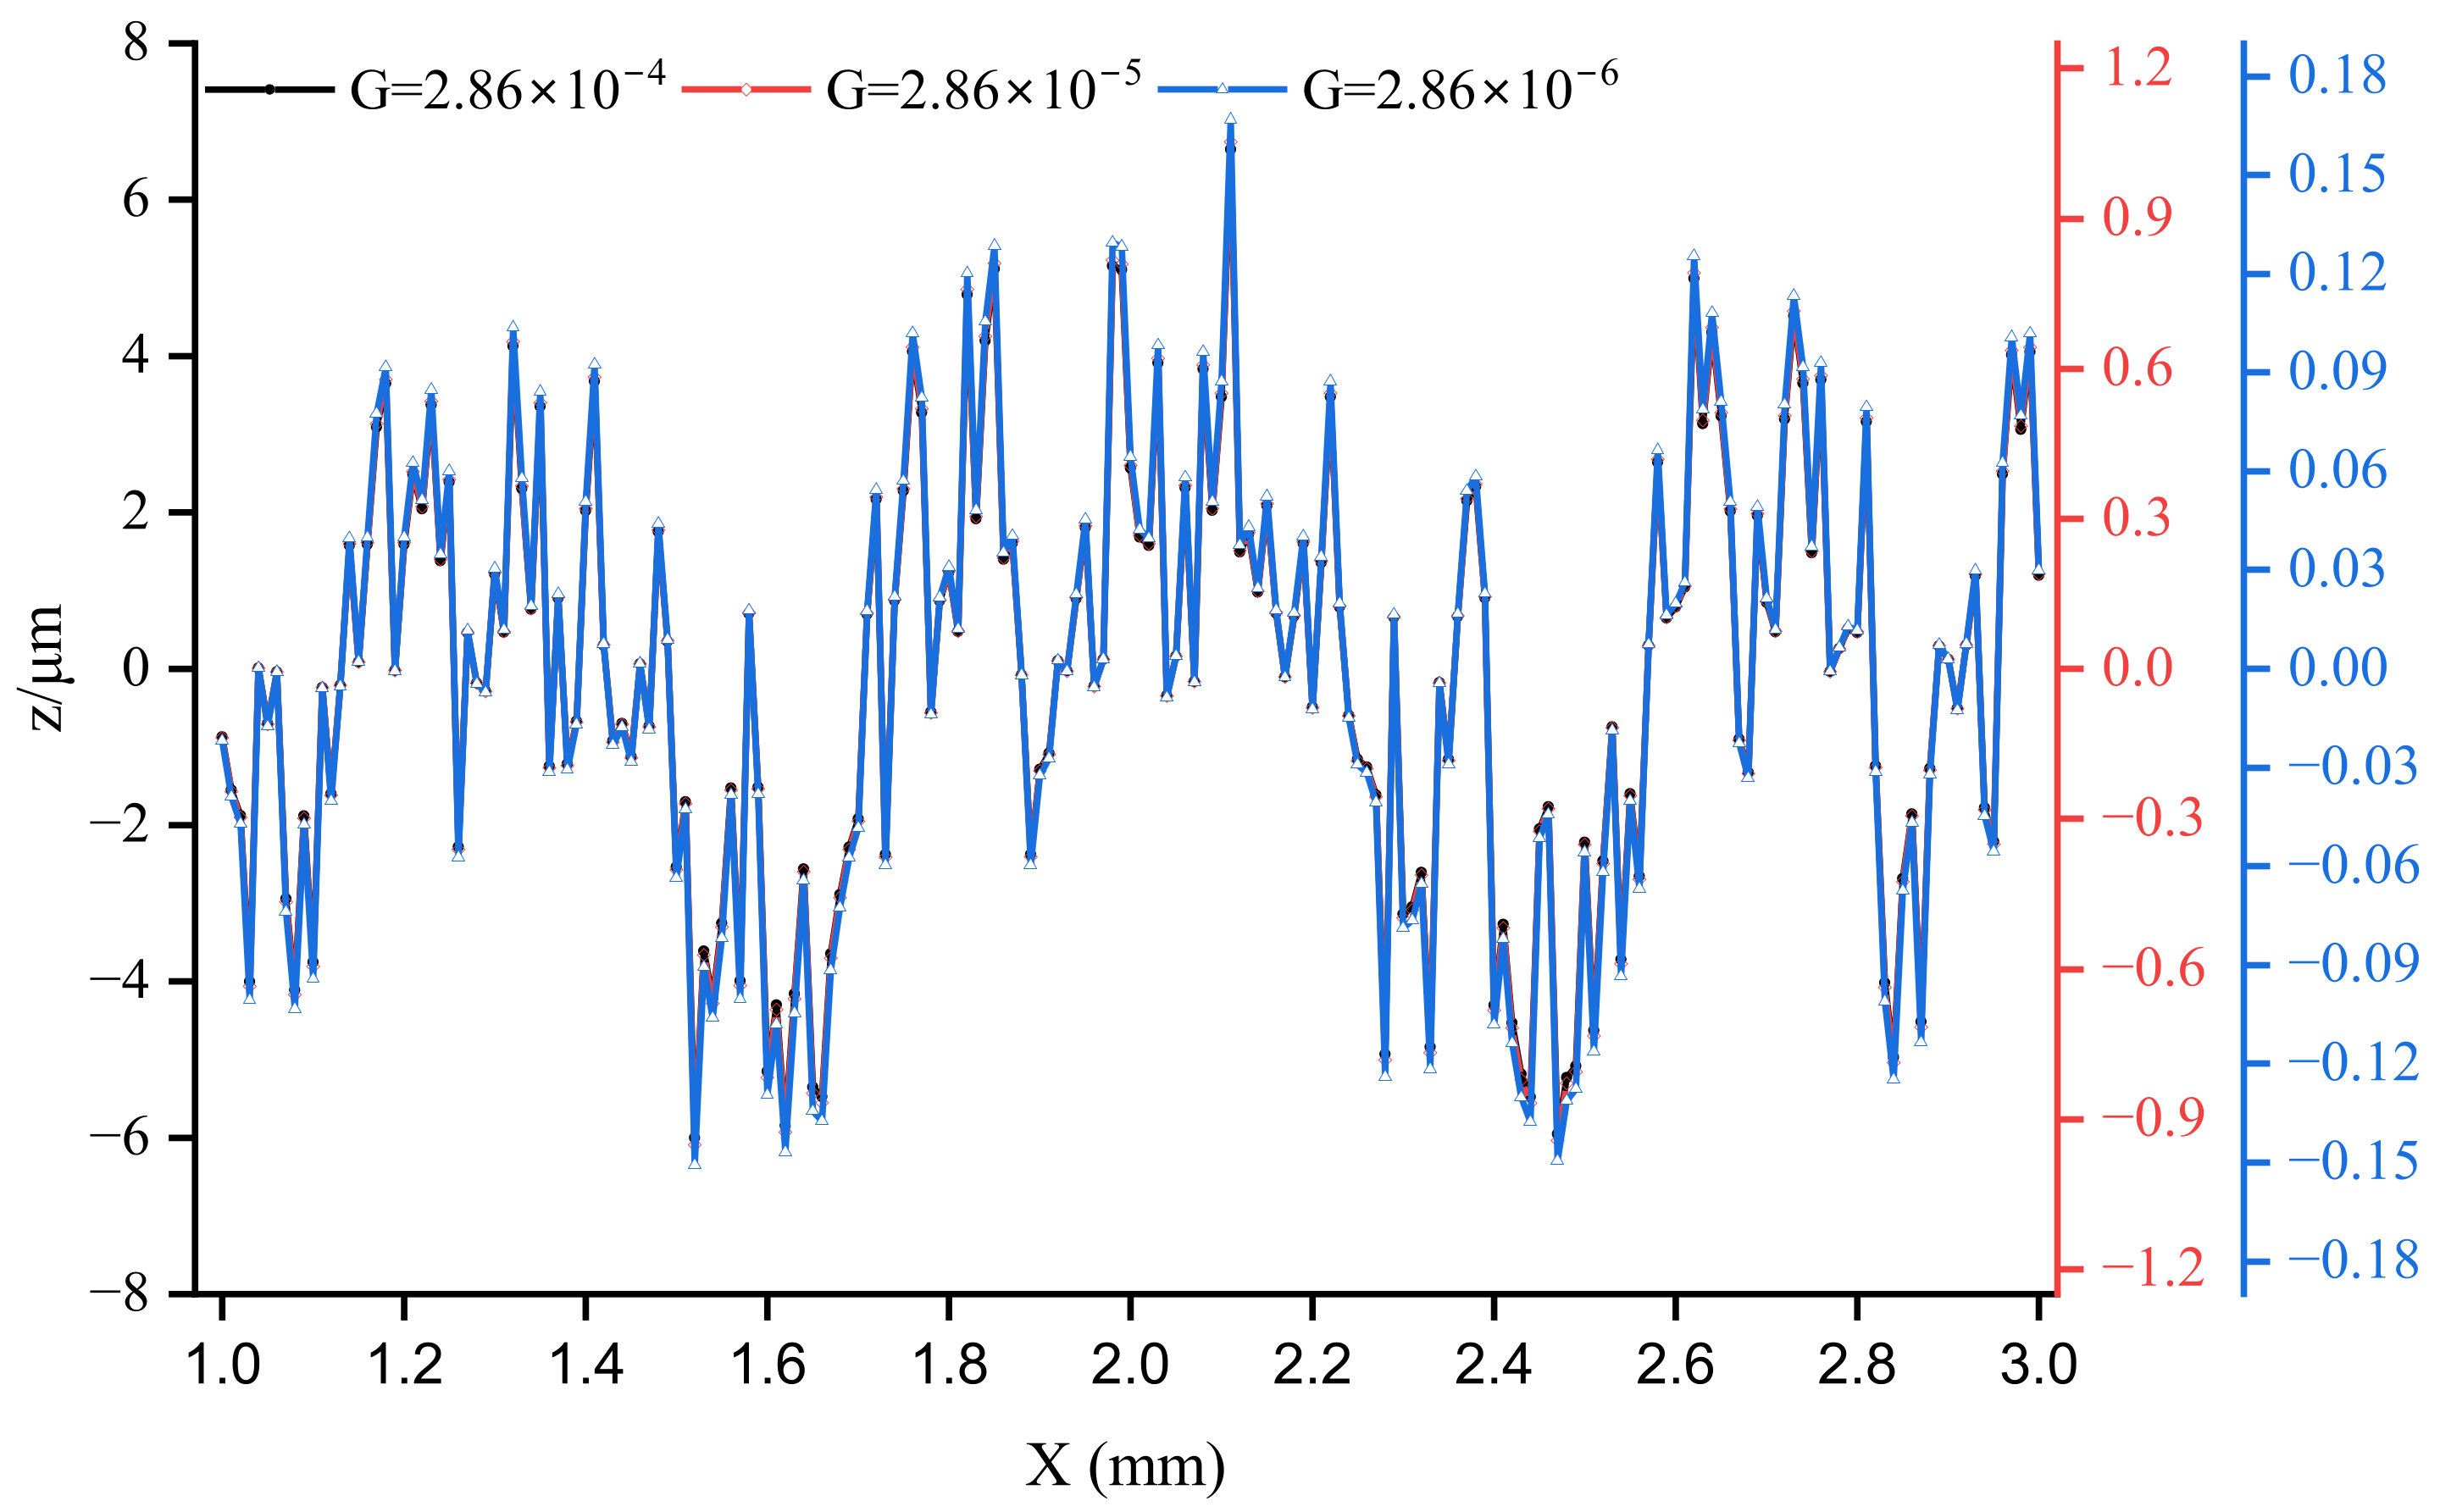
2.2.2. Weierstrass–Mandelbrot Function

A single evaluation parameter cannot characterize complex surface morphology, but fractal parameters can reflect the physical nature of surface morphology compared with statistical parameter characterization methods. Therefore, this paper combines two characterization methods to construct the surface profile of the seal. The W-M function with fractal characteristics and self-simulation is chosen to describe the microscopic surface morphology of the sample as follows:
Z ( x ) = G D 1 n = n 1 cos 2 π γ n x γ ( 2 D ) n , γ > 1 , 1 < D < 2
where Z ( x ) is the surface profile height at the lateral distance x , G is the characteristic length scale of a surface and is constant, D is the fractal dimensions, γ is the discrete frequency of the surface roughness, and n 1 corresponds to the low cutoff frequency of the profile.

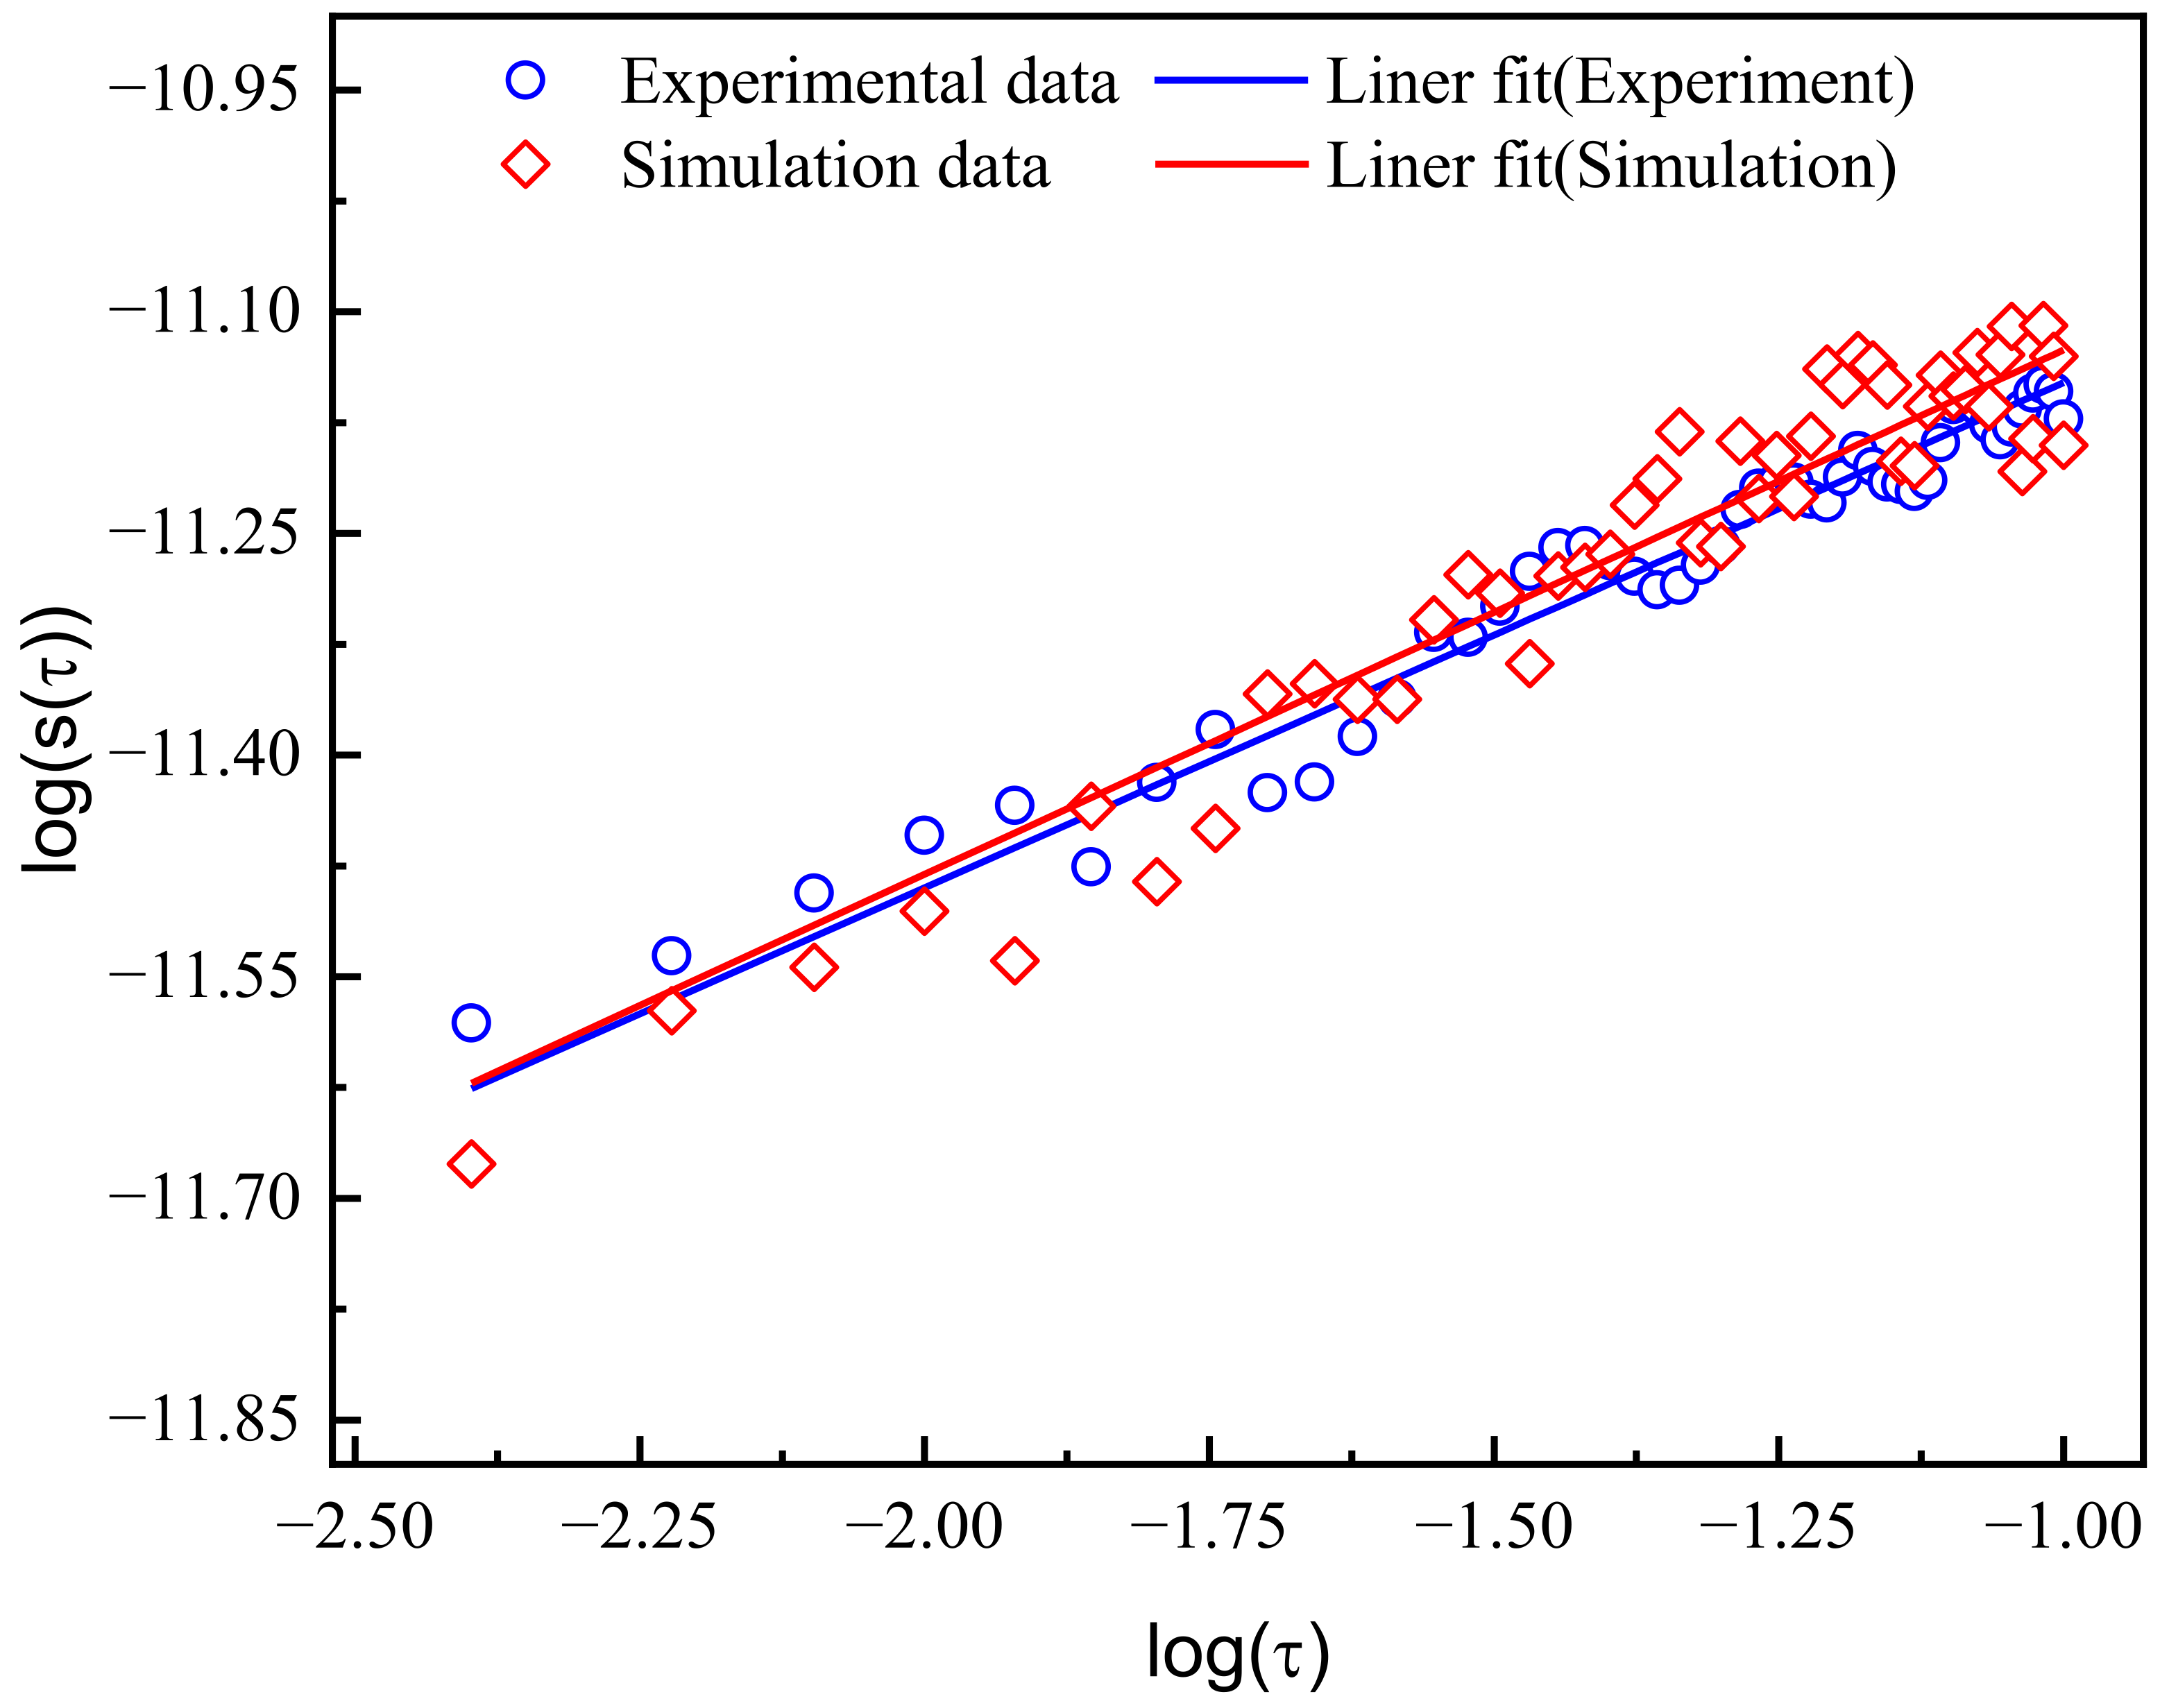
2.2.3. Structure Function Method

In order to accurately characterize the surface morphology of the seal, the structure function is used to calculate the fractal parameters, the expressions of which are as follows:
S ( τ ) = z ( x + τ ) z ( x ) 2 = + p ( ω ) ( e j ω τ 1 ) d ω
where τ is the arbitrary increment in x . implies spatial average. The power spectrum of the W-M function P ( ω ) can be approximated by a continuous spectrum [37]:
P ( ω ) = G 2 ( D 1 ) 2 ln γ 1 ω ( 5 2 D )
where ω is the cutoff frequency. Substituting Equation (4) into Equation (3) and integrating it yields the following:
S ( τ ) = z ( x + τ ) z ( x ) 2 = Γ ( 2 D 3 ) sin [ ( 2 D 3 ) π / 2 ] ( 4 2 D ) ln γ G 2 ( D 1 ) τ 4 2 D = C τ 4 2 D
where Γ is the second type of the Euler Gamma function. The logarithm transformation of Equation (5) is as follows:
lg [ s ( τ ) ] = ( 4 2 D ) lg ( τ ) + lg G 2 ( D 1 ) ( 4 2 D ) ln γ Γ ( 2 D 3 ) sin ( 2 D 3 ) 2 )
From Equation (6), we can see a linear relationship between lg [ s ( τ ) ] and lg ( τ ) , and the slope of the log–log plot can be calculated by the least squares method [38]. Thus, slope k is K = ( 4 2 D ) . The D and G are given as
D = ( 4 K ) / 2 G = ( 8 4 D ) 10 B Γ ( 2 D 3 ) sin ( 2 D 3 ) 2 ( D 1 )

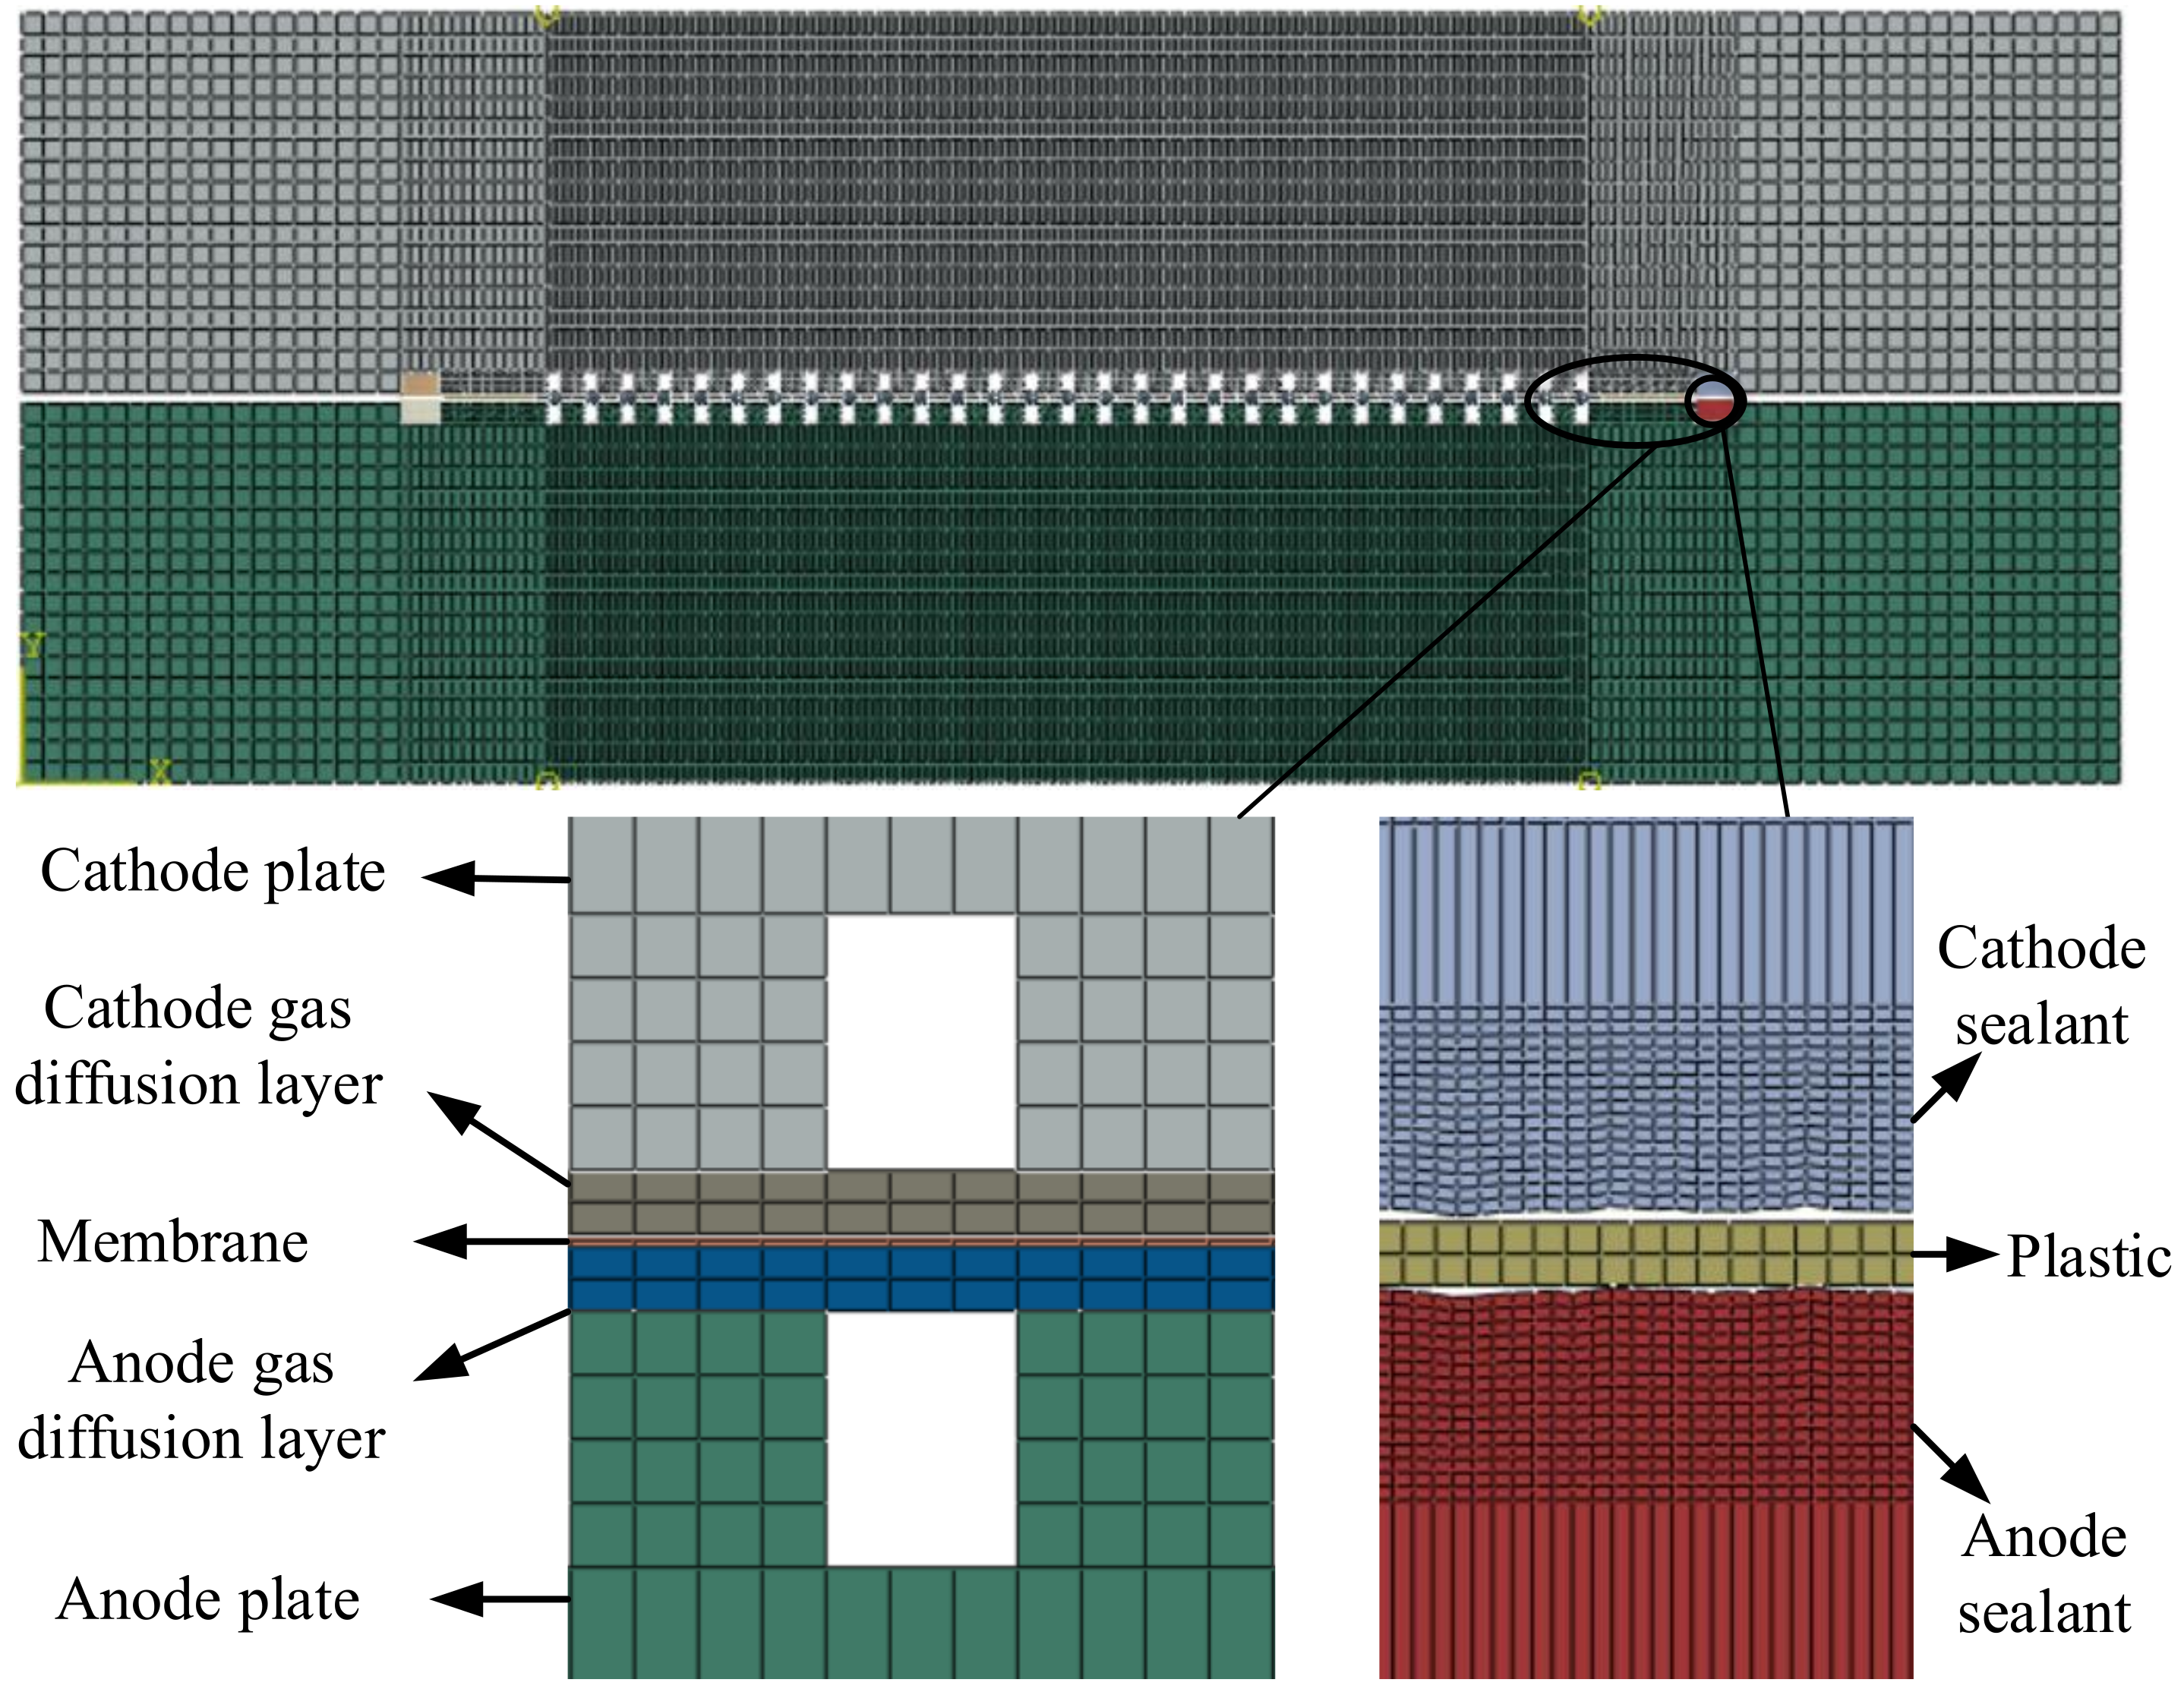
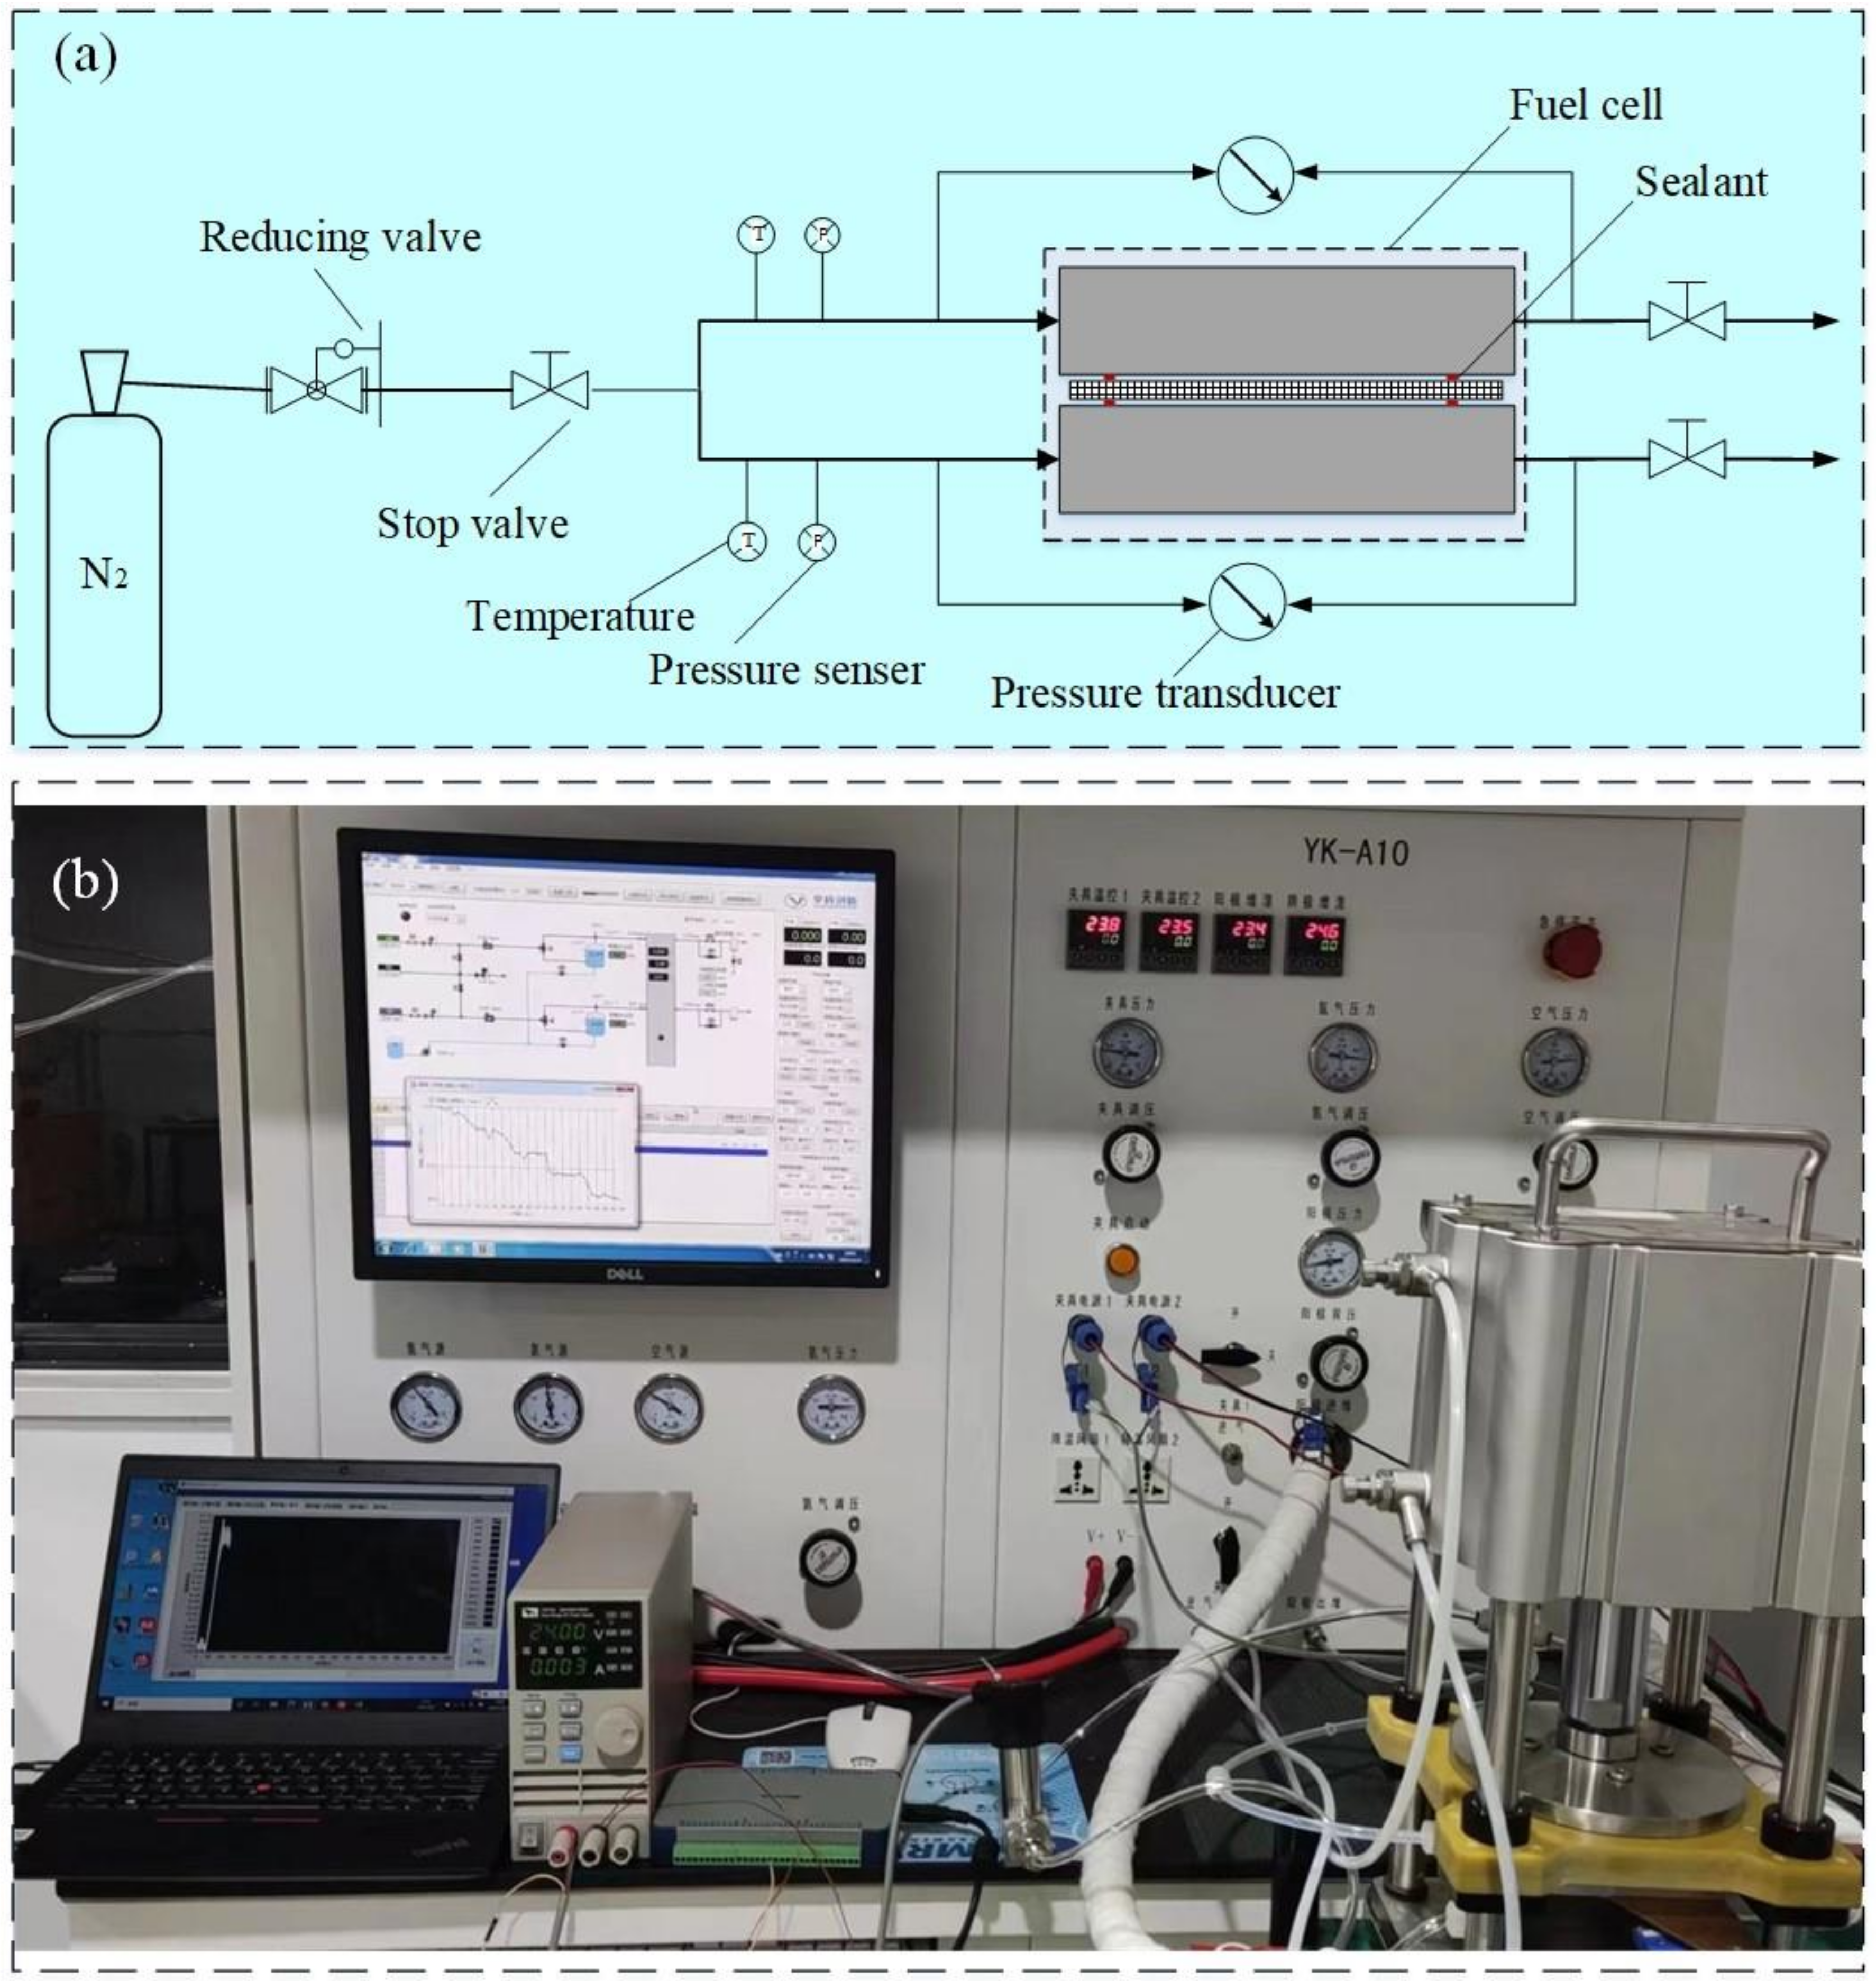
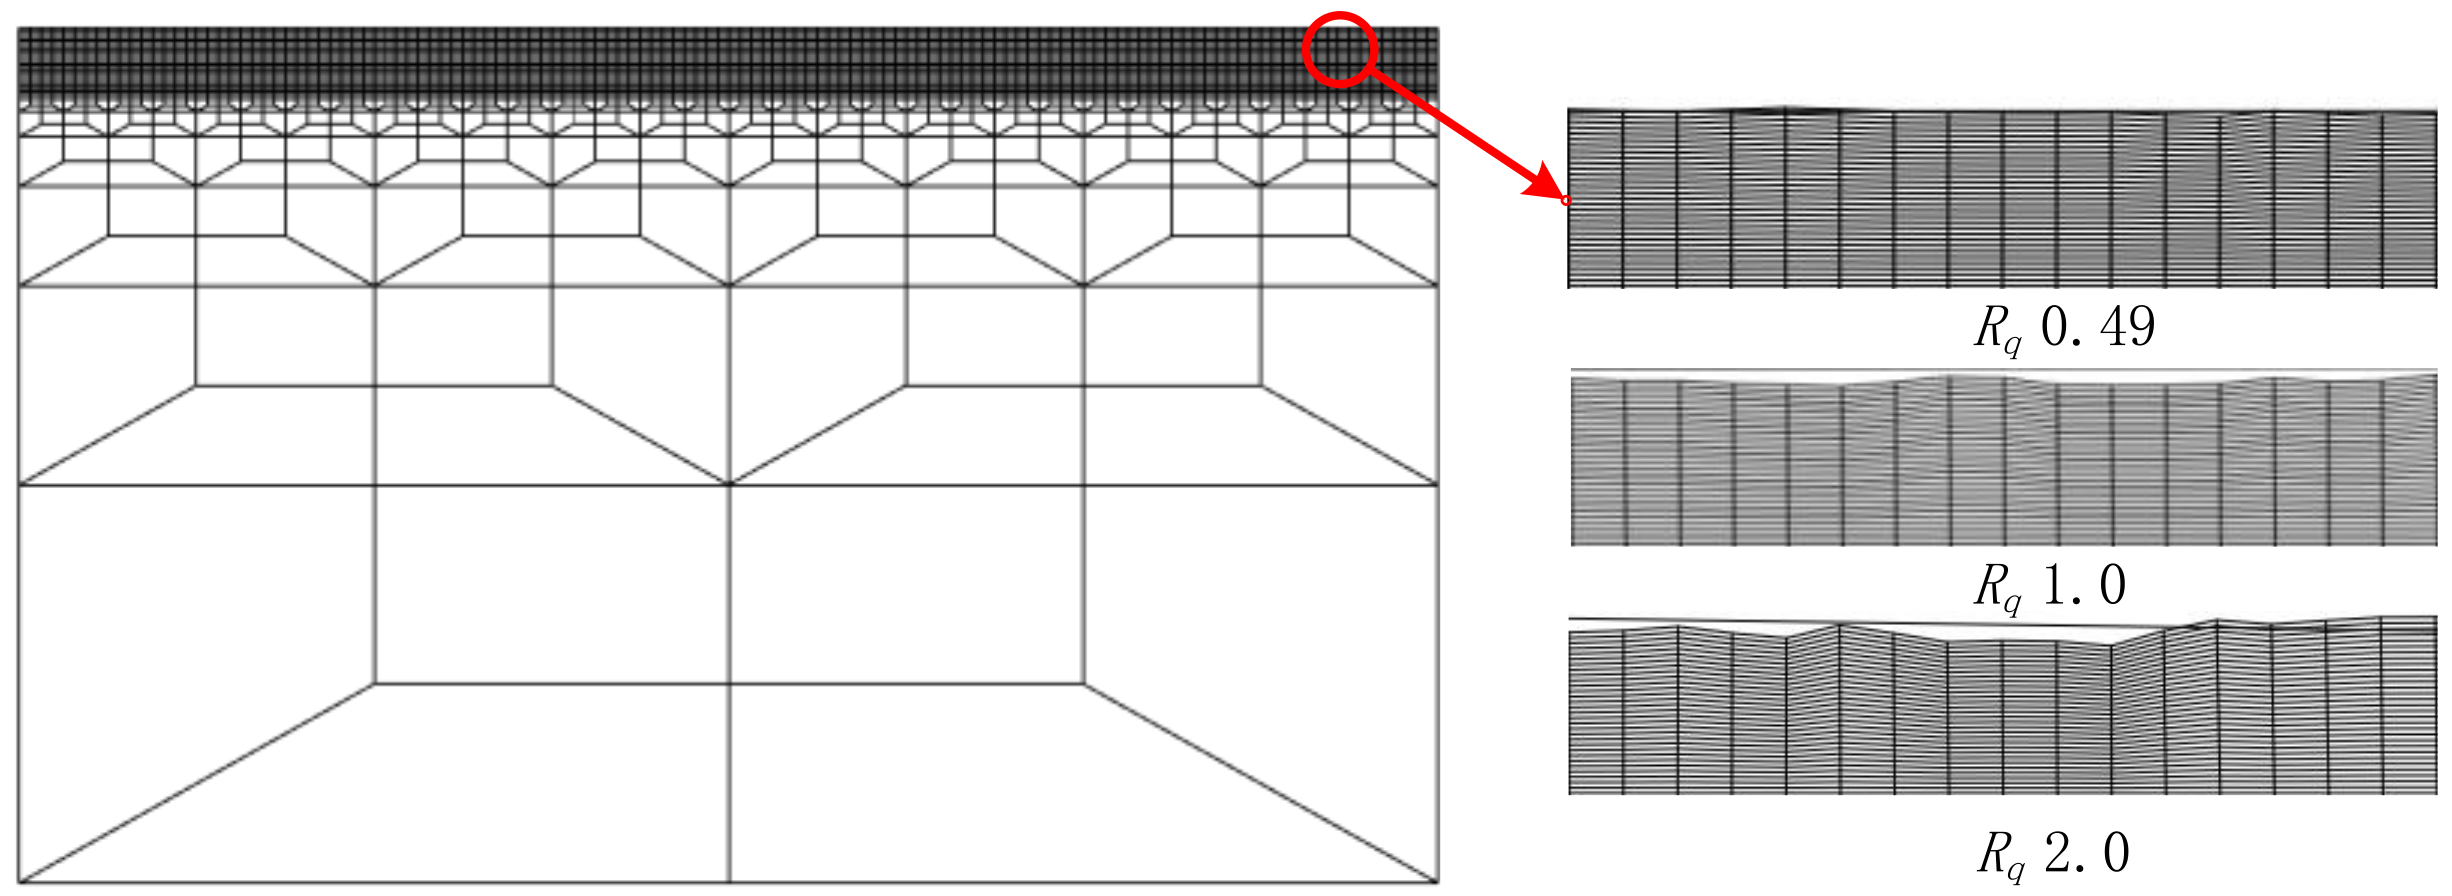
2.3. Fuel Cell Model Construction

2.3.1. Model Assumptions

For the sake of simplification, the following reasonable assumptions were made for the finite element modeling [39]:
  • The single cell is in a steady state.
  • The material’s properties are independent of temperature.
  • The deformation and swelling of the proton exchange membrane are ignored.
  • The gas diffusion layer consists of an isotropic porous medium.
  • The deformation of the component changes mainly in the direction of the clamping force, ignoring the deformation in other directions.

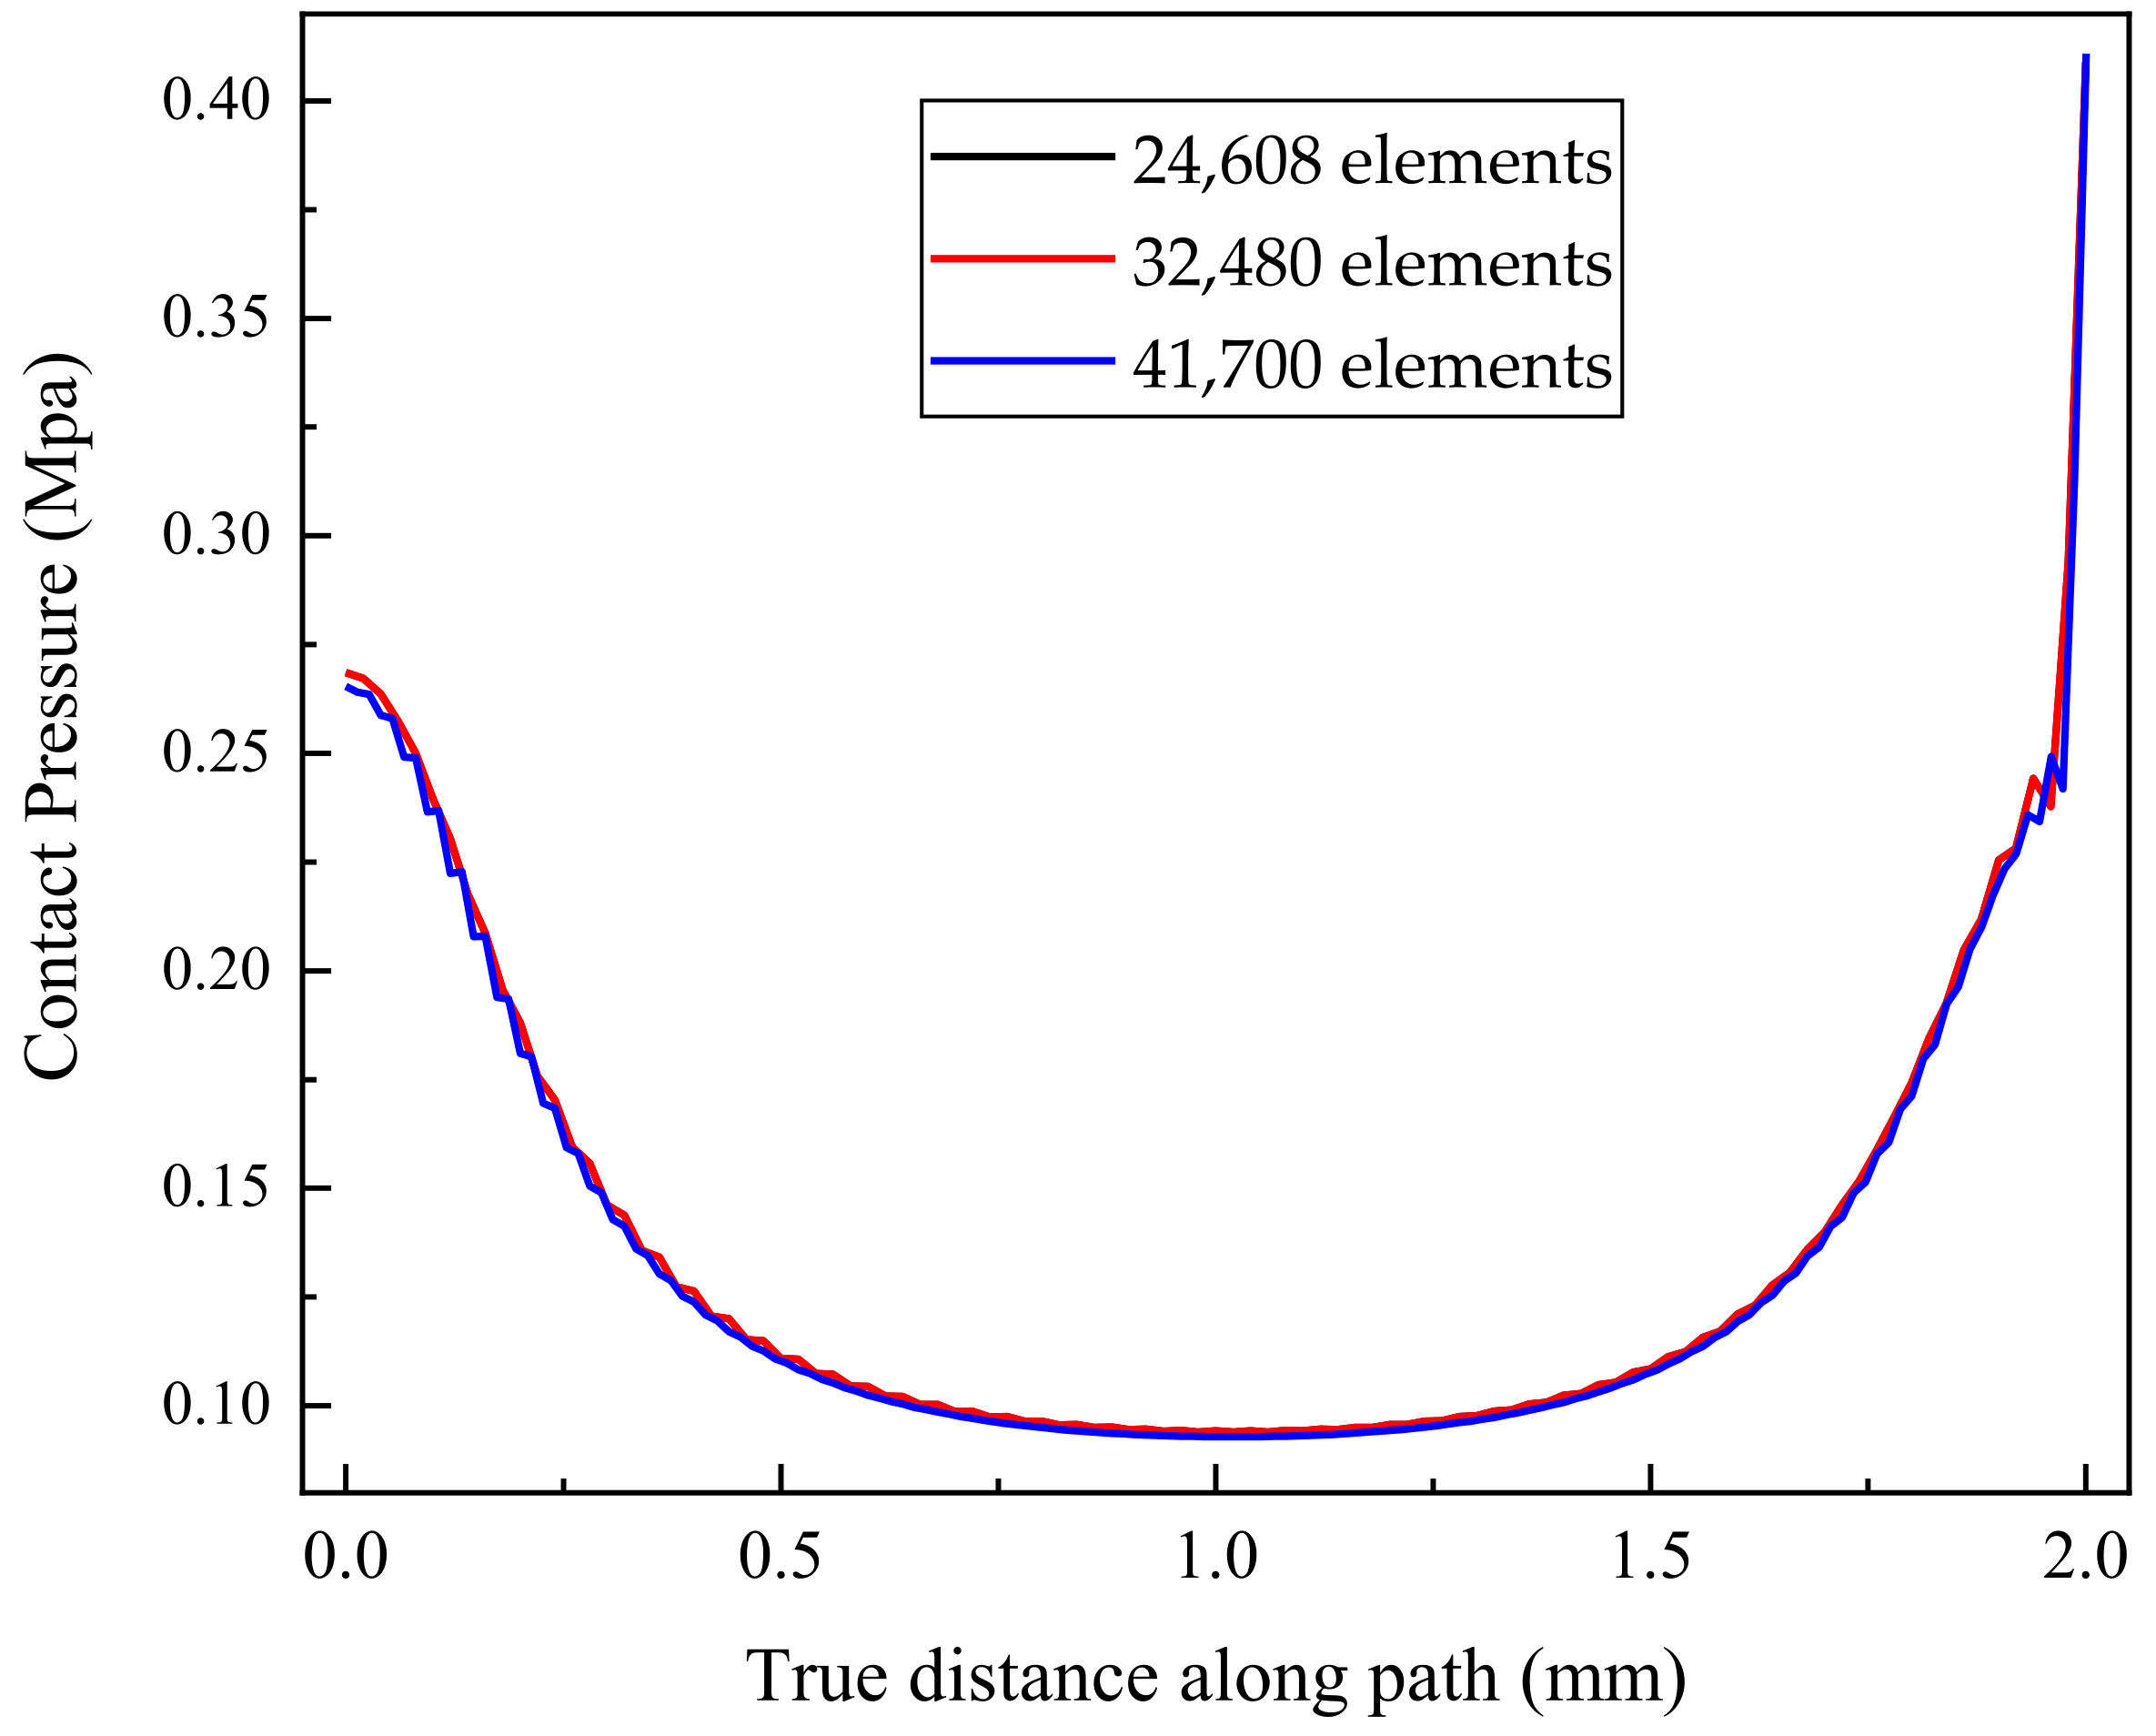
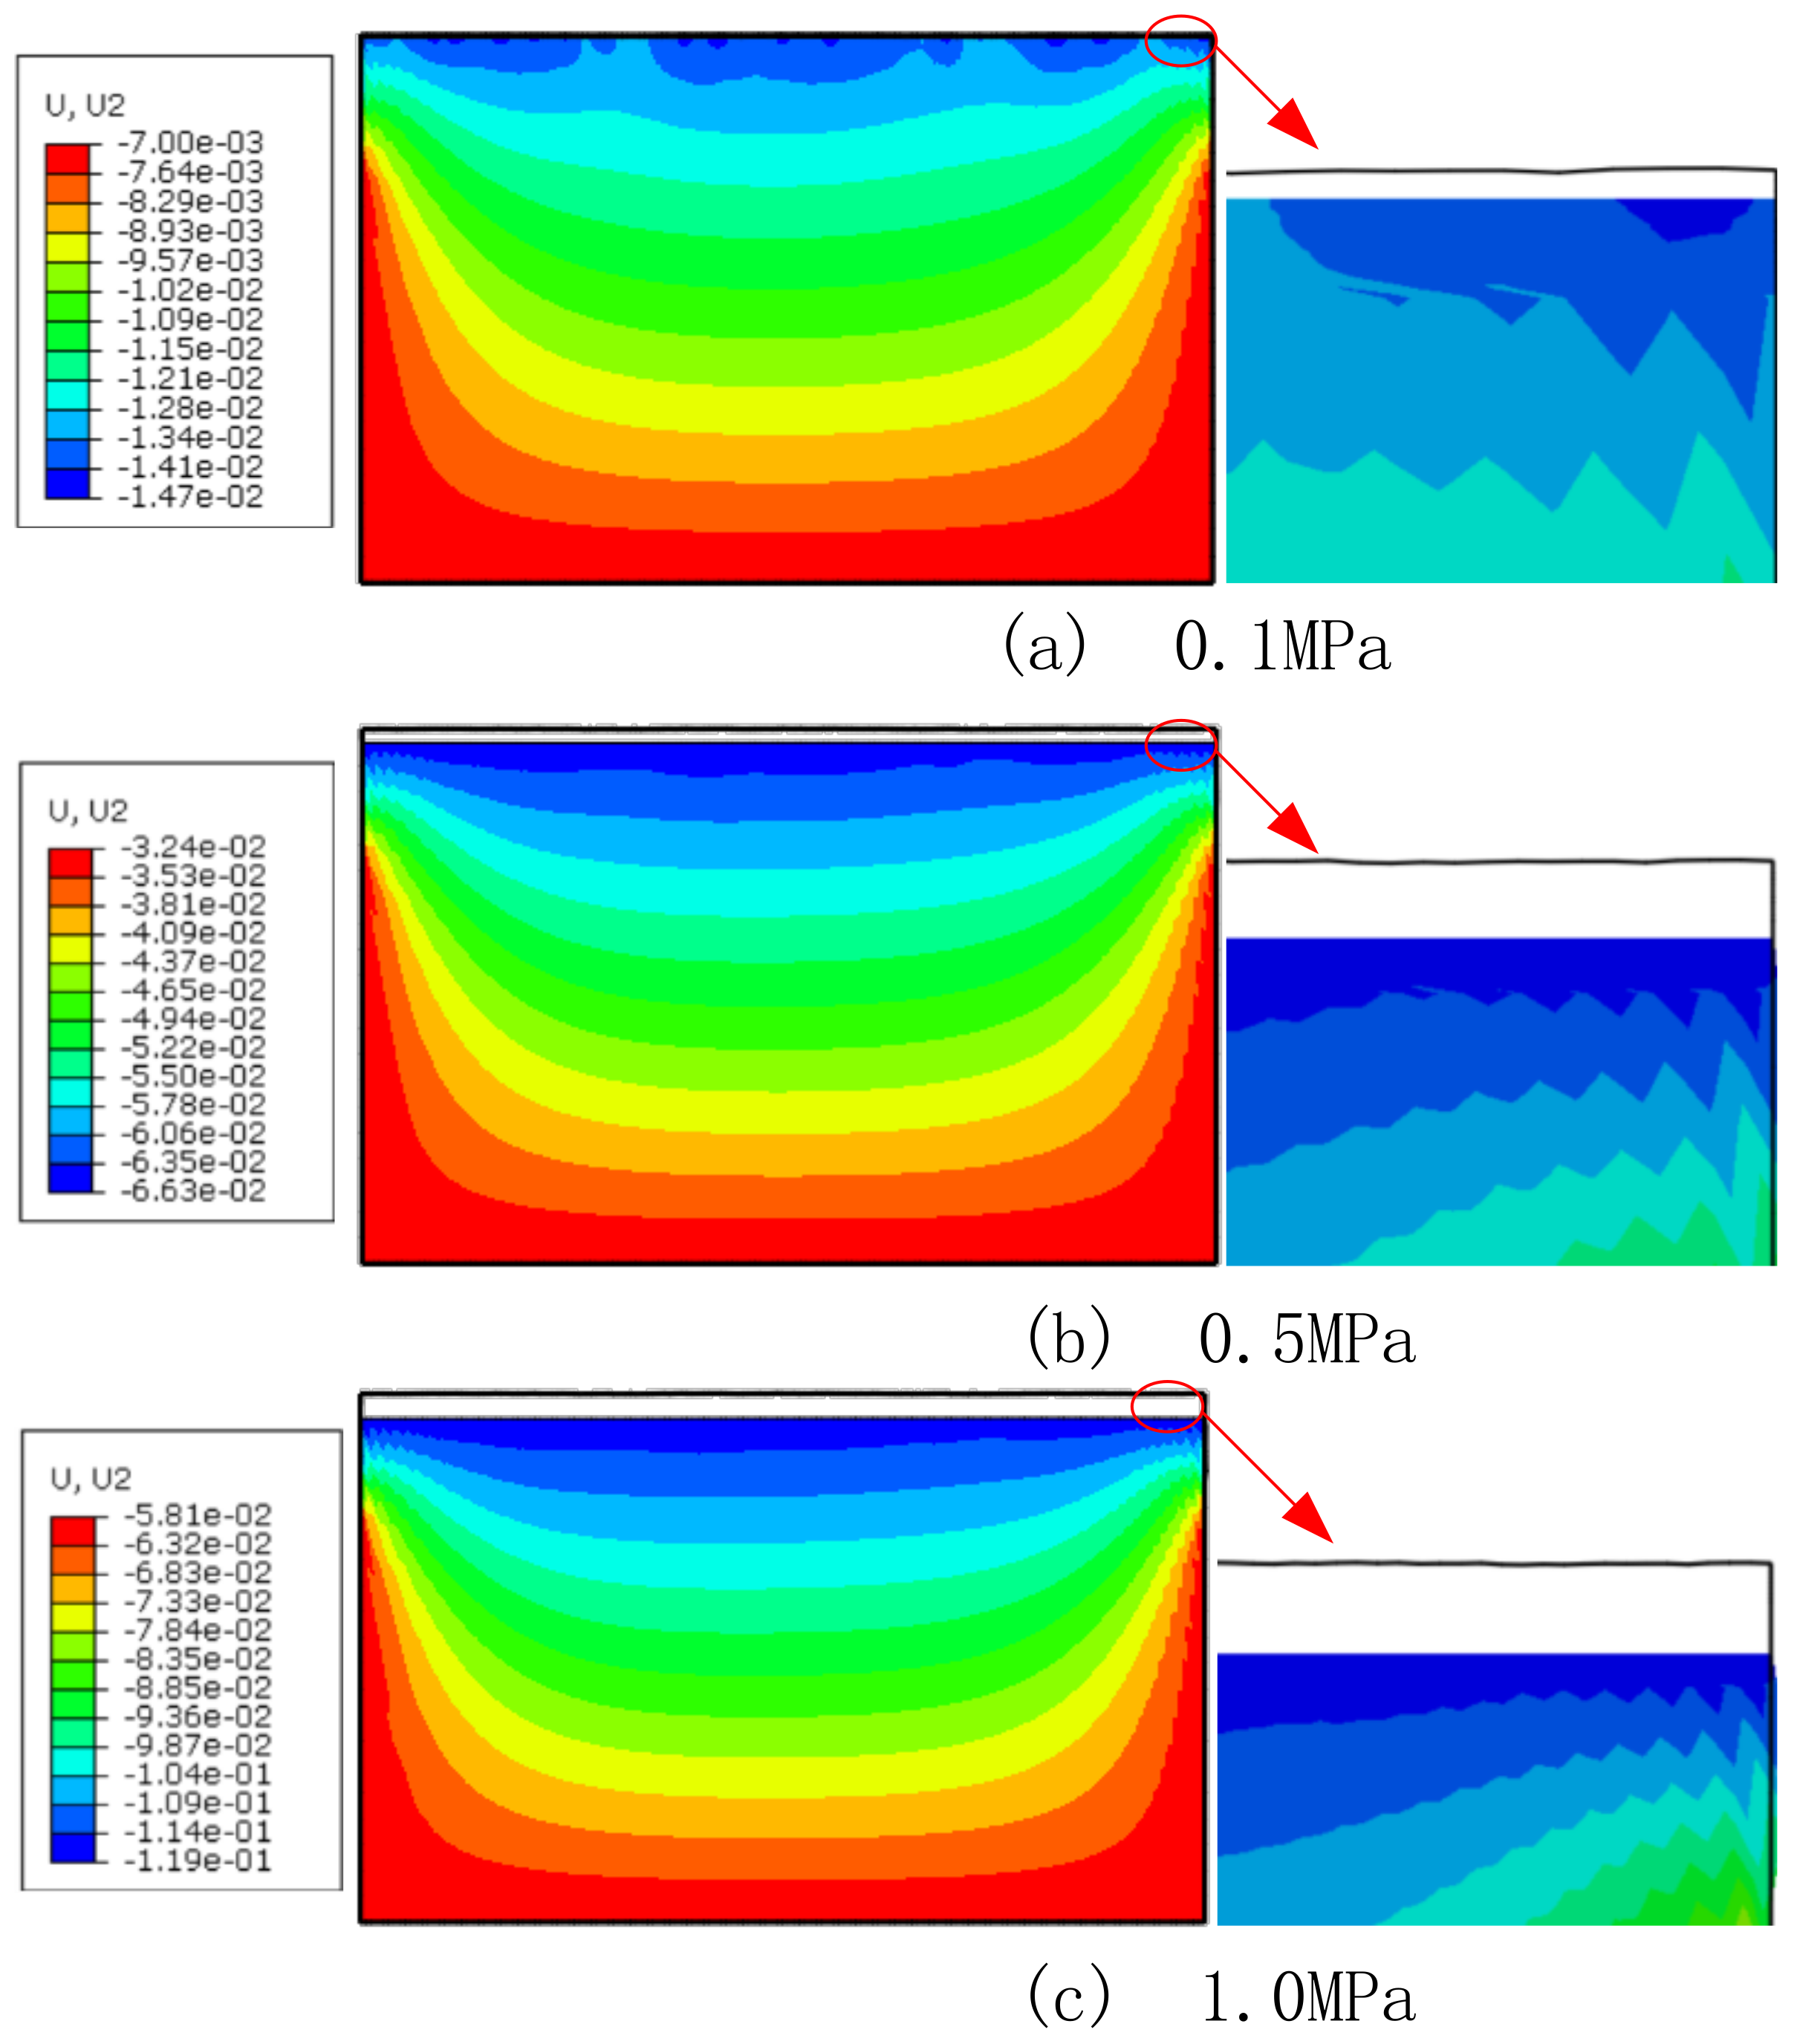
2.3.2. Simulation Model

Generally, a PEM fuel cell is composed of end plates, current collectors, bipolar plates, a gasket, membrane electrodes, and other segments. Among these, membrane electrodes include a gas diffusion layer (GDL), microporous layer, catalytic layer, and proton exchange membrane (PEM). In practical applications, the microporous layer and the catalytic layer are laminated between the GDL and the PEM by the hot-pressing process. Their thicknesses are relatively small in the micron range, so the effect of their stress strain on the membrane electrode can be neglected.
In this paper, the modeling is based on the real data provided by the manufacturer, and the specific modeling parameters are shown in Table 1. The model in this paper mainly contains components such as a bipolar plate, GDL, PEM, PEN, and sealant (as shown in Figure 2), ignoring the modeling of the catalytic layer and microporous layer.
In this work, the commercial software Abaqus was used for finite element analysis, and the grid was divided by using the reduced integration strategy, in which the mesh size of key components (seal, flow channel, membrane electrode) is 0.02–0.2 mm and the maximum grid size of non-critical components is 2 mm, which contains about 32,000 mesh elements. The mesh independence is verified in Figure 3 by increasing or decreasing the number of meshes in the Y direction of the component. The contact pressure distribution on the surface of the anode seal is almost the same for the three meshes. The material parameters of the single-cell PEMFC are illustrated in Table 2.

2.3.3. Boundary Conditions

The GDL and the PEM are tied by the hot pressing process. The interface relationship between them is set as a tied constraint in the model. The interface relationship between the remaining contact parts is set as a contact constraint. The tangential behavior of the contact properties is constrained by the penalty function, and the normal behavior is calculated by using the extended Lagrangian algorithm, in which the friction coefficients are 0.3.
In this model, a uniform pressure load is applied along the stacking direction, with the load values ranging from 0.1 to 1.0 MPa and increasing by 0.1. Symmetric constraints are used for the symmetry planes in the length directions, and fixed constraints are employed for the symmetry plane along the clamping direction.

2.4. Evaluation Method of Sealing Performance

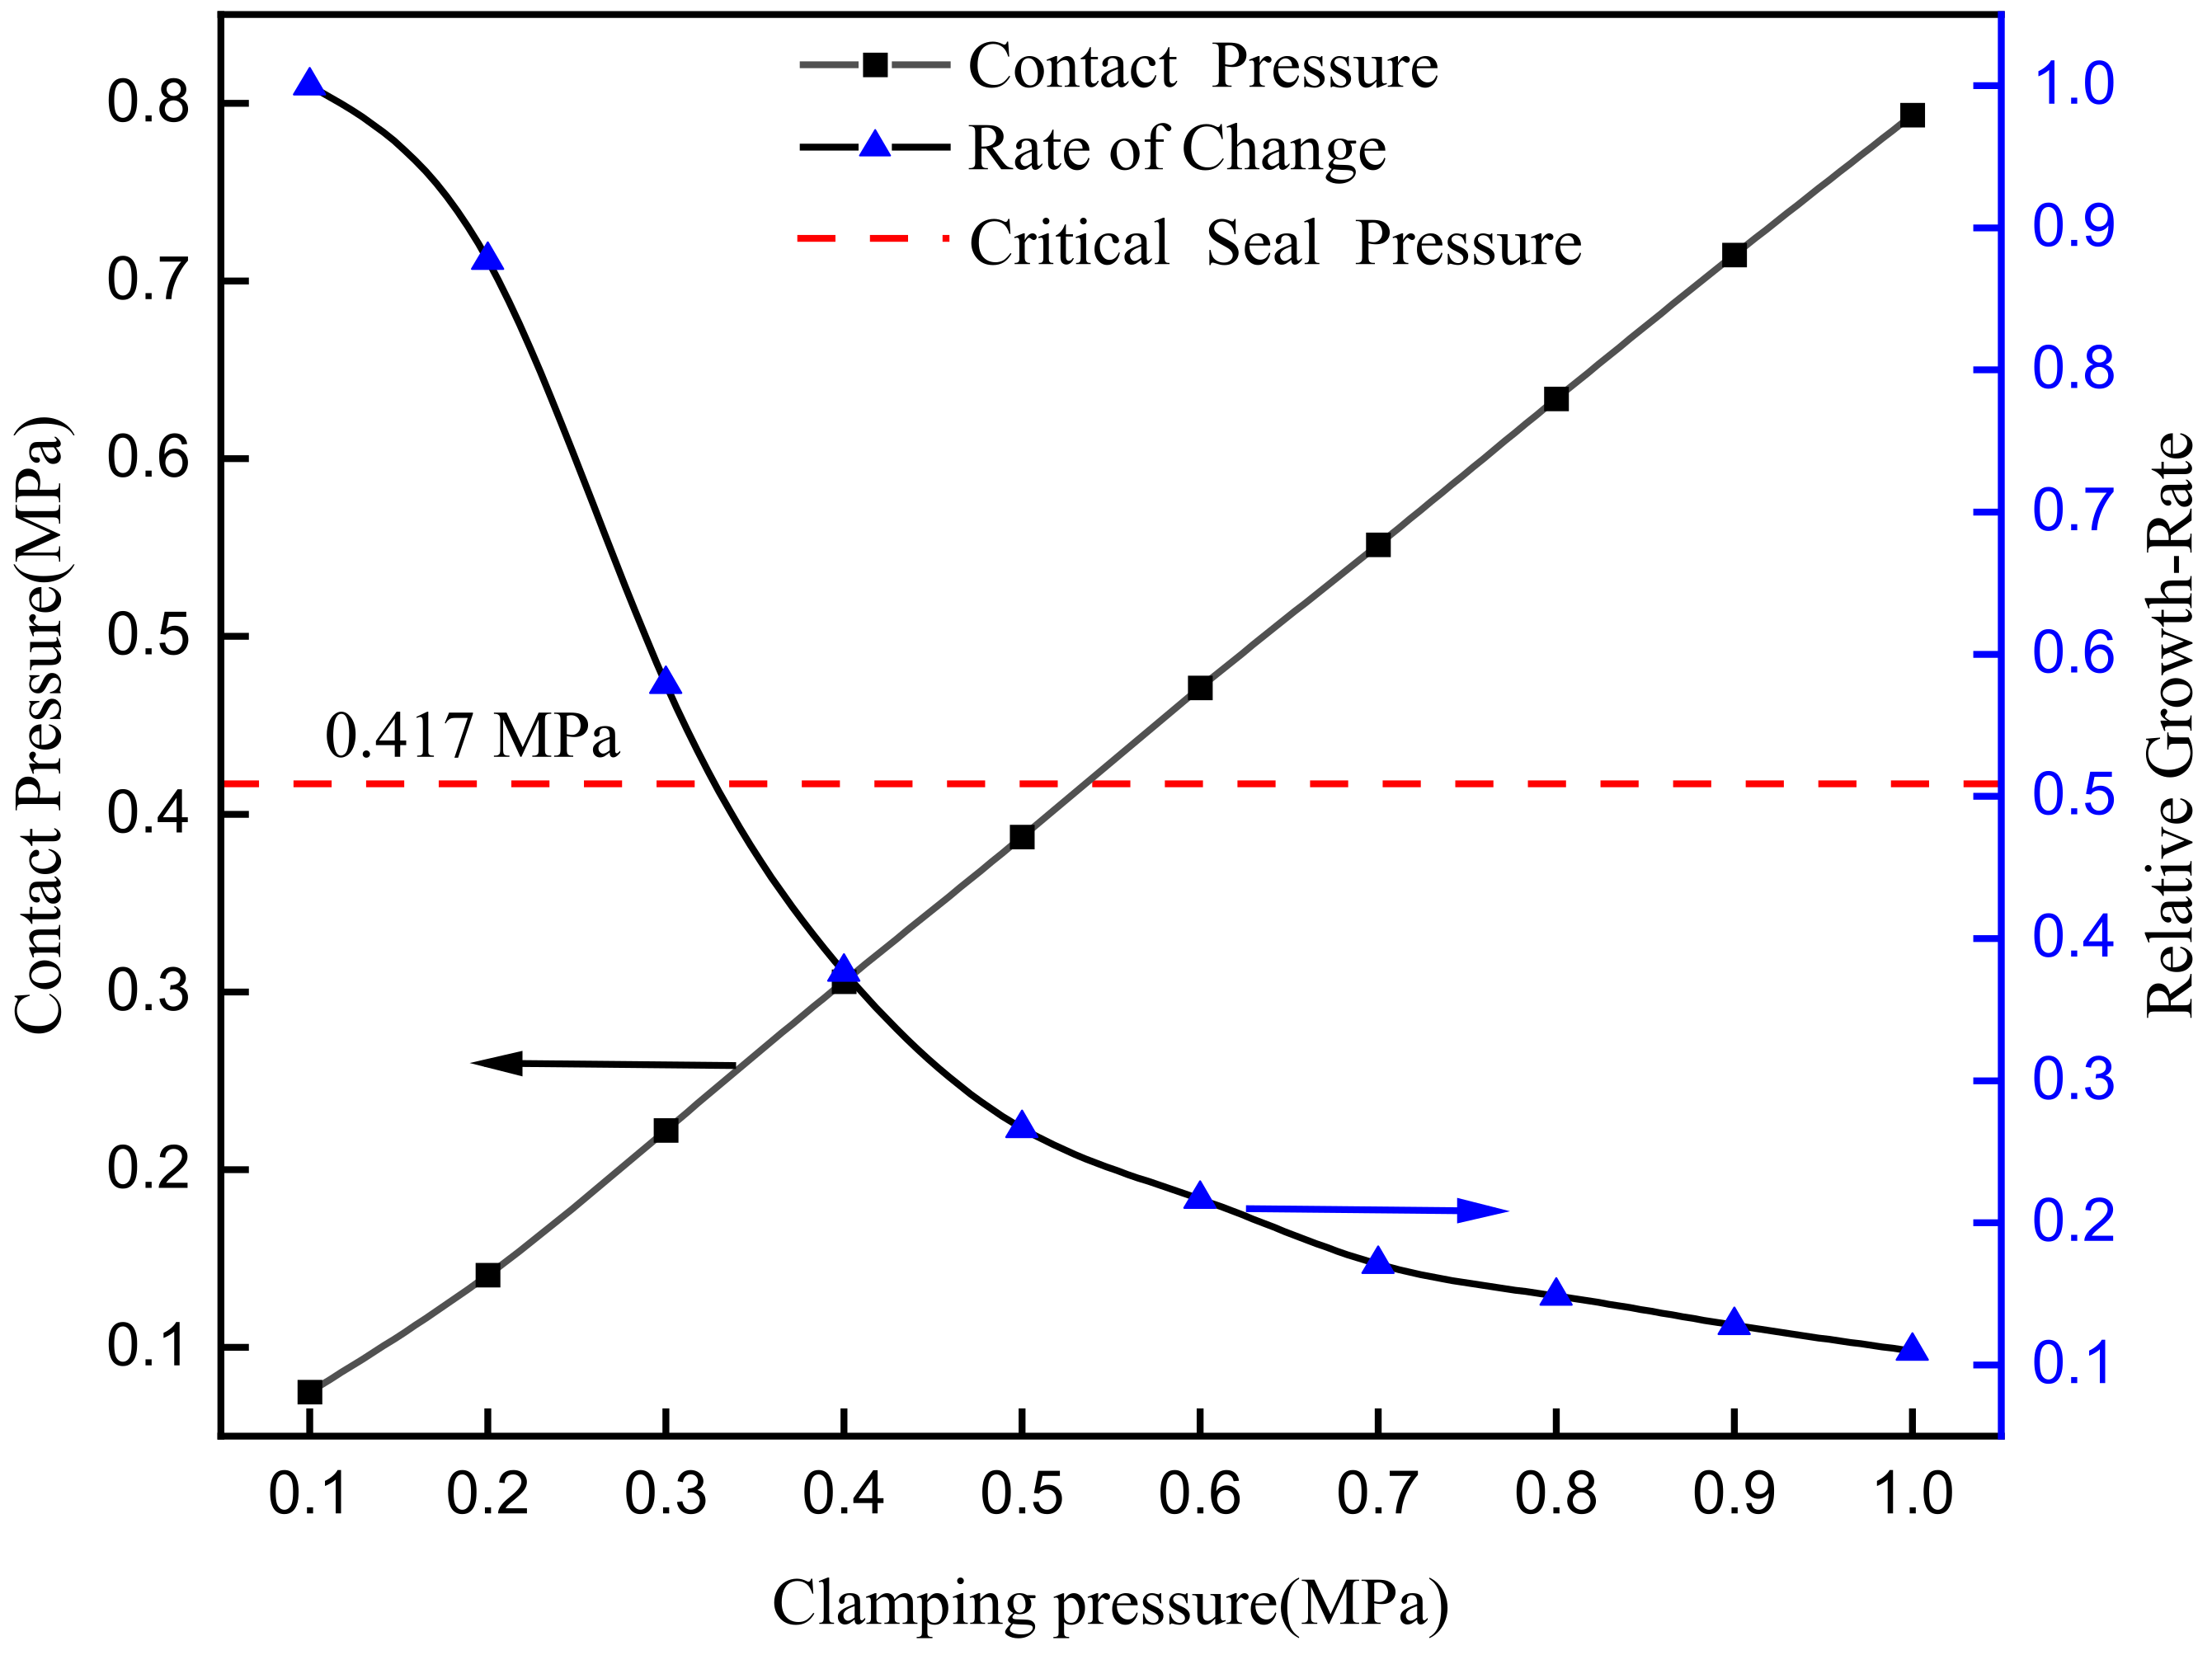
2.4.1. Critical Sealing Pressure
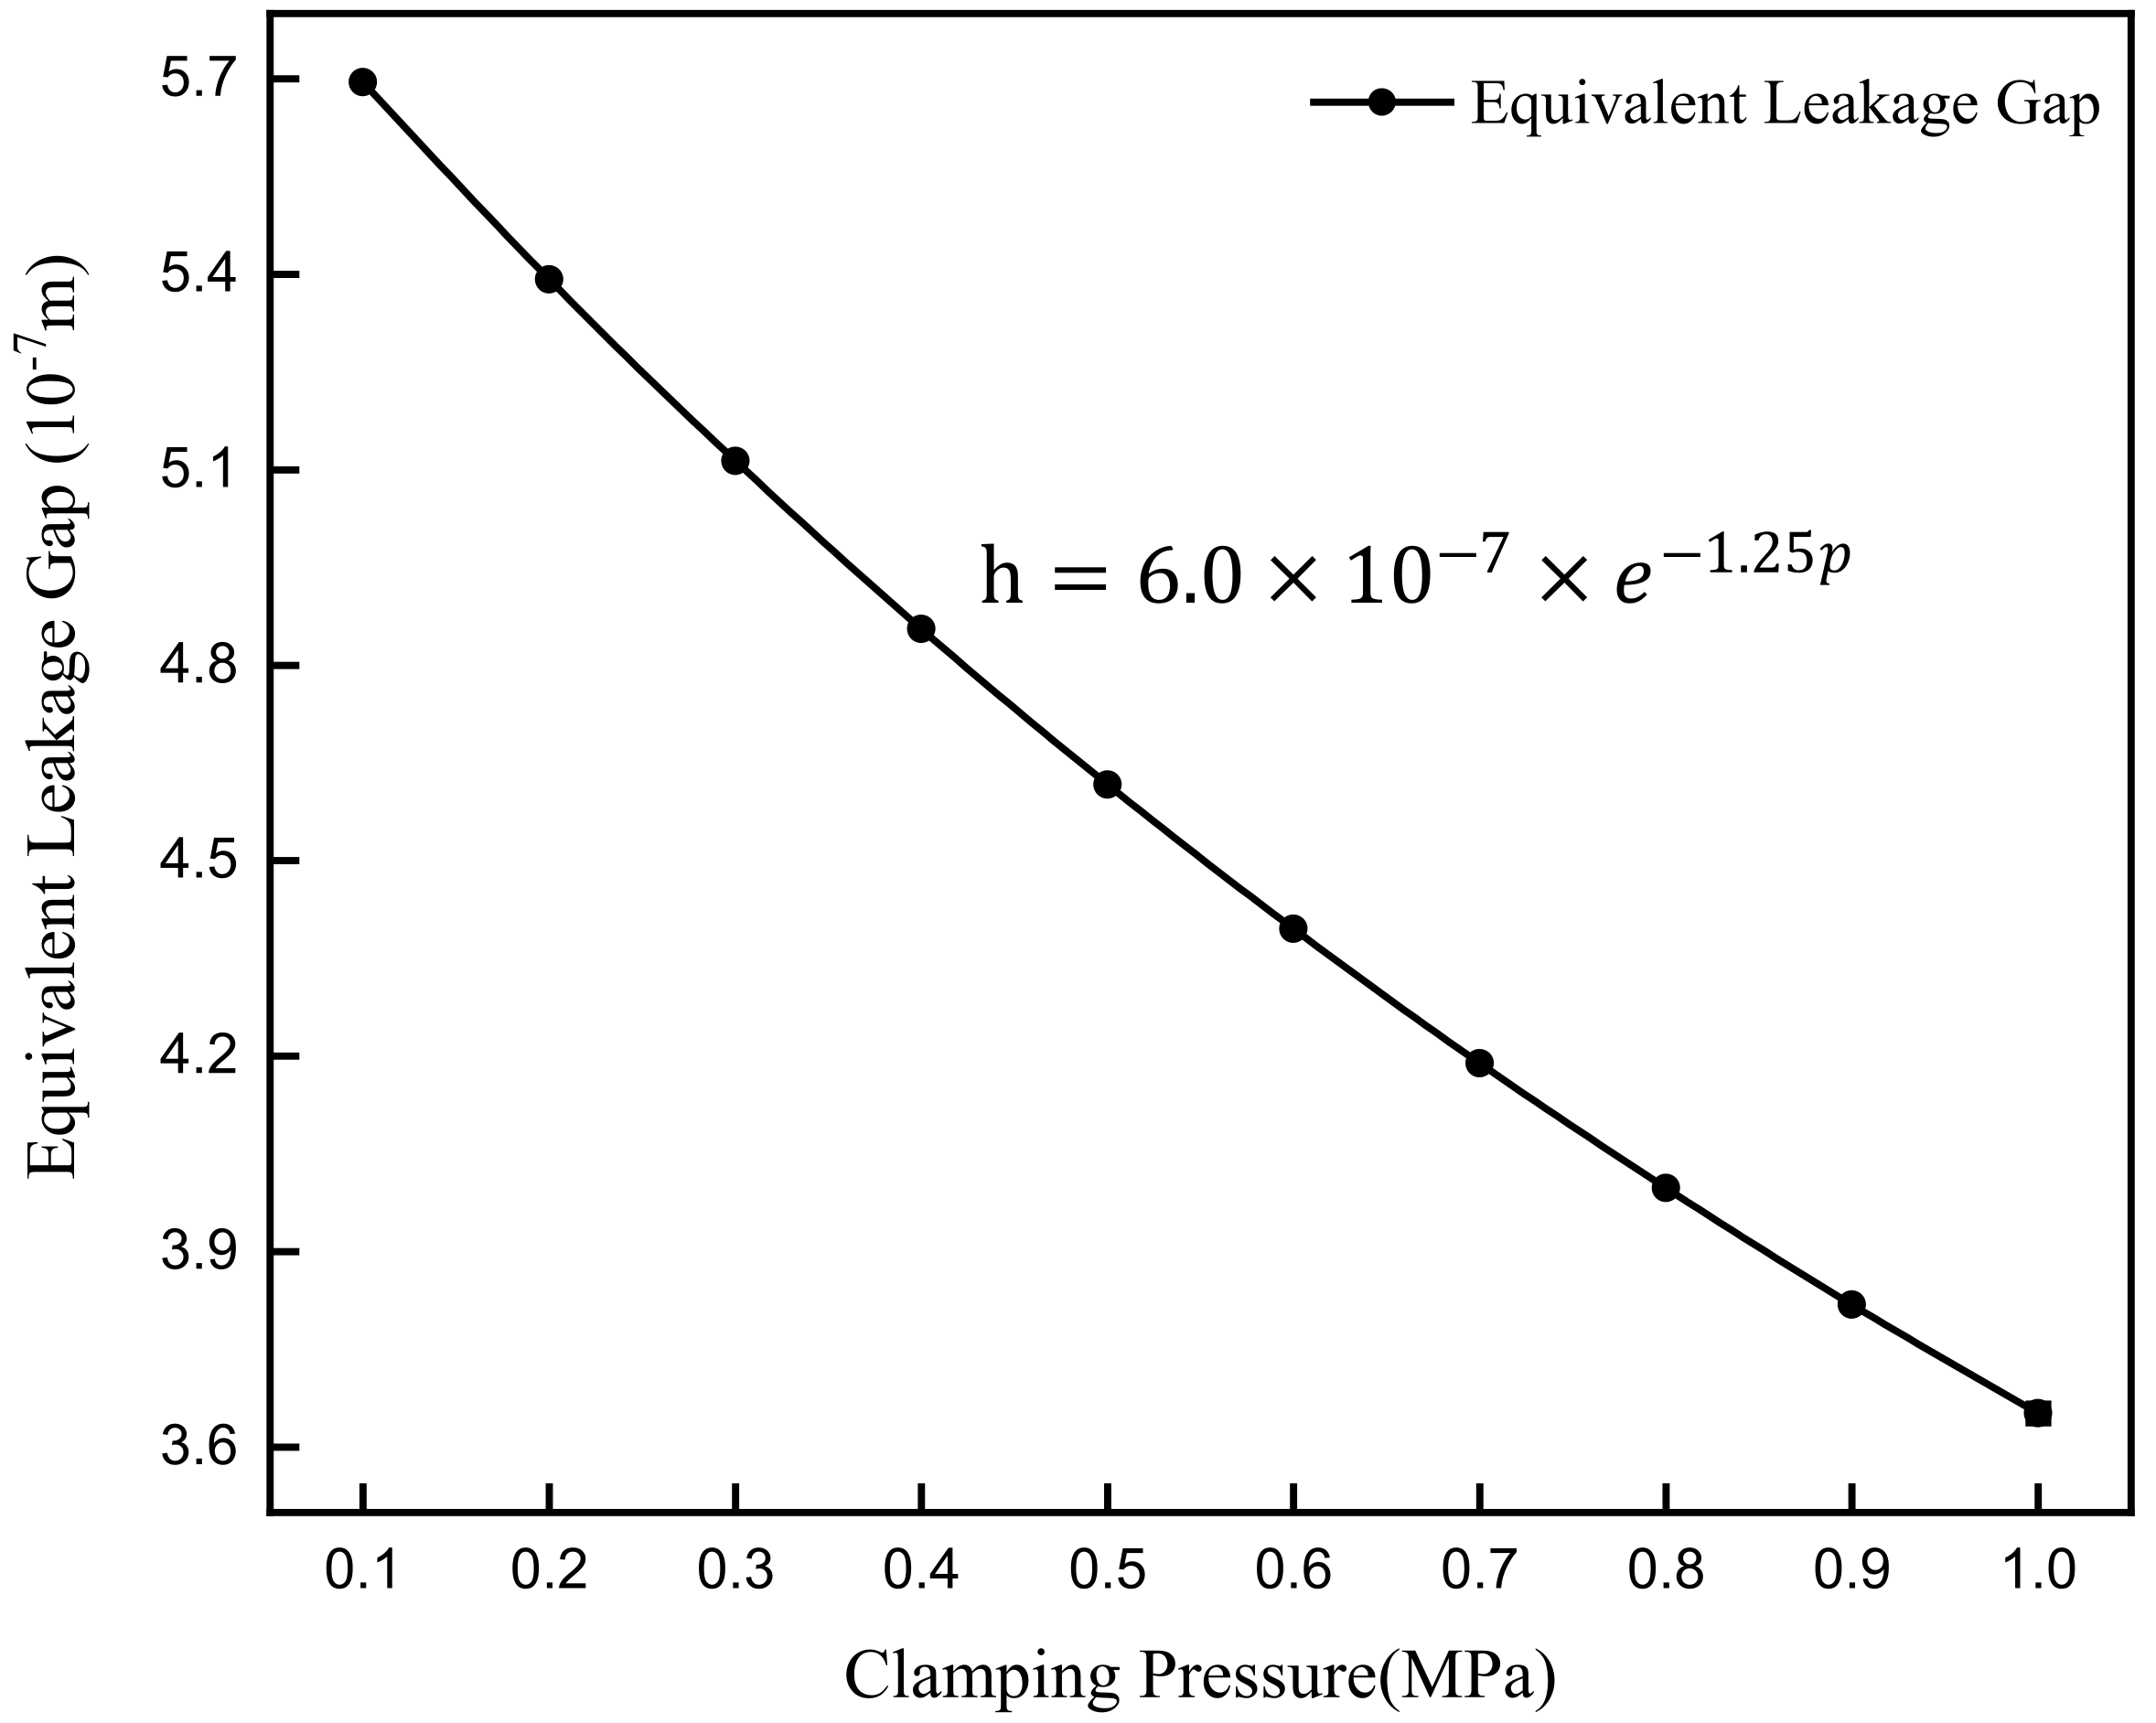
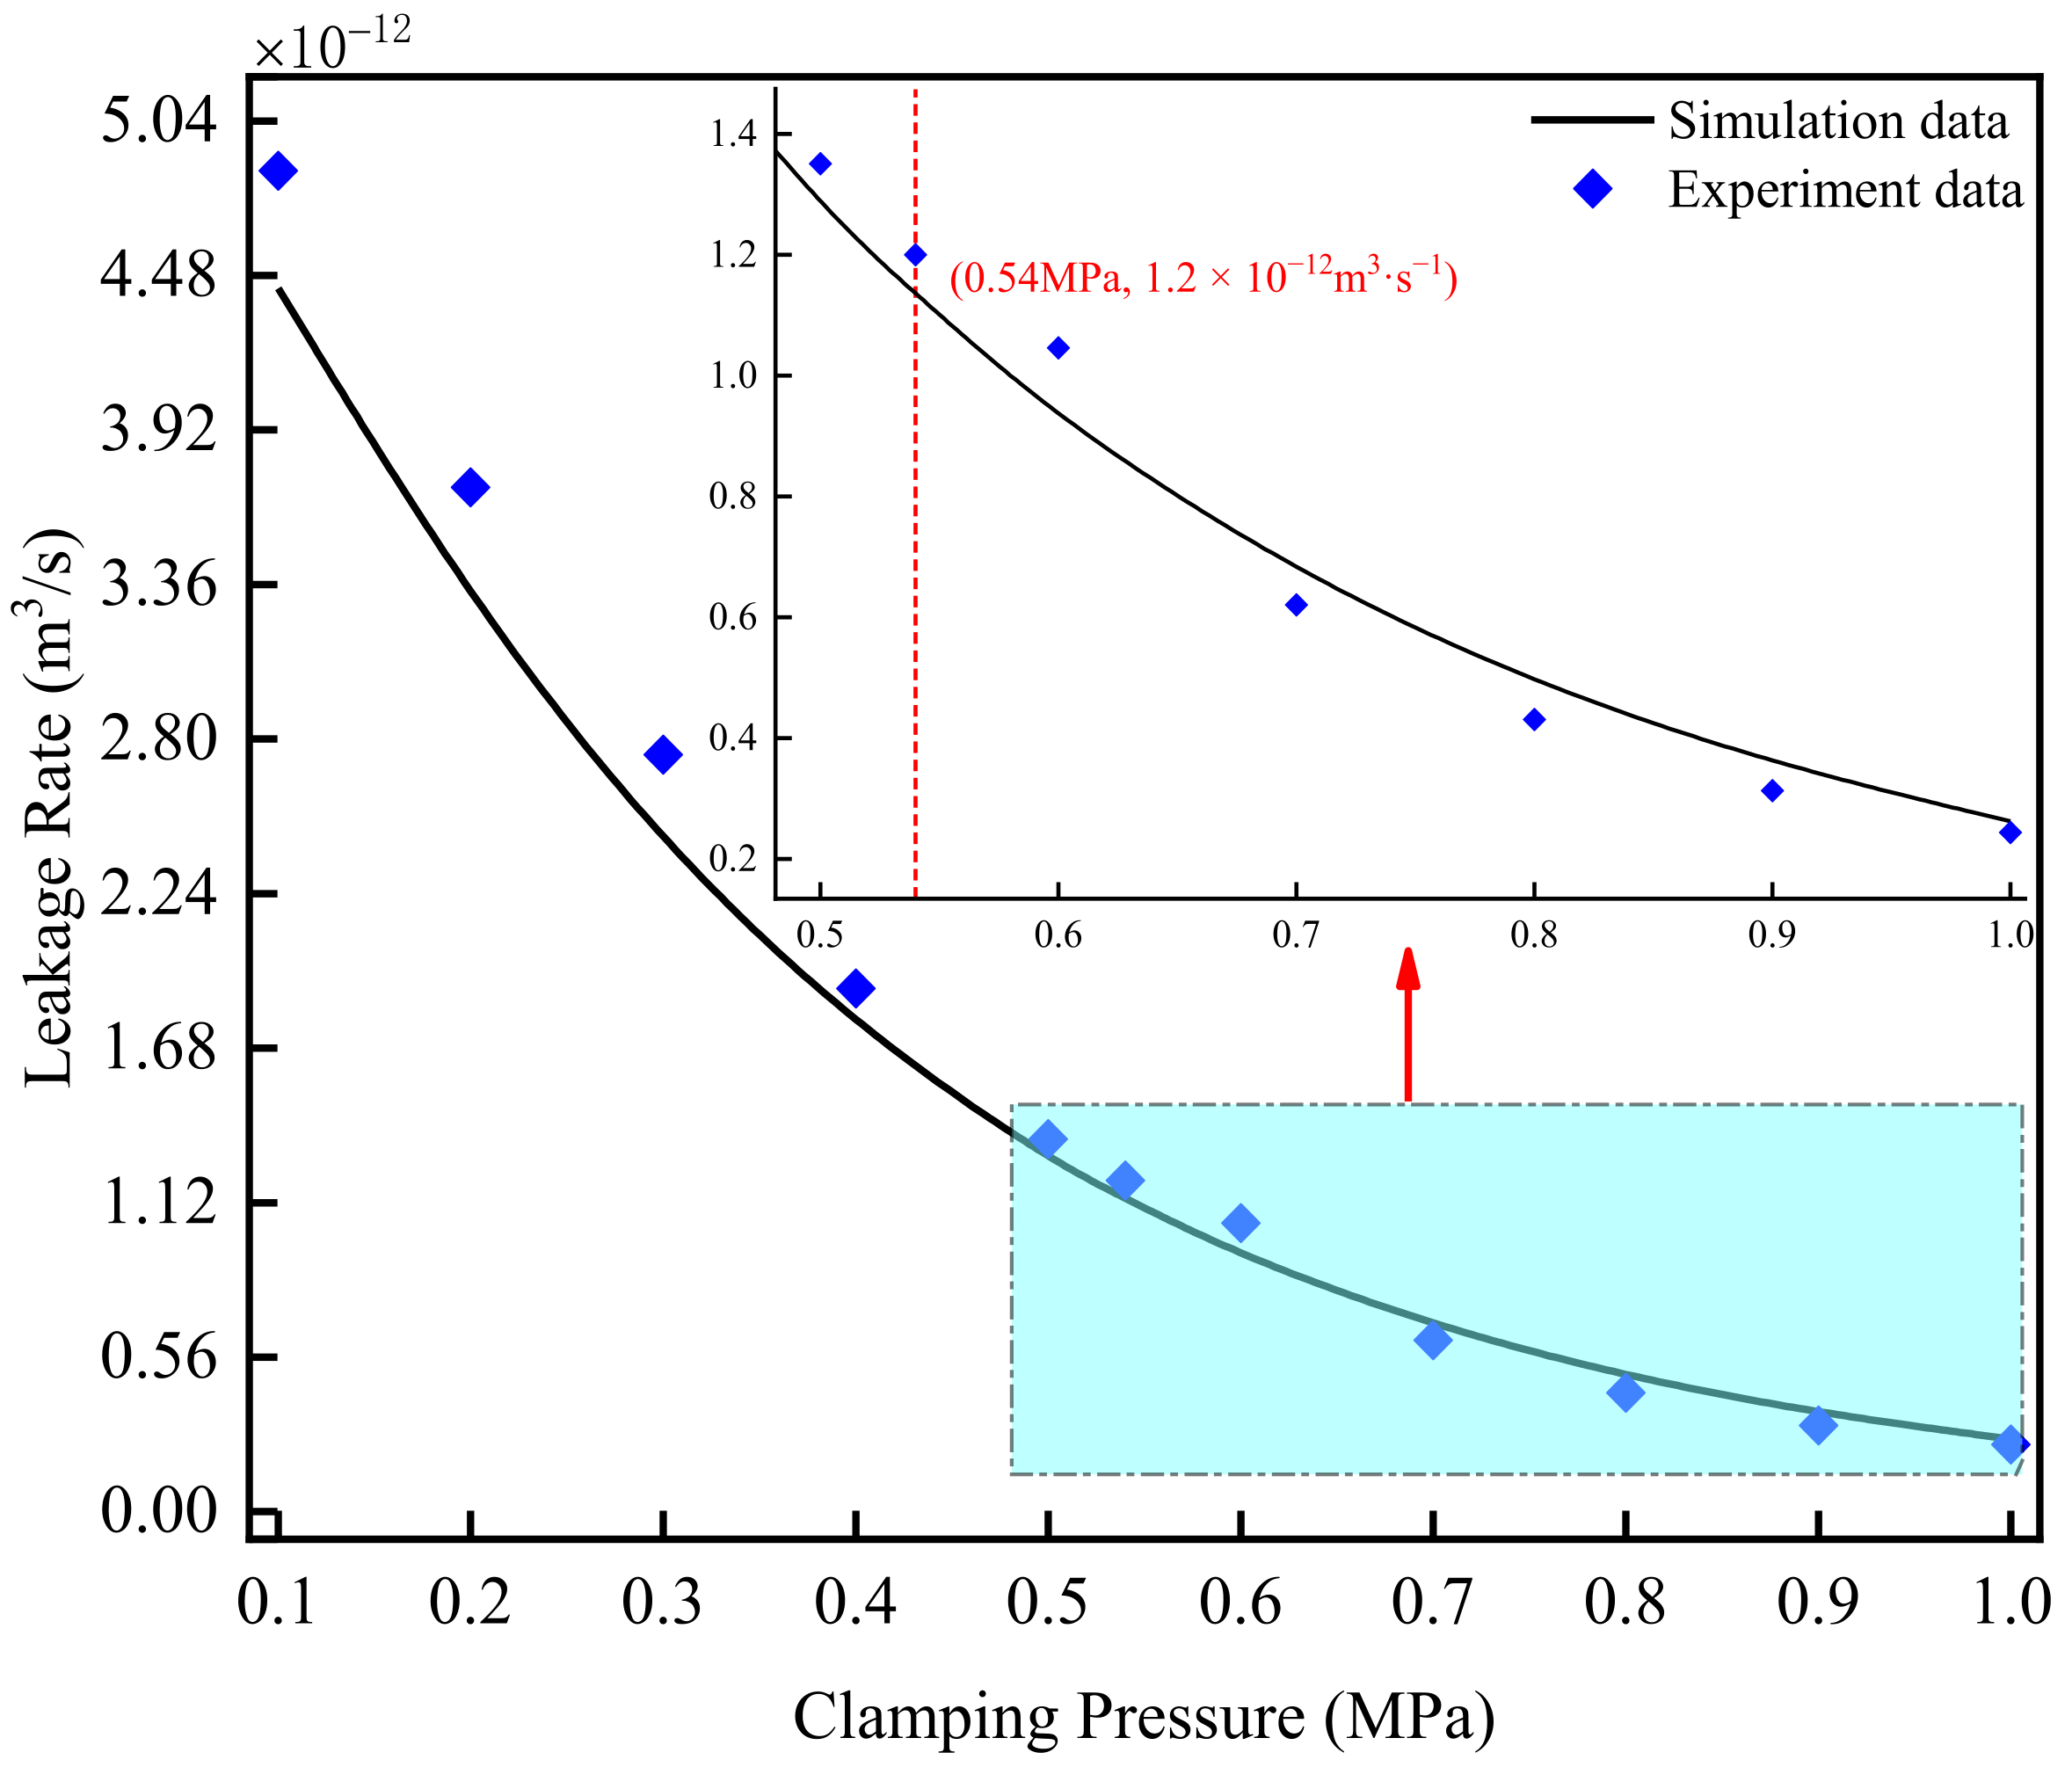
In the fuel cell clamping process, the seal is made to form a sealing surface with the contact part of the bipolar plate by an externally applied load to avoid the leakage of the reaction gas. Among them, the seal is not only subjected to the positive pressure along the clamping direction but also to the gas pressure along the plane direction. The interface friction prevents the seal from sliding horizontally outward. Therefore, the contact pressure at the sealing interface is one of the main indicators of sealing performance. The critical value must satisfy the following equation:
p scp σ Sealant min = P g a s h Sealant n μ L Sealant
where σ S e a l a n t m i n represents the critical pressure of the gasket; h S e a l a n t is the thickness of the seal, which is 1.25 mm; L S e a l a n t is the width, which is 2 mm; p g a s is the inner gas pressure, which is 2 bar; μ is the friction coefficient, which is 0.3; n is the safety factor. When n is 1, the lower limit σ S e a l a n t m i n equals 4.17 bar, meaning that it is the critical sealing pressure.

2.4.2. Leakage Rate

Interfacial leakage is the main means of gas leakage inside the fuel cell. According to ref. [40], when the channel height is constant, the flow of fluid in the interface retains the characteristics of the flat Poiseuille flow, and the leakage rate Q per unit time through a rectangular contact area along the X direction is as follows [41]:
Q = L y L x u 1 3 ( p s c p , u 0 , R c ) 12 η Δ p
where L y and L x represent the flow channel width and flow channel length, respectively. Δ P is the pressure drop in the leakage channel, u 1 is the equivalent gap, p s c p stands for the contact pressure of the seal surface, u 0 is the initial height, and R c represents the sealing performance factor.

2.5. Model Validation

In order to verify the effectiveness of the fractal profile function in fitting the real surface profile, firstly, the sample surface was measured by using a high-precision confocal laser scanning microscope (Olympus OLS5000), which has resolutions of 0.5 nm and 1 nm in vertical and horizontal directions, respectively. A region of 3 mm2 (1.5 × 2 mm) was selected on the sample surface for scanning, and the data were processed to obtain the surface height characteristics, as shown in Figure 4. Secondly, the fractal parameters of the measured rough surface profile (Mrsp) were calculated by the structure function method, and the calculated results were brought into the two-dimensional surface profile function to obtain the simulation rough surface profile (Srsp). Finally, the accuracy of the simulation surface profile was evaluated by the fractal parameters D/G and the root mean square deviation Rq. Figure 5 shows the surface microprofile of the sample. Mrsq and Srsq have similar distribution characteristics, and the relative error of the Rq of the two surface profiles is 6.7%. It can be seen that the experimental measurement data and the simulation characterization data have a good agreement, as shown in Figure 6, and the maximum relative error of the fractal parameters is 5.03%. Thus, the simulation fits the experiment well, demonstrating the accuracy of the rough surface model, and the calculated results of Rq, D, and G parameters are shown in Table 3.
In this study, the pressure drop method was used to detect leakage of the sealing device. The principle of the experimental device is shown in Figure 7. First, the sealant is placed in the fuel cell seal groove and the assembly pressure is applied. After that, a quantitative amount of nitrogen is charged through the inlet and outlet of the cathode, and after the pressure sensor indicates a stable number, the stop valve is closed for the pressure-holding test and the changes in gas pressure, temperature, and time are recorded. Furthermore, the volumetric leakage rate of the gas is calculated according to the ideal gas law as
Q s = V T s P s P 1 T 1 P 2 T 2
where T s and P s represent the standard ambient temperature and pressure, respectively. V is the effective volume of the flow field. T 1   and   T 2 indicate the gas temperature before and after the test, respectively. P 1   and   P 2 indicate the gas pressure before and after the test, respectively.

3. Results and Discussion

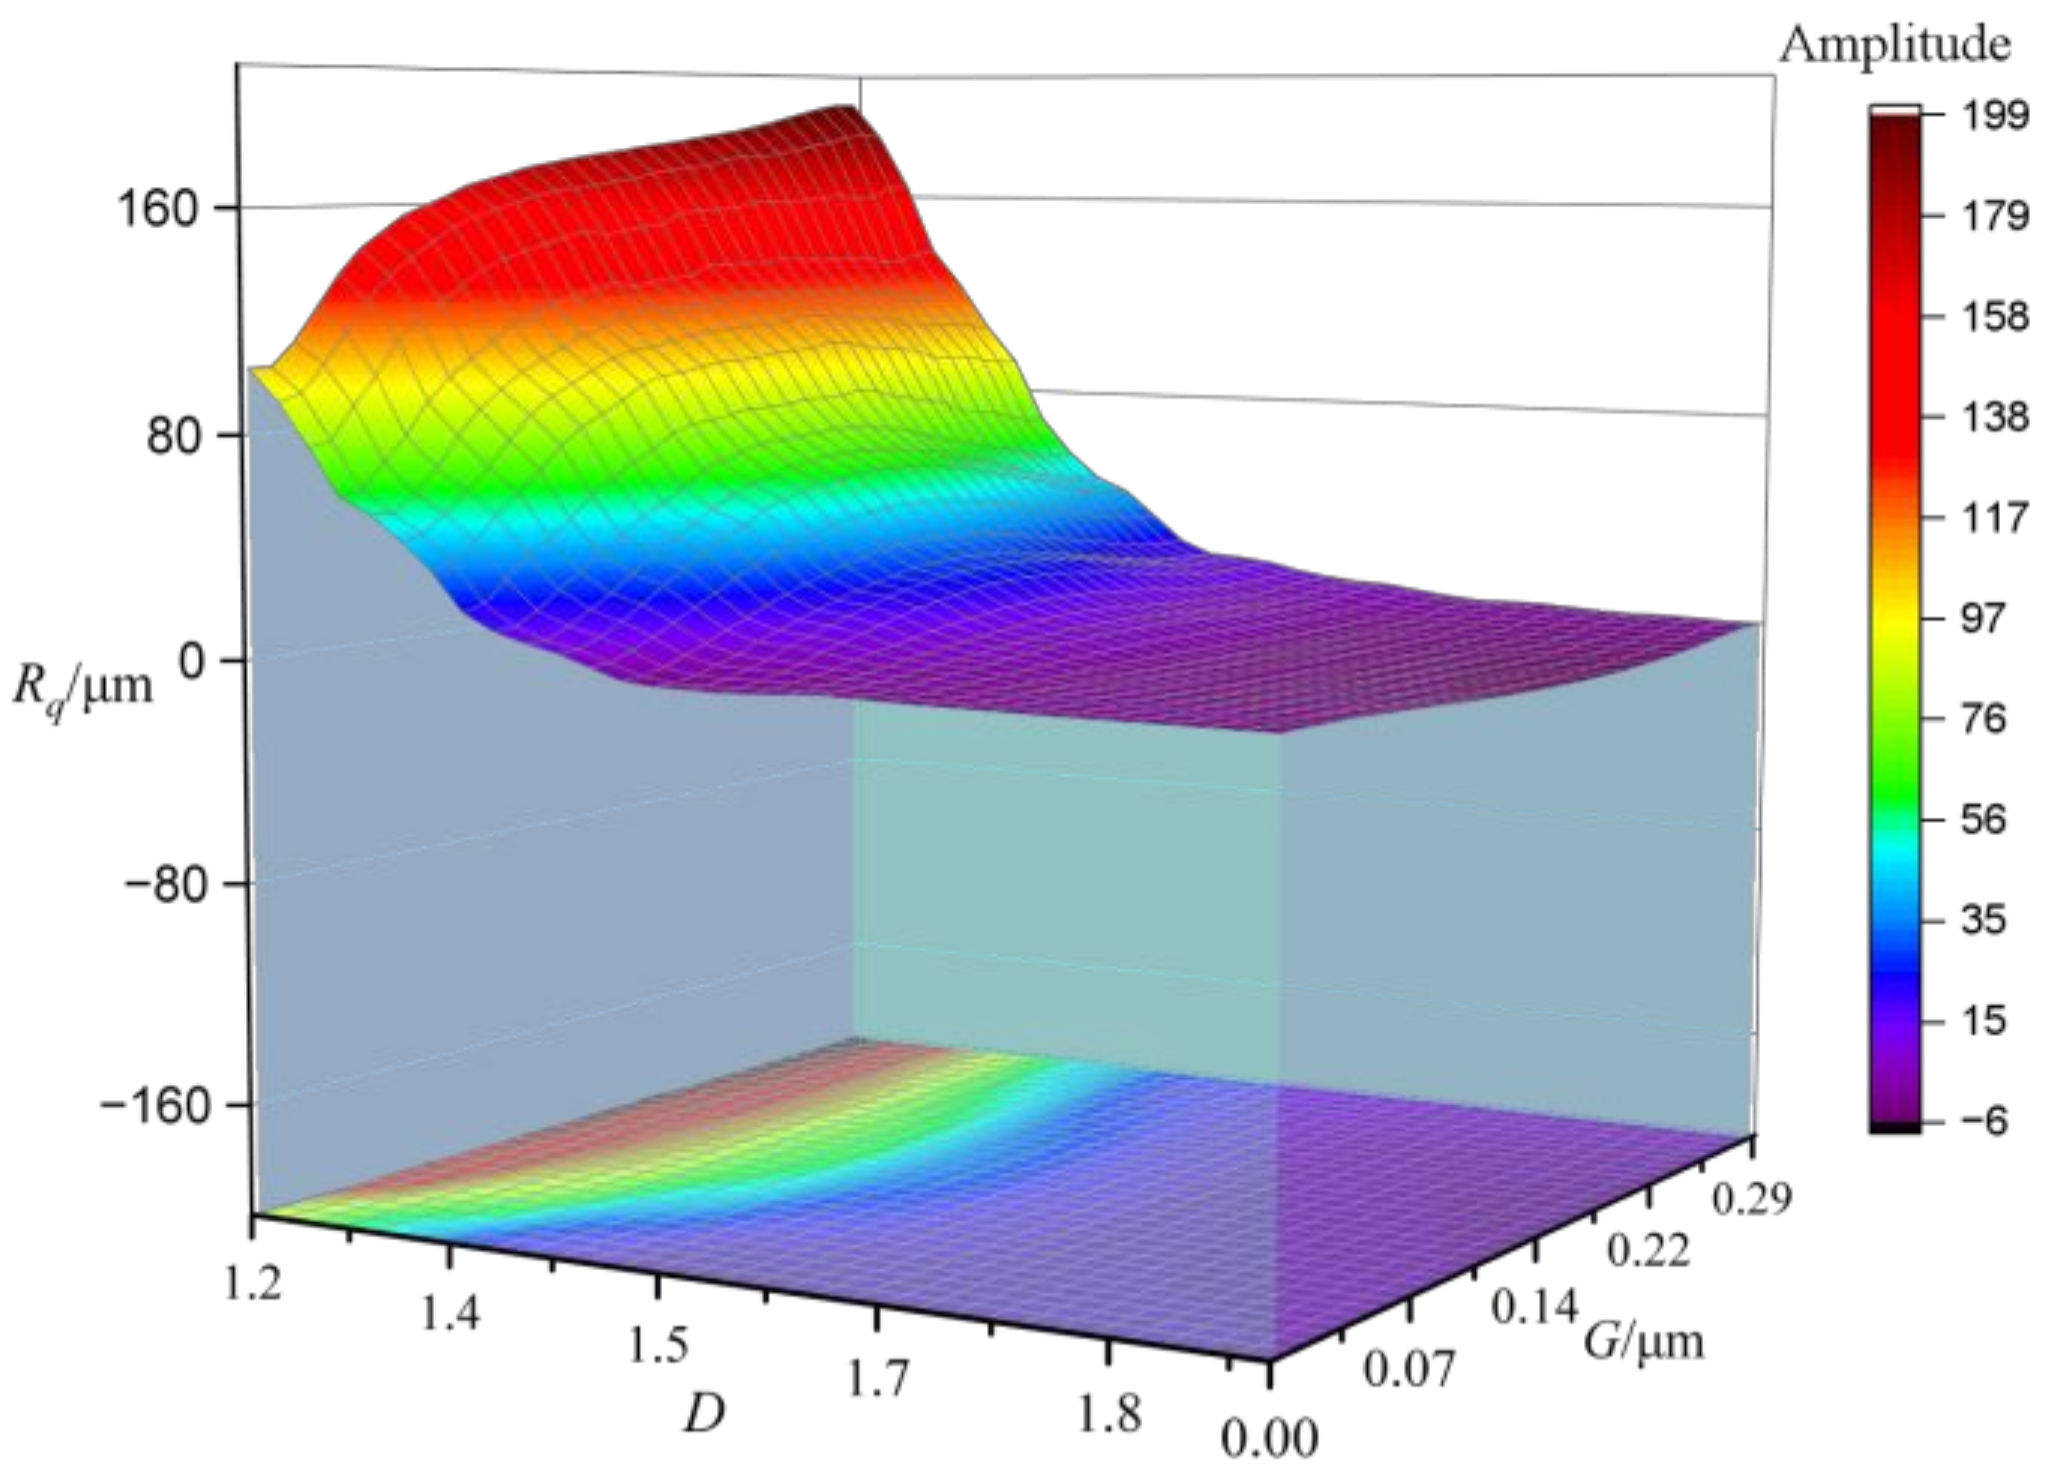
3.1. Effect of Fractal Parameters on Surface Roughness

In this paper, the W-M fractal function is used to characterize the microscopic morphology, and the complexity of this function depends on four parameters, D, G, γ, and n. In general, γ takes the value of 1.5 and n follows a normal distribution in the range of 1–100; D and G are the main parameters affecting the surface morphology.

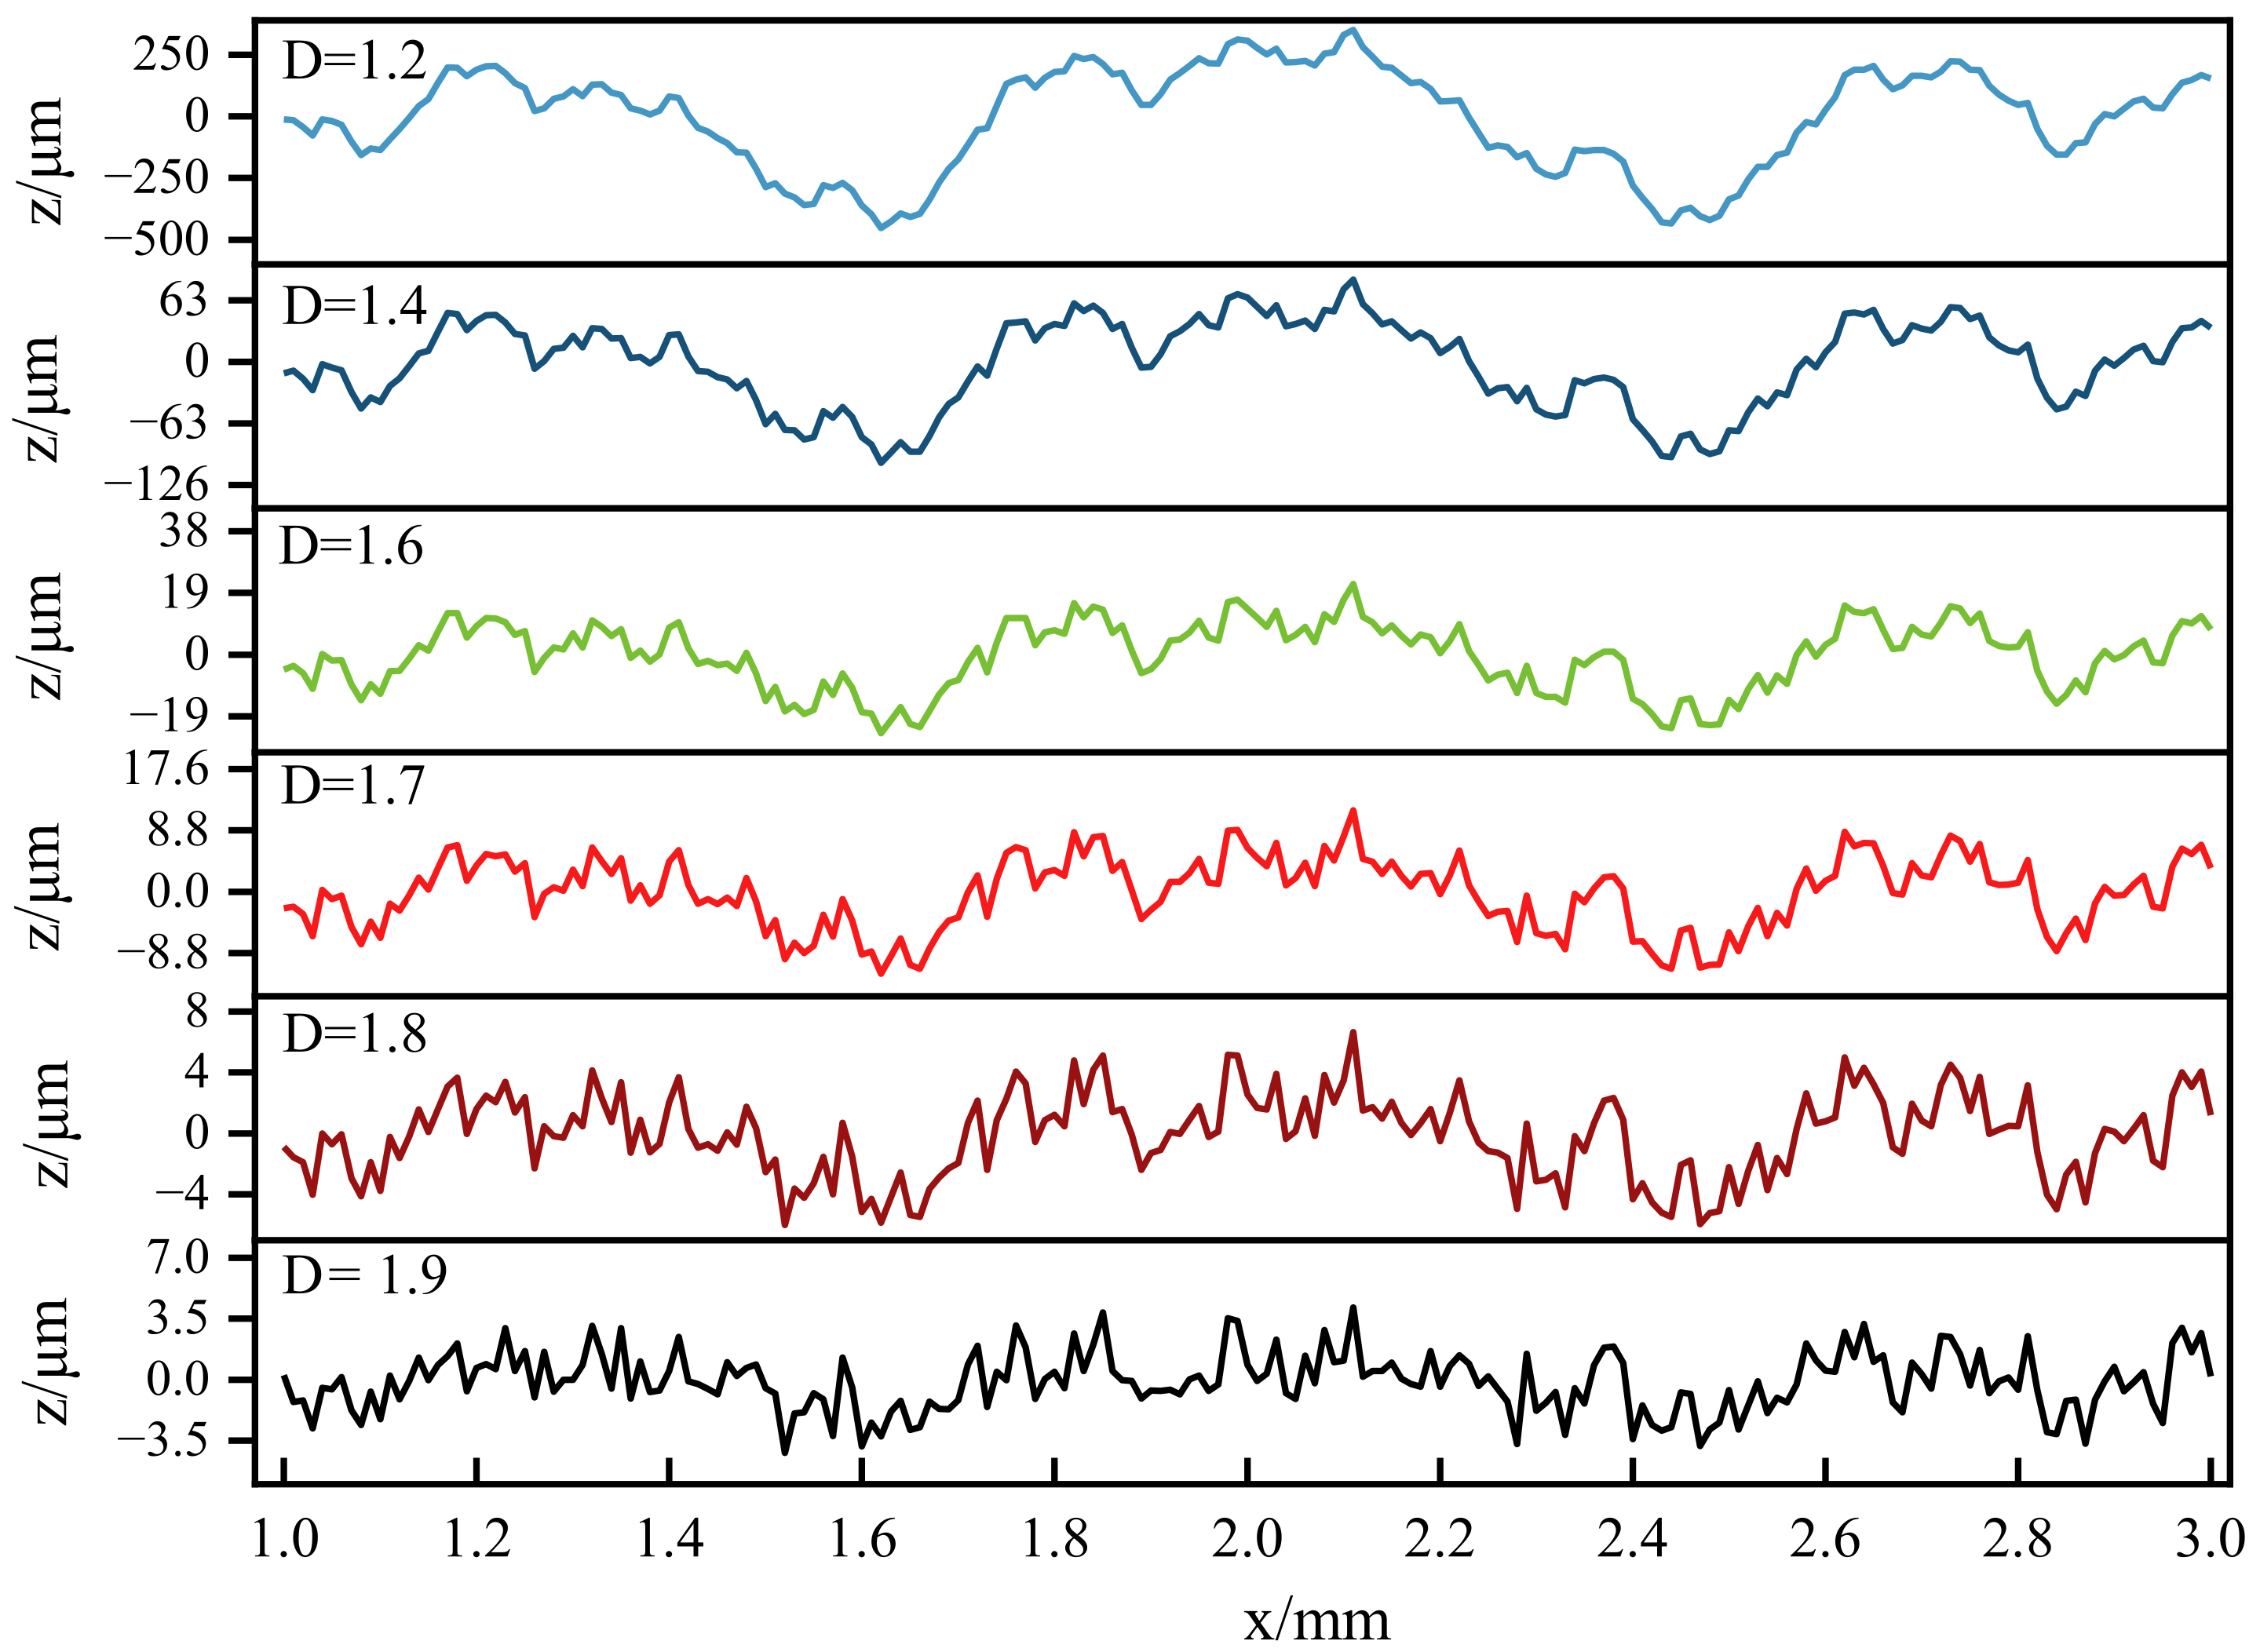
3.1.1. Fractal Dimensions

Figure 8 shows the influence of fractal dimension D on surface profile curves with the value of G of 2.86 × 10⁻⁵. D values are taken as 1.2, 1.4, 1.6, 1.7, 1.8, and 1.9. We can see that with the gradual increase in the fractal dimension, the amplitude and complexity of the contour curve change at the same time; when the value of D is 1.2, the maximum height of the contour is 0.21 mm, whereas the maximum height of the contour is 4 µm when D is 1.9. From the perspective of the fluctuation range of the contour amplitude, the surface amplitude decreases with the increase in the fractal dimension. A more refined surface topography leads to a smoother surface.

3.1.2. Characteristic Scale Coefficients

The influence of a single parameter G on the profile shape is presented in Figure 9. The fractal dimension D is a fixed value of 1.6, and the characteristic scale parameter coefficients G are taken as 2.86 × 10⁻⁴, 2.86 × 10⁻⁵, and 2.86 × 10⁻⁶. This indicates that the amplitude interval of the surface profile is from −6 to 6 μm when G is 2.86 × 10⁻⁴ By contrast, the amplitude degree interval is from −0.14 to 0.18 μm when G is 2.86 × 10⁻⁶ Despite the fact that the characteristic scale coefficient G has a significant impact on the contour amplitude, the profile shapes of the three cases overlap with each other. That is, the characteristic scale coefficient G only affects the contour amplitude.

3.1.3. Surface Roughness

Figure 10 exhibits the effect of fractal dimension on surface roughness. It shows that Rq decreases with the increase in fractal dimension D when G is constant. When D is less than 1.5, the average reduction rate of surface roughness is 53%; when D is greater than 1.5, the average reduction rate of surface roughness is 28%. This can be explained by the inverse proportion between D and the contour amplitude. It shows that Rq increases with the increase in characteristic scale coefficient G when D is constant. This can be explained by the positive proportion between D and the contour amplitude.

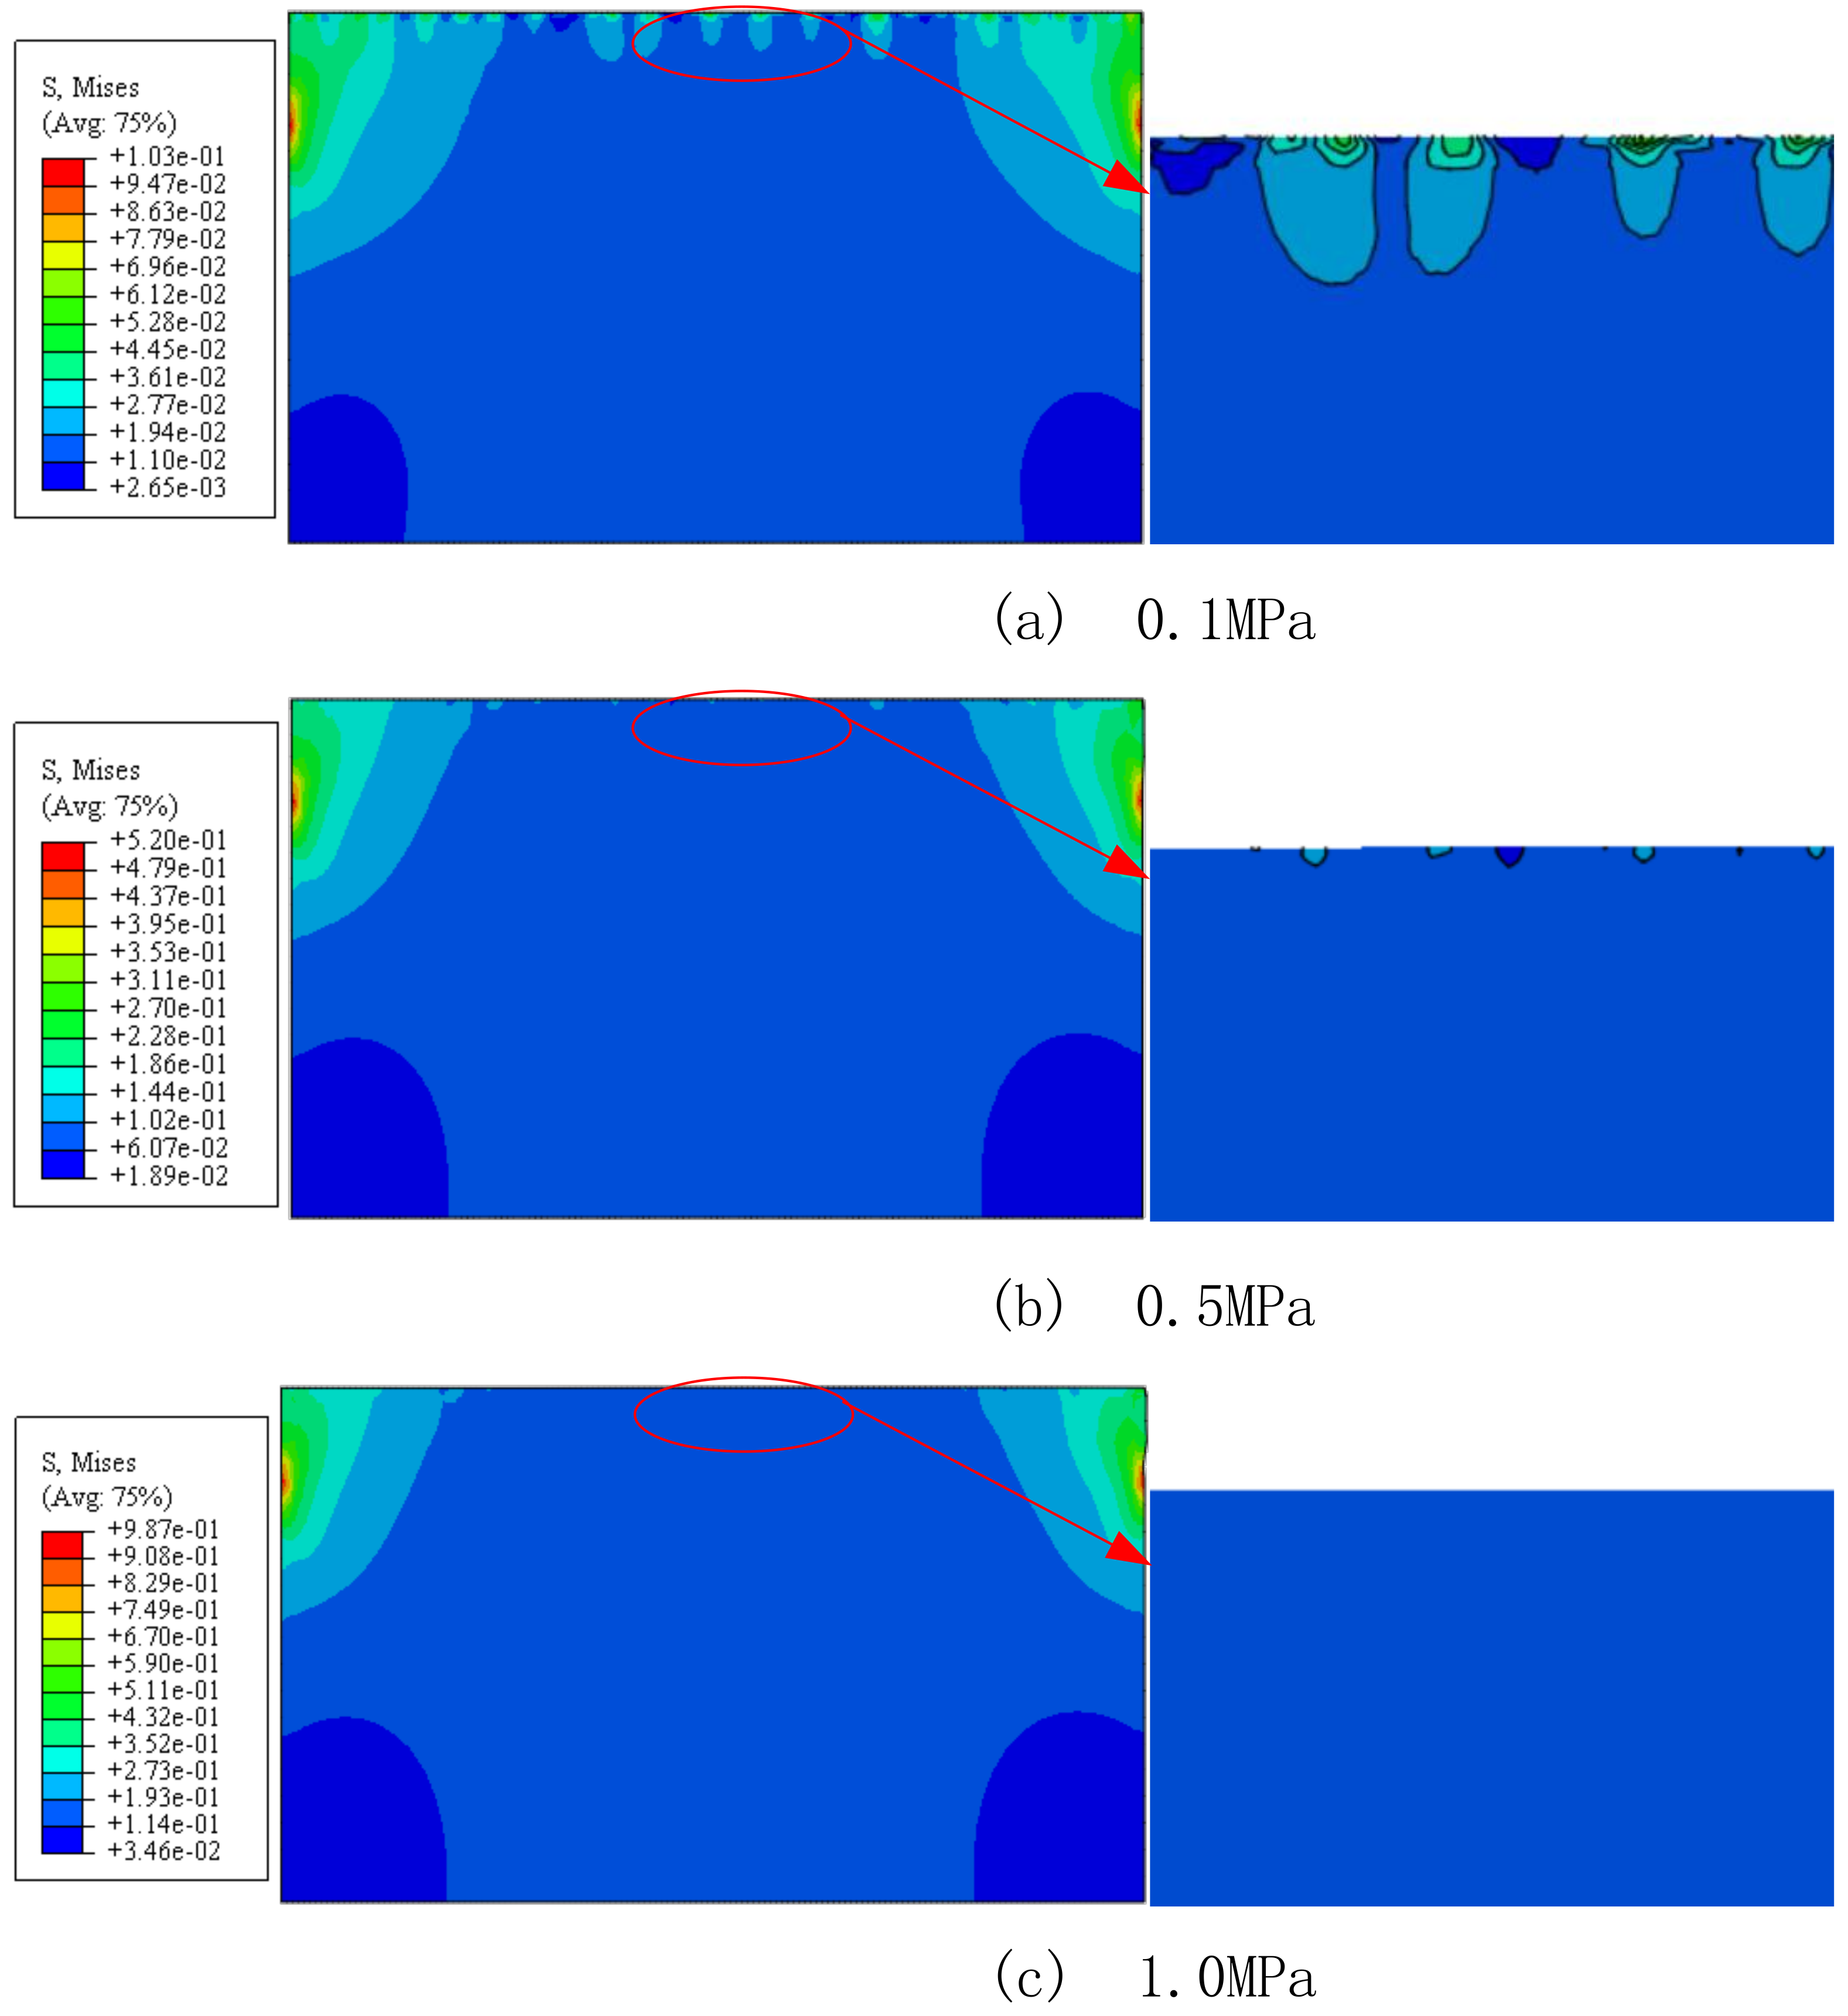
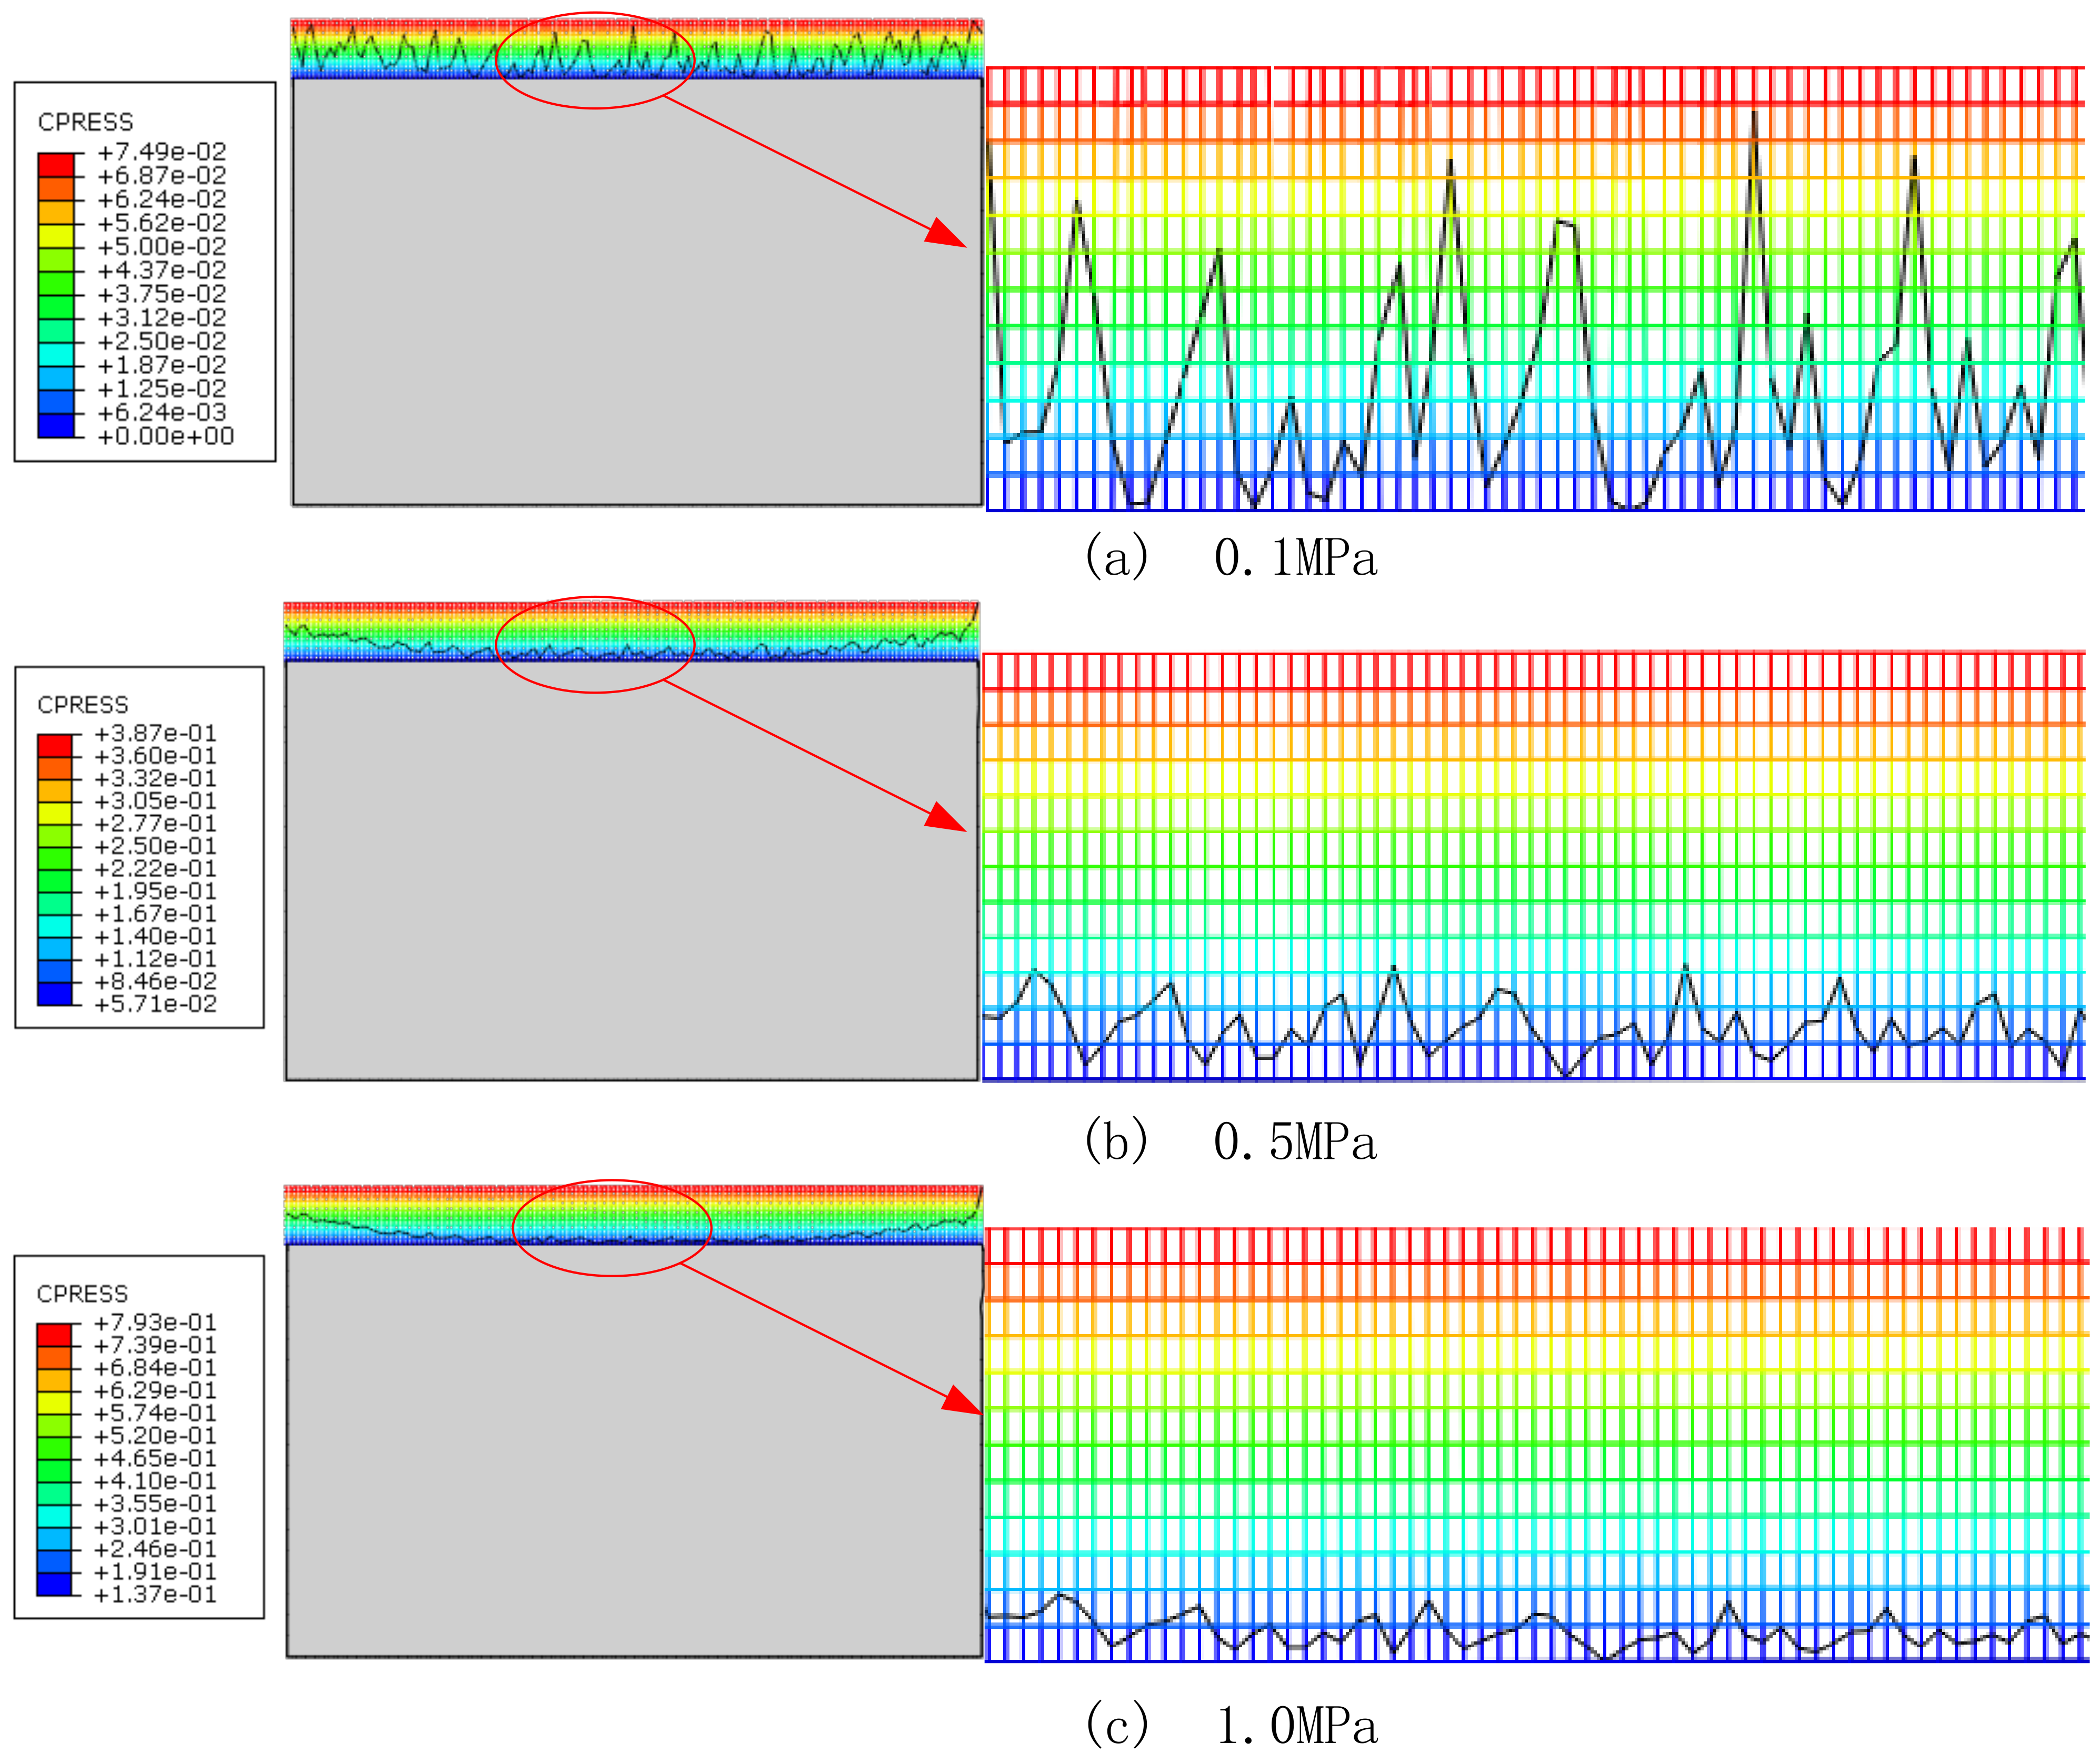
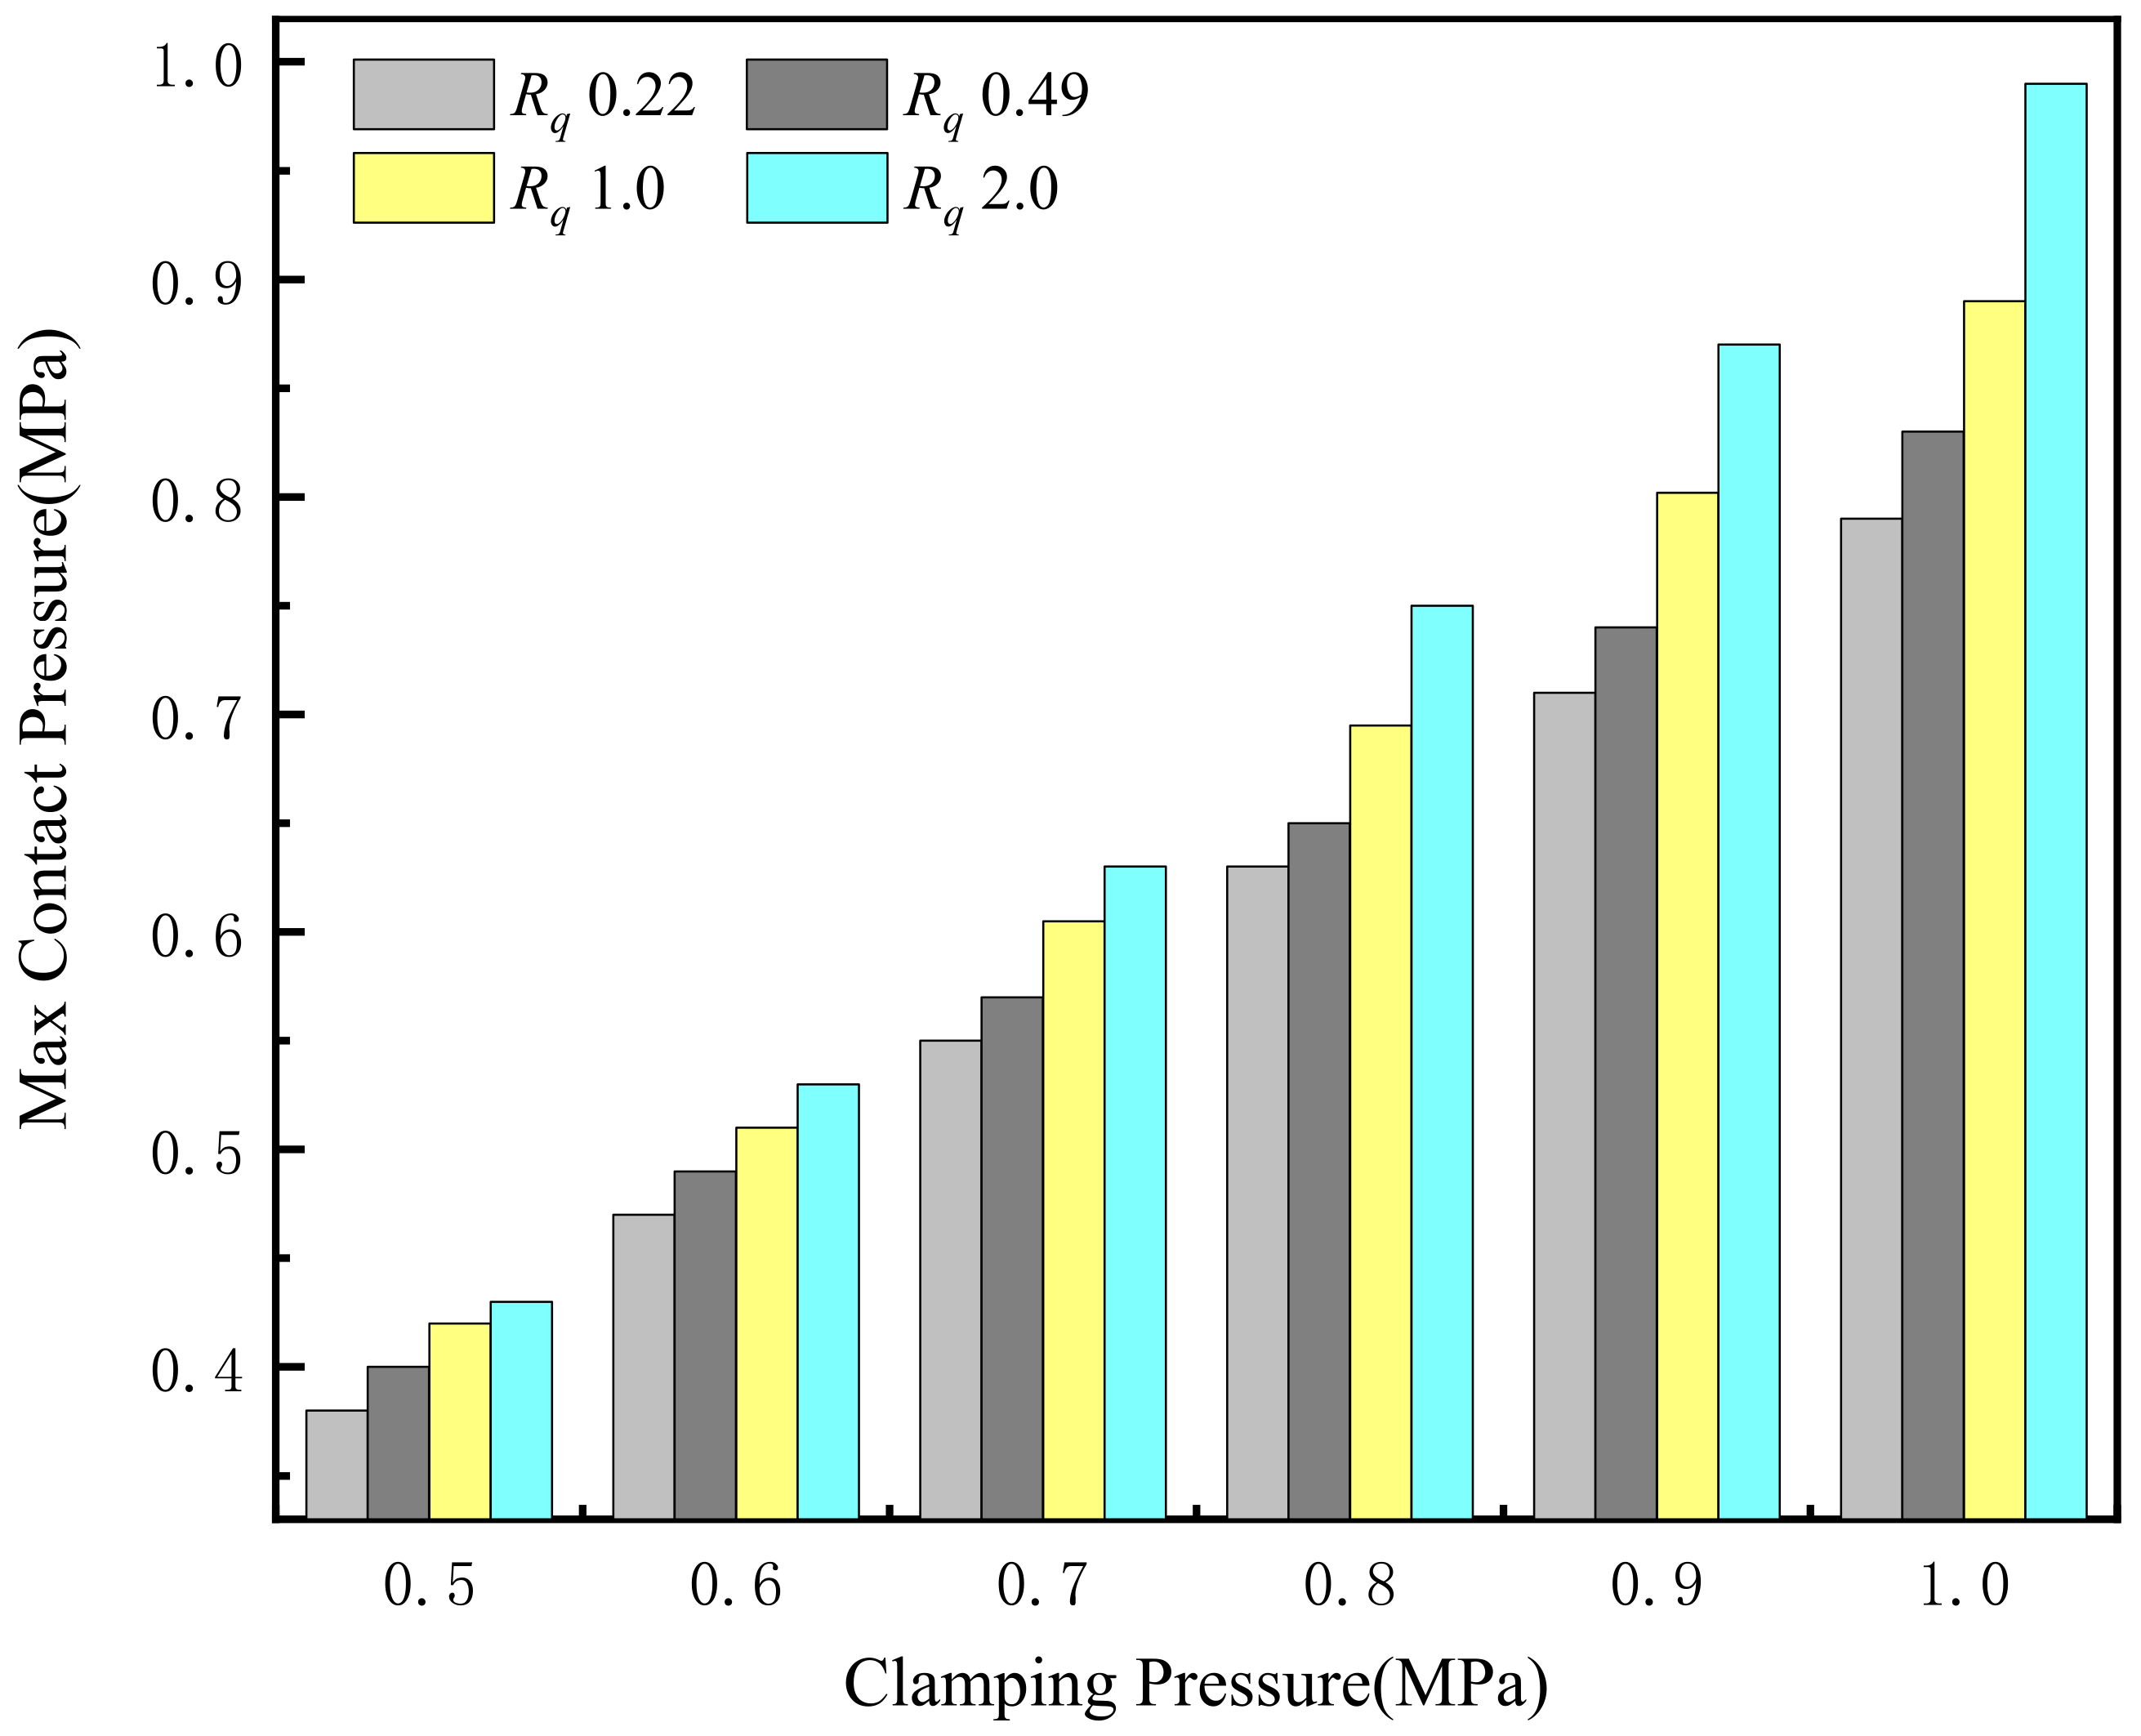
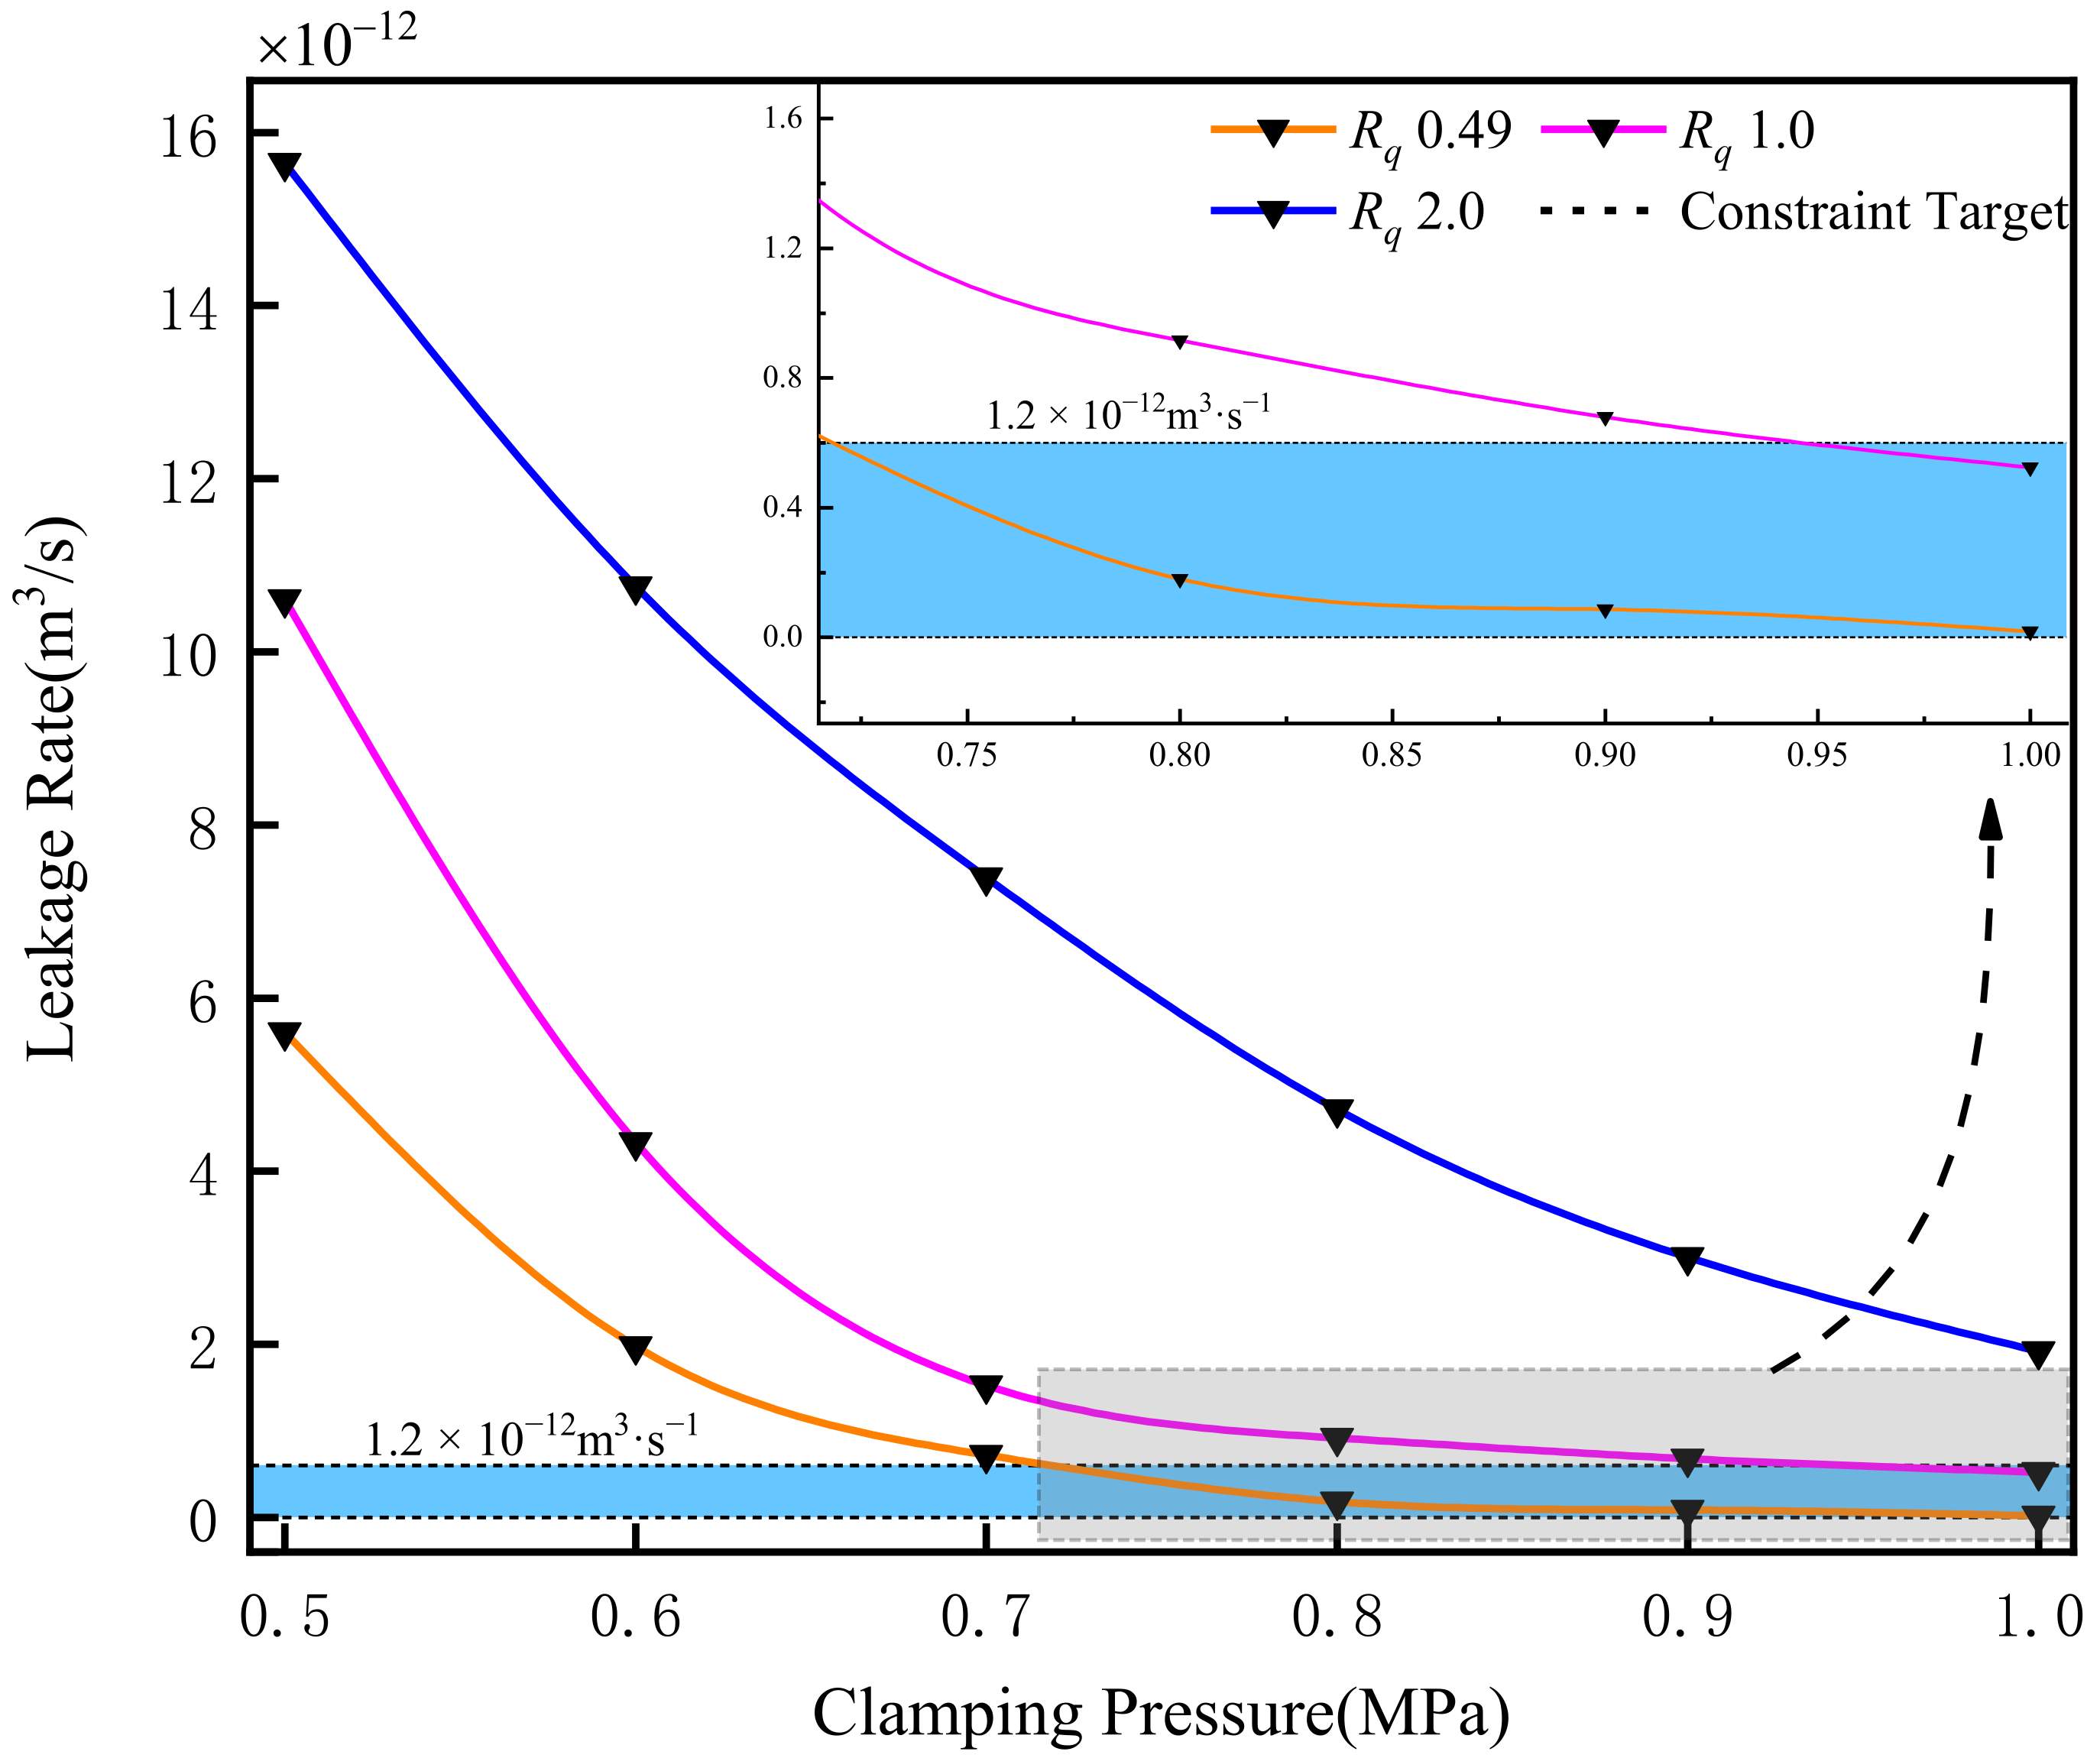
3.2. Effect of Clamping Pressure on Sealing Performance

Figure 11 plots the stress distribution under different clamping pressures of 0.1, 0.5, and 1.0 MPa. The stress variation on the upper surface of the seal and the overall distribution trend is large on both sides and small in the center. When the clamping pressure is less than 0.5 MPa, the stress distribution is uneven on the surface because the strain displacement is smaller than the initial height of the rough peak (shown in Figure 11a). In contrast, the stress distribution at the surface is uniform under clamping pressure of 1.0 MPa, indicating that the rough peak is flattened, and the strain displacement dominates under this condition (shown in Figure 11c).
The relationship between the clamping pressure and the sealing performance is quantitatively analyzed in Figure 12. The black line indicates the distribution of contact pressure. The results indicate that the contact pressure of its surface layer is not uniformly distributed for clamping pressure that is less than 0.5 MPa. In addition, the change in contact pressure values is closely related to the initial morphology, and the contact pressure at the peak position is larger than the trough (as shown by the black line). Furthermore, the middle surface layer morphology is smoother for clamping pressure greater than 0.5 MPa. Accordingly, the contact pressure is uniformly distributed, and the maximum contact pressure appears on the right side of the surface layer.
As mentioned above, the interface state is the main cause of contact pressure variation, which is influenced by the load and surface topography. In order to explore the relationship among those parameters, the maximum contact pressure is chosen to describe the contact state of the interface, and the relative growth rate is used to describe the smoothness of the interface.
Figure 13 compares the maximum contact pressure on the surface of the anode seal under different clamping pressures. It is worth mentioning that the growth rate is decreasing because the rough surface is extruded to the valley under the high clamping pressure, which makes the surface a smooth trend and increases the contact area. When the load is less than 0.5 MPa, the relative growth rate of the maximum contact pressure decreases sharply because the rough surface is extruded to produce elastic deformation and the contact area increases rapidly. The relative growth rate reduces by 69.5% with the clamping pressure varying from 0.1 to 0.5 MPa. When the load is greater than 0.5 MPa, the decrease in the rate of change of the relative growth rate of the maximum contact pressure is due to the increase in the equivalent stiffness caused by the change in the contact area, resulting in a decrease in the deformation along the load direction. The relative growth rate reduces by 58% with the clamping pressure changing from 0.5 to 1 MPa. According to the calculation results in the previous section, it is known that when the critical sealing pressure is 0.417 MPa, the clamping pressure should be greater than 0.54 MPa in order to prevent gas leakage.
Based on the seal performance evaluation index, the leakage rate is introduced. Firstly, the total deformation clouds of the anode seal at 0.1, 0.5, and 1.0 MPa are plotted in Figure 14. The black frame indicates the original position before compression, from which it can be seen that the total geometric deformation increases with the increase in the assembly load. The total deformation of the seal is 0.015 mm or 1.25% of the original thickness for a clamping pressure of 0.1 MPa. When the load is 1 MPa, the total deformation of the seal is 0.12 mm, which is 10% of the original thickness.
Next, we calculate the rough surface deformation height by combining the Roth model with the contact pressure simulation and obtain the leakage rate under different clamping pressures and per the Poiseuille theory. Figure 15 shows the relationship between clamping pressure and the equivalent leakage gap. This indicates that the number of leakage channels reduces and the contact area increases, which gives rise to better performance.
Figure 16 shows the total leakage rate of the anode under different clamping pressures of 0.1–1 MPa. The leakage rate decreases rapidly as the clamping pressure increases because there is a power function relationship between the leakage rate and the equivalent leakage gap. According to the previous calculation, the minimum clamping pressure required for a seal roughness grade of Rq 0.224 is 0.54 MPa, and the corresponding leakage rate is 1.2 × 10⁻¹² m3·s−1; the relative error with the experimental value is 5.22%.

3.3. Effect of Surface Topography

The analysis in the previous section reveals a power function relationship between the leakage rate and the equivalent gap height, which is influenced by the initial gap (roughness) and the contact pressure of the sealing surface. This section investigates the impact of clamping pressure and surface roughness on the leakage rate by using three roughness levels of 0.49, 1.0, and 2.0 μm. The leakage rate (1.2 × 10⁻¹² m3·s−1) corresponding to the rough surface Rq 0.22 is chosen as the reference state. Figure 17 shows the mesh topology with different roughness levels.
The maximum contact pressure of anode sealant with different roughness levels is compared in Figure 18. It can be seen that the maximum contact pressure on the seal surface increases with the increase in roughness levels under the same clamping pressure. The reason is that the initial gap of the surface with a higher roughness grade is larger. This leads to a smaller actual contact area on the surface and an increase in contact pressure under the same clamping pressure condition. Enhancing clamping pressure enlarges the difference in maximum contact pressure between different roughness grades. That is, the contact pressure is positively correlated with the roughness levels.
The leakage rates of three kinds of rough surfaces under different clamping pressures are shown in Figure 19. The leakage rate of different rough surfaces decreases with the increasing clamping pressure because the cavities on the microscopic sealing surface are filled with higher contact pressure, reducing the leakage channel gap. Both the roughness class and clamping pressure joints determine the interface equivalent gap. The leakage rate for surface roughness of Rq 0.22 is used as a constraint to reveal their relationship. The leakage rate constraint target is satisfied, and the required clamping pressure is 0.71 MPa for Rq 0.49 and 0.93 MPa for Rq 1.0. When the surface roughness of the seal is less than 1 μm, the corresponding clamping pressure needs to be increased by 31% for each doubling of the roughness value with the same leakage rate. When the surface roughness is Rq 2.0, the required clamping pressure is 1.34 MPa. That is, when the surface roughness is greater than 1 μm, the clamping pressure needs to be increased by 50%.

4. Conclusions

In this paper, the effect of clamping pressure on the sealing performance of PEM fuel cells has been studied systematically by taking into account the impact of the surface topography of the sealing. The detailed influence of a rough surface on contact pressure and leakage rate is revealed and the correspondence relationships between seal level and clamping pressure are recommended based on the target leakage rate. The detailed conclusions are given as follows:
  • The fractal dimension D and the characteristic scale coefficient G have contrary impacts on the surface topography. The surface roughness Rq is determined by the interaction of both D and G.
  • Increasing the clamping pressure improves the sealing performance of the system due to the increase in the contact pressure and strain displacement on the surface of the sealing accompanied by the exponential decrease in the equivalent leakage gap.
  • When the surface roughness is Rq 0.22, the required clamping pressure is 0.54 MPa and the corresponding leakage rate is 1.2 × 10⁻¹²m3·s−1; they are consistent with the experimental data, verifying the feasibility of the model in simulating parameter variations.
  • Constrained by the leakage rate, when the surface roughness is less than 1 μm, the clamping pressure needs to be increased by 31% with every doubling of the roughness value; when the surface roughness is greater than 1 μm, the clamping pressure needs to be increased by 50%.

Author Contributions

Formal analysis, B.L. and X.L.; Data curation, Y.W.; investigation, K.H.; methodology, B.L.; resources, K.H.; software, B.L.; supervision, Y.W.; validation, X.L.; visualization, B.L. and X.L.; writing—original draft, B.L.; writing—review and editing, B.L. All authors have read and agreed to the published version of the manuscript.

Funding

This research was funded by the Key-Area Research and Development Program of Guangdong Province (grant number 2020B090920001), the Natural Science Foundation of Chongqing, China (grant number cstc2020jcyj-msxmX0759).

Data Availability Statement

Not applicable.

Conflicts of Interest

The authors declare no conflict of interest.

References

  1. Singh, S.; Jain, S.; Ps, V.; Tiwari, A.K.; Nouni, M.R.; Pandey, J.K.; Goel, S. Hydrogen: A sustainable fuel for future of the transport sector. Renew. Sustain. Energy Rev. 2015, 51, 623–633. [Google Scholar] [CrossRef]
  2. Sharma, S.; Ghoshal, S.K. Hydrogen the future transportation fuel: From production to applications. Renew. Sustain. Energy Rev. 2015, 43, 1151–1158. [Google Scholar] [CrossRef]
  3. Chakraborty, U. Fuel crossover and internal current in proton exchange membrane fuel cell modeling. Appl. Energy 2016, 163, 60–62. [Google Scholar] [CrossRef]
  4. Cui, T.; Chao, Y.J.; Van Zee, J.W. Stress relaxation behavior of EPDM seals in polymer electrolyte membrane fuel cell environment. Int. J. Hydrogen Energy 2012, 37, 13478–13483. [Google Scholar] [CrossRef]
  5. Qiu, D.; Liang, P.; Peng, L.; Yi, P.; Lai, X.; Ni, J. Material behavior of rubber sealing for proton exchange membrane fuel cells. Int. J. Hydrogen Energy 2020, 45, 5465–5473. [Google Scholar] [CrossRef]
  6. Kim, M.; Lee, D.G. Development of the anode bipolar plate/membrane assembly unit for air breathing PEMFC stack using silicone adhesive bonding. J. Power Sources 2016, 315, 86–95. [Google Scholar] [CrossRef]
  7. Fernandes, V.A.; De Focatiis, D.S.A. The role of deformation history on stress relaxation and stress memory of filled rubber. Polym. Test. 2014, 40, 124–132. [Google Scholar] [CrossRef]
  8. Cui, T.; Chao, Y.J.; Van Zee, J.W. Sealing force prediction of elastomeric seal material for PEM fuel cell under temperature cycling. Int. J. Hydrogen Energy 2014, 39, 1430–1438. [Google Scholar] [CrossRef]
  9. Zhou, C.; Zheng, J.; Gu, C.; Zhao, Y.; Liu, P. Sealing performance analysis of rubber O-ring in high-pressure gaseous hydrogen based on finite element method. Int. J. Hydrogen Energy 2017, 42, 11996–12004. [Google Scholar] [CrossRef]
  10. Shao, Y.; Yin, Y.; Du, S.; Xia, T.; Xi, L. Leakage monitoring in static sealing interface based on three dimensional surface topography indicator. J. Manuf. Sci. Eng. Trans. ASME 2018, 140, 101003. [Google Scholar] [CrossRef]
  11. Irfan, M.S.; Gill, Y.Q.; Hashmi, M.; Ullah, S.; Saeed, F.; Qaiser, A.A. Long-term stress relaxation behavior of Polyaniline-EPDM blends using the time-temperature-strain superposition method. Mater. Res. Express 2019, 6, 025318. [Google Scholar] [CrossRef]
  12. Li, C.; Ding, Y.; Yang, Z.; Yuan, Z.; Ye, L. Compressive stress-thermo oxidative ageing behaviour and mechanism of EPDM rubber gaskets for sealing resilience assessment. Polym. Test. 2020, 84, 106366. [Google Scholar] [CrossRef]
  13. Hu, G.; Ji, C.; Xia, Y.; Suo, Y.; Wu, X.; Zhang, Z. Assembly mechanics and its effect on performance of proton exchange membrane fuel cell. Int. J. Electrochem. Sci. 2019, 14, 1358–1371. [Google Scholar] [CrossRef]
  14. Persson, B.N.J.; Yang, C. Theory of the leak-rate of seals. J. Phys. Condens. Matter 2008, 20, 315011. [Google Scholar] [CrossRef]
  15. Persson, B.N.J.; Albohr, O.; Creton, C.; Peveri, V. Contact area between a viscoelastic solid and a hard, randomly rough, substrate. J. Chem. Phys. 2004, 120, 8779–8793. [Google Scholar] [CrossRef]
  16. Lorenz, B.; Persson, B.N.J. Leak rate of seals: Comparison of theory with experiment. Europhys. Lett. 2009, 86, 44006. [Google Scholar] [CrossRef]
  17. Lorenz, B.; Persson, B.N.J. Leak rate of seals: Effective-medium theory and comparison with experiment. Eur. Phys. J. E 2010, 31, 159–167. [Google Scholar] [CrossRef]
  18. Bottiglione, F.; Carbone, G.; Mantriota, G. Fluid leakage in seals: An approach based on percolation theory. Tribol. Int. 2009, 42, 731–737. [Google Scholar] [CrossRef]
  19. Marie, C.; Lasseux, D. Experimental leak-rate measurement through a static metal seal. J. Fluids Eng. Trans. ASME 2007, 129, 799–805. [Google Scholar] [CrossRef]
  20. Gan, L.; Yuan, Y.; Liu, K.; Cheng, Y.; Zhang, J. Mechanical model of elastic-plastic contact between fractal rough surfaces. Yingyong Lixue Xuebao/Chin. J. Appl. Mech. 2016, 33, 738–743. [Google Scholar]
  21. Liu, Y.; An, Q.; Huang, M.; Shang, D.; Bai, L. A Novel Modeling Method of Micro-Topography for Grinding Surface Based on Ubiquitiform Theory. Fractal Fract. 2022, 6, 341. [Google Scholar] [CrossRef]
  22. Putignano, C.; Afferrante, L.; Carbone, G.; Demelio, G. A new efficient numerical method for contact mechanics of rough surfaces. Int. J. Solids Struct. 2012, 49, 338–343. [Google Scholar] [CrossRef]
  23. Yang, Y.; Cheng, H.; Du, K.; Liang, B.; Hu, W.; Luo, B.; Zhang, K. Microscale damage modeling of bolt-hole contact interface during the bolt installation process of composite structure. Compos. Struct. 2022, 291, 115561. [Google Scholar] [CrossRef]
  24. Bora, C.K.; Plesha, M.E.; Carpick, R.W. A Numerical Contact Model Based on Real Surface Topography. Tribol. Lett. 2013, 50, 331–347. [Google Scholar] [CrossRef]
  25. Song, H.; Vakis, A.I.; Liu, X.; Van der Giessen, E. Statistical model of rough surface contact accounting for size-dependent plasticity and asperity interaction. J. Mech. Phys. Solids 2017, 106, 1–14. [Google Scholar] [CrossRef]
  26. Xiao, H.; Sun, Y. On the normal contact stiffness and contact resonance frequency of rough surface contact based on asperity micro-contact statistical models. Eur. J. Mech. A Solids 2019, 75, 450–460. [Google Scholar] [CrossRef]
  27. Xu, K.; Yuan, Y.; Zhang, L. A normal contact stiffness model of joint surface based on fractal theory. Comput. Model. Eng. Sci. 2019, 119, 459–480. [Google Scholar] [CrossRef]
  28. Jamshidi, H.; Ahmadian, H. A modified rough interface model considering shear and normal elastic deformation couplings. Int. J. Solids Struct. 2020, 203, 57–72. [Google Scholar] [CrossRef]
  29. Zenyuk, I.V.; Parkinson, D.Y.; Hwang, G.; Weber, A.Z. Probing water distribution in compressed fuel-cell gas-diffusion layers using X-ray computed tomography. Electrochem. Commun. 2015, 53, 24–28. [Google Scholar] [CrossRef]
  30. Tötzke, C.; Gaiselmann, G.; Osenberg, M.; Arlt, T.; Markötter, H.; Hilger, A.; Kupsch, A.; Müller, B.; Schmidt, V.; Lehnert, W.; et al. Influence of hydrophobic treatment on the structure of compressed gas diffusion layers. J. Power Sources 2016, 324, 625–636. [Google Scholar] [CrossRef]
  31. Molaeimanesh, G.R.; Nazemian, M. Investigation of GDL compression effects on the performance of a PEM fuel cell cathode by lattice Boltzmann method. J. Power Sources 2017, 359, 494–506. [Google Scholar] [CrossRef]
  32. Wen, C.Y.; Lin, Y.S.; Lu, C.H. Experimental study of clamping effects on the performances of a single proton exchange membrane fuel cell and a 10-cell stack. J. Power Sources 2009, 192, 475–485. [Google Scholar] [CrossRef]
  33. Taymaz, I.; Benli, M. Numerical study of assembly pressure effect on the performance of proton exchange membrane fuel cell. Energy 2010, 35, 2134–2140. [Google Scholar] [CrossRef]
  34. Alizadeh, E.; Barzegari, M.M.; Momenifar, M.; Ghadimi, M.; Saadat, S.H.M. Investigation of contact pressure distribution over the active area of PEM fuel cell stack. Int. J. Hydrogen Energy 2016, 41, 3062–3071. [Google Scholar] [CrossRef]
  35. Irmscher, P.; Qui, D.; Janßen, H.; Lehnert, W.; Stolten, D. Impact of gas diffusion layer mechanics on PEM fuel cell performance. Int. J. Hydrogen Energy 2019, 44, 23406–23415. [Google Scholar] [CrossRef]
  36. Hu, G. Finite element analysis of PEMFC assembling based on Ansys. Int. J. Electrochem. Sci. 2018, 13, 2080–2089. [Google Scholar] [CrossRef]
  37. Wenling, X. Performance Analysis and Optimization Design of Fuel Cell Sealing Structure. Master’s Thesis, Dalian University Technology, Dalian, China, 2020; pp. 20–60. (In Chinese). [Google Scholar]
  38. Chen, Z.; Liu, Y.; Zhou, P. A comparative study of fractal dimension calculation methods for rough surface profiles. Chaos Solitons Fractals 2018, 112, 24–30. [Google Scholar] [CrossRef]
  39. Lin, J.; Wu, P.; Dai, H.; Qiu, Y.; Zhang, J. Intelligent optimization of clamping design of PEM fuel cell stack for high consistency and uniformity of contact pressure. Int. J. Green Energy 2022, 19, 95–108. [Google Scholar] [CrossRef]
  40. Huang, X.; Liu, S.; Yu, X.; Liu, Y.; Zhang, Y.; Xu, G. A mechanism leakage model of metal-bipolar-plate PEMFC seal structures with stress relaxation effects. Int. J. Hydrogen Energy 2022, 47, 2594–2607. [Google Scholar] [CrossRef]
  41. Li, X.; Yang, Z.; Xu, J.; Chen, R.; Yang, H. The fractal leakage model of contact mechanical seals considering wear and thermal deformation. J. Braz. Soc. Mech. Sci. Eng. 2019, 41, 521. [Google Scholar] [CrossRef]
Figure 1. Schematic diagram of the study methodology.
Fractalfract 07 00401 g001
Figure 2. The finite element model of PEMFC.
Fractalfract 07 00401 g002
Figure 3. Mesh independency tests.
Fractalfract 07 00401 g003
Figure 4. Model validation with rough surface profile experiments. (a) Confocal laser scanning microscope; (b) scaling region; (c) measured rough surface profile.
Fractalfract 07 00401 g004
Figure 5. Measured and simulated fractal graph of rough surface topography.
Fractalfract 07 00401 g005
Figure 6. Measured and simulated structure function logarithmic relations for rough surfaces.
Fractalfract 07 00401 g006
Figure 7. Model validation with leakage rate experiments. (a) Schematic representation of the experimental apparatus; (b) test bench.
Fractalfract 07 00401 g007
Figure 8. W-M general fractal diagram of surface profile curves with different fractal dimensions.
Fractalfract 07 00401 g008
Figure 9. W-M fractal graph of surface profile curve with different characteristic scale coefficients.
Fractalfract 07 00401 g009
Figure 10. Effect of fractal dimension and characteristic scale coefficients on the surface.
Fractalfract 07 00401 g010
Figure 11. Mises stress of anode sealant with different clamping pressures.
Fractalfract 07 00401 g011
Figure 12. Contact pressure of anode sealant with different clamping pressures.
Fractalfract 07 00401 g012
Figure 13. Maximum contact pressure of anode sealant with different clamping pressures.
Fractalfract 07 00401 g013
Figure 14. Deformation diagram of anode sealant with different clamping pressures.
Fractalfract 07 00401 g014
Figure 15. Relationship between clamping pressure and equivalent leakage gap.
Fractalfract 07 00401 g015
Figure 16. The leakage rate of anode sealant with different clamping pressures.
Fractalfract 07 00401 g016
Figure 17. Numerical models of surfaces with different roughness levels.
Fractalfract 07 00401 g017
Figure 18. Maximum contact pressure of anode sealant with different roughness levels.
Fractalfract 07 00401 g018
Figure 19. Relationship between surface roughness levels and leakage rate.
Fractalfract 07 00401 g019
Table 1. Geometric dimensions of each component.
ComponentParametersDefinitionValues
BPPTBPPThickness (mm)18
LBPPLength (mm)100
WCNWidth of the channel (mm)0.75
DCNDepth of the channel (mm)1.0
WRIBWidth of the rib (mm)1.0
GDLTGDLThickness (mm)0.2
LGDLLength (mm)50
MEATMEAThickness (mm)0.05
LMEALength (mm)50
GASKETTGASKETThickness (mm)Rough surface
LGASKETLength (mm)2
Table 2. Material parameters of the components.
ComponentMaterialYoung’s Modulus (MPa)Poisson’s Ratio
BPPGraphite134,1000.25
GDLCarbon11.670.01
MEA——1160.48
GASKETPTFE2.650.48
PENPolyethylene naphthalate11840.3
Table 3. Experimental and simulated values of fractal parameters.
ParametersExperimental ValueSimulation ValueRelative Error
Rq/(mm)2.24 × 10−42.09 × 10−46.7%
D1.8291.8011.53%
G2.98 × 10−72.83 × 10−75.03%
Disclaimer/Publisher’s Note: The statements, opinions and data contained in all publications are solely those of the individual author(s) and contributor(s) and not of MDPI and/or the editor(s). MDPI and/or the editor(s) disclaim responsibility for any injury to people or property resulting from any ideas, methods, instructions or products referred to in the content.

