Article

Forecasting Cryptocurrency Prices Using LSTM, GRU, and Bi-Directional LSTM: A Deep Learning Approach

by
Phumudzo Lloyd Seabe
1,*,
Claude Rodrigue Bambe Moutsinga
1 and
Edson Pindza
2
1
Department of Mathematics and Applied Mathematics, Sefako Makgatho Health Sciences University, Ga-Rankuwa 0208, South Africa
2
Department of Mathematics and Applied Mathematics, University of Pretoria, Pretoria 0002, South Africa
*
Author to whom correspondence should be addressed.
Fractal Fract. 2023, 7(2), 203; https://doi.org/10.3390/fractalfract7020203
Submission received: 18 January 2023 / Revised: 13 February 2023 / Accepted: 15 February 2023 / Published: 18 February 2023

Abstract

:
Highly accurate cryptocurrency price predictions are of paramount interest to investors and researchers. However, owing to the nonlinearity of the cryptocurrency market, it is difficult to assess the distinct nature of time-series data, resulting in challenges in generating appropriate price predictions. Numerous studies have been conducted on cryptocurrency price prediction using different Deep Learning (DL) based algorithms. This study proposes three types of Recurrent Neural Networks (RNNs): namely, Long Short-Term Memory (LSTM), Gated Recurrent Unit (GRU), and Bi-Directional LSTM (Bi-LSTM) for exchange rate predictions of three major cryptocurrencies in the world, as measured by their market capitalization—Bitcoin (BTC), Ethereum (ETH), and Litecoin (LTC). The experimental results on the three major cryptocurrencies using both Root Mean Squared Error (RMSE) and the Mean Absolute Percentage Error (MAPE) show that the Bi-LSTM performed better in prediction than LSTM and GRU. Therefore, it can be considered the best algorithm. Bi-LSTM presented the most accurate prediction compared to GRU and LSTM, with MAPE values of 0.036, 0.041, and 0.124 for BTC, LTC, and ETH, respectively. The paper suggests that the prediction models presented in it are accurate in predicting cryptocurrency prices and can be beneficial for investors and traders. Additionally, future research should focus on exploring other factors that may influence cryptocurrency prices, such as social media and trading volumes.

1. Introduction

The current monetary system is predicated upon the use of fiat currency, which possesses several advantages such as divisibility, transferability, durability, and scarcity [1]. However, this system has several drawbacks, including the absence of a tangible backing for currency and government control over the money supply, which can result in issues such as hyperinflation and income inequality [2]. Furthermore, the current ledgers used to record transactions are susceptible to manipulation and violations, and transactions are often conducted through intermediaries such as financial institutions and credit card companies, leading to high costs and longer transfer times. This can lead to a loss of control and ownership of data by individuals. Despite these limitations, the current financial system is still trusted by the general public due to the backing of government regulations and legal contracts. However, historical instances of trust breaches, such as the dot-com in the 1990s and real estate bubbles in 2008, have resulted in significant financial losses [3]. Thus, it is crucial to develop a new model that can effectively establish trust among all stakeholders in the financial system. In October 2008, an individual or group operating under the pseudonym Satoshi Nakamoto [4] introduced a revolutionary system known as blockchain technology, which was accompanied by the invention of the first digital currency, BTC. This system facilitates peer-to-peer (P2P) monetary transactions over the public internet without the need for intermediaries and has emerged as an important asset class in the international financial landscape [5]. It is now being studied by academic institutions, government agencies, media outlets, and the general public.
Cryptocurrencies are a new type of digital currency that uses cryptography to safeguard the transaction process and prevent counterfeiting [6]. One important fact about cryptocurrencies is that they are independent of traditional banks, as they are not issued by any central authority, which makes them distinguishable from the traditional centralized currencies. Since the blockchain is essential to cryptocurrencies, it is stated that cryptocurrencies share all the characteristics of the blockchain. For instance, BTC provides people with a secure way to conduct digital transactions pseudo-anonymously, which makes it easy to know the patron and recipient in its transactions. The blockchain technology has gained attention from governments worldwide, leading to calls for regulation in the cryptocurrency sector. The motivation behind this governmental interest stems from concerns related to crime, sovereignty, and opportunities. However, the BTC network operates on Proof-of-Work (PoW) and Proof-of-Stake (PoS) hybrid schemes, which demand high energy consumption in their computational processes to secure the network [7]. Proof-of-work is a consensus algorithm used in some blockchain systems, such as BTC that requires users to perform a certain amount of computational work to validate transactions and add them to the blockchain. This work, also known as mining, is typically conducted using specialized hardware, such as Application Specific Integrated Circuits (ASICs), and consumes a significant amount of energy. A disadvantage of PoW systems is that they are often criticized for their high energy consumption and centralization of mining power. The energy consumption associated with PoW, in light of the global push towards combating climate change, presents a challenge to the sustainability of the BTC network. Nevertheless, alternative mechanisms, such as PoS, are consensus algorithms that do not require users to perform computational work to validate transactions. Instead, users are required to hold a certain amount of the asset in question, also known as staking, to participate in the validation process. The advantage of PoS systems is that they are often seen as a more energy-efficient alternative to PoW systems, as they do not require the same level of computational power [8].
Among the numerous cryptocurrencies available, BTC stands out as the most well-known and widely used. This is due to its early arrival in the market and its status as the first decentralized cryptocurrency, which helped it gain a significant amount of attention and popularity. Over time, this has established BTC as the leading currency in the crypto-market. Other popular cryptocurrencies include ETH, LTC, and Ripple (XRP). Ethereum is considered the second largest blockchain platform after BTC, and it enables the creation of smart contracts, decentralized apps, and decentralized organizations (DAOs). The primary goal of LTC’s introduction to the blockchain was to prioritize transaction speed, making it a popular choice for time-sensitive mining processes. Ref. [9] highlights that the competition between Bitcoin and other cryptocurrencies is a positive development, as it drives technological and security advancements within the industry. The relationship and interaction between big data and cryptocurrency have been studied in [10]. Big data refer to the vast amounts of data generated by various sources such as social media, sensors, and mobile devices. These data are typically unstructured and challenging to process using traditional methods. The digitization and high-end technology of the past decade have undergone significant changes in computing and communication platforms. This progression has resulted in the widespread collection and implementation of big data analytics into various aspects of daily life, as stated in [11]. The Internet of Things (IoT) and the use of big data analytics are transforming communication infrastructure and shaping the way data are processed and analyzed. They both rely on advanced technology, including Artificial Intelligence (AI) and machine learning, to manage large amounts of data. The connection between big data and cryptocurrencies is close, as blockchain technology, which is used in cryptocurrency management, to leverage big data techniques for secure and decentralized data storage and processing. Additionally, big data analytics can be used to study cryptocurrency market trends and detect fraudulent activities, thereby strengthening the cryptocurrency market. The interdependence between big data and cryptocurrencies creates growth opportunities for both.
Cryptocurrency is a lucrative market for speculation due to its high volatility. The application of AI and machine learning algorithms can aid in predicting future cryptocurrency prices, yet the task remains challenging due to the complexity and nonlinear behavior of the prices. Despite this, the market value of cryptocurrencies is predicted to grow in the future, with an estimated compound annual growth rate of 11.1%. However, investors have faced difficulties in the past with price bubbles leading to excessive volatility. To overcome these challenges, a reliable model is necessary to assist market participants in capturing trends and making predictions. However, accurately predicting cryptocurrency prices is challenging as they are heavily influenced by various factors such as government policies, technological advancements, public perception, and global events. As a result, the purpose of the paper is to use deep learning algorithms to improve predictions by identifying concealed patterns in the data, combining them, and generating predictions that are significantly more accurate:
  • Presenting a framework model for price predictions of BTC, ETH, and LTC cryptocurrencies;
  • Application of DL algorithms such as LSTM, Bi-LSTM, and GRU techniques;
  • Evaluating the prediction performance of the proposed deep learning algorithms using metrics of RMSE and MAPE
The main idea behind the proposed deep learning models is to achieve reliable price prediction models that investors and speculators of cryptocurrencies can rely on based on historical data. Moreover, we aim to answer the research question of ‘How can both AI and DL algorithms help investors and speculators to forecast the prices of cryptocurrencies?’ and ‘What is the best artificial neural network model to forecast prices of the chosen cryptocurrencies?’ This section provides an overview of cryptocurrencies, and the remainder in the paper is structured as follows: Section 2 describes the literature review, and Section 3 presents the materials and methodology, Section 4 illustrates the experimental results, Section 5 presents a relative comparison of our model with those of similar studies, and Section 6 summarizes the conclusions of the paper.

2. Literature Review

Machine learning is an artificial intelligence tool that uses past data to predict the future. From this aspect, by training a machine learning model on historical cryptocurrency price data, it may be possible to predict future price movements with some degree of accuracy. Prior research has shown that machine learning based techniques have a number of advantages over traditional forecasting models, including the ability to give results that is nearly or exactly the same as the actual result while also improving the accuracy of the results [12]. There are a number of different machine learning techniques that can be used for this purpose, including decision trees, support vector machines (SVM), and neural networks (NN). The authors of [13] reveal that inclusion of cryptocurrencies in multi-asset portfolios improves the effectiveness of the portfolio in different ways. First, it enhances the minimum variance of the portfolio and also moves the efficient frontier into a better position. Furthermore, the standard deviation of the portfolio decreases and the Sharpe ratio increases by including cryptocurrency assets into the portfolios.
In the literature, a number of research studies that used machine learning algorithms in BTC price forecasting demonstrated their encouraging results. In a study conducted by [12], machine learning algorithms were used to forecast the prices of different currency including BTC, ETH, LTC, XRP, and Stellar. The researchers compared the performance of three different machine learning techniques—SVM, Artificial Neural Network (ANN), and DL and found that the SVM technique had the highest accuracy among the three. The authors of [14] employed a range of features to forecast the prices of BTC and ETH, carefully selecting the most reliable predictors through correlation analysis. When applying SVM, linear regression, and random forest (RF) to these chosen features, the results demonstrated that linear regression outperformed the other methods. Additionally, the authors experimented with using LSTM, a particular type of deep learning, to predict the prices of BTC and ETH and found that LSTM had the lowest prediction error for BTC. Researchers in [15] examined the use of machine learning based ensemble methods as a combination of ANN, KNN, gradient boosted trees, and an ensemble model that combines several techniques to forecast the prices of nine different cryptocurrencies. The findings demonstrated that the ensemble learning model demonstrated the lowest error in the predictions. The authors in [16] also used an ensemble model, comprising RF and a Gradient Boosting Machine (GBM), to predict the prices of three cryptocurrencies—BTC, ETH, and XRP. The MAPE was calculated for these predictions, and the results showed that the MAPE values for the ensemble model ranged from 0.92% to 2.61%. Lately, we have seen a vast amount of DL based models focused on financial time series predictions. Deep learning is a type of machine learning that involves training ANN on a large dataset. These neural networks are inspired by the structure and function of the human brain, and they are able to learn and make intelligent decisions on their own. Deep learning algorithms have made significant advancements and achieved impressive results in several areas including image processing, speech recognition, computer vision, and natural language processing. For deep learning, RNNs, in particular, are types of algorithms that are particularly well-suited for processing sequential data, such as time series, natural language, and speech, while Convolutional Neural Networks (CNNs) are particularly well-suited for image and video analysis tasks. LSTM and GRU, two types of RNNs, are frequently utilized for time series prediction. The authors in [17] developed a two-stage approach for forecasting BTC prices, first employing ANN and RF to determine the relevant features for prediction, and then using an LSTM model with these selected features. The results demonstrated that the LSTM model outperformed ARIMA and SVM. In another study [18], a hybrid method was implemented, combining LSTM and GRU networks, to predict the prices of LTC and Monero (XMR). This hybrid approach was compared to an LSTM only method, and the results indicated that the hybrid model had higher accuracy in predicting the prices of the selected cryptocurrencies. Another study in [19] developed a method for predicting daily BTC prices by integrating autoregressive (AR) features into an LSTM network. When compared to a traditional LSTM model, their proposed LSTM-AR model demonstrated lower error rates as measured by mean squared error (MSE), RMSE, MAPE, and mean absolute error (MAE). The authors in [20] utilized deep learning techniques to predict trends and prices for selected cryptocurrencies using hourly prices for BTC, ETH, and XRP. They proposed an ensemble learning method that combined LSTM, Bi-LSTM, and CNN, and found that this method could provide accurate and reliable predictions. The authors in [21] compared the use of two machine learning approaches, RF and GBM, in predicting the prices of three cryptocurrencies—BTC, ETH, and XRP. The results showed that the GBM was more effective at forecasting the prices, with an RMSE of 263.34 on BTC, 5.02 on ETH, and 0.92 on XRP. In their study, Ref. [22] aimed to improve the accuracy of cryptocurrency price prediction using a novel approach called the weighted and attentive memory convolutional neural network (WAMC). The WAMC model was designed to take advantage of the strengths of three different types of neural networks: a GRU, which establishes an attentive memory for each input sequence; a channel-wise weighting module, which helps to identify interdependencies among various cryptocurrencies; and a CNN, which extracts local temporal features from historical price data. The authors tested the performance of the WAMC model on ETH and BTC, and found that it achieved an RMSE of 9.70 and 1.37, respectively. These results suggest that the WAMC model is a promising approach for predicting cryptocurrency prices.

3. Materials and Methods
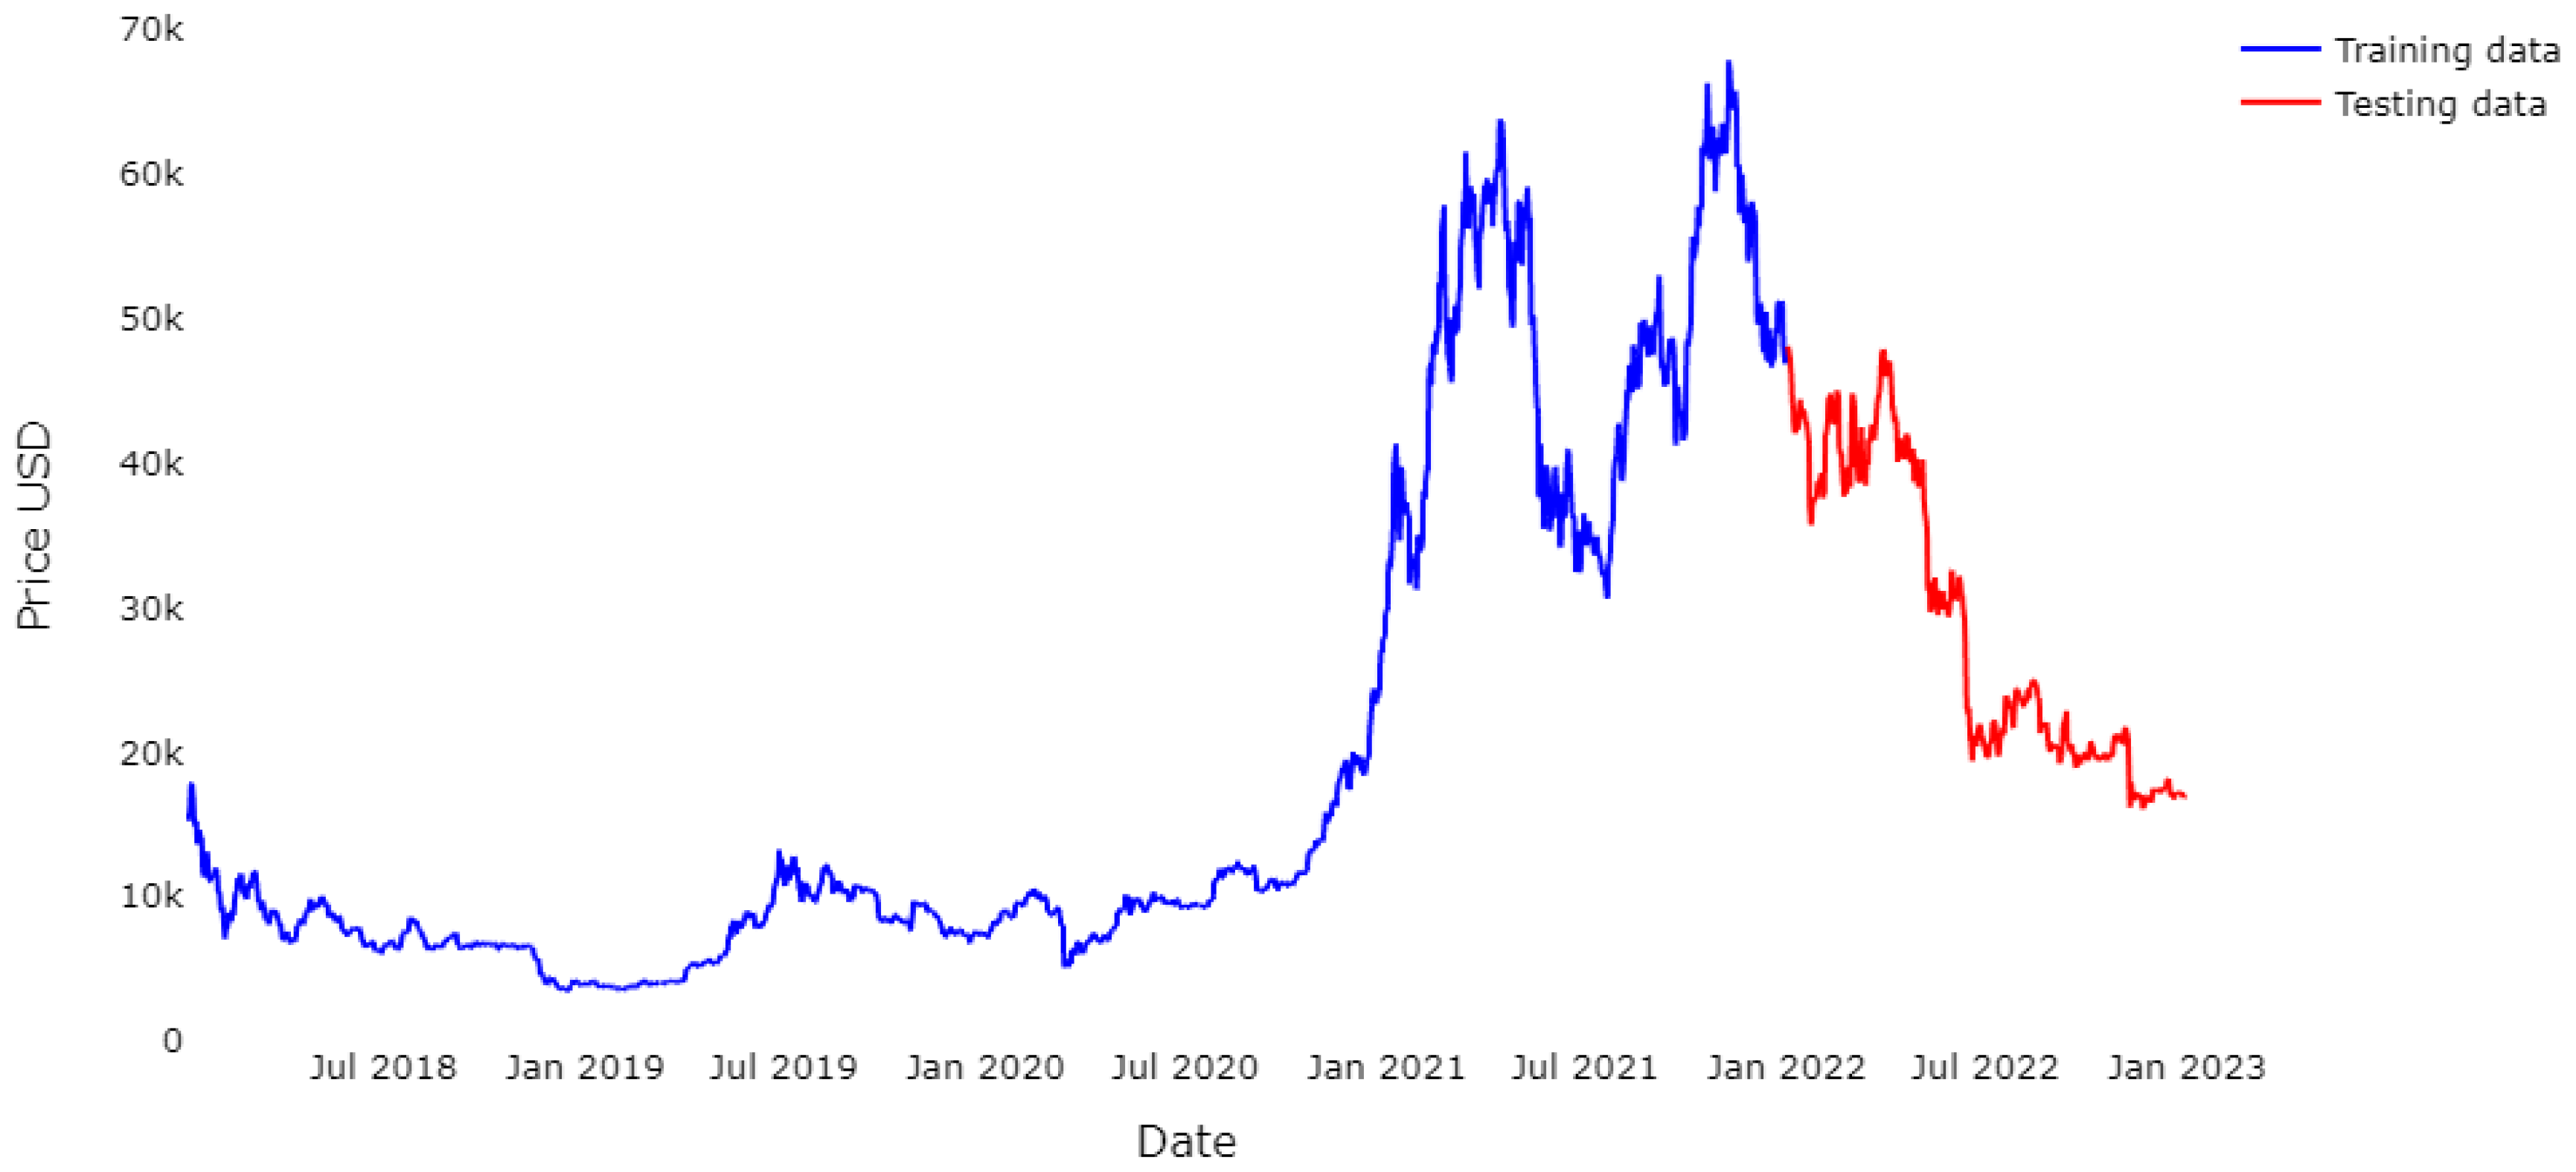
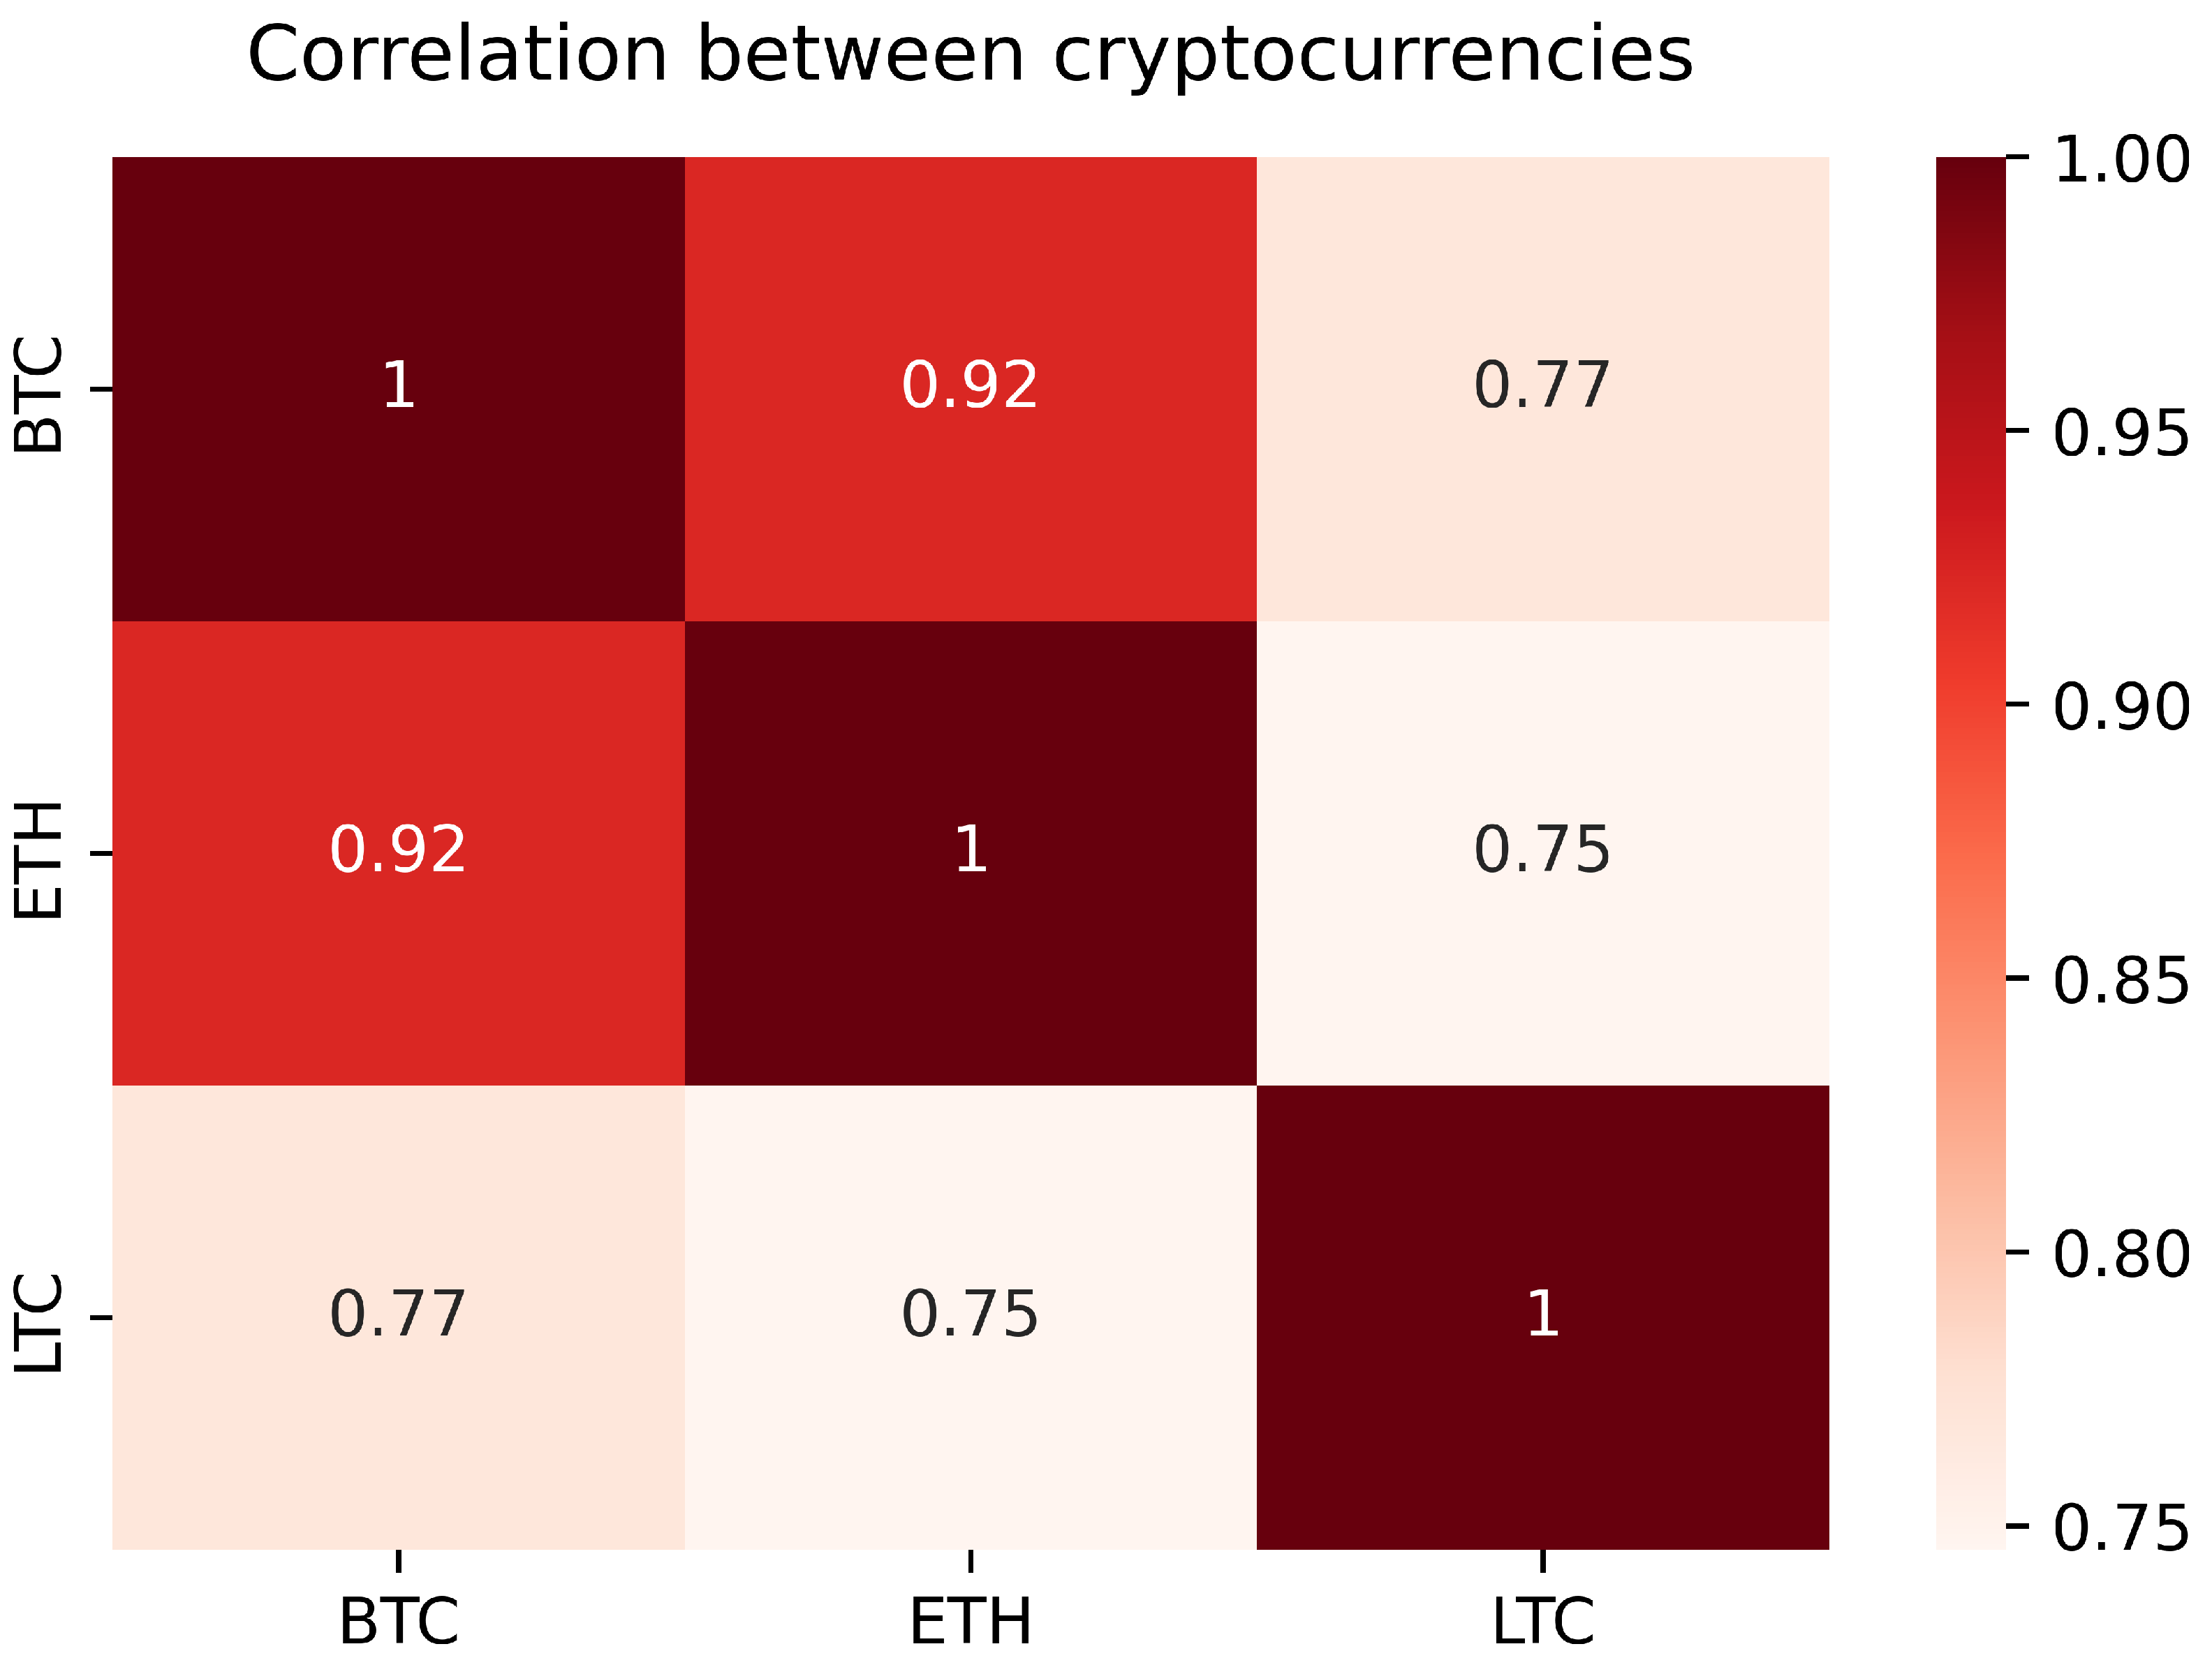
In this section, we outline the procedures employed in the pre-processing and modeling phase of the study. Subsequently, a demonstration of the prediction plot results for a selection of cryptocurrencies is presented. Finally, we provide a comprehensive evaluation of the study’s performance and analysis.
The goal of this study is to use deep learning techniques, including LSTM, GRU, and Bi-LSTM, to predict the prices of three cryptocurrencies: BTC, ETH, and LTC. For evaluation purposes, the study follows a specific process, which involves: (1) historical data collection for BTC, ETH, and LTC; (2) exploratory data visualization; (3) splitting each dataset into training and testing datasets; (4) training three types of models; (5) testing the models; and (6) comparing the performance of each DL method.

3.1. Dataset

In this study, we proposed a simple three-layer network architecture for each deep learning model, consisting of 100-neuron deep learning layers (LSTM, Bi-LSTM, and GRU). The pre-processing methods for the dataset are shown in Figure 1. We conducted various pre-processing techniques on the cryptocurrency data to prepare it for deep learning processing. After handling missing values through data imputation, we reshaped the data to be compatible with the application of LSTM, Bi-LSTM, and GRU. The examination of the dataset revealed the presence of missing values, which we then replaced using a straightforward imputation technique by replacing them with the previous recorded observations. Normalization is fundamental to ensure the accuracy of model fitting and to avoid bias. To mitigate the potential issue of unequal treatment of variables with different scales, we utilized feature-wise normalization techniques such as MinMax Scaling prior to model fitting. Recent studies have demonstrated the effectiveness of such data scaling methods in enhancing model performance [23]. Thus, in this study, we employed MinMax Scalar for scaling the data. We used a training:test split strategy of 80:20 to preserve continuity in features for each cryptocurrency. The training dataset is from 1 January 2018 to 31 December 2021 (80% of the data), while the testing dataset consists of data from 1 January 2022 to 1 January 2023 (20% of the data). The experiments were conducted using Python 3 and relevant libraries such as NumPy, Pandas, Matplotlib, Keras, and scikit-learn.
The model was trained and run on a Macbook Air, 8-core CPU with 4 performance cores and 4 efficiency cores, a 7-core GPU, a 16-core Neural Engine, and 256 GB SSD of disk space. In conducting the experiments, we used Python 3 and several core libraries, such as NumPy for numerical computing, Pandas for data processing and analysis, Matplotlib for data visualization, and Keras and scikit-learn (sklearn) for the deep learning application programming interface (API) in Python.
Figure 2, Figure 3 and Figure 4 illustrate the daily closing prices of the targeted cryptocurrencies BTC, ETH, and LTC and are divided into training and testing datasets. Note that we only included historical data for the last five years to filter out monotonous data in the early days of cryptocurrency.
The interpretation of Figure 2 reveals that the BTC price has a much more extensive price track record compared to alternative cryptocurrencies. The currency price has been gradually increasing to reach an all-time high of over USD 65,000 in November 2021.
Figure 3 shows that the price for the second-largest in the blockchain ecosystem, Ethereum (ETH), soared to new heights back in 2021 reaching USD 4800 after a rough year in 2020.
Figure 4 reveals that LTC has large variability to ETH and BTC. The coin was valued at more than USD 385 per coin during 2021, a price that was nearly four times higher than its 2020 peak. It is worth noting that LTC has been relatively volatile in recent years, revealing high price swings for the currency coin.
In statistics and machine learning, it is important to understand the distribution of the dataset using meaningful charts in order to understand trends and patterns. Figure 5 shows the time series data for BTC, ETH, and LTC ranging from 1 January 2018 to 1 January 2023. The period was chosen to obtain a sufficient amount of dataset entries to feed into the DL models.
The dataset was collected from https://finance.yahoo.com/ (accessed on 23 July 2022) in CSV format. The CSV file had three separate sheets: BTC, ETH, and LTC. Table 1 illustrates the specification of the used parameters whilst Figure 6 represents the sample data from the datasets of the targeted cryptocurrencies used in the study.
The correlation matrix Figure 7 below demonstrates the Pearson correlation coefficient between the targeted cryptocurrencies. In Pearson correlation, we say that variables are correlated when a change in the value of one affects the other. Variables are said to be significantly correlated when the coefficient r is greater than 0.5, and the coefficient lies between [–1, 1]. The correlation matrix indicates a positive correlation between the closing prices for BTC, LTC, and ETH. This implies that, if one of the coin prices rises or falls, the others will follow suit.

3.2. Deep Leaning Algorithms

3.2.1. Long Short-Term Memory—LSTM

LSTM is an updated version of RNN. They are specifically designed to avoid long-term dependence problems, whilst solving the vanishing gradient problem with an added mechanism, for regulating information, allowing it to be retained for long periods of time [24]. In short, the LSTM architecture is made up of a number of memory blocks that are recurrently connected sub networks. The network’s memory blocks serve the dual functions of maintaining the network’s state over time and regulating the flow of information between the cells. Figure 8 shows the LSTM block architecture, with input signal x t , output h t , and the activation function. The input gate step is responsible for determining the information which should be kept in the cell state while the output is responsible for computation of the information that should be sent out from the cell state.
The forward training process of an LSTM network can be described using the following equations [25]:
i t = σ ( W i [ h t 1 , x t ] + b i )
f t = σ ( W f [ h t 1 , x t ] + b t )
c t = f t c t 1 + i t tanh ( W c [ h t 1 , x t ] + b c )
o t = σ ( W o [ h t 1 , x t ] + b o )
h t = o t tanh ( c t )
where x t is the input at time step t, h t is the hidden state at time step t, c t is the cell state at time step t, and i t , f t , and o t are the input gate, forget gate, and output gate, respectively, at time step t. W and b are the weight matrices and bias vectors, respectively. The sigmoid function and the hyperbolic tangent function (tanh) are used to bound the output between 0 and 1, and between –1 and 1, respectively.

3.2.2. Gated Recurrent Unit—GRU

Gated Recurrent Units (GRUs) are a type of RNN that were introduced by [26] in 2014 as an improvement over the traditional LSTM networks. Like LSTMs, GRUs are designed to be able to process input sequences of arbitrary length and maintain a state that encodes information about the past. However, unlike LSTMs, which use multiple gates and an internal memory cell to control the flow of information, GRUs use a single update gate to decide which information to retain and a reset gate to decide which information to discard. This makes GRUs simpler and easier to train than LSTMs, while still being able to achieve similar performance on many tasks [27].
In a study by [26], GRUs were shown to outperform LSTMs on the task of language modeling on the Penn Treebank dataset. In a comparison of NLP models by [28], GRUs were found to be competitive with LSTMs and CNNs on several benchmarks. One advantage of GRUs is that they are able to capture long-range dependencies in sequential data more effectively than simple RNNs. This is because the update and reset gates in a GRU allow it to selectively retain or forget information from the past, depending on the current input and the state of the network. This makes GRUs particularly well-suited for tasks that require the ability to remember and use information from long sequences, such as language translation.
In Figure 9, the hidden state at time t, h t , is updated based on the input at time t, x t , and the previous hidden state, h t 1 , using the following equations [29]:
u t = σ ( W u [ h t 1 , x t ] )
r t = σ ( W r [ h t 1 , x t ] )
h t = ( 1 u t ) h t 1 + u t tanh ( W [ r t h t 1 , u t ] )
where u t and r t is update and reset gate, respectively.

3.2.3. Bi-Directional LSTM

A Bi-LSTM or bidirectional GRU (Bi-GRU) represented by Figure 10, is a type of RNN that processes sequential data in both forward and backward directions. This allows the network to use information from both the past and future when making predictions or classifications. This can be particularly useful for tasks where the context of the current time depends on both past and future events. In a Bi-LSTM or Bi-GRU, two layers of LSTM or GRU cells are stacked together, and one layer processes the data in the forward direction while the other processes the data in the backward direction.
One of the key contributions of Bi-LSTMs was presented in the paper “Bi-directional Recurrent Neural Networks” [30] in 1997, where they introduced the concept of using a forward and backward LSTM to model both past and future context for speech signal processing tasks. Since then, Bi-LSTMs have been widely used in many natural language processing tasks, including language translation, sentiment analysis, and text classification. Bi-LSTMs have also shown themselves to be effective in time series prediction in several studies [27,31,32], using Bi-LSTM and obtaining successful results. Similarly, Refs. [25,33] have utilized Bi-LSTM and demonstrated its powerful performance on time series data.

3.3. Hyperparameter Tuning

Hyperparameter optimization is a fundamental aspect that has a considerable effect on the efficacy of a machine learning algorithm. By selecting optimal hyperparameters, the algorithm’s performance can be notably improved, leading to more precise predictions [34]. The process of tuning the hyperparameters before the final run of the deep learning algorithm is crucial for ensuring optimal results. In the current study, the number of neurons in each layer, epoch size, and batch size were considered as the hyperparameters to be optimized. An epoch refers to a complete forward and backward pass of the entire dataset during the model’s execution, while the batch size refers to the number of samples used in one forward/backward pass. It determines the number of samples that will be propagated through the network and updated the weights in a single iteration. Batch size is a hyperparameter that can affect model performance, and it can also affect the training time. A smaller batch size will result in more frequent weight updates but may lead to slower convergence, while a larger batch size may converge faster but may be computationally more demanding. For the following batch size 16, 32, 64, and 120 were used in the experiments. However, 120 was selected as the best hyperparameter, as it produced more accurate results for all prediction models used in this study.

3.4. Performance Metrics

To evaluate the performance of the proposed DL algorithms’ schemes, we used root mean squared error (RMSE) and mean absolute error percentage (MAPE). The smaller the RMSE and MAPE values, the better the prediction model performance:
R M S E = t = 1 n ( A t P t ) 2 n
M A P E = 100 n × i = 1 n A t P t A t
where P t and A t are the forecast and actual value, respectively, and n is the number of time steps.

4. Results

The proposed deep learning models used Python libraries such as Sklearn, Keras, and Tensorflow. The algorithms were coded using Python 3.9 and run on a Mac computer with a M1 processor, 8 GB of memory, and a 7-core GPU using Jupyter Lab. The results of using these models to predict BTC, ETH, and LTC are listed in Table 2, with the model with the smallest error values being determined as the best. The comparison between the actual values and the predicted values for these currencies are shown in Figure 11, Figure 12, Figure 13, Figure 14, Figure 15, Figure 16, Figure 17, Figure 18 and Figure 19, where it can be seen that the predicted values are similar to the actual values with some variations. These variations can be seen in the performance metrics presented in Table 2.

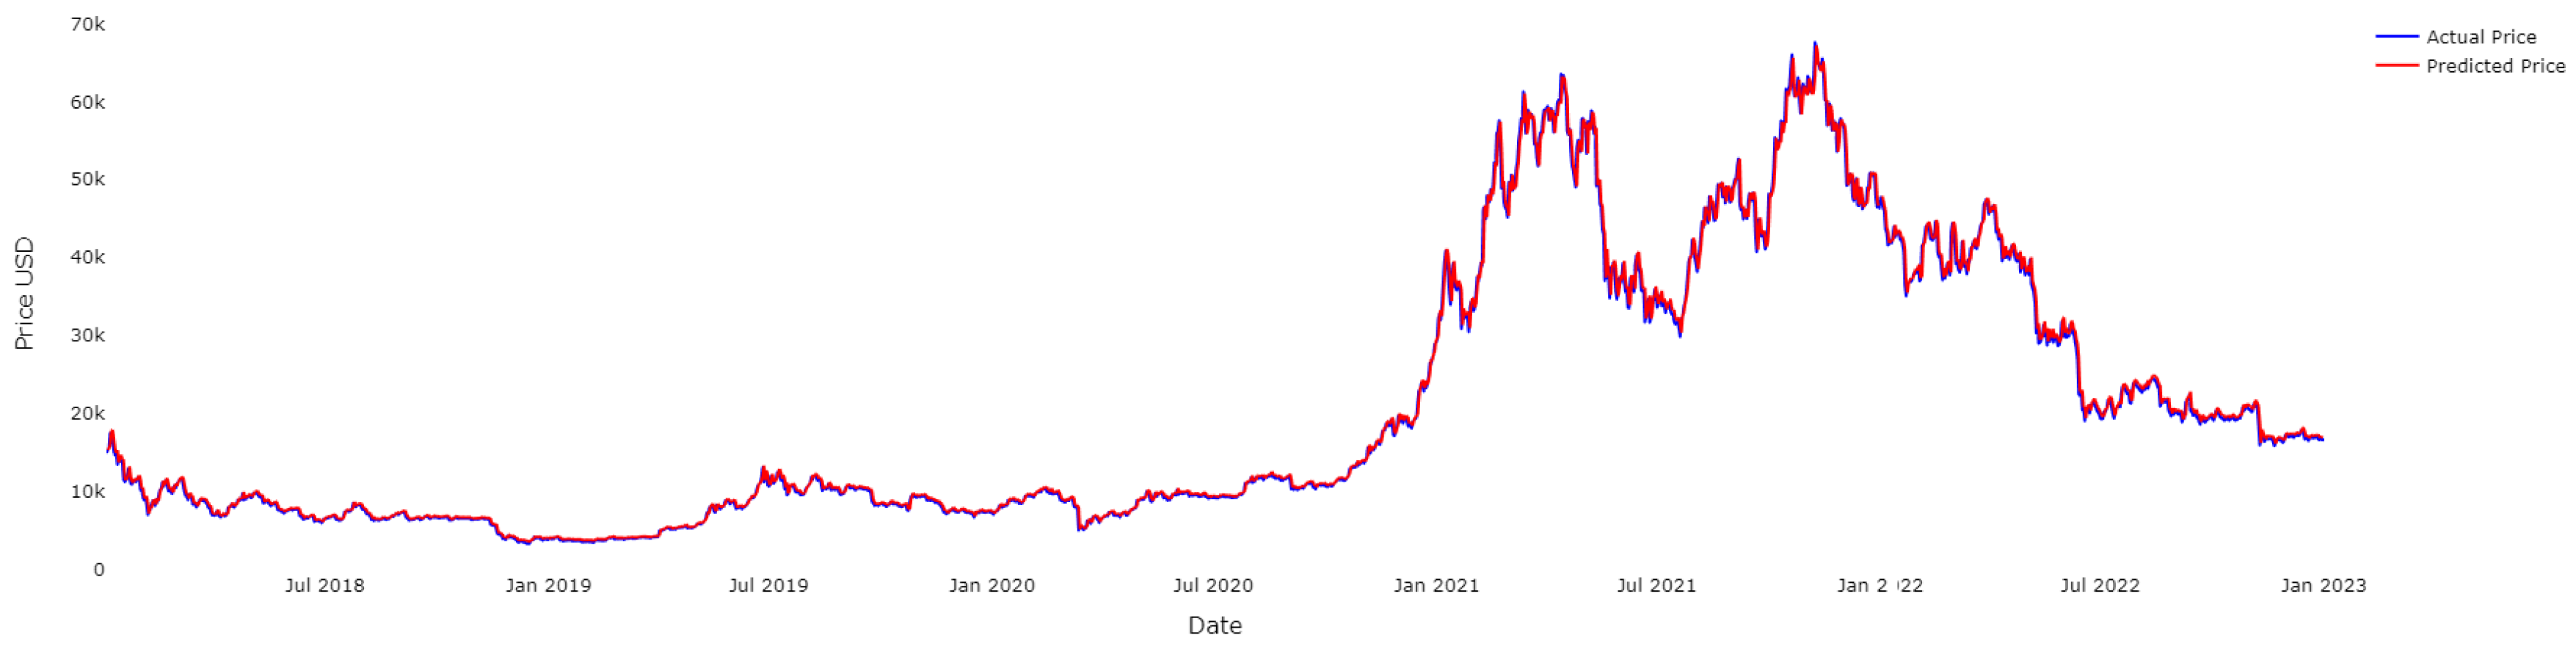
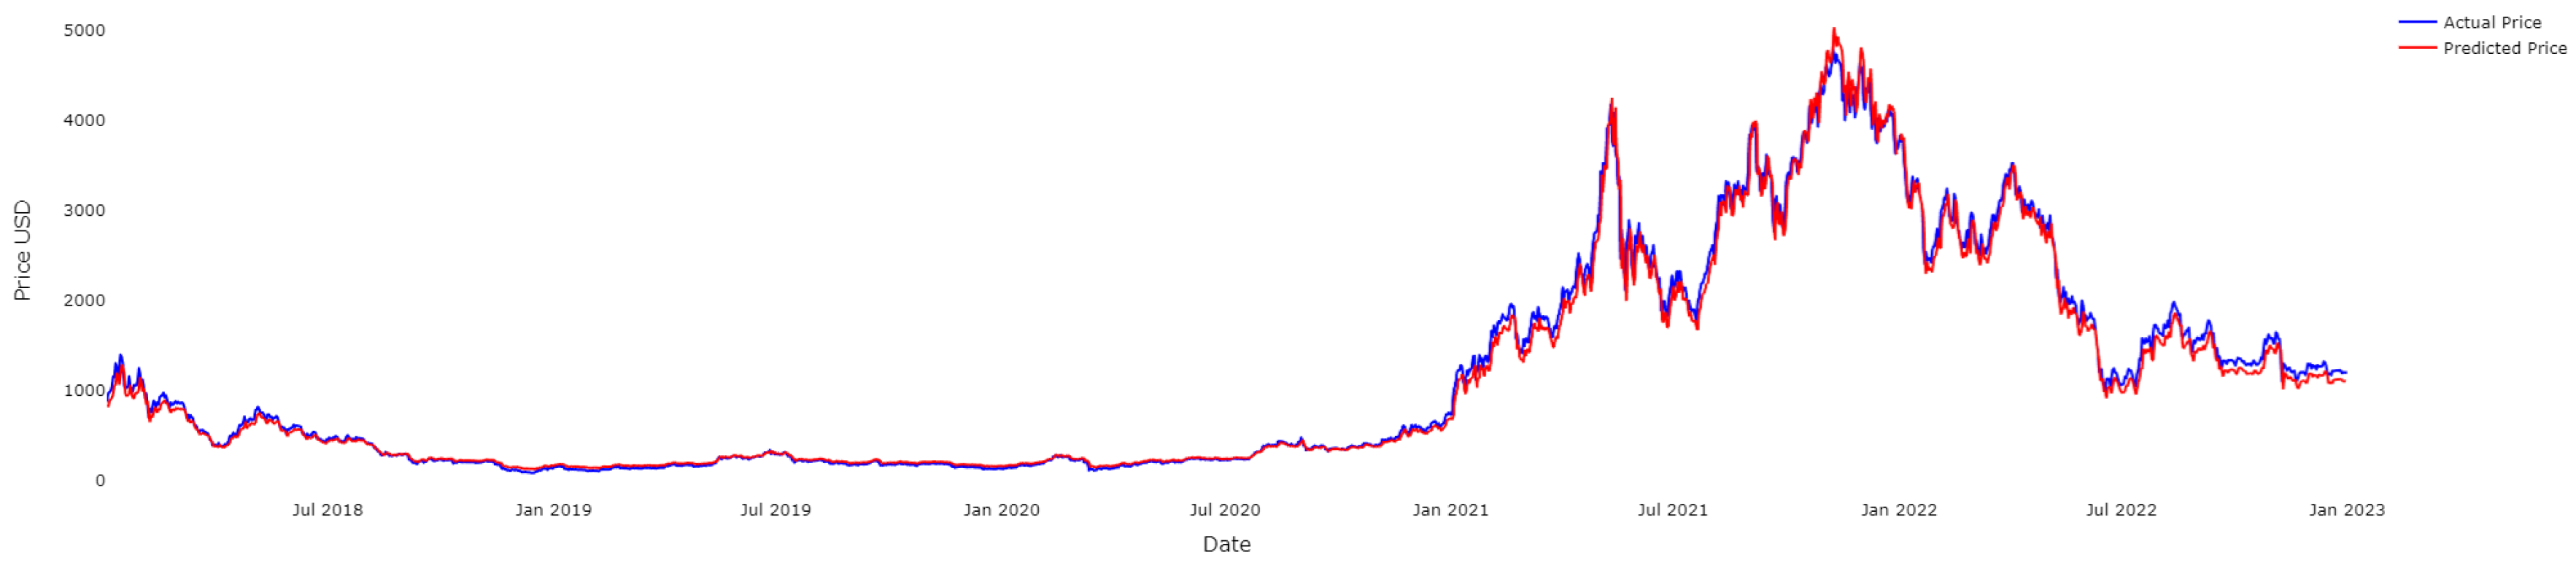
4.1. Results for BTC

According to Table 2, the Bi-LSTM model has the best performance for predicting BTC prices, with the lowest RMSE and MAPE values. This is confirmed by Figure 11, which shows that the Bi-LSTM model predictions closely match the actual prices. The results suggest that the Bi-LSTM model is more effective at predicting BTC trends than LSTM and GRU, with a small difference in performance compared to the LSTM model. The second-best model for BTC is the LSTM, with slightly higher RMSE and MAPE values. These results suggest that bidirectional RNN networks are more effective for BTC price prediction than traditional RNN networks. The comparison of actual and predicted values of the training dataset for the three models can be seen in Figure 11, Figure 12 and Figure 13 for BTC.
Figure 11. BTC—actual and predicted results using Bi-LSTM model.
Fractalfract 07 00203 g011
Figure 12. BTC—actual and predicted results using the LSTM model.
Fractalfract 07 00203 g012
Figure 13. BTC—actual and predicted results using the GRU model.
Fractalfract 07 00203 g013

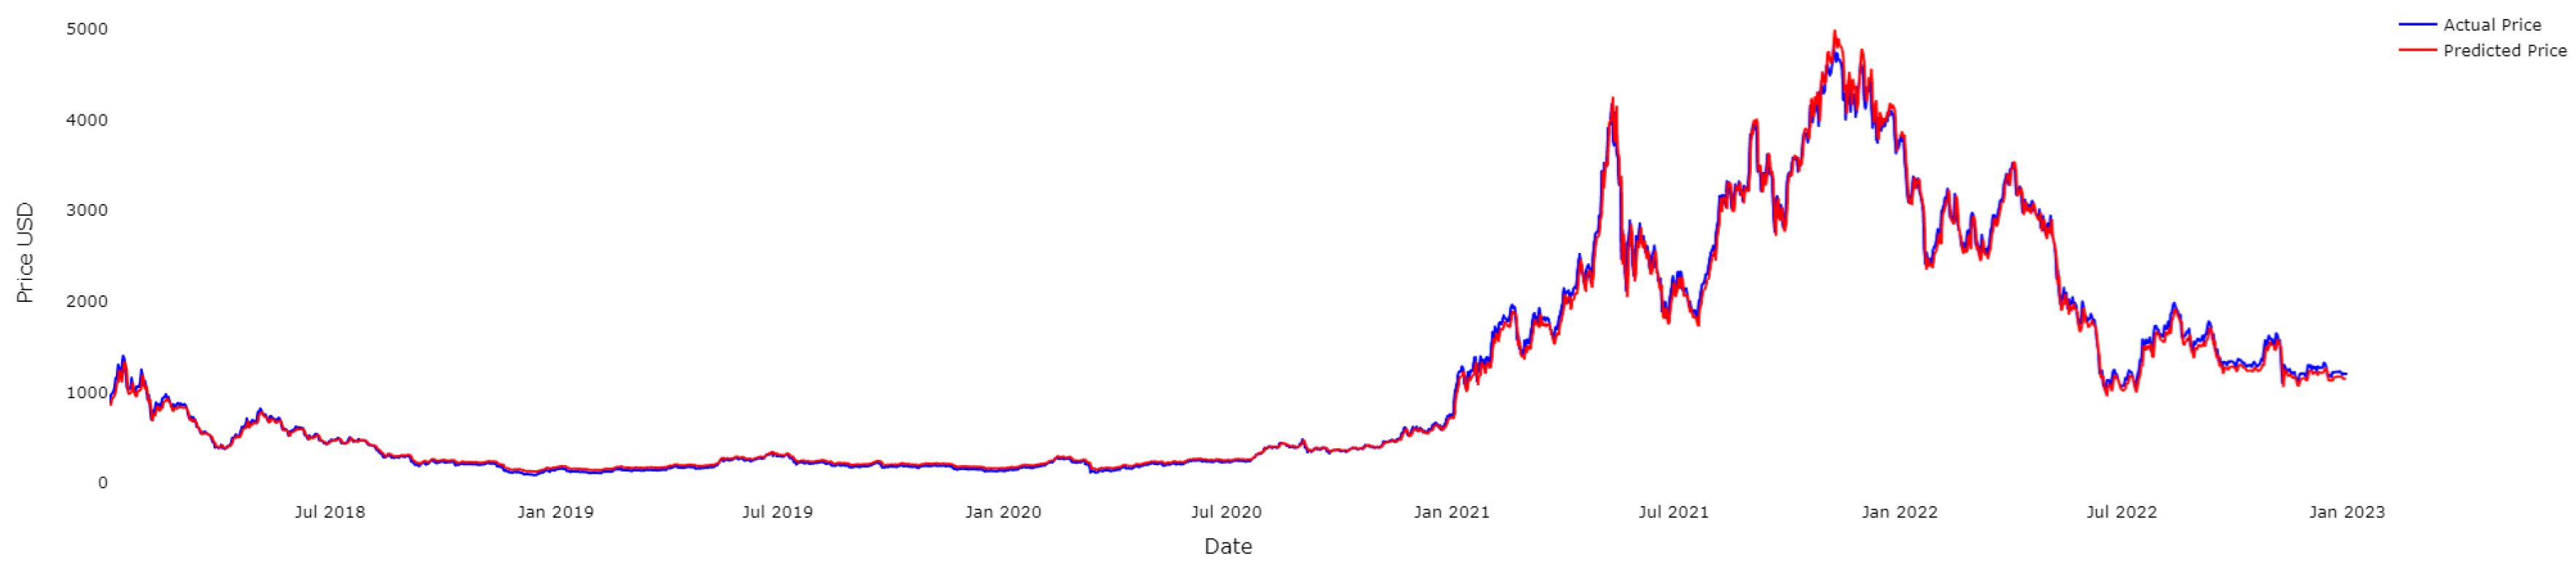
4.2. Results for ETH

The results from Table 2 and Figure 14 show that the Bi-LSTM model has the best performance in forecasting ETH prices, with the lowest RMSE and MAPE values of 83.9531 and 0.1243, respectively. The graph in Figure 14 also demonstrates that the Bi-LSTM model has the smallest difference between the actual and predicted prices of ETH.
The graph in Figure 15 illustrates how well the GRU model predicted the prices of ETH. The difference between the predicted prices and the actual prices is minimal, as seen by the low MAPE of 0.1480 and RMSE of 98.3141. This suggests that the model had a high level of accuracy in its predictions.
The graph in Figure 16 illustrates the comparsion between the actual and the predicted price of ETH using the LSTM model. The difference between the predicted prices and the actual prices is minimal along the testing set, as seen by the MAPE of 0.2972 and RMSE of 148.5221 This suggests that the model had a lower level of accuracy in its predictions compared to GRU and Bi-LSTM.
Overall, bidirectional RNN networks perform better than traditional LSTM and GRU networks in forecasting ETH prices.
Figure 14. ETH—actual and predicted results using the Bi-LSTM model.
Fractalfract 07 00203 g014
Figure 15. ETH—actual and predicted results using the GRU model.
Fractalfract 07 00203 g015
Figure 16. ETH—actual and predicted results using the LSTM model.
Fractalfract 07 00203 g016

4.3. Results for LTC

Table 2 demonstrates the accuracy of models for the LTC cryptocurrency. The Bi-LSTM model had the smallest MAPE at 0.0411 and the smallest RMSE at 8.0249, making it the most effective model for predicting LTC compared to LSTM and GRU. Figure 17, Figure 18 and Figure 19 display a comparison of the actual and predicted values of the training dataset for LTC using three different models through visual representation.
The graph in Figure 18 illustrates how well the GRU model predicted the prices of LTC. The difference between the predicted prices and the actual prices is minimal, as seen by the low MAPE of 0.0458 and RMSE of 8.1224. This suggests that the model had a high level of accuracy in its predictions.
The graph in Figure 19 illustrates how well the LSTM model predicted the prices of LTC. The difference between the predicted prices and the actual prices is minimal, as seen by the MAPE of 0.0636 and RMSE of 9.6680. This suggests that the model had a lower level of accuracy in its predictions compared to GRU and Bi-LSTM.
Figure 17. LTC—actual and predicted results using the Bi-LSTM model.
Fractalfract 07 00203 g017
Figure 18. LTC—actual and predicted results using the GRU model.
Fractalfract 07 00203 g018
Figure 19. LTC—actual and predicted results using the LSTM model.
Fractalfract 07 00203 g019

5. Discussion

In the final analysis, the performance of the proposed method for predicting future cryptocurrency values is compared to other models in the literature [35,36]. Based on the evaluation methods and results obtained, these models are deemed dependable and suitable. However, it should be noted that these models have several limitations that can impact their accuracy in predicting cryptocurrency prices. Firstly, cryptocurrency prices are highly dependent on multiple variables, and LSTMs, GRUs, and Bi-LSTMs may not capture all of these dependencies, leading to suboptimal predictions. Furthermore, these models are prone to overfitting, especially when trained on small datasets, which can result in poor performance when applied to new data. Additionally, cryptocurrency prices are subject to high levels of noise and volatility, making it challenging for these models to accurately capture underlying trends.
Table 3 presents comparisons of various studies based on their RMSE and MAPE results. The proposed three methods are seen to perform well and are comparable to other methods in the literature. The MAPE values obtained in this paper show that the Bi-LSTM performed better in predicting the price of all three types of cryptocurrency used in the study, compared to the traditional LSTM and GRU models.
A cost–benefit analysis of building a cryptocurrency price prediction model using LSTM, GRU, and Bi-LSTM involves weighing the potential benefits against the costs involved. The benefits of this project include valuable predictions, revenue generation, and suitability for sequential data prediction. However, there are also costs involved in building and training the models, including hardware and software expenses, risk of inaccurate predictions, and ongoing maintenance.

6. Conclusions

In this study, three types of deep learning techniques—LSTM, GRU, and Bi-LSTM—were used to predict the prices of three major cryptocurrencies, as measured by their market capitalization: Bitcoin, Ethereum, and Litecoin. The performance of the models was evaluated using two scores, RMSE and MAPE. The results of the study showed that the Bi-LSTM model provided the most accurate predictions for all three currencies, followed by the GRU model. This suggests that the combination of forward and backward flows in bi-directional models improves the performance of time-series prediction. The conclusion of the study is that deep learning algorithms are effective in predicting cryptocurrency prices, and that the Bi-LSTM model is more efficient in predicting cryptocurrency prices than traditional LSTM and GRU. In future studies, the effect of tweets and sentiments on cryptocurrency prices will be explored using machine learning techniques.

Author Contributions

P.L.S. designed and built the models, processed the data, interpreted the results, and wrote the first draft of the manuscript; C.R.B.M. and E.P. revised and edited the manuscript. All authors have read and agreed to the published version of the manuscript.

Funding

This research received no external funding.

Data Availability Statement

Data used for this article are publicly available and collected from https://finance.yahoo.com (accessed on 23 July 2022).

Conflicts of Interest

The authors declare no conflict of interest.

References

  1. Melitz, J. DP178 Monetary Discipline, Germany, and the European Monetary System; National Bureau of Economic Research (NBER) Working Paper No. 2319; National Bureau of Economic Research (NBER): Cambridge, MA, USA, 1987; Available online: https://ssrn.com/abstract=884539 (accessed on 24 September 2022).
  2. Bulíř, A. Income inequality: Does inflation matter? IMF Staff. Pap. 2001, 48, 139–159. [Google Scholar]
  3. Basco, S. Globalization and financial development: A model of the Dot-Com and the Housing Bubbles. J. Int. Econ. 2014, 92, 78–94. [Google Scholar] [CrossRef]
  4. Nakamoto, S. Bitcoin: A peer-to-peer electronic cash system. Decentralized Bus. Rev. 2008, 21260. Available online: https://bitcoin.org/bitcoin.pdf (accessed on 19 October 2022).
  5. Sureshbhai, P.N.; Bhattacharya, P.; Tanwar, S. KaRuNa: A blockchain-based sentiment analysis framework for fraud cryptocurrency schemes. In Proceedings of the 2020 IEEE International Conference on Communications Workshops (ICC Workshops), Dublin, Ireland, 7–11 June 2020; pp. 1–6. [Google Scholar]
  6. Rose, C. The evolution of digital currencies: Bitcoin, a cryptocurrency causing a monetary revolution. Int. Bus. Econ. Res. J. (IBER) 2015, 14, 617–622. [Google Scholar] [CrossRef]
  7. Badea, L.; Mungiu-Pupăzan, M.C. The economic and environmental impact of bitcoin. IEEE Access 2021, 9, 48091–48104. [Google Scholar] [CrossRef]
  8. Vranken, H. Sustainability of bitcoin and blockchains. Curr. Opin. Environ. Sustain. 2017, 28, 1–9. [Google Scholar] [CrossRef] [Green Version]
  9. Iwamura, M.; Kitamura, Y.; Matsumoto, T. Is bitcoin the only cryptocurrency in the town? economics of cryptocurrency and friedrich a. hayek. SSRN Electron. J. 2014. [Google Scholar] [CrossRef] [Green Version]
  10. Hassani, H.; Huang, X.; Silva, E. Big-crypto: Big data, blockchain and cryptocurrency. Big Data Cogn. Comput. 2018, 2, 34. [Google Scholar] [CrossRef] [Green Version]
  11. Hwang, K.; Chen, M. Big-Data Analytics for Cloud, IoT and Cognitive Computing; John Wiley & Sons: Hoboken, NJ, USA, 2017. [Google Scholar]
  12. Hitam, N.A.; Ismail, A.R.; Samsudin, R.; Alkhammash, E.H. The Effect of Kernel Functions on Cryptocurrency Prediction Using Support Vector Machines. In Proceedings of the International Conference of Reliable Information and Communication Technology; Springer: Cham, Switzerland, 2022; pp. 319–332. [Google Scholar]
  13. Andrianto, Y.; Diputra, Y. The effect of cryptocurrency on investment portfolio effectiveness. J. Financ. Account. 2017, 5, 229–238. [Google Scholar] [CrossRef] [Green Version]
  14. Saad, M.; Choi, J.; Nyang, D.; Kim, J.; Mohaisen, A. Toward characterizing blockchain-based cryptocurrencies for highly accurate predictions. IEEE Syst. J. 2019, 14, 321–332. [Google Scholar] [CrossRef]
  15. Chowdhury, R.; Rahman, M.A.; Rahman, M.S.; Mahdy, M. An approach to predict and forecast the price of constituents and index of cryptocurrency using machine learning. Phys. A Stat. Mech. Its Appl. 2020, 551, 124569. [Google Scholar] [CrossRef]
  16. Derbentsev, V.; Babenko, V.; Khrustalev, K.; Obruch, H.; Khrustalova, S. Comparative performance of machine learning ensemble algorithms for forecasting cryptocurrency prices. Int. J. Eng. 2021, 34, 140–148. [Google Scholar]
  17. Chen, W.; Xu, H.; Jia, L.; Gao, Y. Machine learning model for Bitcoin exchange rate prediction using economic and technology determinants. Int. J. Forecast. 2021, 37, 28–43. [Google Scholar] [CrossRef]
  18. Patel, M.M.; Tanwar, S.; Gupta, R.; Kumar, N. A deep learning-based cryptocurrency price prediction scheme for financial institutions. J. Inf. Secur. Appl. 2020, 55, 102583. [Google Scholar] [CrossRef]
  19. Wu, C.H.; Lu, C.C.; Ma, Y.F.; Lu, R.S. A new forecasting framework for bitcoin price with LSTM. In Proceedings of the 2018 IEEE International Conference on Data Mining Workshops (ICDMW), Singapore, 17–20 November 2018; pp. 168–175. [Google Scholar]
  20. Livieris, I.E.; Pintelas, E.; Stavroyiannis, S.; Pintelas, P. Ensemble deep learning models for forecasting cryptocurrency time-series. Algorithms 2020, 13, 121. [Google Scholar] [CrossRef]
  21. Derbentsev, V.; Datsenko, N.; Babenko, V.; Pushko, O.; Pursky, O. Forecasting Cryptocurrency Prices Using Ensembles-Based Machine Learning Approach. In Proceedings of the 2020 IEEE International Conference on Problems of Infocommunications. Science and Technology (PIC S&T), Kharkiv, Ukraine, 6–9 October 2020; pp. 707–712. [Google Scholar]
  22. Zhang, Z.; Dai, H.N.; Zhou, J.; Mondal, S.K.; García, M.M.; Wang, H. Forecasting cryptocurrency price using convolutional neural networks with weighted and attentive memory channels. Expert Syst. Appl. 2021, 183, 115378. [Google Scholar] [CrossRef]
  23. Ahsan, M.M.; Mahmud, M.P.; Saha, P.K.; Gupta, K.D.; Siddique, Z. Effect of data scaling methods on machine learning algorithms and model performance. Technologies 2021, 9, 52. [Google Scholar] [CrossRef]
  24. Hochreiter, S.; Schmidhuber, J. Long short-term memory. Neural Comput. 1997, 9, 1735–1780. [Google Scholar] [CrossRef]
  25. Ayoobi, N.; Sharifrazi, D.; Alizadehsani, R.; Shoeibi, A.; Gorriz, J.M.; Moosaei, H.; Khosravi, A.; Nahavandi, S.; Chofreh, A.G.; Goni, F.A.; et al. Time series forecasting of new cases and new deaths rate for COVID-19 using deep learning methods. Results Phys. 2021, 27, 104495. [Google Scholar] [CrossRef]
  26. Chung, J.; Gulcehre, C.; Cho, K.; Bengio, Y. Empirical evaluation of gated recurrent neural networks on sequence modeling. arXiv 2014, arXiv:1412.3555. [Google Scholar]
  27. Yang, S.; Yu, X.; Zhou, Y. Lstm and gru neural network performance comparison study: Taking yelp review dataset as an example. In Proceedings of the 2020 International Workshop on Electronic Communication and Artificial Intelligence (IWECAI), Shanghai, China, 12–14 June 2020; pp. 98–101. [Google Scholar]
  28. Wang, X.; Jiang, W.; Luo, Z. Combination of convolutional and recurrent neural network for sentiment analysis of short texts. In Proceedings of the Proceedings of COLING 2016, the 26th International Conference on Computational Linguistics: Technical Papers, Osaka, Japan, 11–16 December 2016; pp. 2428–2437. [Google Scholar]
  29. Dey, R.; Salem, F.M. Gate-variants of gated recurrent unit (GRU) neural networks. In Proceedings of the 2017 IEEE 60th International Midwest Symposium on Circuits and Systems (MWSCAS), Boston, MA, USA, 6–9 August 2017; pp. 1597–1600. [Google Scholar]
  30. Schuster, M.; Paliwal, K.K. Bidirectional recurrent neural networks. IEEE Trans. Signal Process. 1997, 45, 2673–2681. [Google Scholar] [CrossRef] [Green Version]
  31. Lai, S.; Ye, C.; Zhou, H.J.H. Chinese stock trend prediction based on multi-feature learning and model fusion. In Proceedings of the 2021 IEEE International Conference on Smart Data Services (SMDS), Chicago, IL, USA, 5–10 September 2021; pp. 18–23. [Google Scholar]
  32. Singh, A.; Kumar, A.; Akhtar, Z. Bitcoin Price Prediction: A Deep Learning Approach. In Proceedings of the 2021 8th International Conference on Signal Processing and Integrated Networks (SPIN), Noida, India, 26–27 August 2021; pp. 1053–1058. [Google Scholar]
  33. Althelaya, K.A.; El-Alfy, E.S.M.; Mohammed, S. Stock market forecast using multivariate analysis with bidirectional and stacked (LSTM, GRU). In Proceedings of the 2018 21st Saudi Computer Society National Computer Conference (NCC), Riyadh, Saudi Arabia, 25–26 April 2018; pp. 1–7. [Google Scholar]
  34. Na, Z.; Wang, Y.; Li, X.; Xia, J.; Liu, X.; Xiong, M.; Lu, W. Subcarrier allocation based simultaneous wireless information and power transfer algorithm in 5G cooperative OFDM communication systems. Phys. Commun. 2018, 29, 164–170. [Google Scholar] [CrossRef]
  35. Hansun, S.; Wicaksana, A.; Khaliq, A.Q. Multivariate cryptocurrency prediction: Comparative analysis of three recurrent neural networks approaches. J. Big Data 2022, 9, 1–15. [Google Scholar] [CrossRef]
  36. Ozturk Birim, S. An Analysis for Cryptocurrency Price Prediction Using Lstm, Gru, and the Bi- Directional Implications. In Developments in Financial and Economic Fields at the National and Global Scale; Cömert, M., Şimşek, A.E., Eds.; Gazi Kitabevi: Ankara, Türkiye, 2022; pp. 377–392. [Google Scholar]
Figure 1. Methodology of processing data and model selection.
Fractalfract 07 00203 g001
Figure 2. Training and Test sample for BTC.
Fractalfract 07 00203 g002
Figure 3. Training and Test sample for ETH.
Fractalfract 07 00203 g003
Figure 4. Training and Test samples for LTC.
Fractalfract 07 00203 g004
Figure 5. BTC, ETH, and LTC time-series.
Fractalfract 07 00203 g005
Figure 6. A snippet showing a sample of the data from the BTC, ETH, and LTC datasets. (a) sample of the BTC dataset; (b) sample of the ETH dataset; (c) sample of the LTC dataset.
Fractalfract 07 00203 g006
Figure 7. Heat map representing the correlation for BTC, ETH, and LTC.
Fractalfract 07 00203 g007
Figure 8. The structure of a long short-term memory (LSTM) algorithm.
Fractalfract 07 00203 g008
Figure 9. The diagram of a GRU cell.
Fractalfract 07 00203 g009
Figure 10. The structure of a bi-directional LSTM (Bi-LSTM) algorithm.
Fractalfract 07 00203 g010
Table 1. Dataset specifications.
ParameterDescriptionData Type
DateDate of the observationDate
OpenDaily opening price of the selected cryptocurrencyNumber
HighDaily high price of the selected cryptocurrencyNumber
LowDaily low price of the selected cryptocurrencyNumber
CloseDaily close price of the selected cryptocurrencyNumber
Close Adj CloseDaily Adjusted close price of the selected cryptocurrencyNumber
Table 2. Performance results for the proposed models.
CurrencyModelRMSEMAPE
BTCLSTM1031.34010.0394
 Bi-LSTM1029.36170.0356
 GRU1274.17060.0572
ETHLSTM148.52150.2971
 Bi-LSTM83.95310.1243
 GRU98.31360.1479
LTCLSTM9.66800.0636
 Bi-LSTM8.02490.0411
 GRU8.12240.0458
Bold value represents the lowest error score for each cryptocurrency pair.
Table 3. Relative comparison with similar studies.
AuthorsCryptocurrenciesMethodsMAPERMSE
[35]BTC - USDLSTM0.0422518.02
  Bi-LSTM0.0382222.74
  GRU0.0351777.31
[35]ETH -USDLSTM0.064150.09
  Bi-LSTM0.060147.85
  GRU0.057151.62
[36]BTC - USDLSTM0.0402350.53
  Bi-LSTM0.0331992.88
  GRU0.0533223.01
[36]ETH -USDLSTM0.047183.84
  Bi-LSTM0.042168.60
  GRU0.047181.03
[36]XRP -USDLSTM0.0630.098
  Bi-LSTM0.0480.079
  GRU0.0720.104
Our approachBTC - USDLSTM0.0391031.340
  Bi-LSTM0.0361029.362
  GRU0.0571274.171
Our approachETH -USDLSTM0.297148.522
  Bi-LSTM0.12483.953
  GRU0.14898.314
Our approachLTC-USDLSTM0.0649.668
  Bi-LSTM0.0418.025
  GRU0.0468.122
Disclaimer/Publisher’s Note: The statements, opinions and data contained in all publications are solely those of the individual author(s) and contributor(s) and not of MDPI and/or the editor(s). MDPI and/or the editor(s) disclaim responsibility for any injury to people or property resulting from any ideas, methods, instructions or products referred to in the content.

