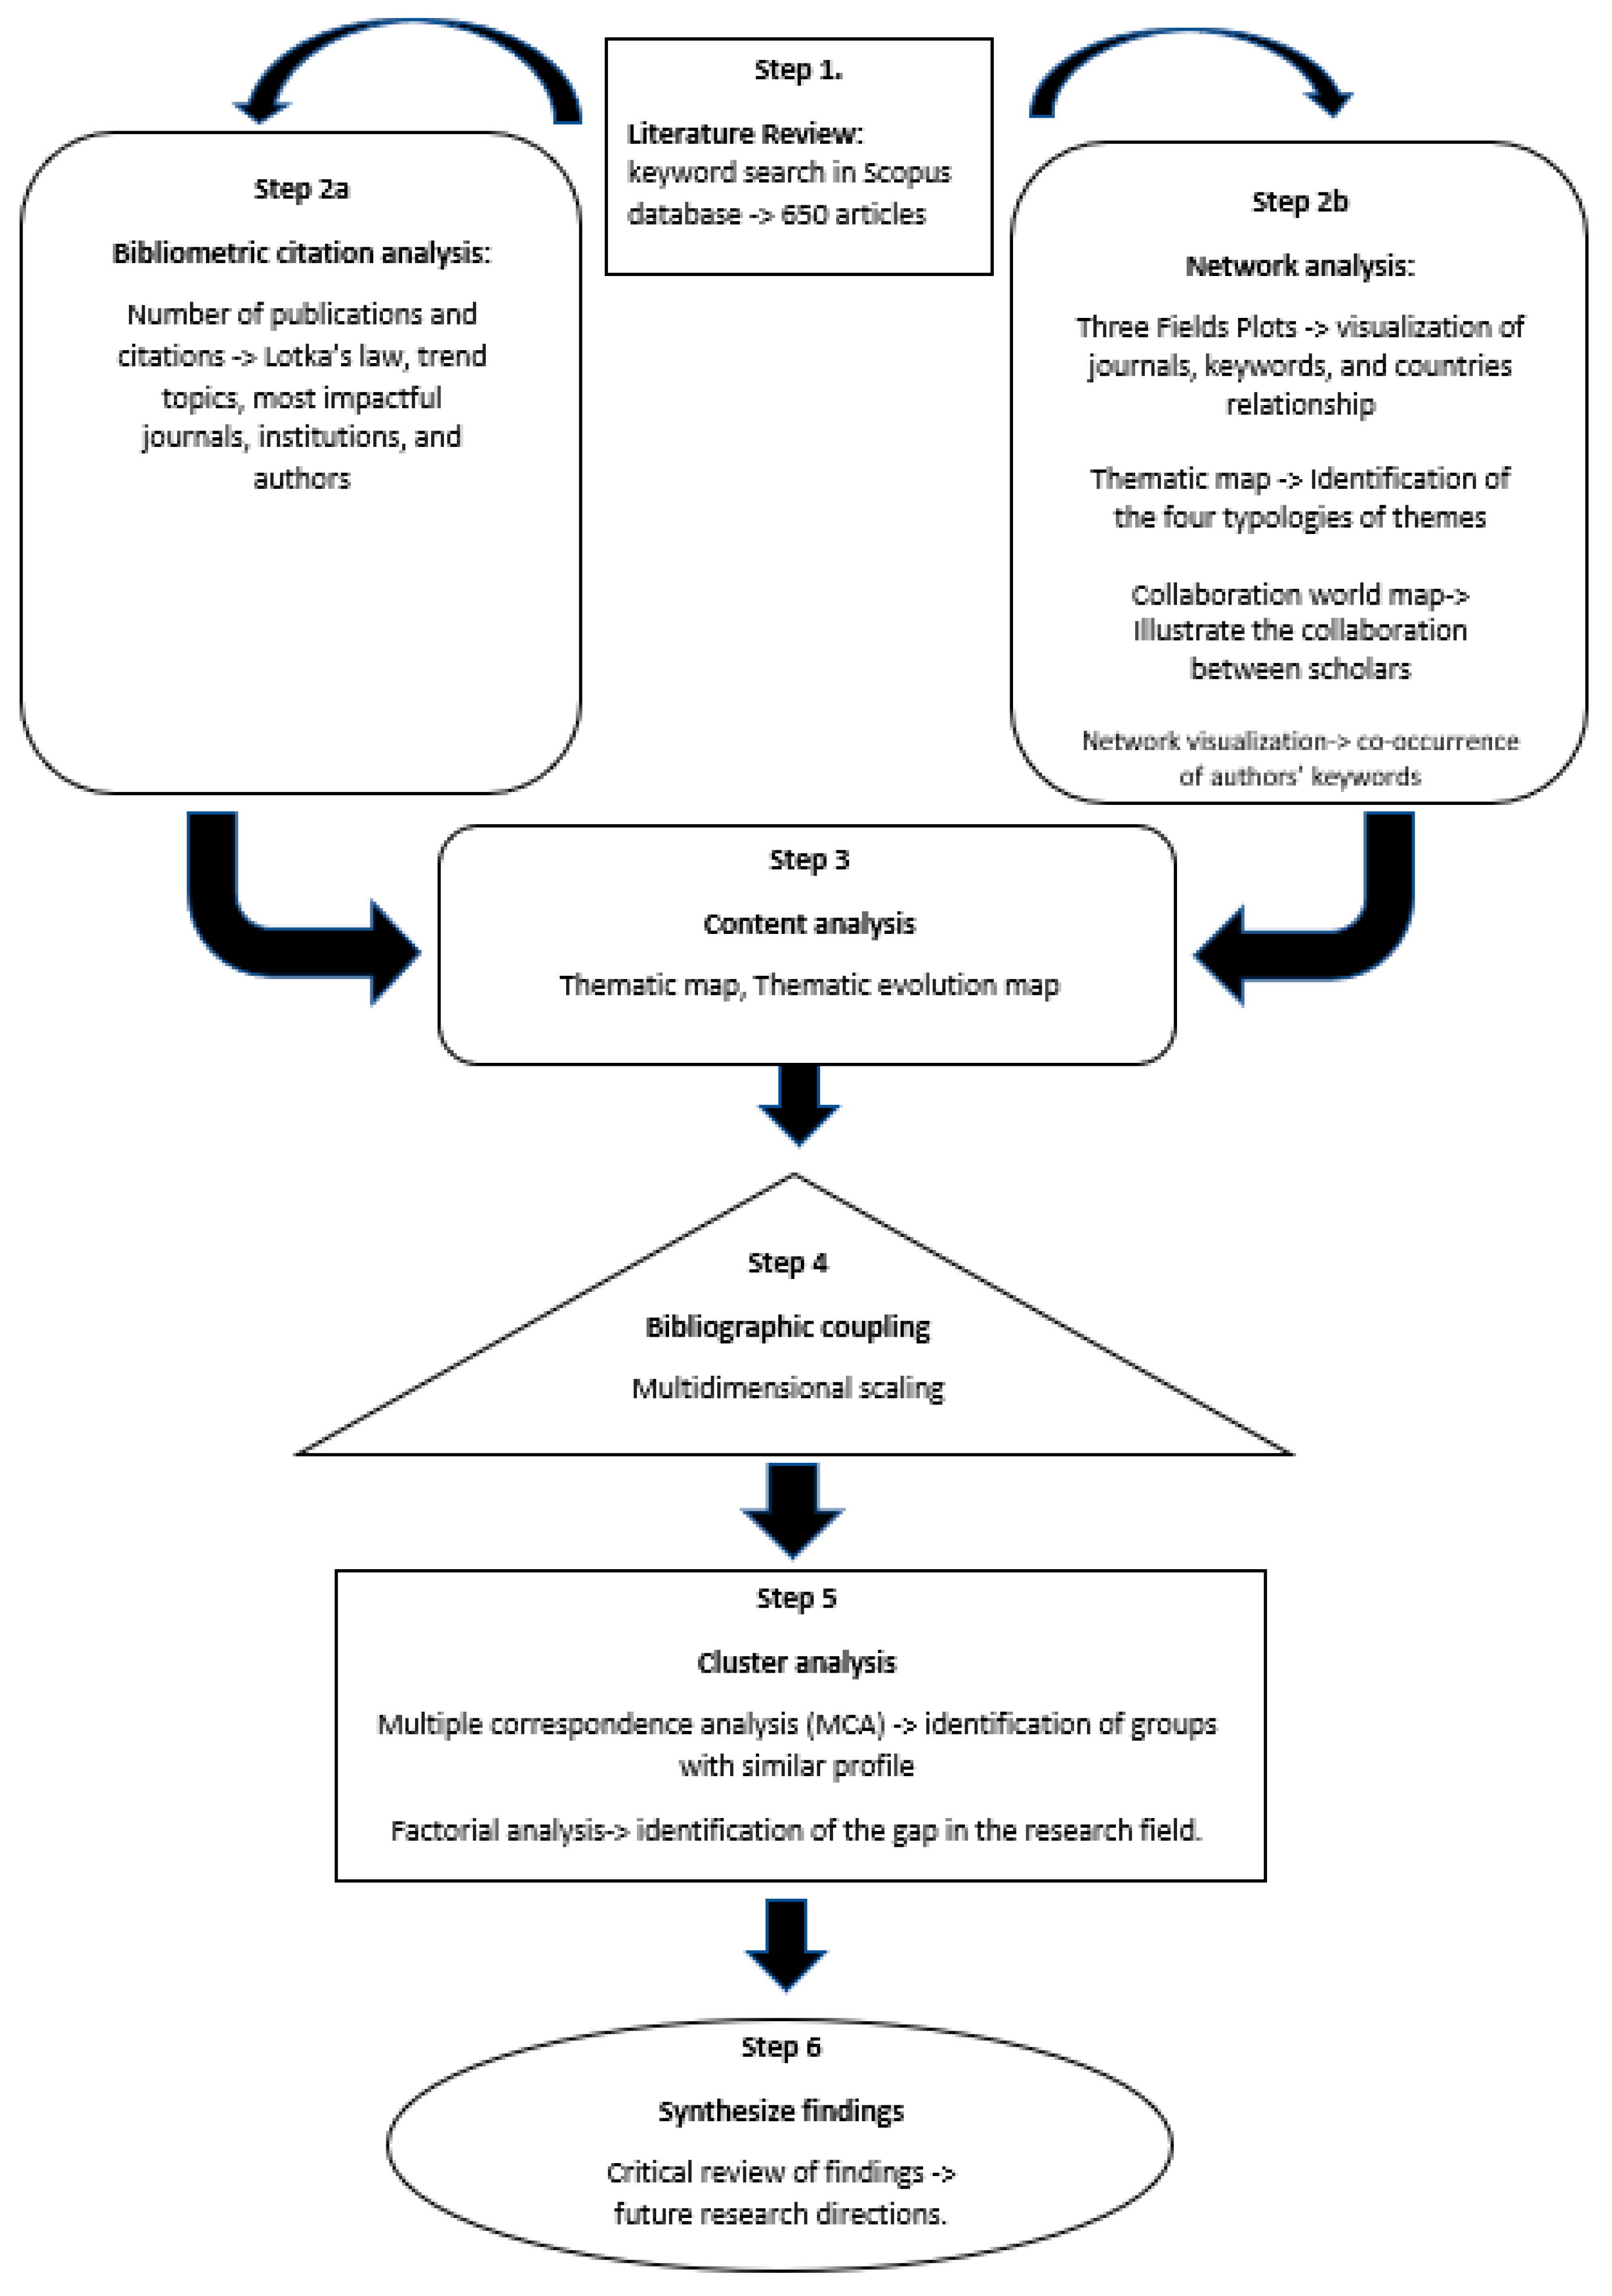
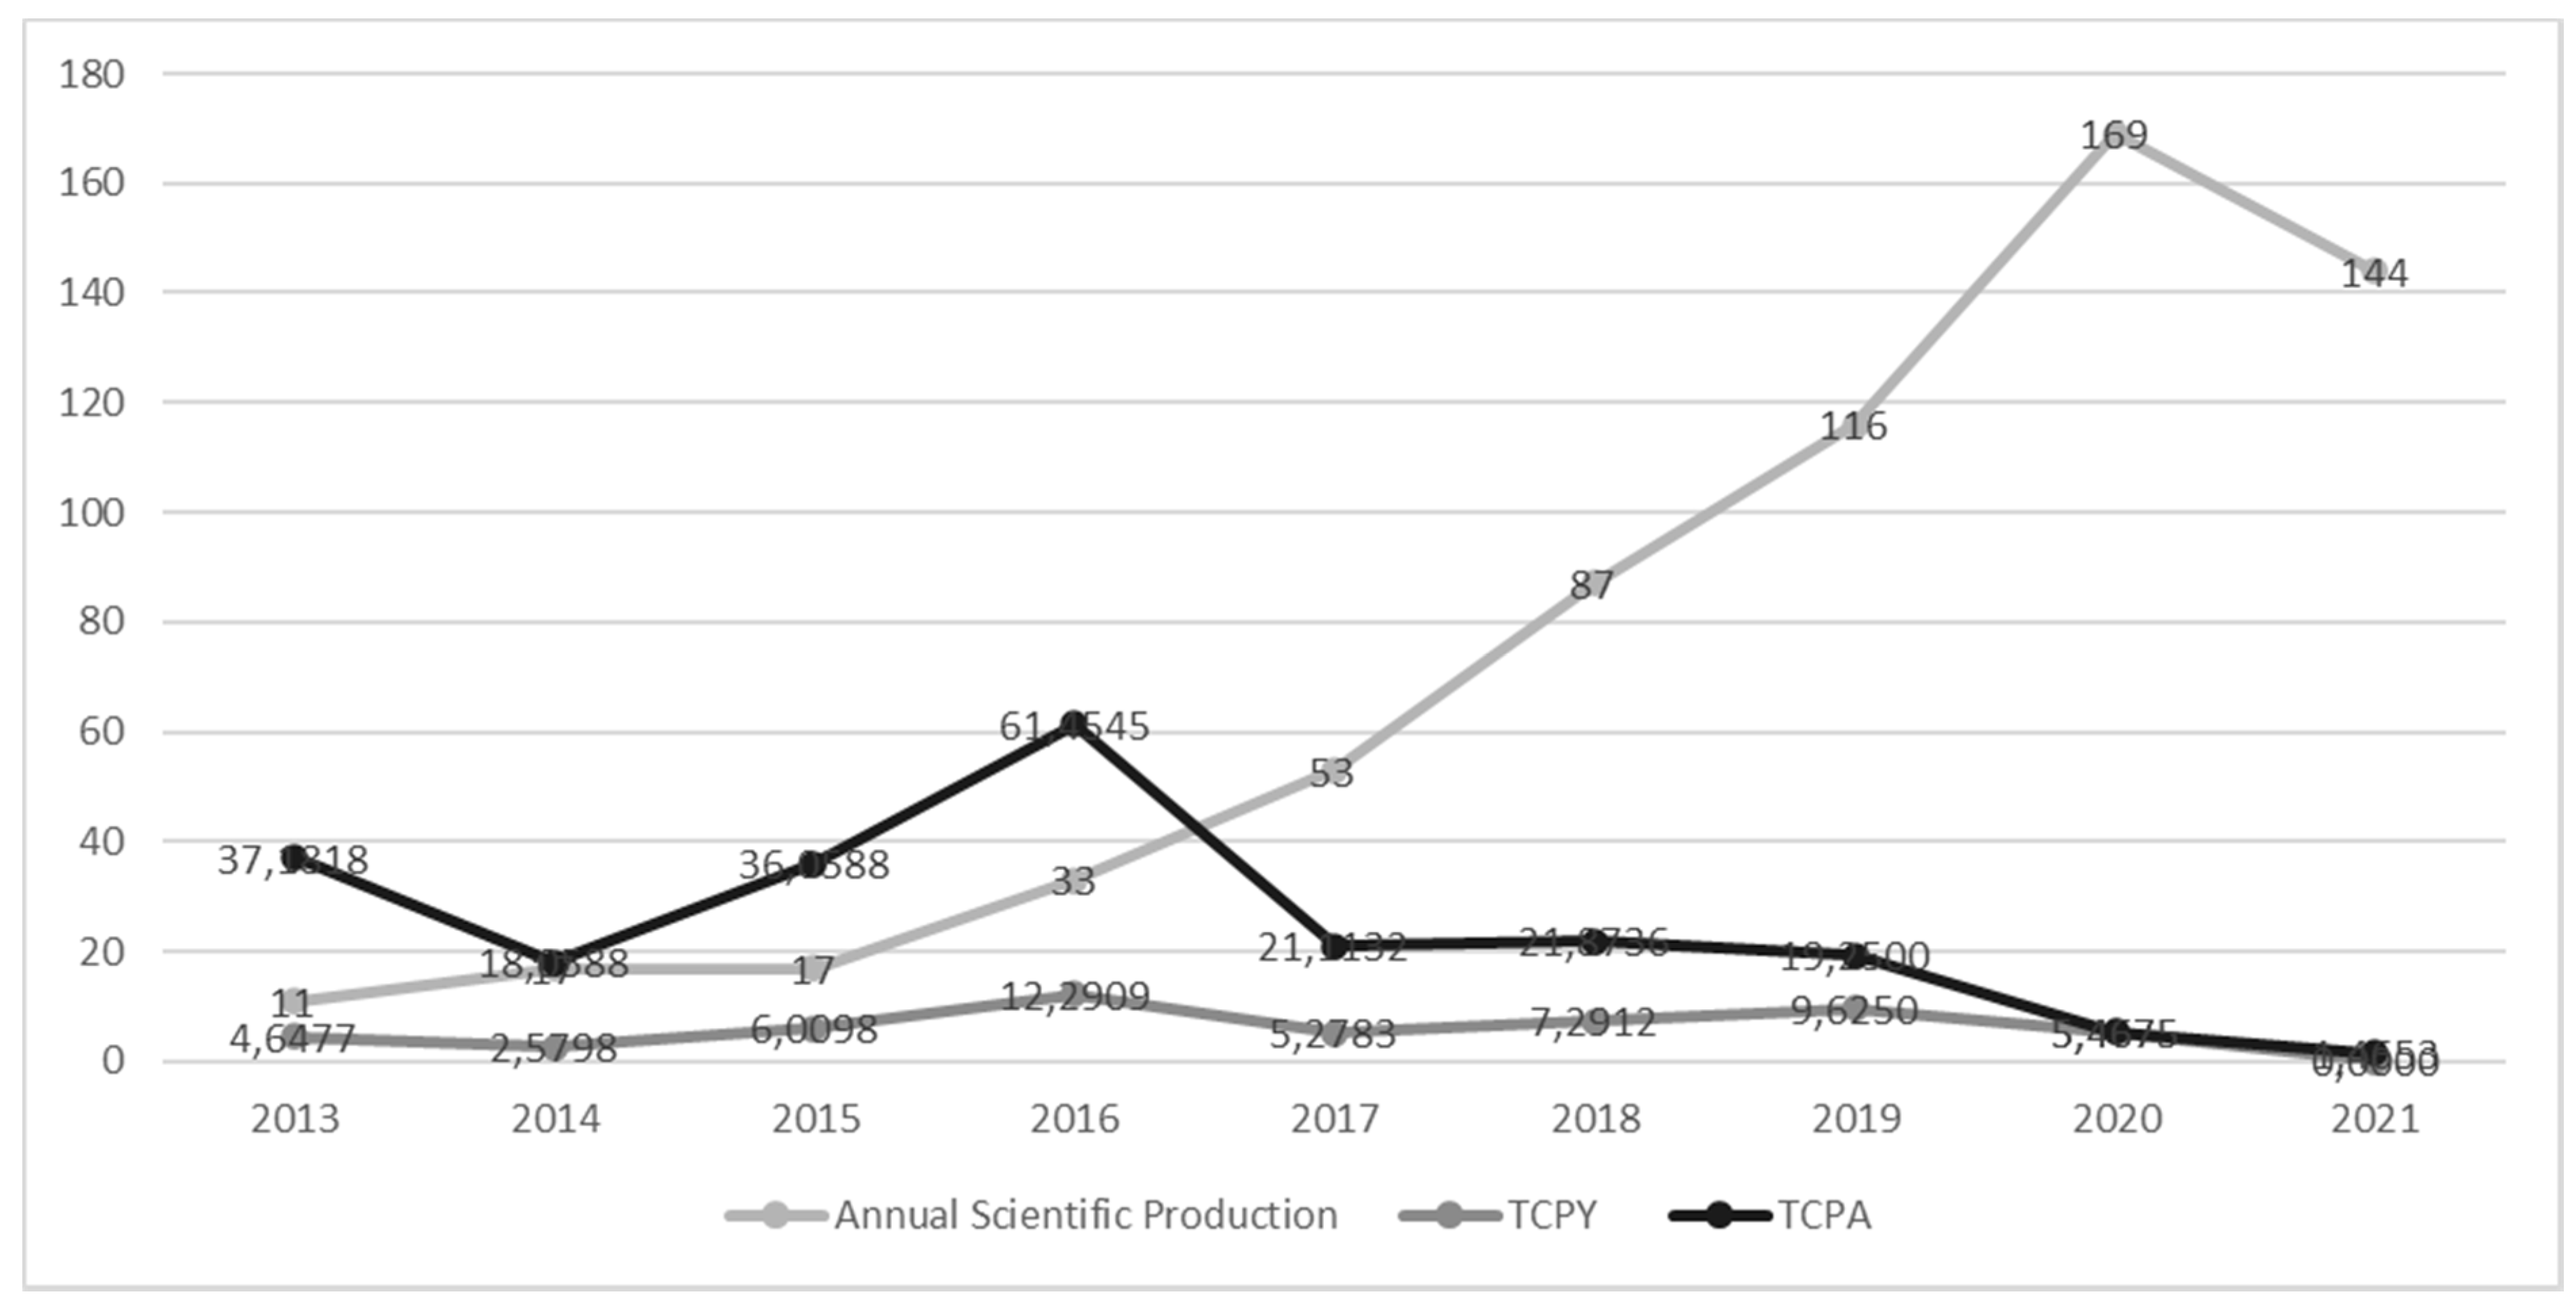
This research aims to review the transformation of information management through big data analytics, which helps businesses improve their operational efficiency and decision-making processes globally. The reviewed sample includes 650 related studies that were published in the period 2013–2022. These documents were written by 1977 authors, with an average of 4.027 citations per document. Most of the authors (96.6% of the total sum) are part of multi-authored studies (1910 authors), while only 3.4% are single-authored studies (67 authors).
4.3. Most Influential Journals, Institutions, Authors, and Documents
For the period of 2013 to 2022,
Table 3 lists the journals that have published the most papers on big data analytics and information management that have a positive impact on operational effectiveness and corporate decision-making. The corpus of knowledge on information management and big data analytics has been significantly impacted by “Sustainability,” which is in the frontier journal with the most papers published in the study subject (68) throughout the research timespan 2013–2022. The journal “Benchmarking” came in third with 50 articles, while the “International Journal of Production Economics” came in second with 56 published papers. There were 42 articles in the “Production Planning and Control” journal. The list of the top five research-related journals was completed by the “International Journal of Supply Chain Management”. Additionally, Scopus, Sci-mago, and ABS list have indexed a large number of the most widely read journals in information management and big data analytics.
Table 4 lists the most significant companies that disseminate research on information management and big data analytics to help enterprises operate more effectively and make better decisions. The top five universities, which account for the majority of research-related publications, have offices in various locations. The Politecnico Di Milano in Milan, Italy, is the institution that has published the most (20 papers) in the subject of research. The Hong Kong Polytechnic University is in third place with eighteen published papers, followed by the Najran University in fourth place with thirteen articles, and the Universiti Kebangsaan Malaysia in fifth place with five publications. The Universiti Kebangsaan Malaysia ranks in second place overall (eleven articles). The fact that technical colleges make up the majority of the institutions illustrates the significant impact that new technologies, such as big data analytics, have made to information management.
Examination of the most prominent writers can help shape the research domain after the bibliometric analysis [
42].
Table 5 illustrates the authors with the highest impact in the research community of the studied field, while the metric of the articles fractionalized of the individual authors has been integrated and presents the fraction of their co-authored publications. According to
Table 5, Dwivedi Yk is recognized as the most related author in the research domain, and Akter S. is ranked in second position in the list of the most relevant authors of the studied field.
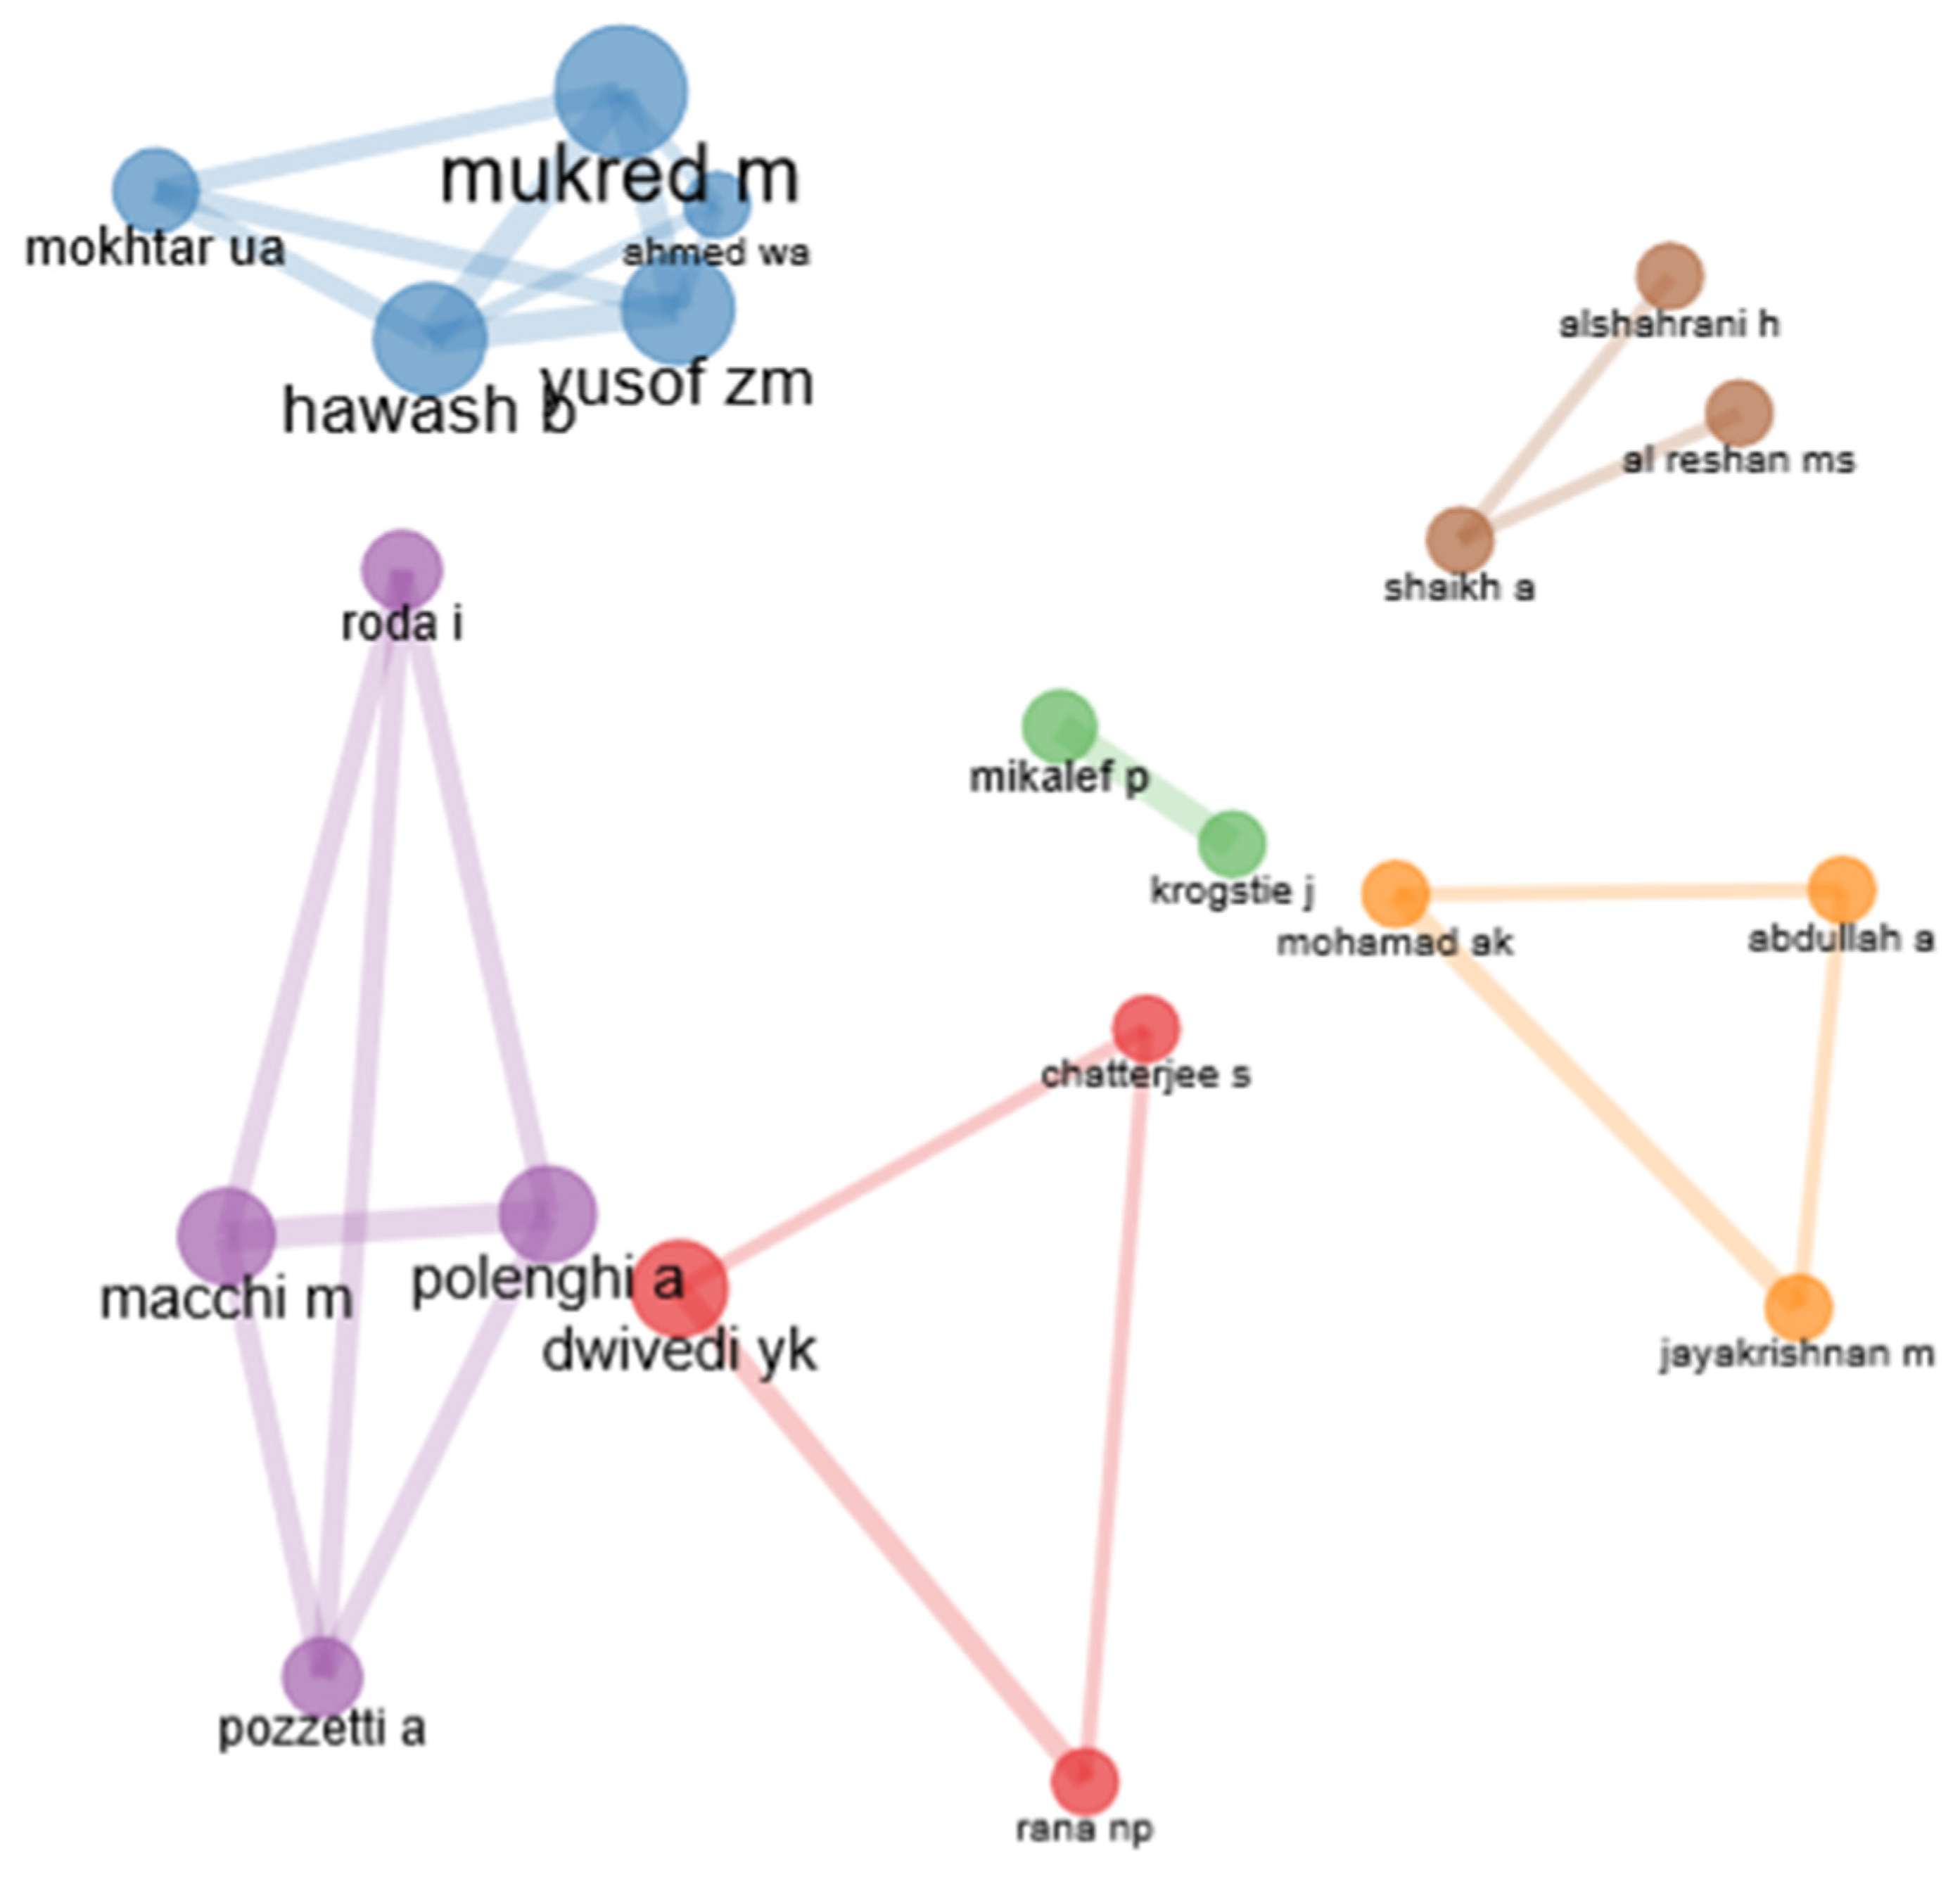
Figure 5 represents the authors’ collaboration network. Each node highlights an author, and the edges indicate the co-authorship relation between them [
43]. The blue cluster can be characterized as the most impactful and essential collaboration network between authors. The purple cluster consists of four authors’ networks, while the red, orange, and brown clusters consist of three authors’ networks. Moreover, the green cluster indicates the weakest collaboration network, as it consists only of two authors’ networks. It is noteworthy that neither of the clusters are linked, so there is enough space for improving the overall author collaboration within the information management and big data analytics field.
Finally, the most influential academic papers in the fields of big data analytics and information management are presented in
Table 6. The table below contains published scientific publications that were based on both qualitative and quantitative analyses. Additionally, some of them have investigated how big data analytics can help businesses perform better, as described in the paper “Big data analytics and firm performance: Findings from a mixed-method approach”, which draws on complexity theory to look into the resource configurations and environmental variables that contribute to performance gains from big data analytics investments. However, neither paper has discussed how big data analytics might help manage information or enhance the decision-making process.
4.4. Network, Content, Bibliographic Coupling, and Cluster Analysis
Visualizing the linkage between authors, countries, and research topics can offer interesting insights into the scientific community [
43,
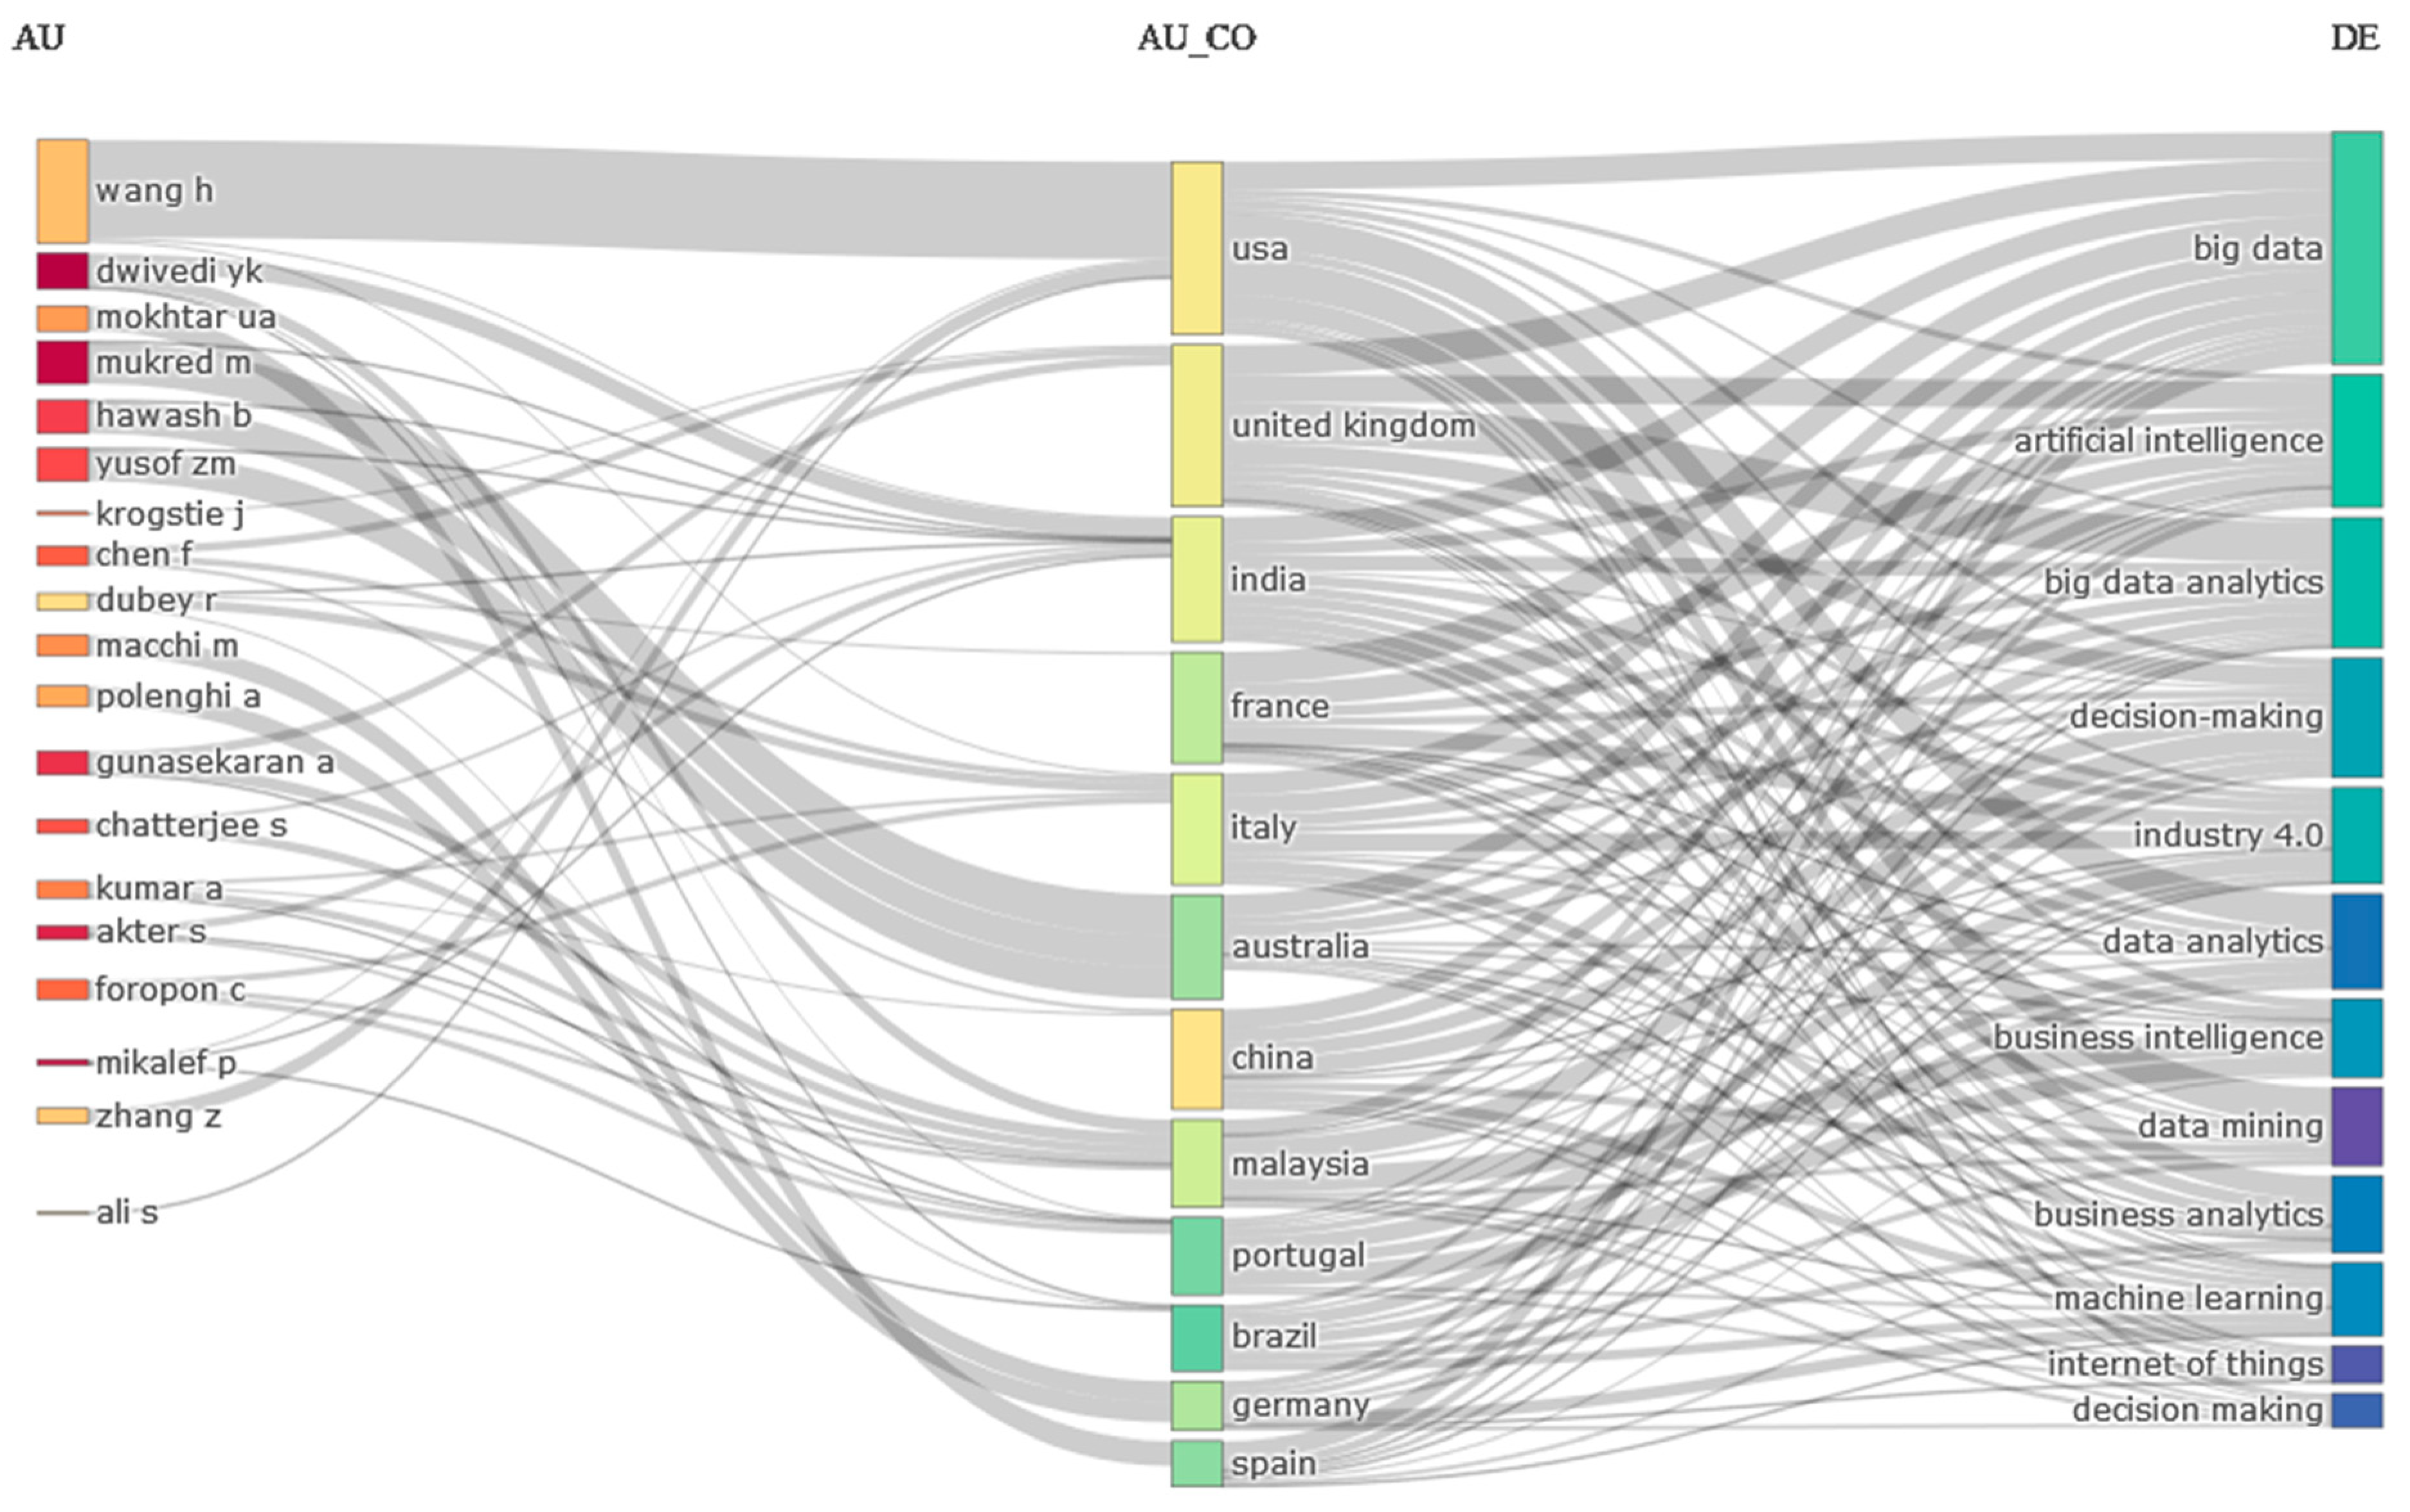
64]. Thus,
Figure 4 presents the innovative three-field plot, which presents the interchange among the most related authors (left), countries (middle), and keywords (right) within the research domain of information management and big data analytics. Results show that American, British, and Indian scholars mostly author studies on big data analytics. However, emerging technologies such as artificial intelligence (AI) and machine learning (ML) seem to be integrated into the information management search domain.
Figure 6 presents Italian and Chinese scholars with the most publications in AI and ML. Generally, the USA, UK, and India have excellence in big data analytics, Italy in ML, and China in AI.
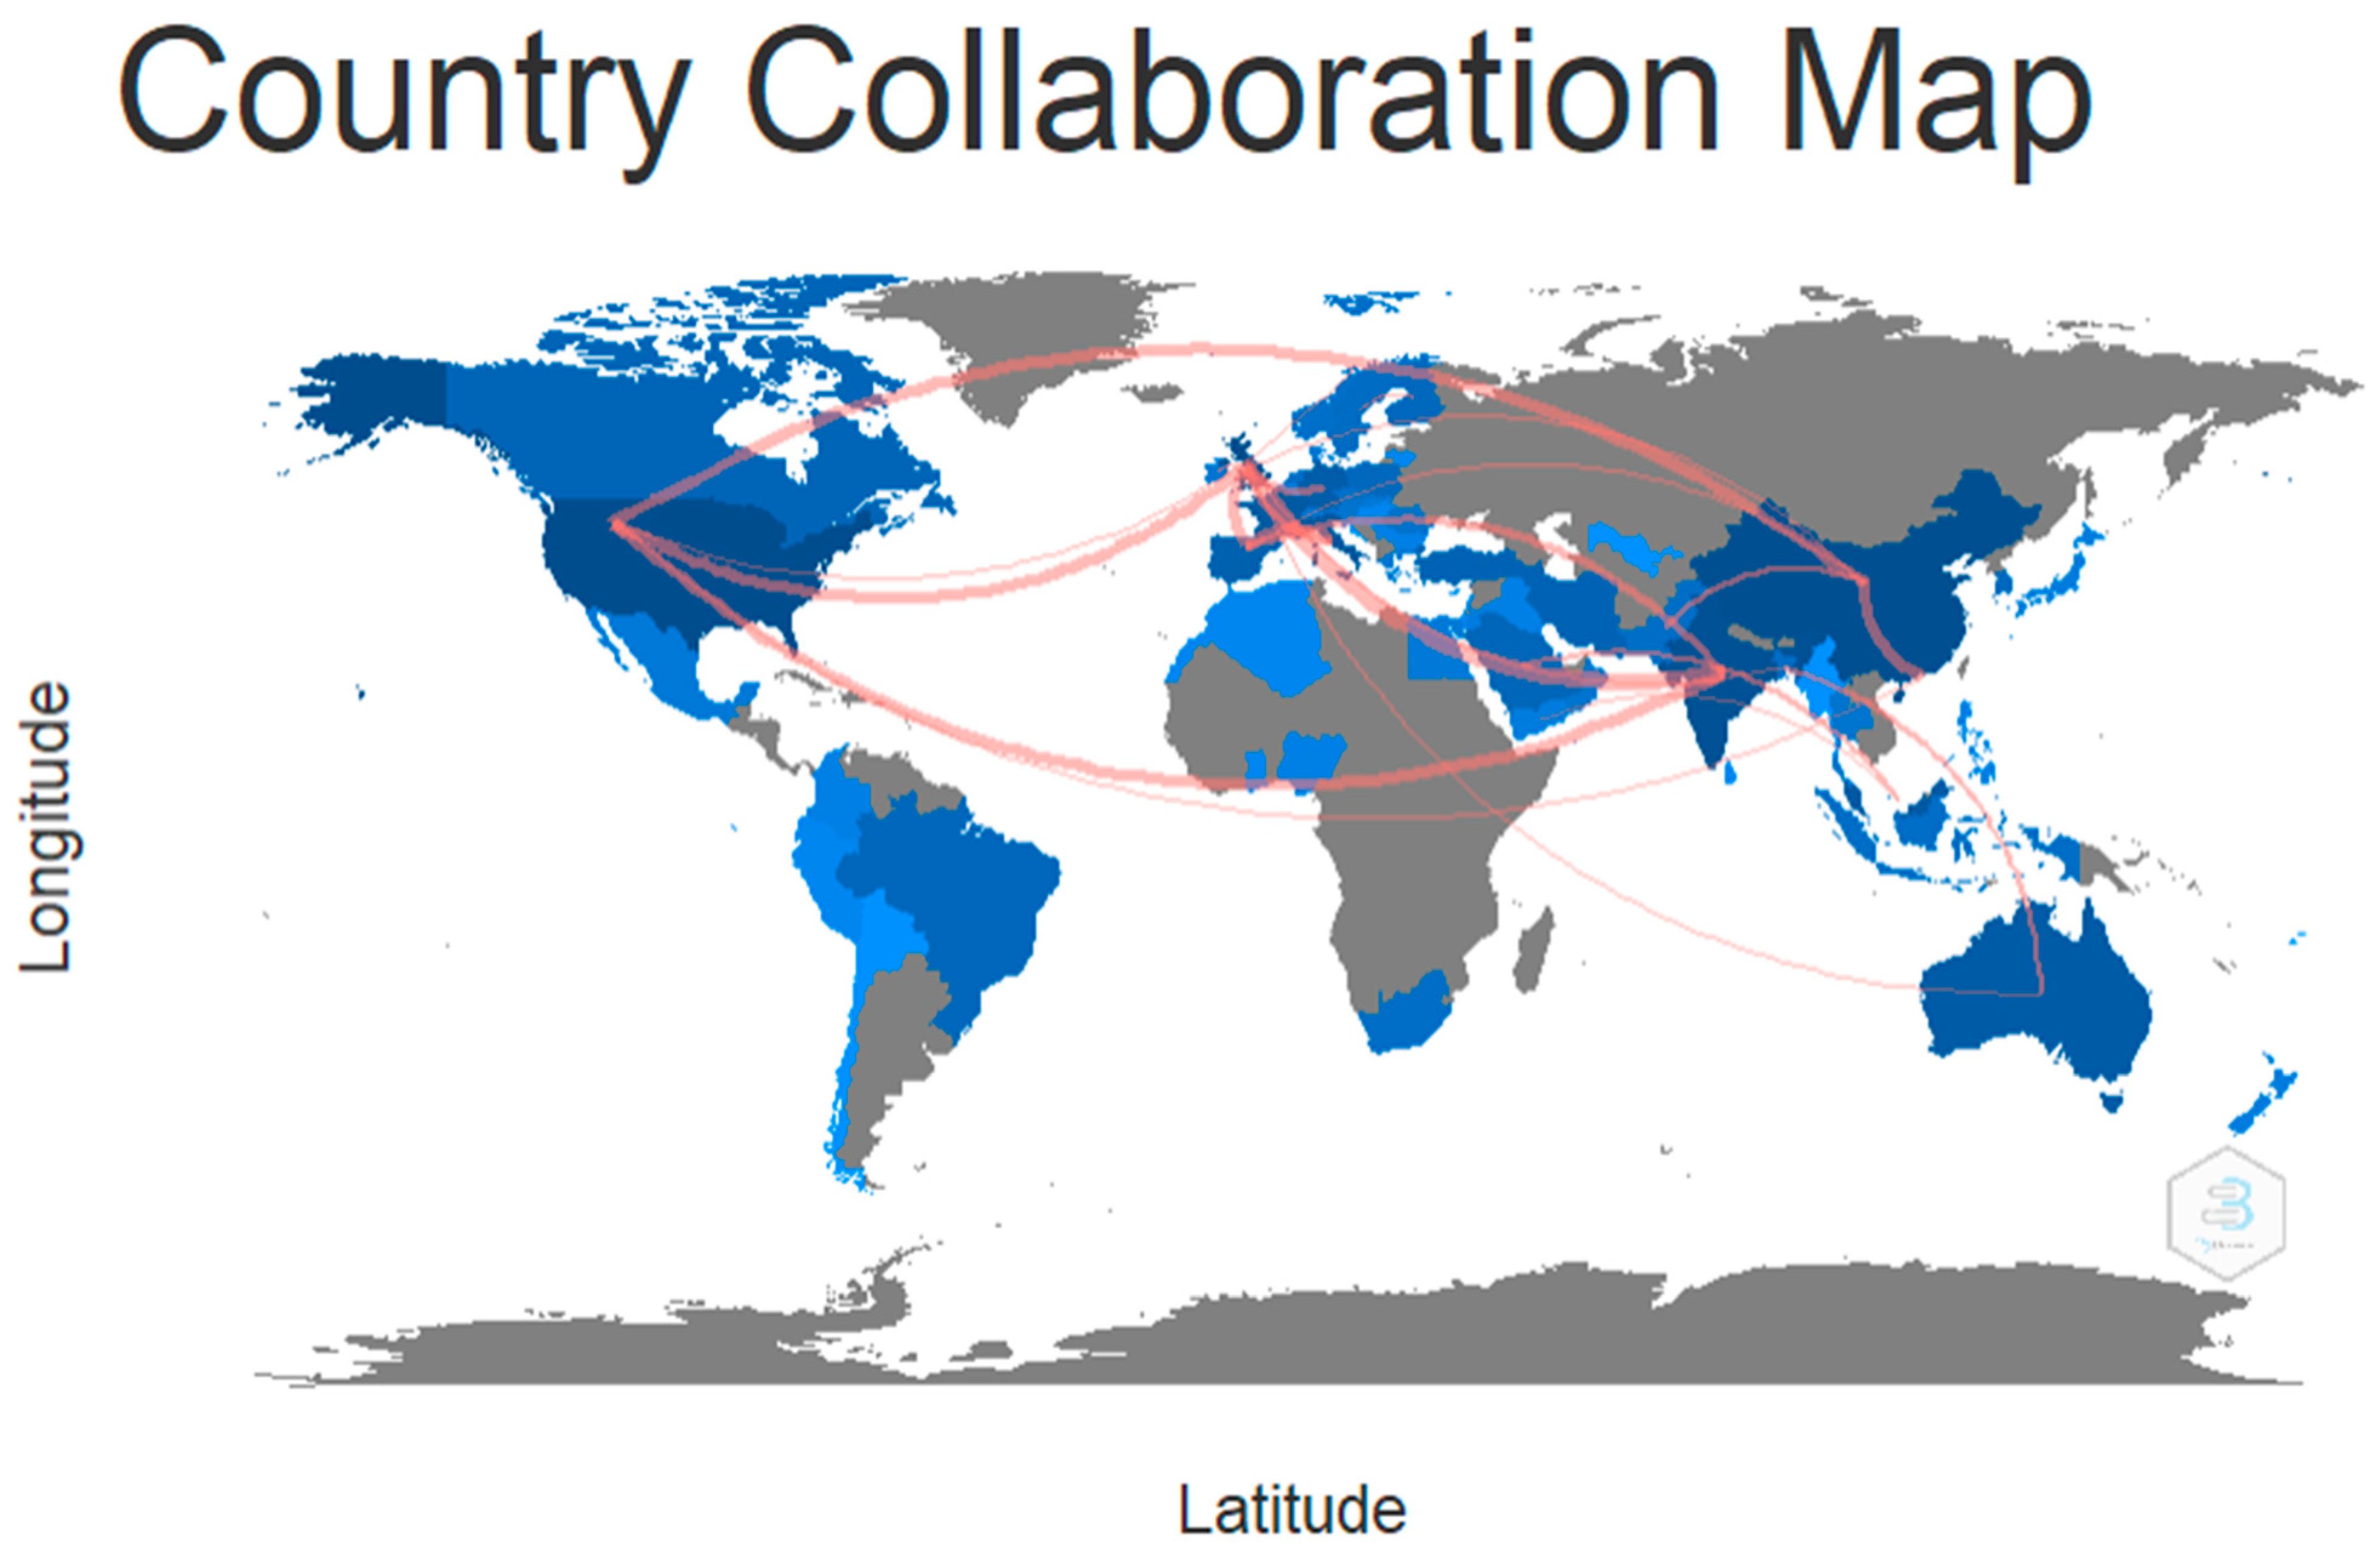
Moreover,
Figure 7 presents the geographical collaboration of the authors in the research domain of information management and big data analytics [
37]. The visualization of this scientific collaboration was actualized using the tool Bibliometrix, denoted as Biblioshiny. This geographical collaboration analysis aims to highlight the social structure of the research community in the studied field. The nodes in the graph represent the authors, while links represent their co-authorship. The map shows that the USA is the origin of most of the scientific collaborations in the field. The most robust scientific channel is between USA—China and USA—India. Additionally, American scholars have developed a strong scientific collaboration with the Europeans. Specifically, the British and Italians are linked with the Americans, as well as with the Indian and Chinese scholars in the subject area of information management and big data analytics with a view on the contribution of operational performance and decision-making process. Furthermore, the collaboration map between the scholars confirms the findings of the three-fields plot and bibliographic coupling based on countries (
Figure 8).
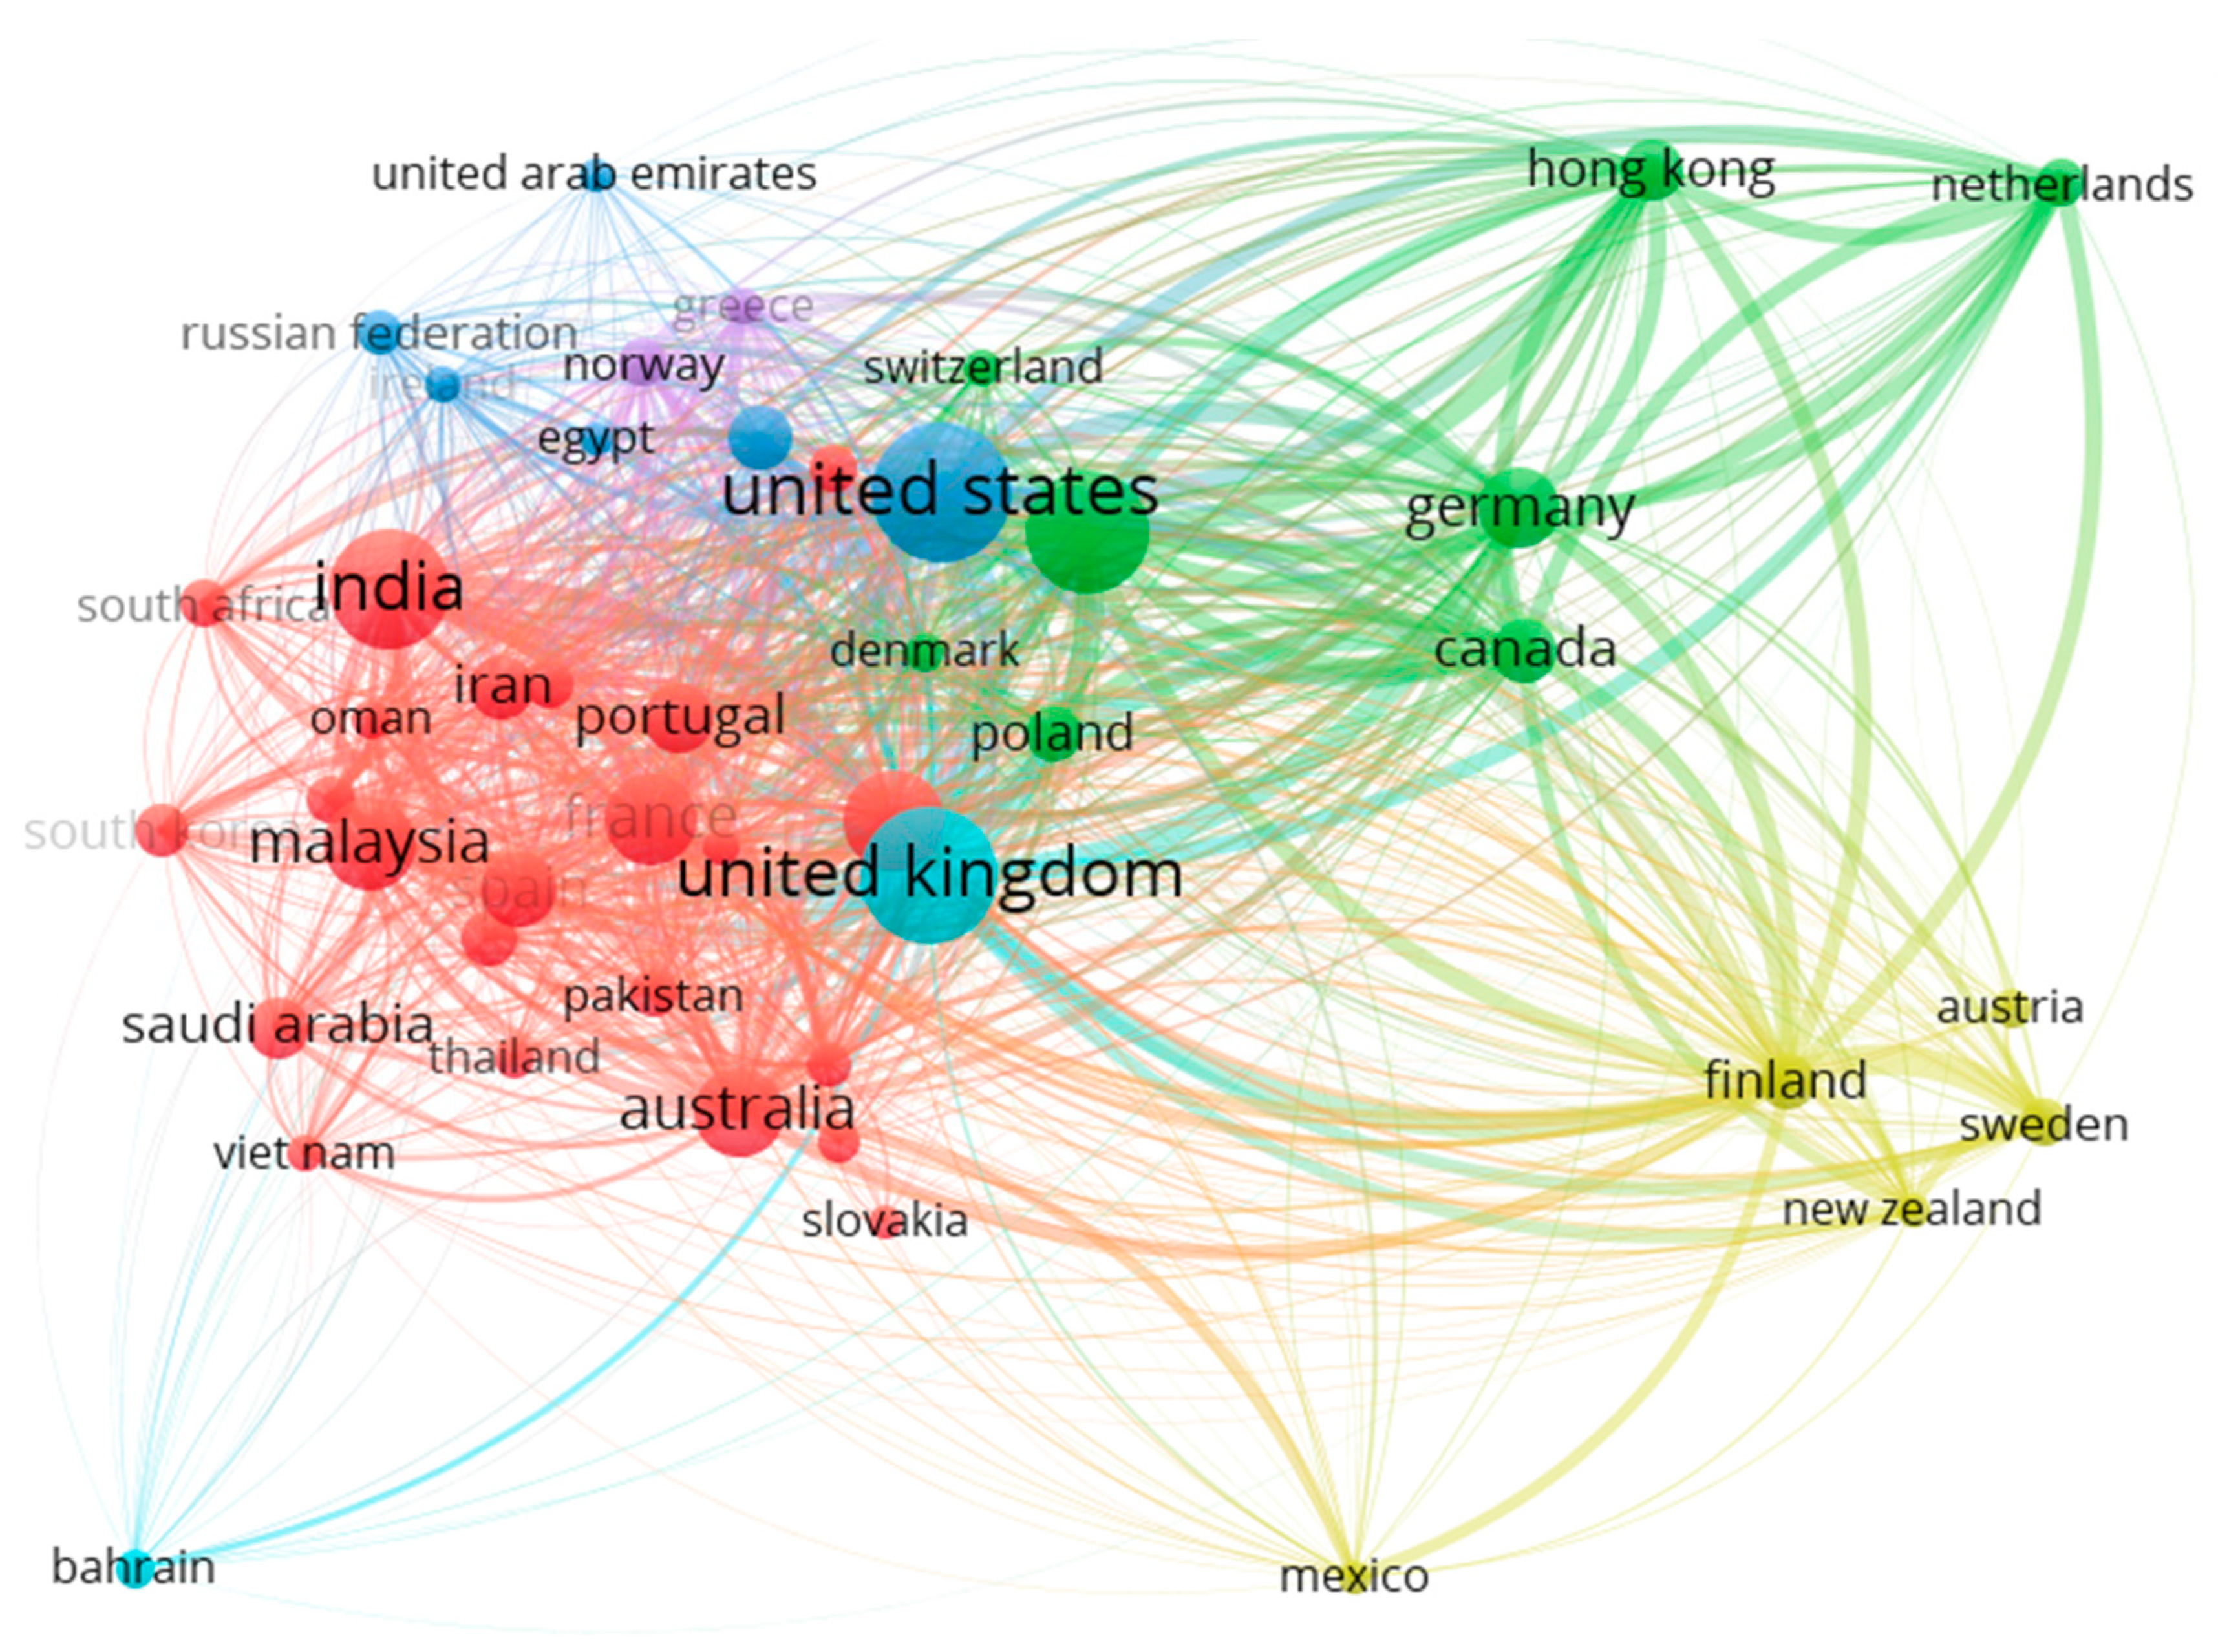
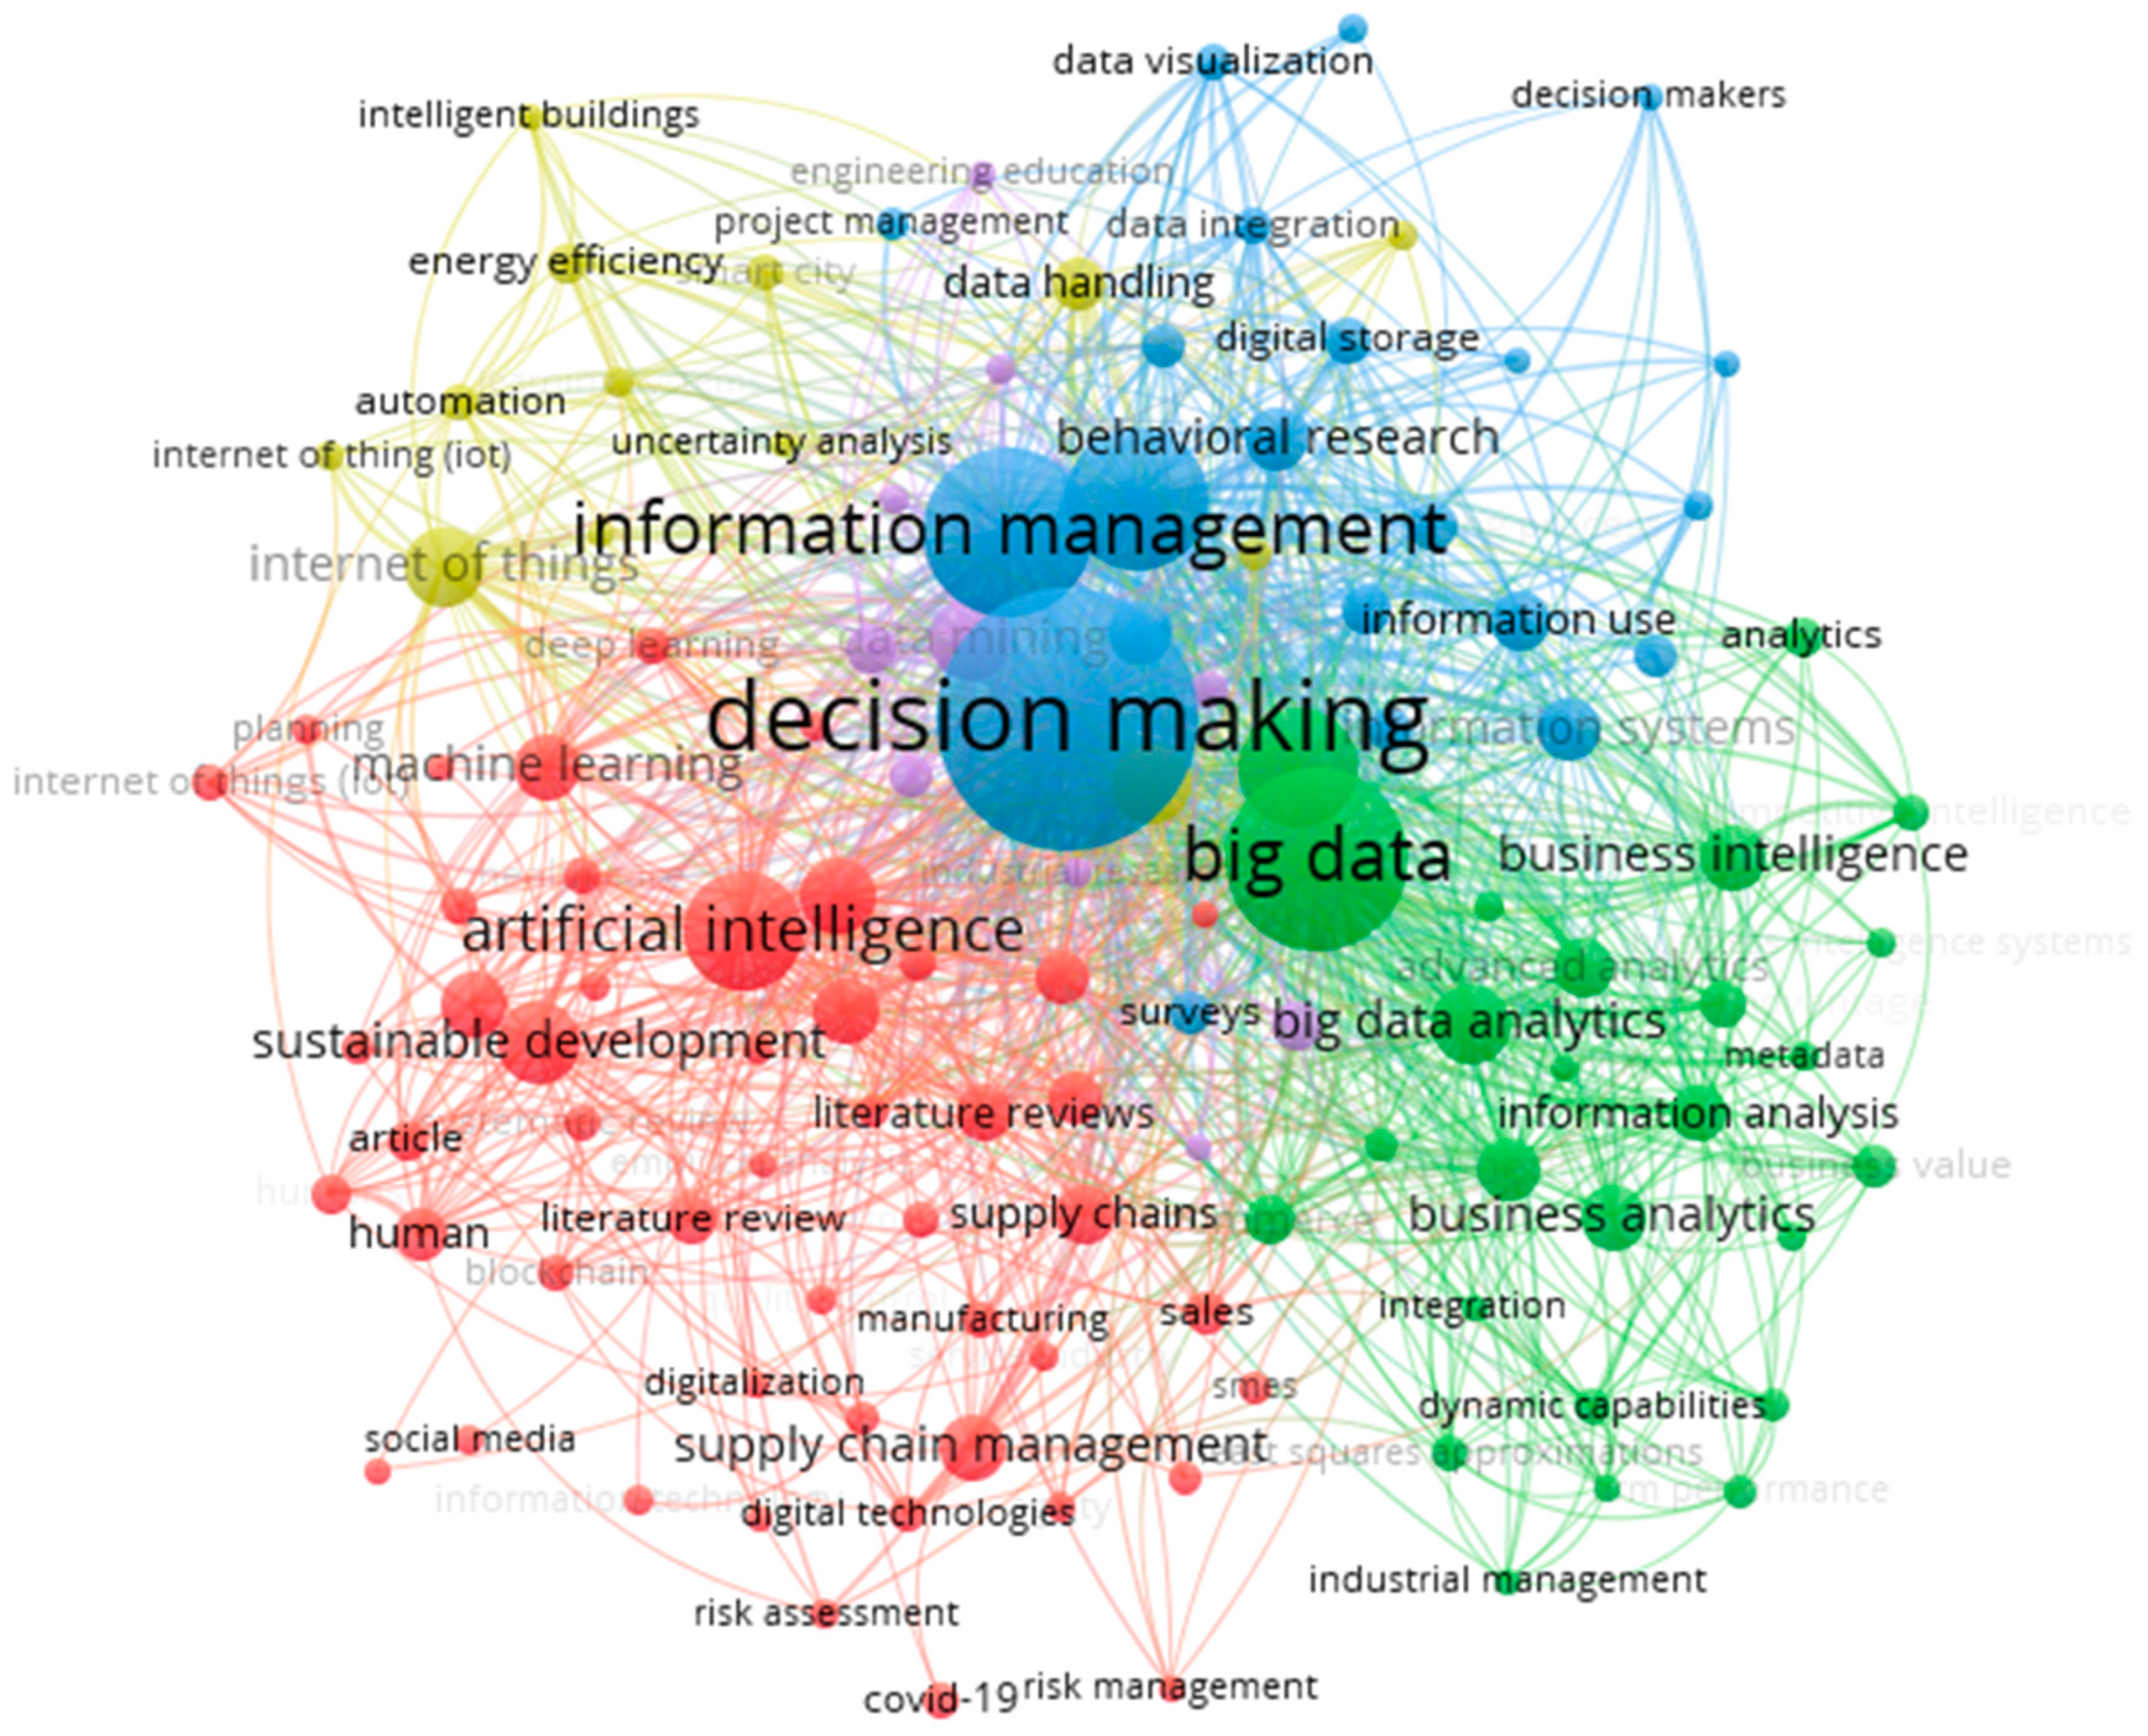
Keyword analysis, which is a component of network analysis, is a useful technique that offers insightful information. The goal of a keyword analysis is to draw attention to the distinction and important trends within a study topic. Based on the co-occurrence of the writers’ keywords,
Figure 9 shows a network visualization. The VOSviewer program was employed to show the co-occurrence of the writers’ key terms. VOSviewer is software that aids in the development of a bibliometric network and the display of the data inside it. Each circle in the graph represents an instance. The greater the co-occurrence of writers’ terms, the larger the circle size [
36,
65]. The circles of a similar color signify a cluster of keywords, and the lines connecting the circles illustrate a connection between the keywords. 120 keywords in total were chosen, and five clusters were created, each with a unique color. The blue cluster draws attention to the close connection between information management and decision-making. The significance of big data in the field of information management research is shown by the cluster in green.
In contrast, the yellow and red clusters draw attention to the new trends in the information management field, which are the Internet of Things and artificial intelligence, respectively. Additionally, the purple cluster emphasizes how closely information management and the decision-making process are related to the Knowledge-Based System (KBS). KBS is a type of artificial intelligence that aims to synthesize the expertise of human experts to aid in decision-making. The fact that these systems depend on human CEOs gives them the name “expert systems”.
Although big data analytics has a strong linkage to information management and improvement, the operational research and decision-making of an organization and bibliometric analysis of the studied field indicate new research paths in the domain [
66,
67].
Figure 8, which presents the thematic map of authors’ keywords, describes the above. This figure illustrates the research themes obtained from the conceptual structure of the documents included in the Bibliometrix analysis. The map is divided into four quadrants, and each quadrant represents a different research theme regarding the studied research topic. In addition, the clusters’ sizes highlight the proportion of the number of keywords. The thematic map uses two dimensions: density and centrality. The dimension of density illustrates the degree of the development of each theme, as measured by the internal linkages between the authors’ keywords. The second dimension, the centrality, stipulates the relevance of each theme, as measured by the external linkages between the authors’ keywords. Furthermore, the map presents four themes: (i) the motor themes, shown in the quadrant in the upper-right position and characterized by both high density and centrality, are the themes that are most developed in the literature, (ii) the basic themes, shown in the quadrant in the lower-right position and defined by high centrality but low density, are the themes that are not yet well developed, (iii) the niche themes, shown in the quadrant that is positioned in the upper-left of the map and characterized by high density and low centrality, are the themes that are well developed and very specialized but are marginal in the overall studied field, and (iv) the emerging themes, which are positioned in the bottom-left of the map and are characterized by low centrality and density [
68].
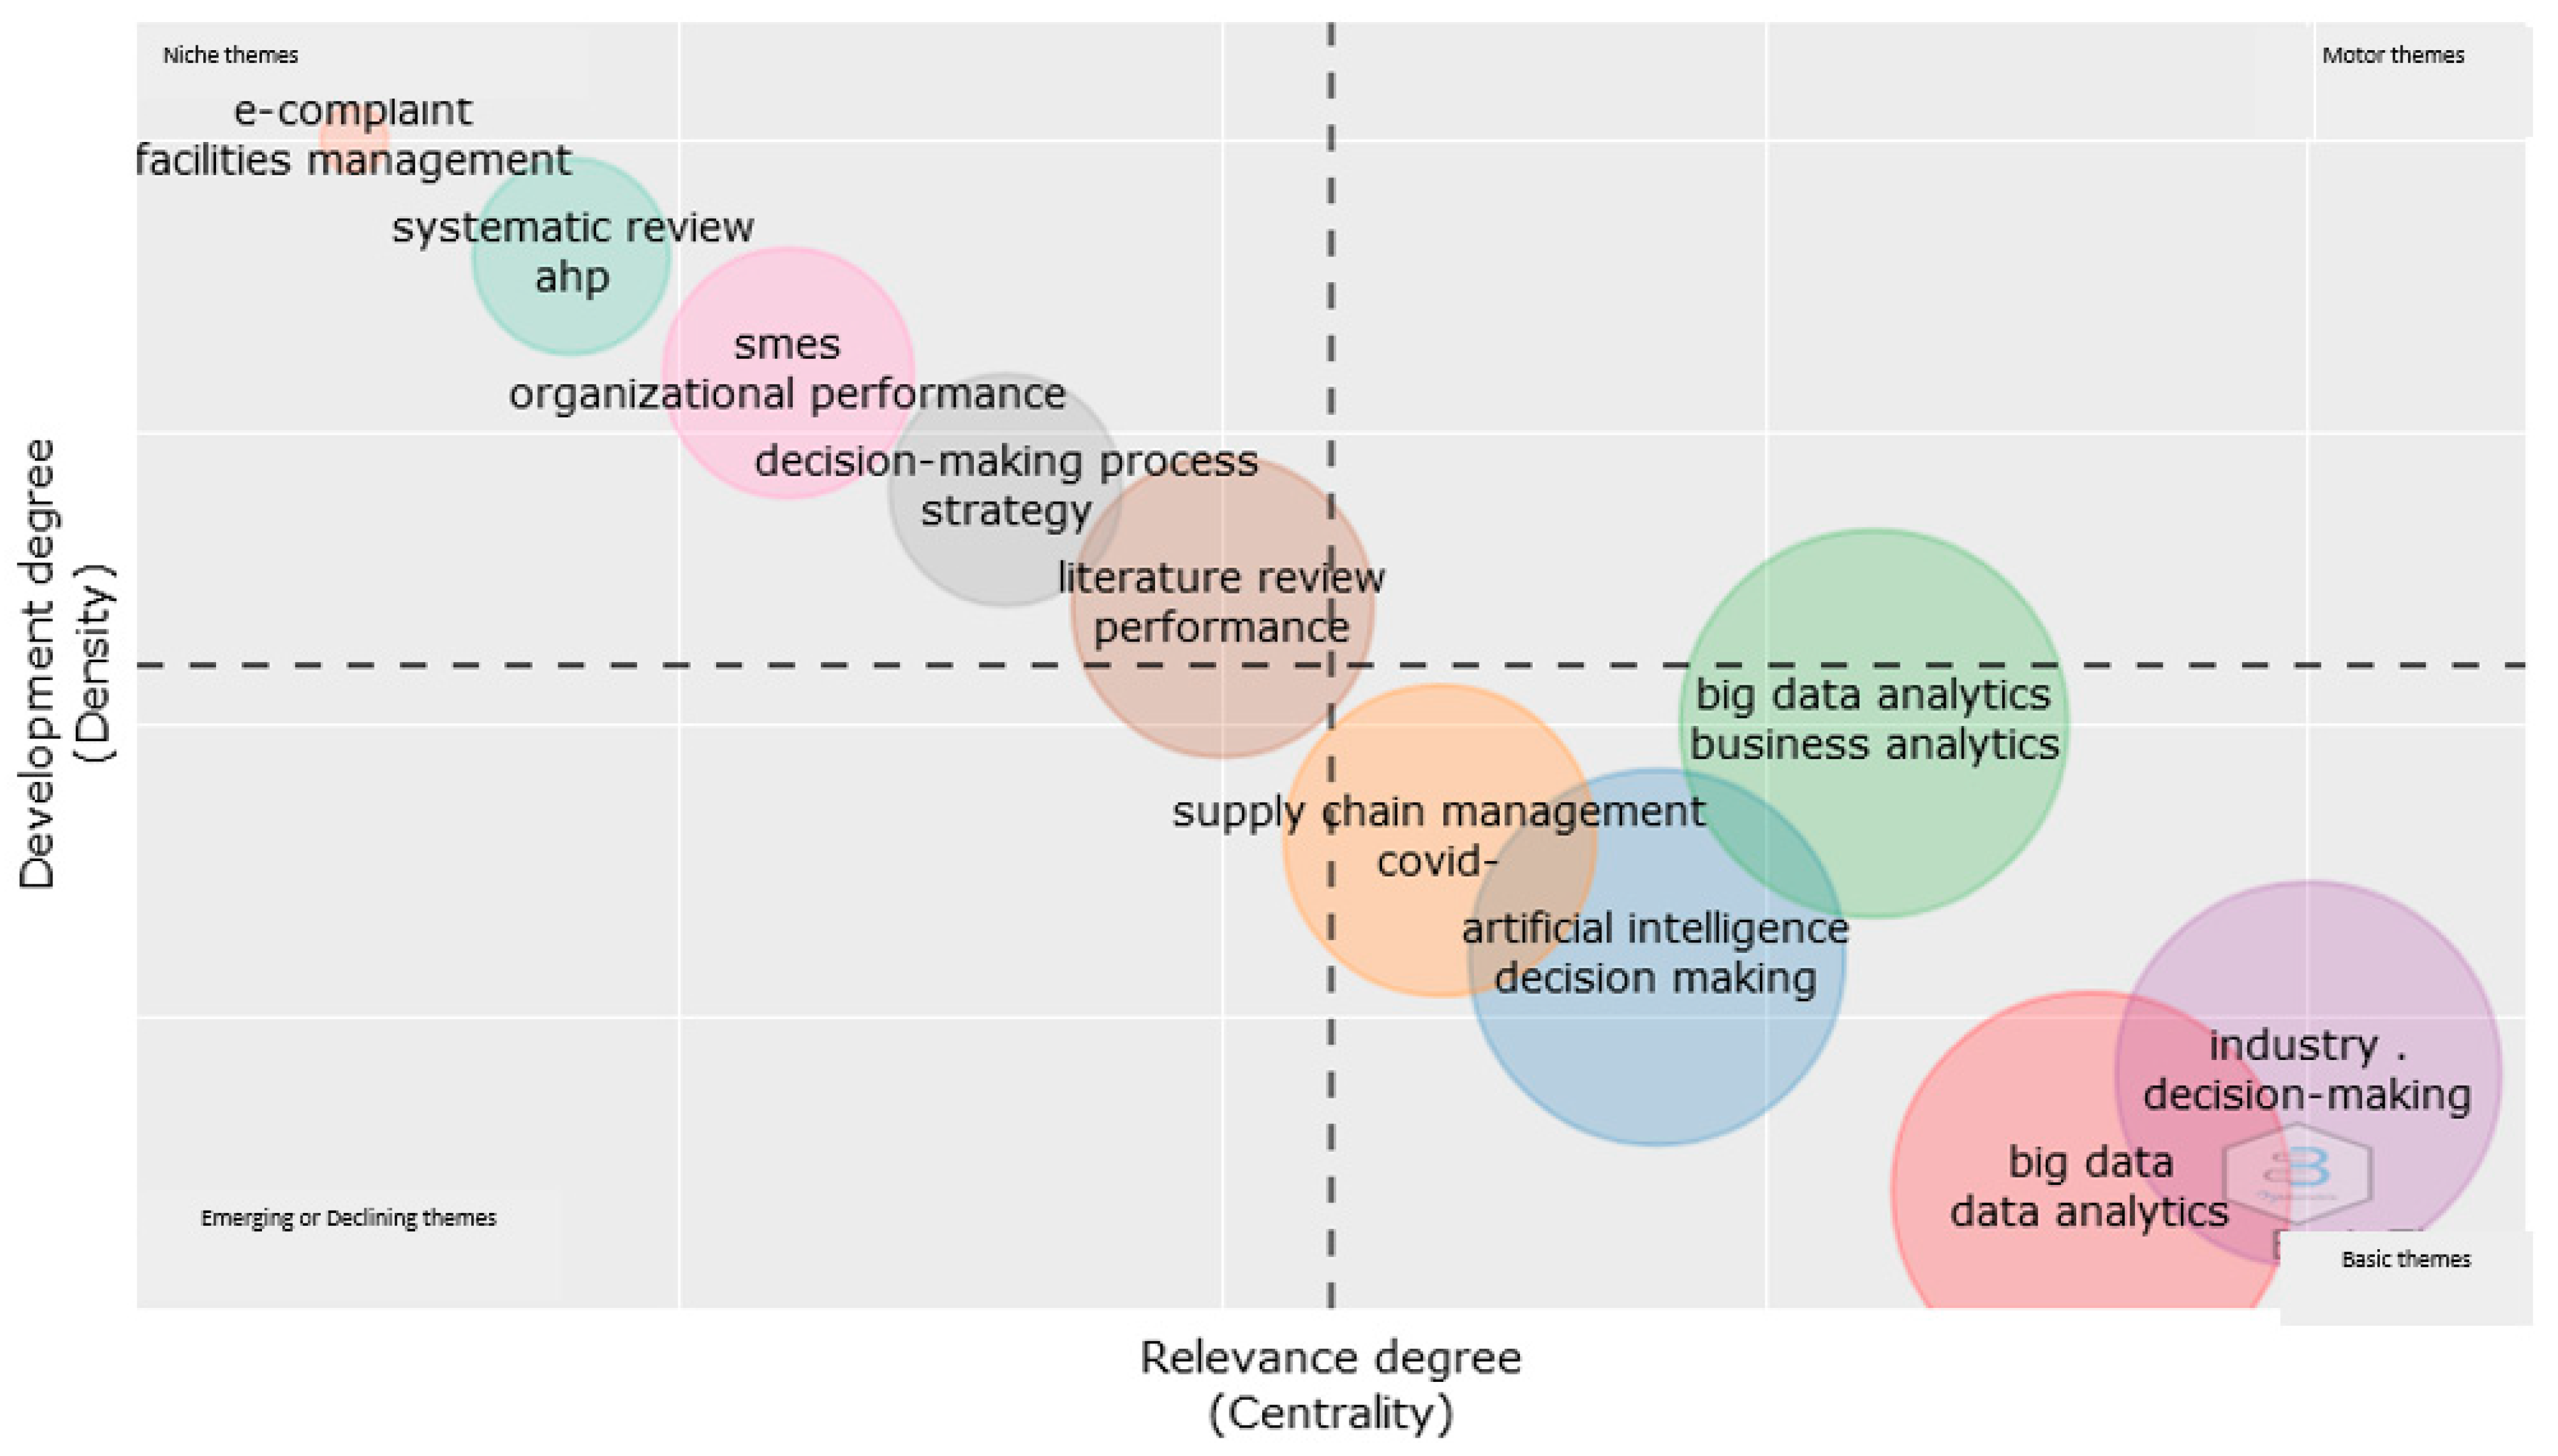
The basic themes of the thematic map presented in
Figure 10 indicate emerging technologies like big data analytics and artificial intelligence, which play a crucial role in the decision-making process of companies. However, uncertain factors, such as the COVID-19 pandemic, have enhanced the role of big data analytics. The COVID-19 pandemic has obliged many businesses to transform their operational systems by crossing to a new environment dominated by different procedures and rules. Moreover, the contribution of big data analytics in the management of e-business complaints is noteworthy, which helps an organization improve its operational efficiency and productivity. Consumer complaint behavior and management have been studied in different forms in the literature, but e-complaint business management has not been thoroughly studied. Following the role of the e-complaint and its importance for businesses, it is crucial to highlight the relationship between e-complaints, which are based on big data analytics, and SMEs. Gaining insights into client behavior that would not be attainable using conventional data analysis techniques is one of the main advantages of big data. Large data sets can be swiftly analyzed using big data technology, allowing for the discovery of trends and patterns that smaller data sets would not be able to reveal. SMEs may then utilize this knowledge to enhance their goods and services and better serve their clients. SMEs may also leverage big data to improve marketing campaigns, better target consumers, and provide customized customer experiences. The above can also be confirmed by the thematic map, as the e-complaint factor is dominated by the other niche themes.
Furthermore, to fully examine the research problem, we proceeded with the content analysis by developing a number of maps based on the usage of keywords plus terms. Based on the principles of Bibliometrix, keywords plus terms are categorized in the metadata that can help to perform content analysis [
69]. Keywords plus are generated automatically by the index keywords from the names of the referenced articles. In addition, keywords plus terms should be applied more than once and are sorted from multi-word phrases to single terms [
69,
70]. Additionally, these words enhance the retrieval of titles or keywords that are typically used. For the purpose of the current research thematic map, the thematic evolution and research trends maps have been developed based on the above word type.
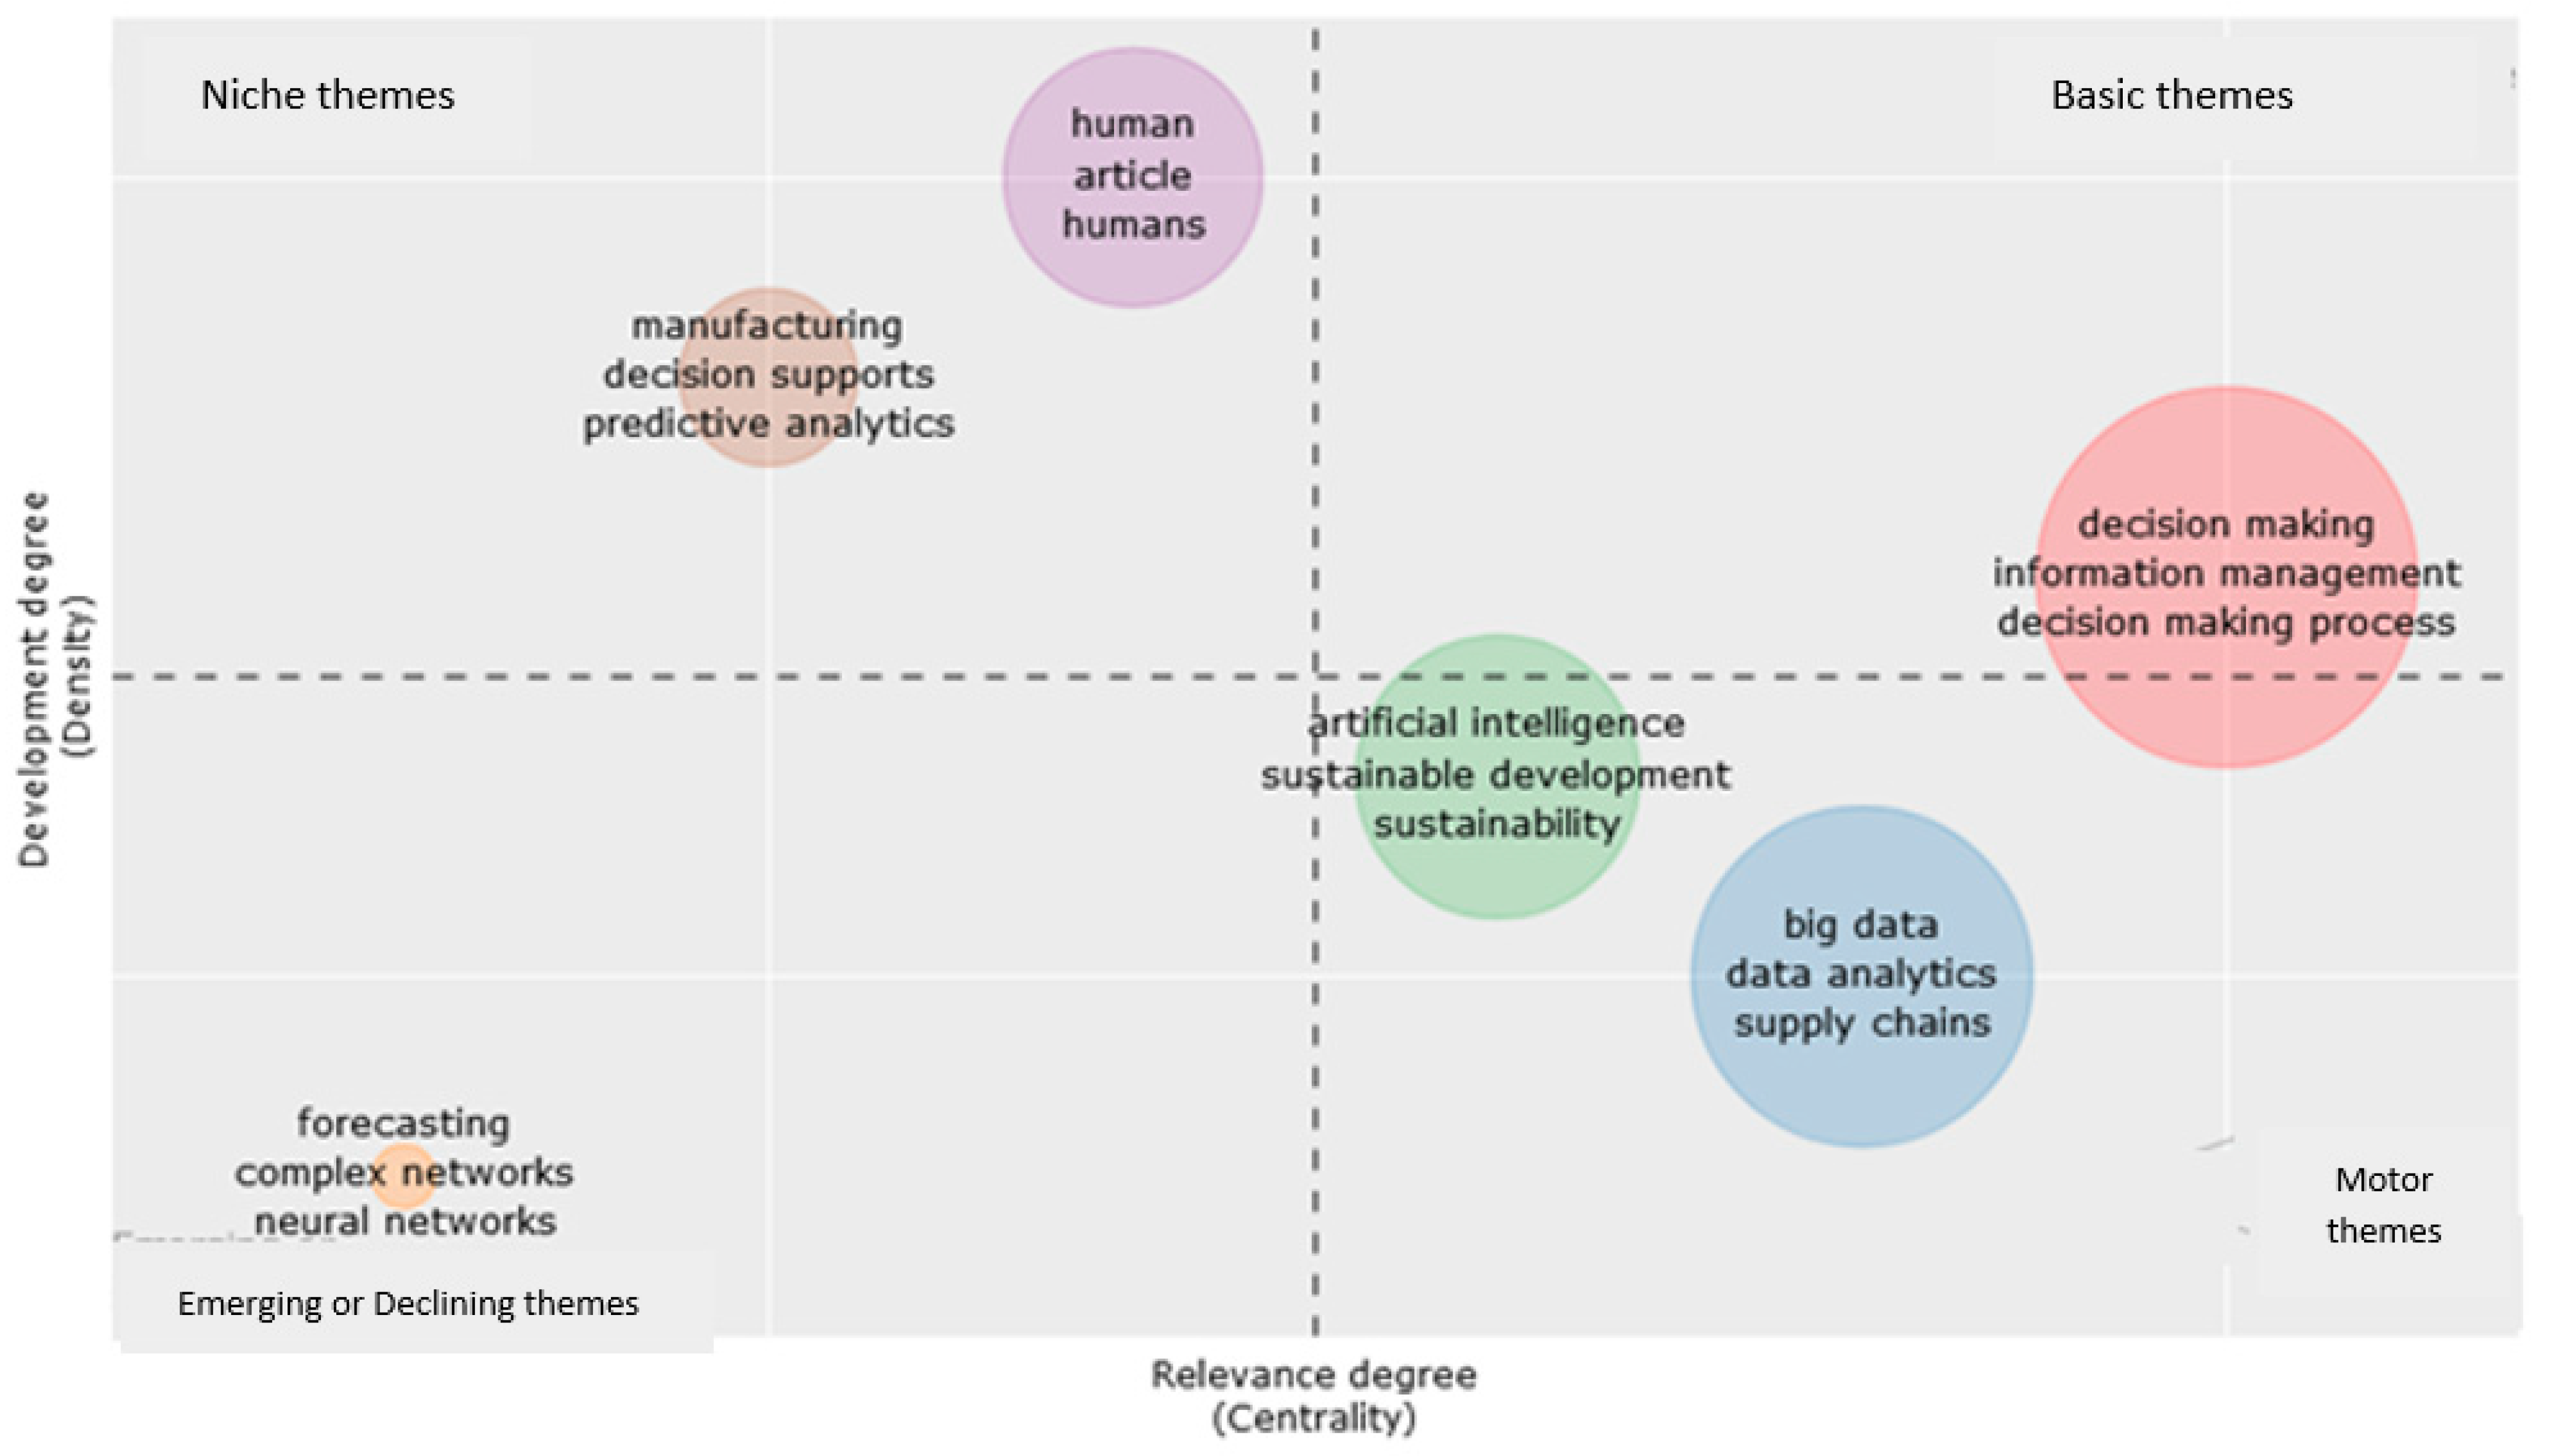
Figure 11 presents the thematic map based on keywords plus terms. As described above, the thematic map consisted of four quadrants with each of them illustrating a different theme (niche, emerging, motor, and basic themes).
Figure 11 highlights predictive analytics, as a branch of analytics that can contribute to information management. Predictive analytics uses real-time and historical data mining, among other methods, to forecast events and assist corporations and other organizations in decision-making processes [
71]. Even though predictive analytics are crucial, it was discovered that bibliographies combining predictive analytics and information management are rare. By linking predictive analytics and information management, businesses can achieve not only the ability to manipulate data for analysis, but also the ability to learn to communicate their analysis and results to decision-makers, become leaders in using data, and facilitate the decision-making process. Furthermore, emerging themes illustrate that the neural network is an important factor for information management. The neural network is a technique used in artificial intelligence which instructs computers to analyze data in a manner modeled after the human brain [
72,
73]. Deep learning is a type of machine learning that employs linked nodes or neurons in a layered structure that resembles the human brain.
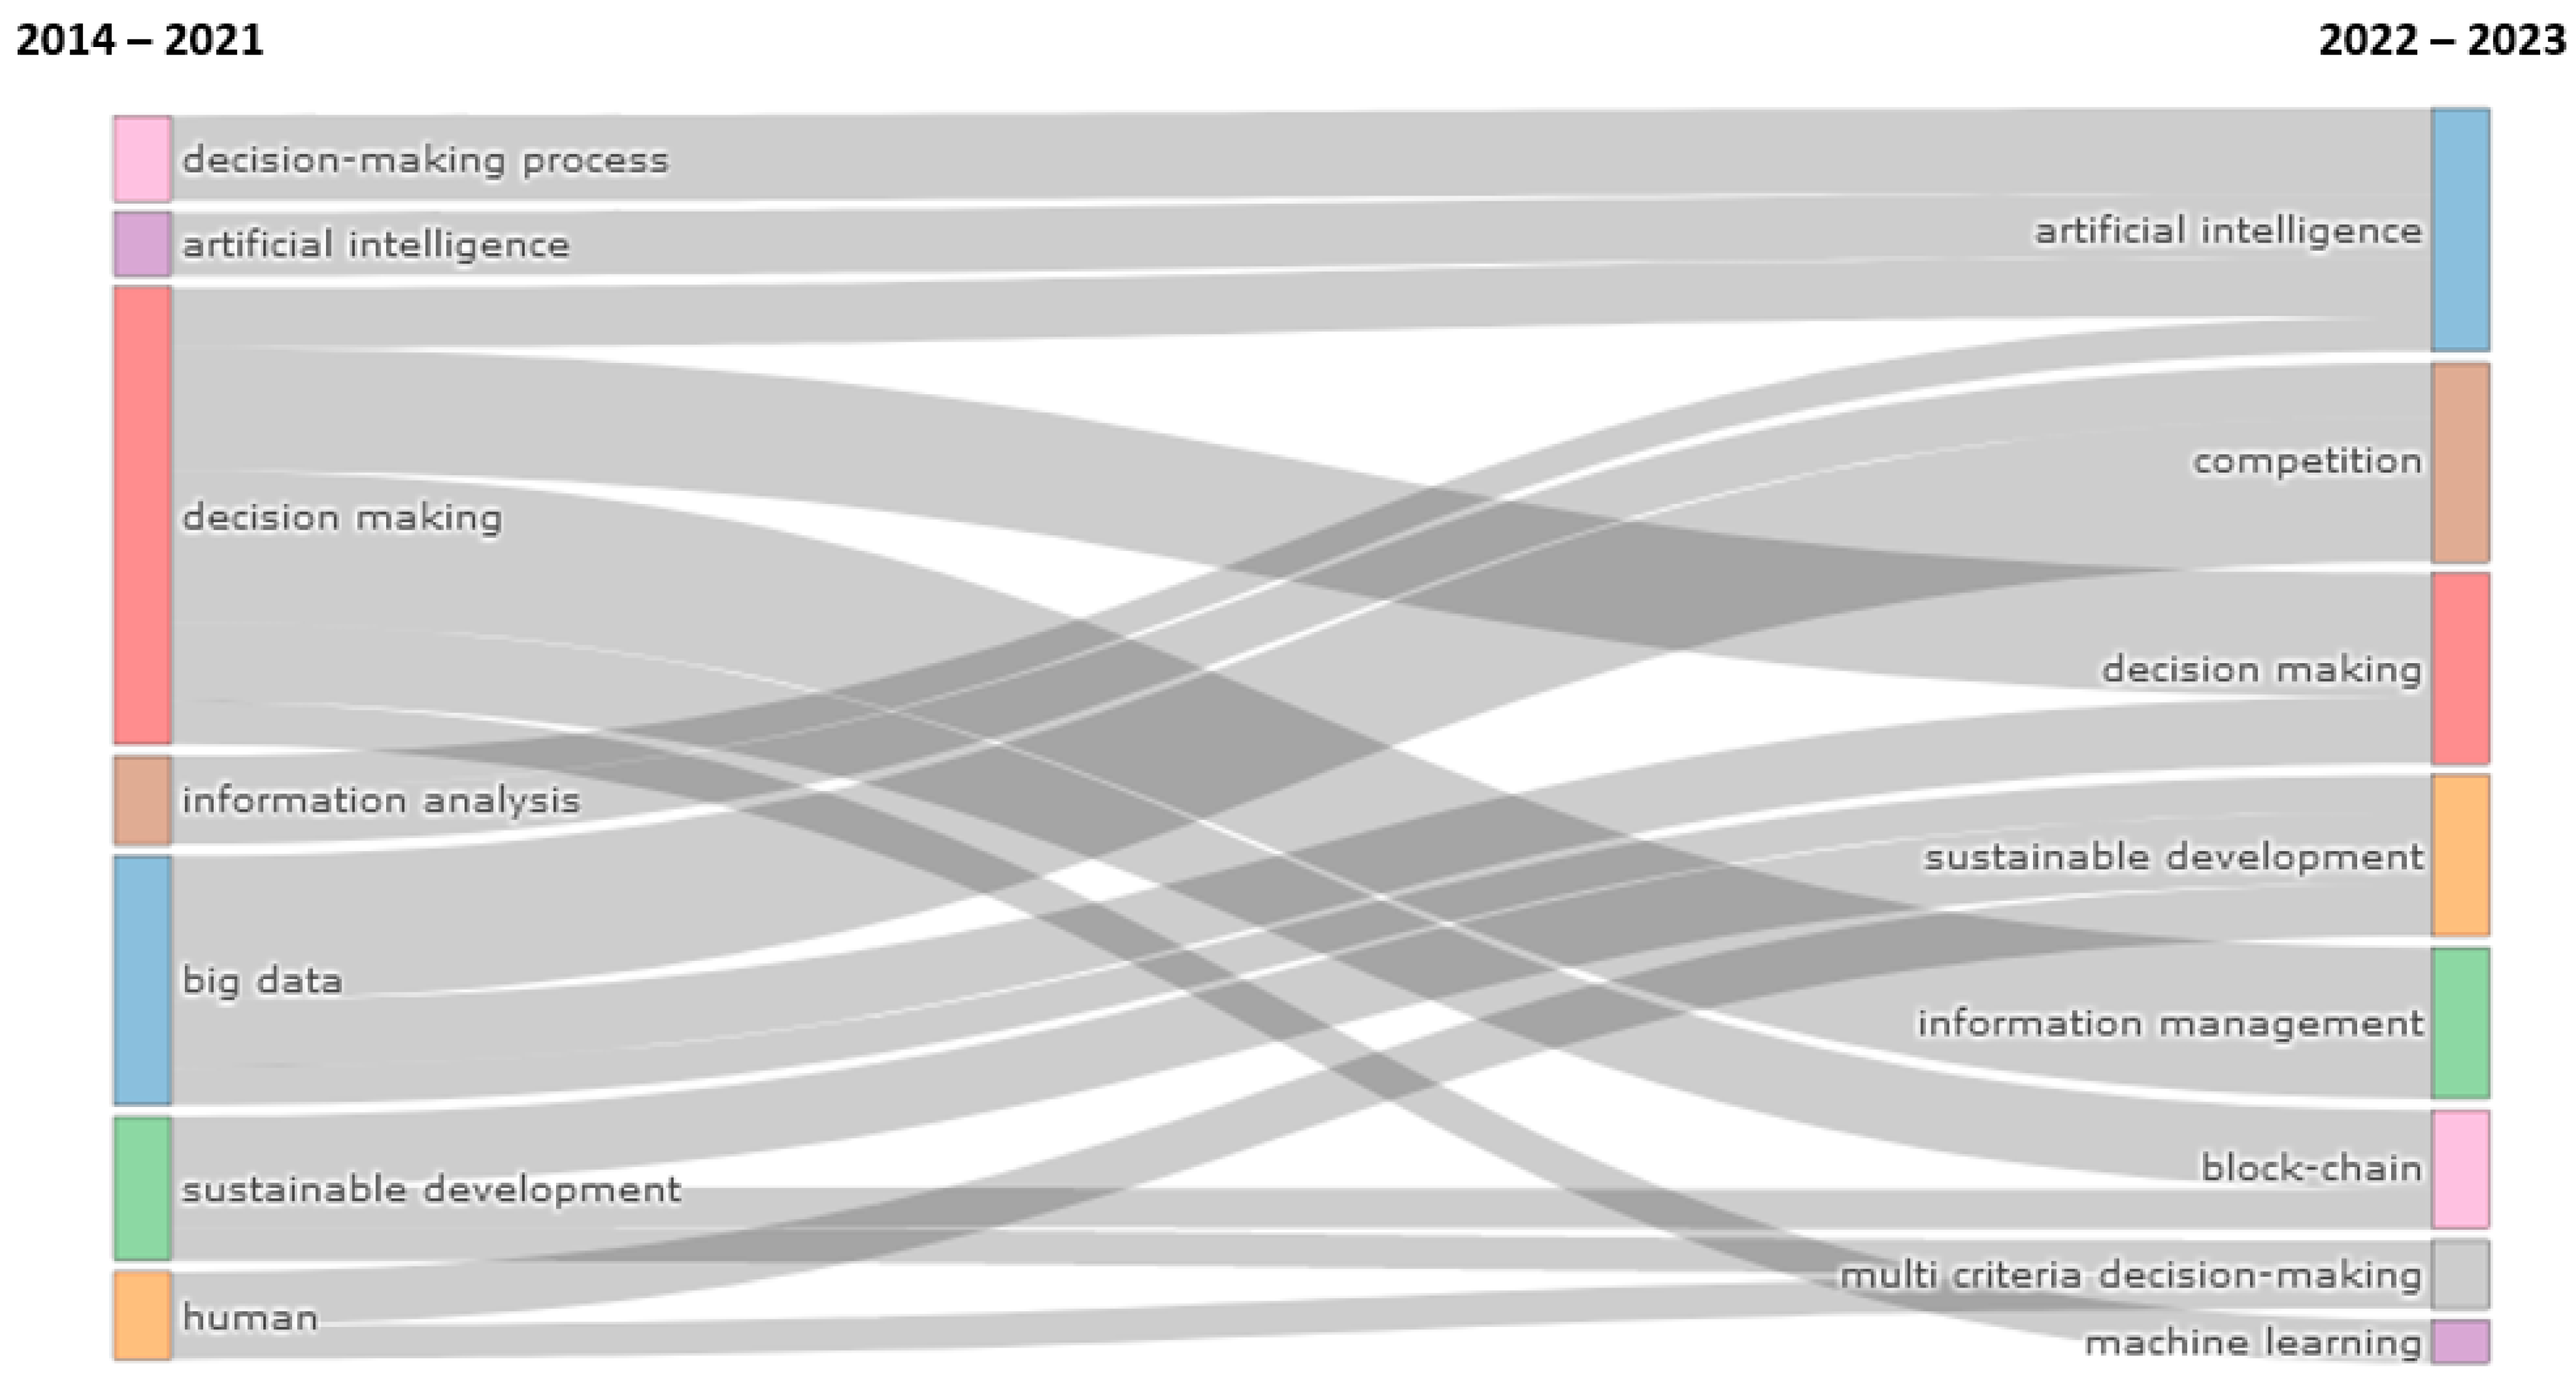
Moreover, the research field of multi-criteria decision-making (MCDM) is of particular relevance to big data analytics and information management.
Figure 12 presents the thematic evolution map based on keywords plus terms and illustrates the importance of big data analytics and information management in the multi-criteria decision-making process. Complex information management is a critical component of modern decision-making. Nowadays real-world situations require a variety of data sets, some exact or objective and others unclear or subjective. To simulate complicated commercial or engineering processes, a variety of statistical and non-statistical decision-making strategies have been offered in the literature. Multiple-criteria decision-making (MCDM) procedures are among those that have recently gained enormous popularity and widespread use and can be facilitated by the contribution of big data analytics and information management.
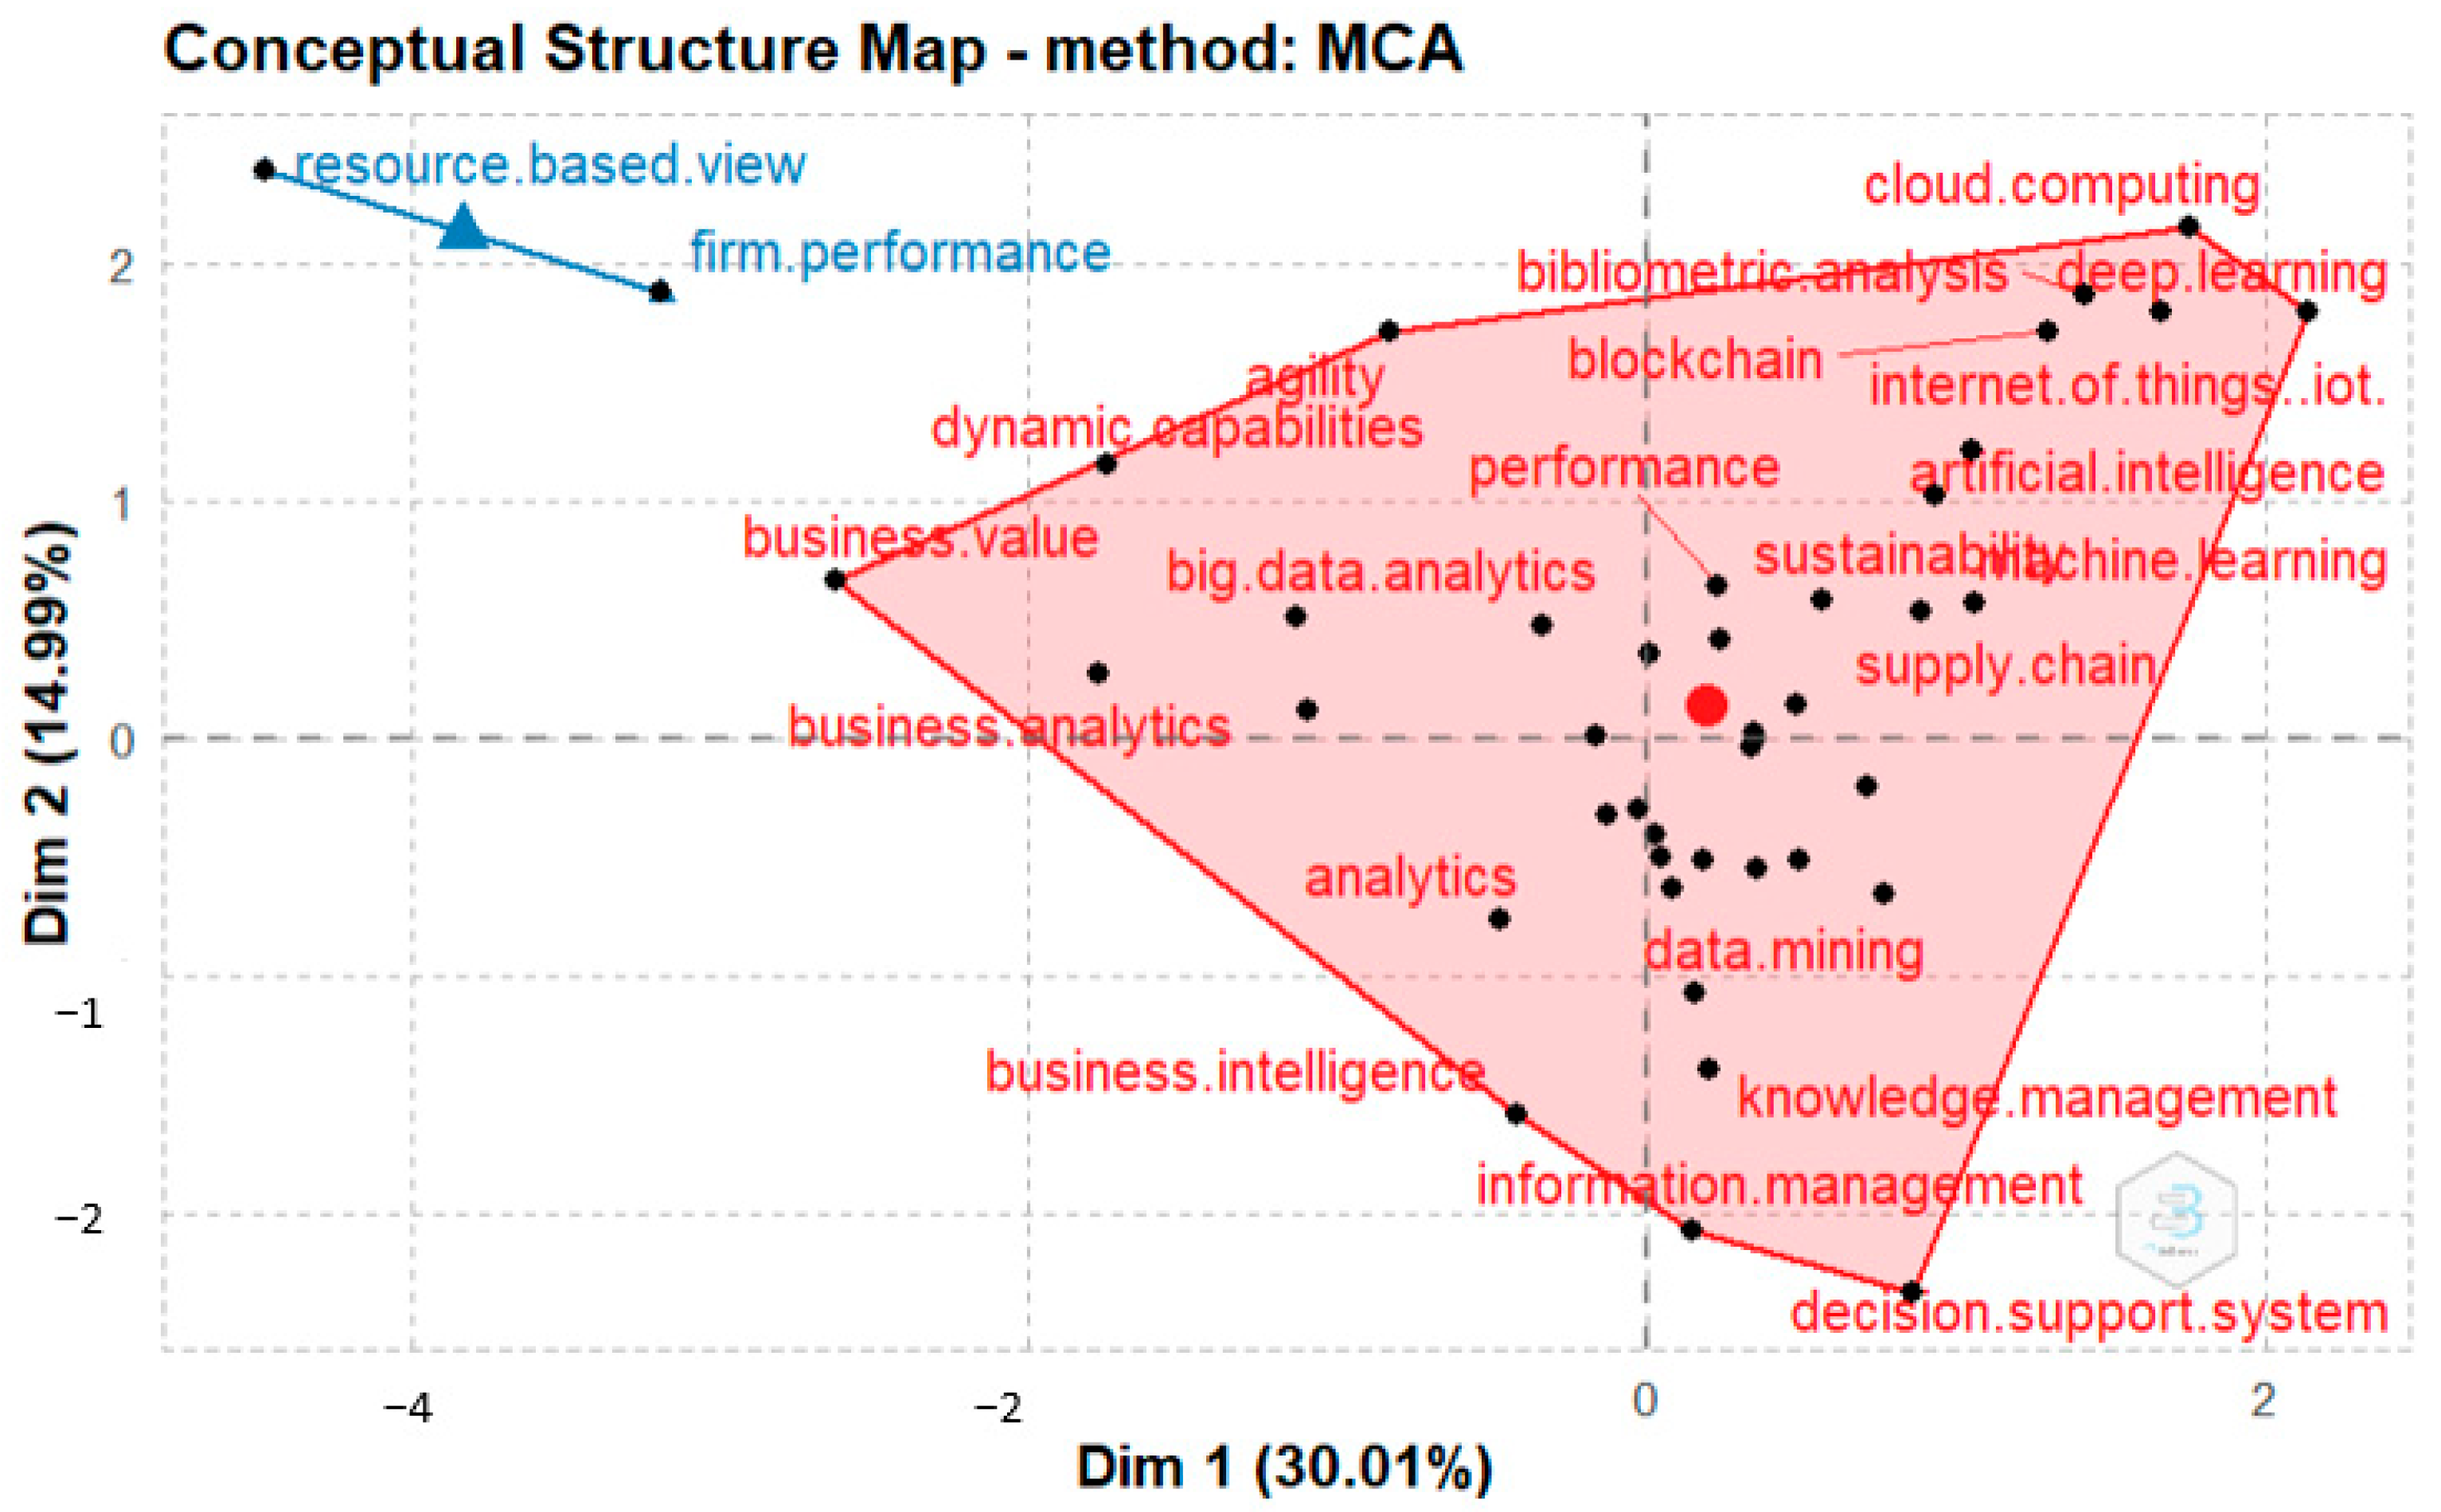
Instead, scholars have noticed the importance of big data analytics in the domain of information management, which leads to operational efficiency and decision-making process; there is limited research on the contribution of other emerging technologies such as artificial intelligence [
74]. Additionally, academics have not yet looked at the contribution of developing technologies to achieving a lasting competitive advantage. Along these lines, this bibliometric research emphasizes how important the aforementioned phrases are in incorporating new emerging technologies into enterprises’ information management systems. The Internet of Things, blockchain, and other technologies, when combined with big data analytics, may provide an agile decision-making process and a long-lasting competitive advantage, according to a factorial study using the Multiple Correspondence Analysis (MCA) approach (
Figure 13) [
75]. In terms of the MCA method, this is a grid that combines co-word analysis (Document Word) with the keywords mapped out on a two-dimensional map. According to the following dimensions: (i) the frequency of each keyword and (ii) the joint reference of the keywords in each recovered document, the MCA approach categorizes the keywords of the original retrieved articles. The results of the MCA approach are interpreted in terms of the locations of the points and the distribution of those points along each dimension. Therefore, the closer the terms are depicted on the Conceptual Structure Map, the more similar they are in their distribution.
The cluster in red color highlights the strong connection between emerging technologies (cloud computing, deep learning, Internet of Things, blockchain, and artificial intelligence) and information management. Both can contribute to the facilitation of the decision-making process of businesses and help them achieve sustainable competitive advantage, increase their value, and adopt agile management practices. The above can be achieved in many ways. Tracking employees’ efficiency and productivity can be integrated into the multiple advantages that the combination of information management and emerging technologies can offer. Adopting both can help businesses guide the human resource department to hire someone new or find ways to boost the existing workforce’s confidence and make them more proactive and productive within the company. Moreover, the integration of technology and information management systems can contribute to the detection of illegal practices in the workforce, such as fraud, money laundering, corruption, and bribery. However, businesses should concentrate their efforts on two key areas where agility may make a significant impact, rather than trying to be “more agile.” Access to networks comes first. Prior to COVID-19, a sufficient number of employees were connecting to the network using their own devices. This has become the norm now. Researchers have found that fraudsters are targeting home gadgets more than ever before in an effort to break into corporate networks. All businesses that have a substantial number of remote employees ought to make this one of their top priorities. IT teams can simply implement the proper network controls with the aid of a more adaptable cybersecurity architecture, which can also guarantee that such controls are continuously and automatically updated even in the face of never-before-seen threats. If used properly, it may assist in establishing a foundation where employees can securely log in from any place using any device, giving IT staff peace of mind.
On the other side, the blue cluster illustrates the resource-based view as a fundamental managerial framework applied to determine the strategic resources an organization can exploit to accomplish a sustainable competitive advantage. Furthermore, the resource-based view theory provides a valuable way for academics and researchers of the studied field to consider how Information System Management can be related to the strategy and performance of a business. In addition, this theory provides direction on how to differentiate among various types of information systems, such as emerging technologies and information systems, and how to study their separate influences on performance.


 ,
, 


