1. Introduction
Previous research by Fish et al. [
1] and many others have already shown that sinusoidal wing leading edges, modelled on the leading edge of humpback whale fins and called tubercles, can strongly influence flow behaviour. The aforementioned study showed that the tubercles change the stall and post-stall behaviour of a wing, resulting in a smoother flow separation and an increased post-stall lift [
1].
However, known research on the application of tubercles in pumps is either limited or non-existent for axial pumps. Due to the different profile selections, results from existing studies cannot be relied on when designing axial pump blades with tubercles. Therefore, this study aims to address this research gap by using CFD methods on an infinite vane using a Goe11K, a profile commonly used in axial pumps, within a Reynolds number (Re) range of Re = 1.5 × 10⁶ and an angle of attack (α–[°]) range from 0° to 24°. Since axial pumps represent a wide area of application and therefore an important area of research, this is a first step towards the investigation of the suitability of tubercled profiles for axial pumps. Based on this, experimental investigations are to be carried out.
2. State of Research
2.1. Basic Mechanism of Tubercles
In the previous research literature, four mechanisms of action of tubercles are mainly distinguished. The first effect was mentioned by van Nierop et al. [
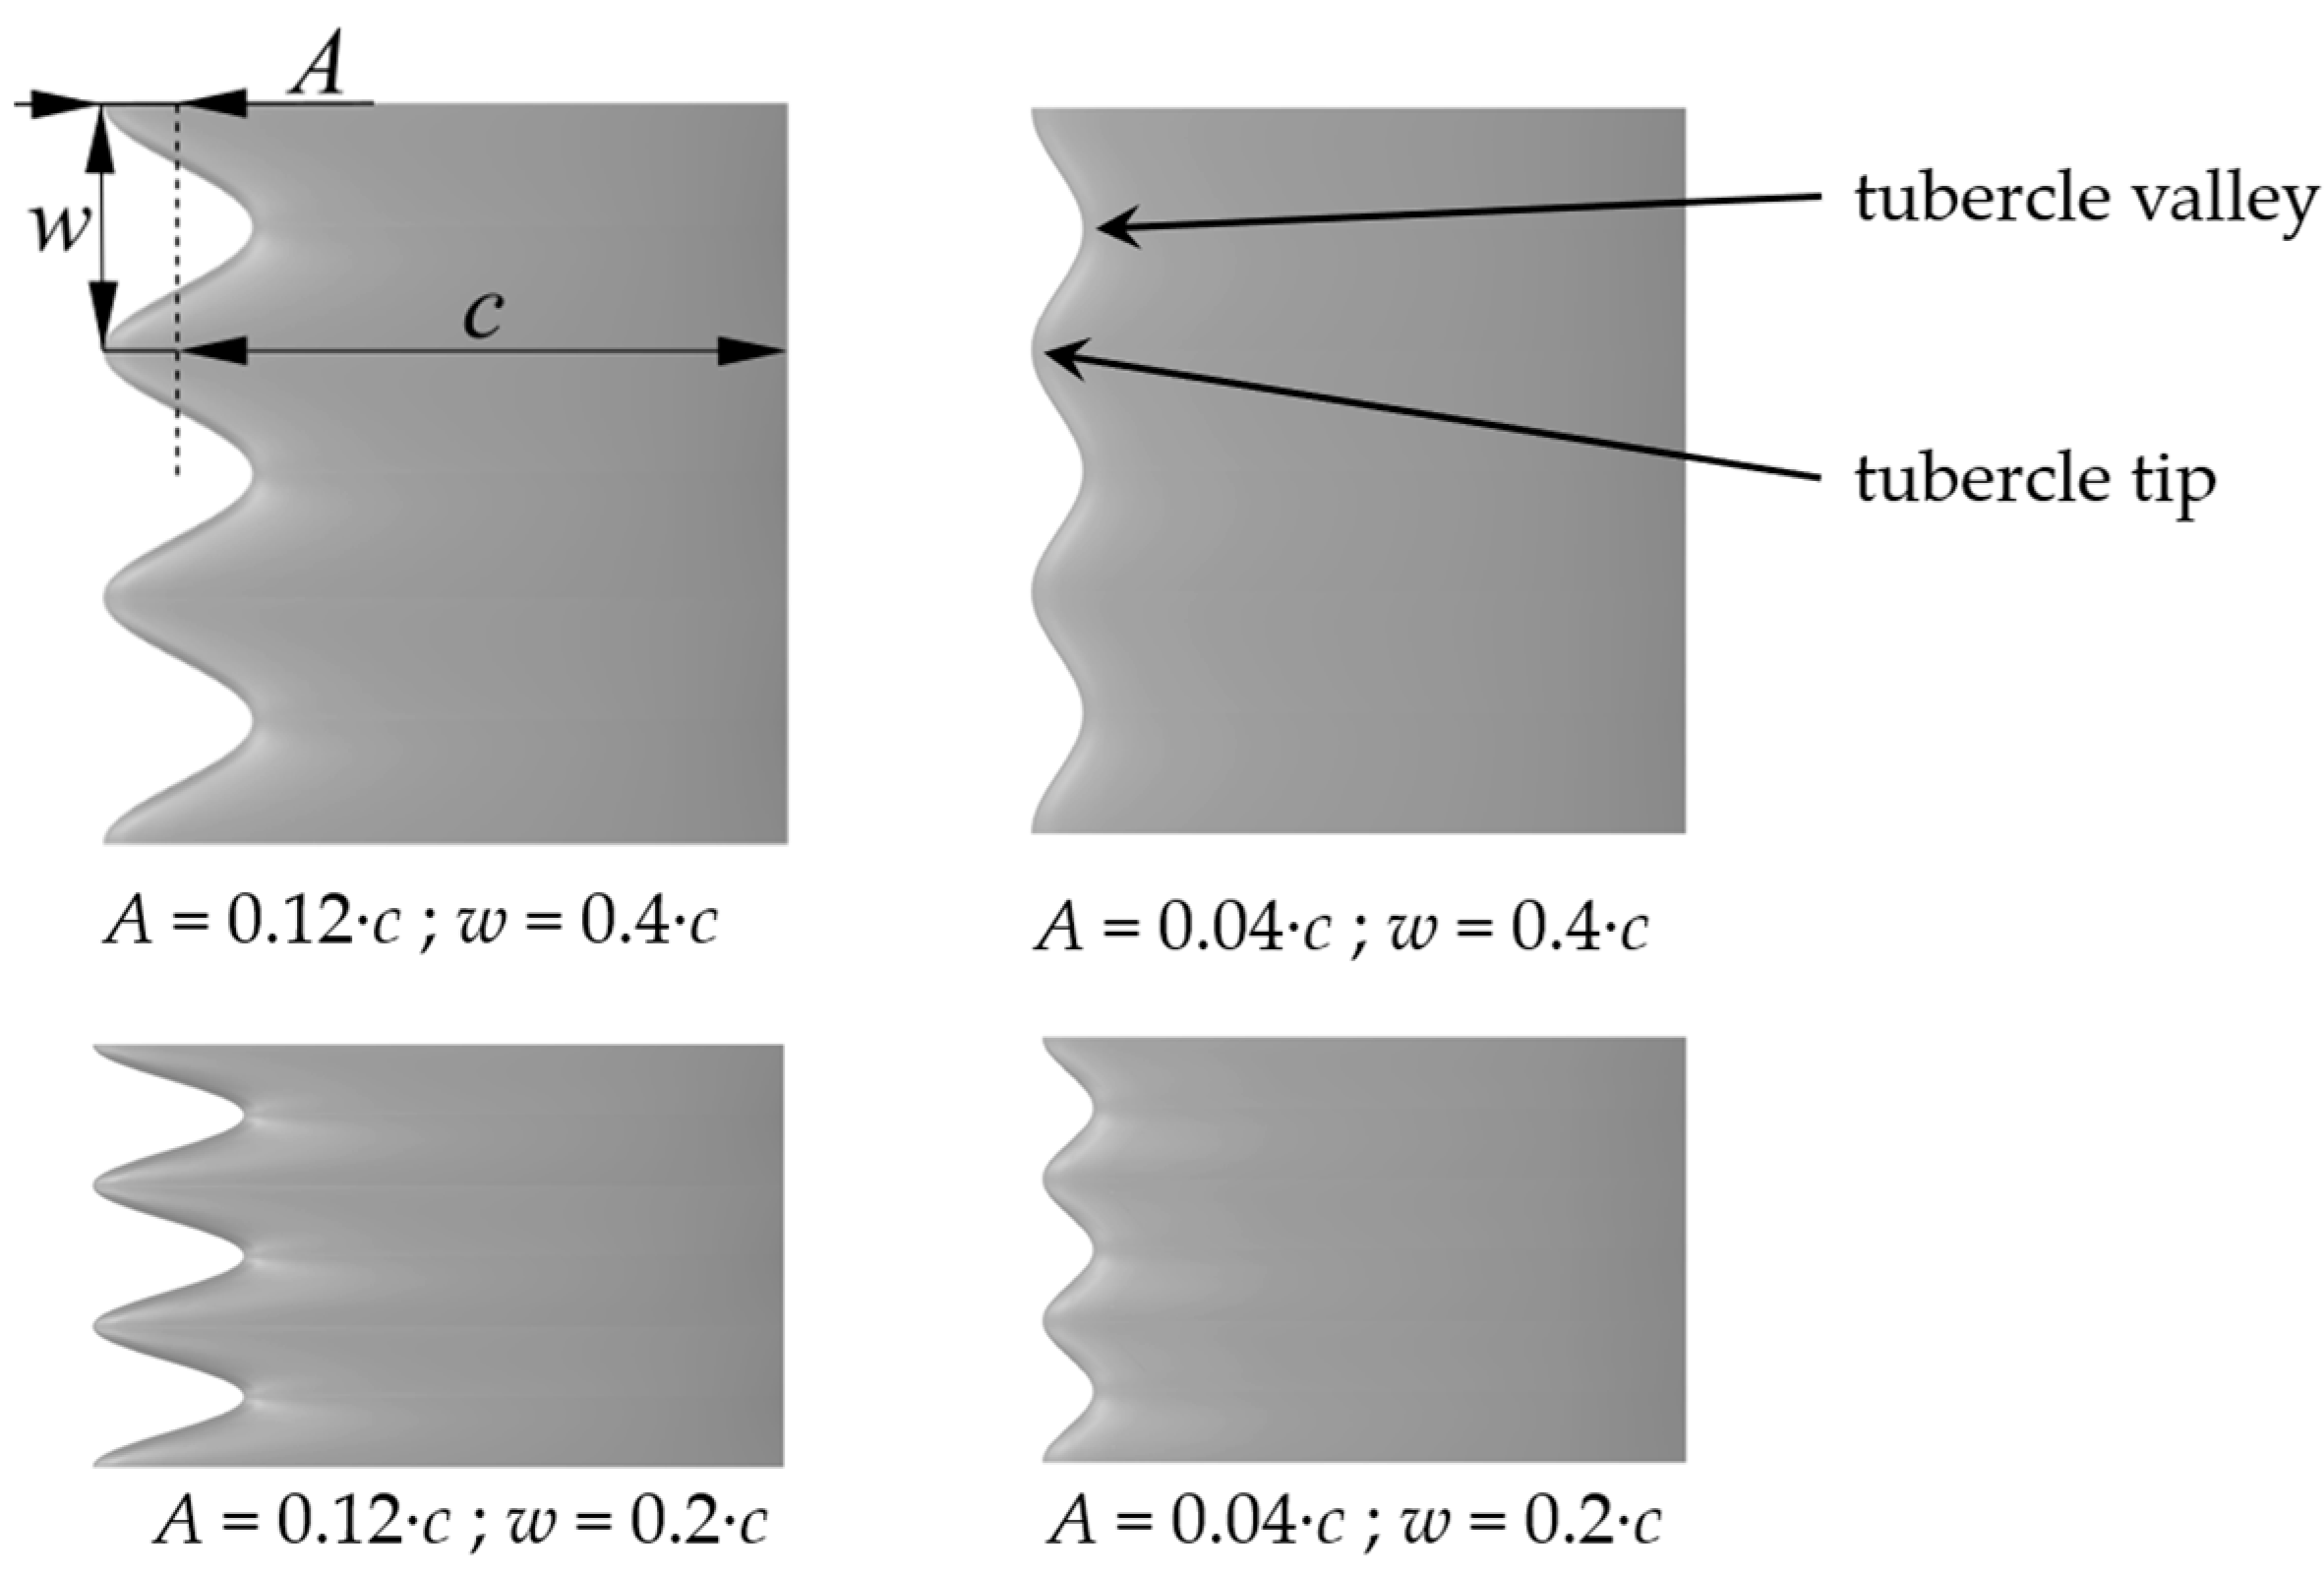
2]. It was claimed that the pressure distribution on the wing in the flow direction, which is different behind tubercle tips and valleys, influences separation behaviour. Due to a higher pressure gradient behind the tubercle valleys (compare
Figure 1), the flow separates there first while still remaining attached behind the tips. This contributes to the smoother separation characteristics of a tubercled wing.
The second effect has been mentioned by Miklosovic et al. [
3]. The resulting vortices behind the tubercle valleys are thought to increase the momentum exchange between the boundary layer and the free stream near the trailing edge of the wing, resulting in the flow staying attached in these regions at higher
α. This working mechanism is comparable to that of “vortex generators”.
A third working mechanism has been mentioned by Pedro et al. [
4]. The vortices that appear behind tubercle valleys act as a barrier to the spanwise flow on wing-like wing fences. Therefore, on finite wings tubercles reduce the expansion of separation zones along the wing span, resulting in an increased lift at high
α, where parts of a finite wing are already stalled. It is important to note that this effect is only seen in experiments and simulations with finite wings with changing profile contours along the span. As a result, those phenomena will not occur in the presented simulation approach, where the wing profile is an infinite wing that does not change along the span. Therefore, no spanwise pressure gradient and no changeable separation behaviour along the span can be expected, which tubercles could potentially help reduce.
The fourth effect has been described by Custodio [
5]. The author argues that the vortices accelerate the flow on the wing, resulting in lower pressure and lift, often called “vortex lift” [
5].
2.2. Influence of Tubercles on the Behaviour of a Profile
The aforementioned study by Miklosovic et al. [
3] showed how tubercles can improve the flow around a wing. In their research, a finite wing with a NACA 0012 profile, with a maximum thickness of 12% at 30% chord length (c–[m]), was tested in a wind tunnel at a Reynolds number range from
Re = 1.35 × 10
5 up to
Re = 5 × 10
5. The wing with tubercles showed an increased maximum lift by 6% and a decreased drag by up to 32% at high
α. In addition, the stall characteristics of the wing were smoother on the wing with tubercles than those on the wing without tubercles. At low α, the tubercles showed no change in lift and drag compared to the unmodified wing.
A study by Cai et al. [
6] investigated the influence of tubercles on an infinite wing with a NACA 634-021 profile at Reynolds number
Re = 2 × 10
5 using CFD methods. The results of this research show a different influence of the tubercles on wing performance. At high α, where the flow on the unmodified wing is still attached, the tubercled wing has an increased drag and reduced lift. The tubercled wing only showed improved flow behaviour in the separated flow region, where drag corresponds to that of the unmodified wing and lift is increased.
These two studies highlight that the influence of tubercles on the wing characteristics is not the same for all applications but rather depends on parameters such as the selected airfoil, Reynolds number, and test setup.
The influence of tubercles on flow characteristics also depends on the geometry of the tubercles, which is defined by the tubercle amplitude (
A–[m]) and the tubercle wavelength (
w–[m]). Both parameters are shown in
Figure 1 for better understanding.
Studies by Johari [
7] and Hansen et al. [
8] demonstrate that, at higher amplitudes, the flow around the wing is more influenced by the tubercles; therefore, the lift and drag are changed more compared to a wing without tubercles. This can be seen in the study by Johari [
7], where a small amplitude of
A = 0.025·
c only slightly reduces the maximum lift and improves the post-stall lift by a small amount, while versions with a high amplitude of
A = 0.12·
c have a greater reduction in the maximum lift, but also a higher lift in the post-stall regime.
The influence of the tubercle wavelength does not seem to be as decisive as that of the amplitude. Also, no general rule for the influence of the wavelength can be found in the studies presented here. However, at high wavelengths, such as
w = 0.86·
c, tested by Hansen et al. [
8], the flow behaviour on the wing tends to be very similar to that on the unmodified wing.
2.3. Hypotheses
Even if research findings to date cannot be directly transferred to the application in axial pumps, due to the completely different profile requirements, hypotheses related to the subject of the study can still be derived. These are:
The profiles with tubercles do not reach the maximum lift coefficient (cL) of the profile without tubercles but show better lift behaviour in the post-stall area;
The drag coefficient (cD) of the profiles with tubercles will be slightly higher at angles without flow separation compared to the reference wing;
The lift behaviour of the profile with tubercles depends on the configuration used;
Smaller amplitudes result in higher maximum lift, but only minor improvements in the post-stall area;
Larger amplitudes result in lower maximum lift, but better post-stall behaviour;
A smoother stall characteristic can be expected on the tubercled wings than on the baseline wing.
These hypotheses are to be examined in the present study using a CFD simulation.
3. Method
As already mentioned, previous research findings cannot be transferred, partly due to the different profile requirements for axial pumps. Therefore, the profile selection and the selection of the tubercle configurations to be simulated will be discussed here first before the setup of the CFD simulation is described.
3.1. Profile Selection and Selected Configurations
The main profile requirements for axial flow pumps include slimness combined with a high thickness reserve, reducing the suction peak at the leading edge and therefore making the pump vanes less prone to cavitation. Furthermore, a high maximum glide ratio in the design point is desired for the high efficiency of the pump [
9]. The selected Goe11K is shown in
Figure 2.
This profile meets these requirements [
10] and has already been used in axial pumps at the Department of Fluid System Dynamics at the Technical University of Berlin; therefore, previous test results can be compared.
Four configurations of tubercled wings and the baseline version were simulated to investigate a variety of different designs while keeping the computational effort at a reasonable level. A preselection of amplitudes and wavelengths was made, considering the analysis performed by Hansen et al. [
8]. From these studies, the configurations were selected to stay within a presumably promising range. Four configurations were created by combining two amplitude values with two wavelength values. The selected amplitudes are
A = 0.04·
c and
A = 0.12·
c, and the wavelengths are
w = 0.2·
c and
w = 0.4·
c. The leading edge of the baseline wing was taken as the axis around which the defined sinusoid oscillated. This was done to ensure that the projected wing area on the modified wings was the same as on the reference. The four resulting configurations are shown in
Figure 1. With these wings, an amplitude–wavelength ratio
A/
w of 0.1 for the smoothest to 0.6 for the sharpest tubercles is covered. Each of the four configurations and the reference profile without tubercles was simulated in the
α range from 0° to 24°, with 3° steps, with a Reynolds number of
Re = 1.5 × 10
6.
3.2. CFD Setup
The CFD model was set up with the use of OpenFOAM according to general information and guidelines on CFD setup, e.g., from Schwarze [
11]. The presented CFD model reflects a transient and incompressible flow state and uses the RANS approach. Turbulence in the domain is modelled using the
k–
ω SST model (as described in [
11]), a two-equation model that well reflects the turbulence in the free stream and the boundary layer. By adding only two new variables, the turbulent kinetic energy (
k–[J/kg]) and the specific dissipation rate (
ω–[1/s]), computation time is kept at a reasonable level while still achieving a good representation of the turbulence in the domain. Because of those properties, it is an industry standard and is used in this paper.
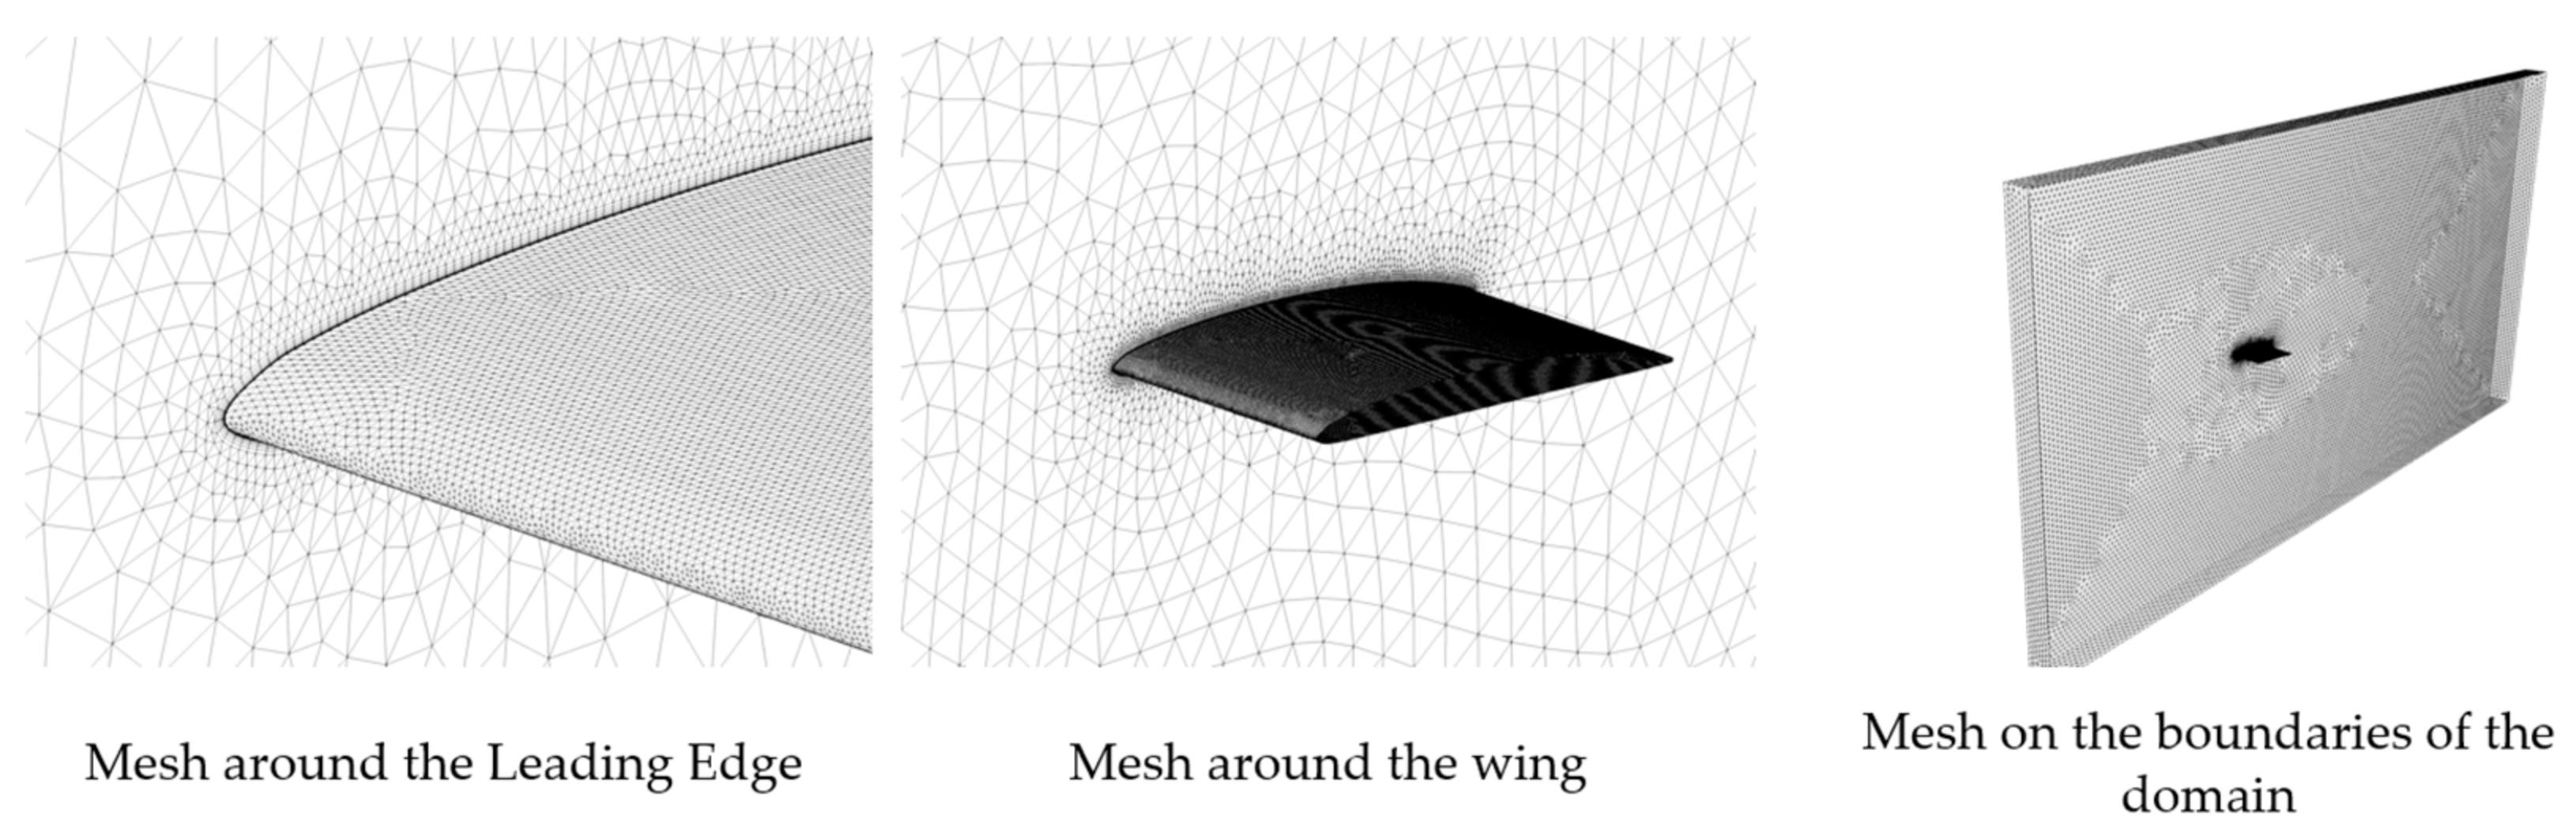
The computational domain (cf.
Figure 3) was designed to represent an infinite vane. Therefore, both sidewalls were set to a symmetry condition.
The mesh, created with the open-source software SALOME, is an unstructured mesh (compare
Figure 4) consisting of roughly two million cells. The free stream cells are tetraeders while the boundary layers around the wing are resolved using prism layers. Since no wall function was used, the resolution of the boundary layers was needed to ensure accurate drag and lift predictions. The maximum aspect ratio of all generated meshes was around 90, and the maximum non-orthogonality of all meshes was around 65°. The mesh quality is therefore sufficient for the intended use.
Solving was performed using the pisoFoam solver, which uses the PISO algorithm. Linear upwind, a second-order scheme [
12], was selected for the discretisation of the divergence terms. For Laplacian terms, linear interpolation was chosen for the diffusion coefficient, and explicit non-orthogonal correction with the correction coefficient set to 1 was chosen for normal surface gradients. To further address non-orthogonality, two inner non-orthogonal corrector loops of the pressure equation were used. The linear interpolation scheme was also used for the gradient terms. An implicit scheme, the Crank–Nicolson scheme, with a mixing factor of 0.7, was used for the temporal discretisation. The time step was addressed with an adjustable time step and a fixed maximum CFL number of 7 for all simulations. The simulated physical time was 0.3 s. At the end of the simulated time, a quasi-steady state or periodic condition was reached for all simulations.
3.3. Mesh Study
A mesh study was carried out to ensure that the results were independent of the mesh. To investigate the influence of the mesh resolution on the results, four different resolutions were tested with the baseline wing at
α = 6° using the transient setup described above. To change the resolution of the mesh, multiple parameters like the growth rate of the cells and the first layer thickness of the prism layers, and, thereby, the dimensionless wall distance (
y+), were adapted. For good results, the requirement
y+ < 5 should be reached in all cells at the wall to keep the cells within the viscous sublayer [
11].
Table 1 shows the time-averaged force coefficients, the relative error of both coefficients compared to the finest mesh, and the maximum
y+ value for the mesh study. It can be seen that poor mesh resolution has a considerable influence on the calculated drag. Between the two highest resolutions, the drag value does not vary by more than two percent, which makes the error that occurs tolerable. The maximum
y+ for this resolution is above five. To save computation time, a resolution of about two million cells was chosen for this study, because only about 0.5% of the cells on the wing surface had a
y+ value greater than five.
The constructed simulation model was validated by comparing the simulated lift and drag behaviour of the Goe11K baseline profile with profile data from Riegels [
10]. The results, seen in
Figure 5, show good agreement for lift and reasonable agreement for drag, with the highest prediction error being 34% at
α = 0°.
4. Results
First, the results of the simulation are presented using the calculated coefficients and then a qualitative evaluation is carried out using the simulated pressure distribution.
4.1. Quantitative Evaluation
Figure 6 shows the results for the lift coefficients
cL of all the tubercle versions and the base wing from the simulation over the simulated α range from 0° to 24°. As can be seen, the lift of the baseline wing increases with α up to 18°, where the maximum lift of
cL = 1.6 is reached. A further increase in
α leads to flow separation at the leading edge of the wing. The maximum lift achievable by the tubercle configurations is only
cL = 1.2. Depending on the tubercle configuration, this corresponds to a maximum loss of lift of about 35%. Furthermore, it was found that all tubercle configurations show a smoother separation behaviour than the baseline.
Apart from that, all tubercle configurations have a higher lift coefficient cL in the post-stall area than the reference wing. The improvement in post-stall lift is greatest at α = 21°, where the tubercles improve lift by up to 20%.
Figure 7 shows the coefficient of drag
cD, which was calculated in the simulations for all versions with a modified leading edge. The reference wing was plotted over the α range. It can be seen that the drag of all configurations between 9° and 18° is higher than on the unmodified wing. In the post-stall region of the base wing, three of the four tubercle configurations tested achieve lower drag than the unmodified wing.
The quantitative evaluation has shown that the aerodynamic coefficients are heavily influenced by the application of tubercles. The next section investigates the reasons for this change in flow behaviour.
4.2. Qualitative Evaluation
In this section, the flow around the tubercled wing is analysed using pictures created after post-processing the simulation data. The investigation starts at a low α and describes the changes in the flow field as α is increased up to and beyond the separation angle of the reference wing.
Figure 8 compares the pressure distribution on the suction side of the base wing (the upper wing in
Figure 7) with that of one selected configuration for
α = 3°. For this comparison, the surface is coloured according to the local pressure, where blue symbolises low pressures and orange high pressures. The reference wing has a uniform pressure distribution along the whole width, while the tubercled wing has a higher negative pressure in the tubercle valleys than at the tips. The observed negative pressure also exceeds the suction peak of the reference wing.
When looking at the simulation results, it was found that, on the simulated wings with an amplitude of
A = 0.12·
c, a pair of vortices, which can be seen in
Figure 9, starts to develop only behind the tubercle valleys on the suction side at
α = 6° and above.
Figure 9 shows the surface of the selected tubercle configuration, which is coloured according to the local pressure. In addition, streamlines are shown in grey to highlight the flow above the wing and to show the vortex behind the tubercle valley. These vortices, although they create some negative pressure and hence vortex lift at the surface, are the reason for the reduction in lift, since the vortex lift is less than the lift present on the wings with a fully attached flow; they are also the reason for the increase in drag observed in
Figure 6 and
Figure 7 for these configurations. These vortices grow as α increases.
Regarding the separation behaviour, it was found that some configurations already lose
cL compared to the baseline wing at
α = 6° resulting from the mentioned vortices. However, the flow on the configuration with the lowest amplitude-to-wavelength ratio of
A/
w = 0.1, which is the version with the smoothest tubercles, stays completely attached until
α = 9°. At
α = 12°, the flow is separated over a large part of this wing, as shown in
Figure 10, but high negative pressure is still present at the tubercle tips.
The flow on the reference wing remains attached up to an α = 18°. As α increases, the suction pressure on the leading edge increases to very high values. Regarding these high simulated negative pressures, it should be mentioned that cavitation could appear at those points when used in water, which strongly influences the behaviour of a pump.
Above
α = 18°, the wing without tubercles stalls and the lift achieved is rapidly reduced. In comparison, at these high α values, the flow on the tubercled wing is still attached to small parts of the wing behind the tubercle tips (cf.
Figure 11).
5. Discussion
The simulation results show that, for the selected profile, the setup and Reynolds number improvements in the post-stall lift can be found, while there is a loss at lower α. Therefore, the first hypothesis is confirmed. However, the magnitude of this trend has been underestimated and appears large compared to the literature, e.g., [
6]. The loss in lift in the pre-stall region is large at around 35%, while the improvement in the post-stall region is smaller at around 10% to 20%. The best-tested configuration is the one with an amplitude of
A/
c = 0.12 and a wavelength of
w/
c = 0.4. While the loss of this version at low angles is comparable to that of the version with the same tubercle amplitude, the lift is the highest for all tubercle configurations from
α = 18° upwards.
Regarding the second hypothesis, because the drag values in the area of the adjacent flow should be slightly higher for the tubercled versions, it can be argued that, again, the overall trend follows this hypothesis, but the extent of the increase in drag is greater than expected, with an increase of about 50% compared to the baseline, which is greater than expected. Therefore, the hypothesis cannot be verified, as only a small increase in drag was expected, but the results showed a rather significant increase.
The differing results, when compared to the literature, can be attributed to multiple factors. Firstly, the chosen Goe11K profile, with a chord thickness of 7.5%, is slimmer than the profiles described in the literature. It is designed to achieve a high glide ratio at low α. This leads to a significant increase in drag when vortices start to appear behind the tubercle valleys at
α = 6°, where the drag of two tubercle configurations is more than doubled (cf.
Figure 6). Secondly, the infinite wing approach does not show the benefit of tubercles created using spanwise flow suppression, which can be seen when comparing the results of Miklosovic et al. [
3] and Cai et al. [
6]. When using the infinite wing model, the third working mechanism of tubercles (see
Section 2) does not improve the flow around the wing because there is no spanwise flow due to the lack of a spanwise pressure gradient or spanwise forces to suppress. However, the spanwise effects that are expected in an axial flow pump differ fundamentally from the ones observed on a typical finite wing, e.g., because of the casing, which suppresses the formation of tip vortices. Therefore, improvements seen on a finite wing model cannot be expected to be transferred to this application. Thirdly, a study by Dropkin et al. [
13] has shown that the maximum lift of a tubercled wing does not increase in the same way as the maximum lift of an unmodified wing at higher Reynolds numbers. Therefore, the selected Reynolds number of
Re = 1.5 × 10
6, which is high compared to most studies on tubercle application, results in a greater difference in maximum lift between the base wing and tubercle configurations. Lastly, it must be noted that the lift on the base wing at high α from 12° to 18° can be partly attributed to the simulated high negative pressures. When using tubercles in an axial pump with water as the pumping medium, those high negative pressures could lead to cavitation at the leading edge and therefore the lift would be reduced. As a result, the difference in lift between the tubercle configurations and the baseline wing at those α values might be smaller in reality.
The third hypothesis, which claimed that lift behaviour depends on the selected tubercle configuration, is confirmed by the simulation results. The lower amplitude versions follow the lift slope of the unmodified wing up to α = 9° and achieve a higher maximum lift in the pre-stall area of the baseline than the higher amplitude versions. Furthermore, these configurations show a sudden decrease in lift at α = 9° or α = 12°. This is due to the fact that, at those α values, the wing stalls have a large area, decreasing the lift. This effect cannot be observed with the higher amplitude tubercle configurations. The lift does not increase as much at low α as for the other versions but also does not drop noticeably at any α. This is due to the smoother separation behaviour of these wings. In the post-stall region, only the wavelength version with w/c = 0.4 has a better lift value than the lower amplitude configurations. This might be due to the fact that the amplitude-to-wavelength ratio is too high for the configuration with A/c = 0.12 and w/c = 0.2.
The fourth hypothesis, regarding the stall characteristics, can also be accepted. The separation behaviour of the tubercled versions is indeed smoother than that of the baseline wing. While no tubercled version shows a rapid lift decrease like the baseline, the low amplitude versions with A/c = 0.04·c show a slight lift decrease at α = 9° and α = 12°, respectively. In contrast, the lift curve for the higher amplitude wings shows no lift decrease at any α.
6. Conclusions
From the simulation results and the studies presented in
Section 2, it can be concluded that the benefit of tubercles is at operating points where a flow separation on unmodified wings/blades is likely. For axial flow pumps, this is the case at operating points well below the design point. The simulation showed that an optimised tubercle configuration can improve lift by 20% at those points while maintaining similar drag values. This is because tubercles not only delay flow separation by energising the boundary layer at the trailing edge but also locally confine the separation zones that do occur. As a result, the flow should stay attached to larger parts of the blades for longer.
In addition, the application of tubercles would also most likely reduce or completely erase the phenomenon of “rotation stall” described in [
9], where a stalled region rotates in the opposite direction to the blades. This is because of the smoother separation characteristics of the tubercled blades compared to the version with a conventional leading edge.
Concerning the Reynolds number, it can be concluded that the selected Reynolds number of Re = 1.5 × 10⁶, which was chosen based on an existing pump with an outer pump diameter (dA–[mm]) of dA = 149 mm, an average chord length of about c = 100 mm, and a rotational speed (n–[rpm]) of n = 2865 rpm at the design point, reduces the positive effect of the tubercles. The use of tubercles in axial flow pumps with a lower Reynolds number, due to the smaller chord length of the blades or the lower rotational speed, could be more advantageous.
At the design point, which would be at around
α = 3°, where the highest glide ratio is achieved on the reference wing, the lift and drag of the tubercle configurations do not change much, and the maximum glide ratio is reduced from 54 to around 50 depending on the selected configuration. However, when α is increased, the efficiency and lift of the unmodified wing cannot be achieved with tubercles. Compared to studies shown in
Section 2, the difference between unmodified and tubercled wings is greater in the presented simulation. Reasons for this included profile selection, Reynolds number, and the infinite wing approach. Regarding profile selection, tubercles seem to be less effective on profiles needed for axial flow pumps than on thicker profiles used for other applications. In terms of the infinite wing model chosen, it is true that axial pump blades do not have a free tip like on, e.g., aeroplane wings, where spanwise flow is to be expected because of the casing around the blades. However, some crossflow can still be expected because of centrifugal forces or partial flow separation at the blades.
Another important influence on axial flow pumps is cavitation. It was already briefly mentioned in the discussion that the appearance of cavitation might change results. However, the simulation was not set up to cover this phenomenon, and, therefore, the influence of cavitation could not be investigated. Research by Johari [
7] suggests that tubercles influence cavitation behaviour depending on the selected configuration. In this study [
7], a wing with a NACA 634-021 was tested with different tubercle configurations at
Re = 7.2 × 10
5 and using a range of α from 12° to 24°. For low amplitude and higher wavelength versions, the cavitation characteristics are similar to that of the baseline wing. Sheet cavitation occurs along the entire leading edge of the wing and increases in size with higher
α. For configurations with higher amplitudes and smaller wavelengths, cavitation occurs earlier than on the baseline wing but is confined to the regions behind the tubercle valleys for all α. Sheet cavitation did not appear on those wings. Because only the area behind the tubercle valleys is affected by cavitation on these wings, the lift can still be created at the tubercle tips. Since the simulation has shown that a major part of the lift is created in the affected region, it remains unclear whether the total lift created by these configurations under cavitation conditions is really higher than on an unmodified wing.
Nonetheless, it is likely that more uniform lift behaviour, due to the smoother separation of the wings with tubercles, enlarges a pump’s operating range, benefiting the application.
Overall, tubercles on axial flow pumps are expected to bring general improvement if a wide operation range, good efficiency, and suction head are required, especially at low speeds that are well below the operation point.
7. Summary and Outlook
Due to missing research on the application of tubercles in axial pumps, the aim of this study was to determine the possible influences of tubercles when used on axial pump vanes. The Goe11K profile was selected for the simulation because it is a slim profile with a high thickness reserve and is, consequently, well suited for use in axial pumps.
The Reynolds number was chosen to be
Re = 1.5 × 10
6 based on an existing axial pump tested previously. Four tubercled wings were selected based on the results of earlier studies [
7,
8], covering a good range of amplitudes and wavelengths. The simulation was set up as a transient and incompressible CFD simulation in OpenFOAM. The infinite wing approach was used. This setup was selected to keep the computational effort at a reasonable level, allowing the investigation of four tubercle configurations at a large α range. A mesh independence study was carried out to make sure the results were not reliant on the discretisation of the domain. The simulation results show only small improvements in the post-stall region due to the leading edge tubercles, while a significant reduction in the maximum lift was observed in the pre-stall region. This was attributed to the selected Reynolds number, the profile selection, and the infinite wing model. In the discussion, an aspect outside the simulation model was also considered, namely the “rotation stall”, leading to the conclusion that the benefit of tubercles at lower Reynolds numbers might be higher than in the simulation. Furthermore, the simulation results showed that the tubercled wings have a smoother separation behaviour. This gain, leading to a wider operation range, still comes at the cost of lower lift and higher drag at the design point.
Despite that, it was argued that tubercles could improve axial pumps used at lower Reynolds numbers when a suitable tubercle configuration is selected and a good suction head is needed at low speeds that are well below the design point.
Further studies should investigate whether these results can be transferred to applications in axial pumps as expected, or whether other effects not yet considered, such as centrifugal forces, dominate the flow. For this purpose, a test bench according to ISO 9906 is currently being set up at the Department of Fluid System Dynamics at the Technische Universität Berlin. This will be used to investigate the extent to which tubercles on the leading edge of the blades of a three-bladed axial pump impeller with the Goe11K profile used in the simulation change the efficiency, the head, the power consumption, and the cavitation behaviour.
Author Contributions
Conceptualization, M.D.; methodology, M.D. and F.N.; software, F.N.; validation, M.D., F.N. and P.U.T.; formal analysis, F.N.; investigation, M.D. and F.N.; resources, M.D. and P.U.T.; data curation, F.N. and M.D.; writing—original draft preparation, M.D. and F.N.; writing—review and editing, M.D. and P.U.T.; visualization, M.D. and F.N.; supervision, P.U.T.; project administration, M.D. All authors have read and agreed to the published version of the manuscript.
Funding
This research received no external funding.
Institutional Review Board Statement
Not applicable.
Informed Consent Statement
Not applicable.
Data Availability Statement
Data are contained within the article. Additional data and information from this study are available upon request from the corresponding author.
Conflicts of Interest
The authors declare no conflict of interest.
References
- Fish, F.E.; Battle, J.M. Hydrodynamic Design of the Humpback Whale Flipper. J. Morphol. 1995, 225, 51–60. [Google Scholar] [CrossRef] [PubMed]
- Van Nierop, E.A.; Alben, S.; Brenner, M.P. How Bumps on Whale Flippers Delay Stall: An Aerodynamic Model. Phys. Rev. Lett. 2008, 100, 54502. [Google Scholar] [CrossRef] [PubMed]
- Miklosovic, D.S.; Murray, M.M.; Howle, L.E.; Fish, F.E. Leading-Edge Tubercles Delay Stall on Humpback Whale (Megaptera novaeangliae) Flippers. Phys. Fluids 2004, 16, L39–L42. [Google Scholar] [CrossRef]
- Pedro, C.; Kobayashi, M. Numerical Study of Stall Delay on Humpback Whale Flippers. In Proceedings of the 46th AIAA Aerospace Sciences Meeting and Exhibit, Reno, NV, USA, 7–10 January 2008. [Google Scholar]
- Custodio, D. The Effect of Humpback Whale-like Protuberances on Hydrofoil Performance. Master’s Thesis, Worcester Polytechnic Institute, Worcester, MA, USA, 2007. [Google Scholar]
- Cai, C.; Zuo, Z.G.; Liu, S.H.; Wu, Y.L.; Wang, F.B. Numerical Evaluations of the Effect of Leading-Edge Protuberances on the Static and Dynamic Stall Characteristics of an Airfoil. IOP Conf. Ser. Mater. Sci. Eng. 2013, 52, 52006. [Google Scholar] [CrossRef]
- Johari, H. Effects of Leading-Edge Protuberances on Airfoil Performance. AIAA J. 2007, 45, 2634–2642. [Google Scholar] [CrossRef]
- Hansen, K.L.; Kelso, R.M.; Dally, B.B. Performance Variations of Leading-Edge Tubercles for Distinct Airfoil Profiles. AIAA J. 2011, 49, 185–194. [Google Scholar] [CrossRef]
- Pfleiderer, C.; Petermann, H. Strömungsmaschinen, 7th ed.; Springer: Berlin/Heidelberg, Germany, 2005. [Google Scholar]
- Riegels, F.W. Aerofoil Selections. Results From Wind-Tunnel Investigations; Butterworth & Co: London, UK, 1961. [Google Scholar]
- Schwarze, R. CFD-Modellierung; Springer: Berlin/Heidelberg, Germany, 2013. [Google Scholar]
- OpenCFD Ltd. Numerical Schemes, OpenFOAM Documentation. 2023. Available online: https://www.openfoam.com/documentation/user-guide/6-solving/6.2-numerical-schemes#x23-890115 (accessed on 8 June 2023).
- Dropkin, A.; Custodio, D.; Henoch, C.W.; Johari, H. Computation of Flow Field Around an Airfoil with Leading-Edge Protuberances. J. Aircr. 2012, 49, 1345–1355. [Google Scholar] [CrossRef]
| Disclaimer/Publisher’s Note: The statements, opinions and data contained in all publications are solely those of the individual author(s) and contributor(s) and not of MDPI and/or the editor(s). MDPI and/or the editor(s) disclaim responsibility for any injury to people or property resulting from any ideas, methods, instructions or products referred to in the content. |
© 2023 by the authors. Licensee MDPI, Basel, Switzerland. This article is an open access article distributed under the terms and conditions of the Creative Commons Attribution (CC BY-NC-ND) license (https://creativecommons.org/licenses/by-nc-nd/4.0/).


