Article

Development of Sewage Pumps with Numerical and Experimental Support

Chair of Fluid System Dynamics, Faculty of Mechanical Engineering and Transport Systems, Technische Universität Berlin, 10623 Berlin, Germany
*
Author to whom correspondence should be addressed.
Int. J. Turbomach. Propuls. Power 2023, 8(2), 18; https://doi.org/10.3390/ijtpp8020018
Submission received: 13 February 2023 / Revised: 3 May 2023 / Accepted: 21 May 2023 / Published: 2 June 2023

Abstract

:
Especially in the field of sewage pumps, the design of radial impellers focuses not only on maximum efficiency but also on functionality in terms of susceptibility to clogging by fibrous media. In general, the efficiency of sewage impellers is significantly lower than that of clear water impellers. These sewage impellers are designed with a low number of blades to ensure that fibrous media can be pumped. This paper describes the methodology of an optimisation for a sewage impeller. The optimisation is carried out on a semi-open two-channel impeller as an example. Therefore, a new impeller is designed for a given volute casing. Based on a basic design for given boundary conditions, the impeller is verified by means of numerical simulation. The manufactured impeller is then tested on the test rig to verify the simulation. With regard to the optical investigations, the clogging behaviour of the impeller is specifically improved over three different modifications in order to finally present an impeller with good efficiency and a low clogging tendency.

1. Introduction

Sewage pumps face increased operational problems due to clogging, for example, clogging within the impeller or the volute casing, according to increased contamination of solids in sewage. This represents the main reason for downtime, wear and manual labour in wastewater plants [1,2]. These solids, which are mainly responsible for pump clogging, are often tear-resistant fibrous materials, for example wet wipes. Figure 1 shows the components of a pump blockage, where tear-resistant fibrous materials are the main component for the pump blockage, which were found in [3].
In contrast to freshwater pumps, impellers with a low number of blades or special impeller shapes are deliberately used in sewage pumps to handle solids in sewage as efficiently as possible. Typical impellers for sewage conveyance are closed and semi-open multi-channel impellers, closed and semi-open single-channel impellers, as well as special forms such as the vortex impeller [4].
Up to now, pumps have been evaluated according to DIN EN ISO 9906 only with regard to their clear water values. There is no general criterion about the susceptibility to clogging for pumping sewage containing solids [5].
Compared to the described classical approach, the functional performance test has already been introduced in [6], which tests both the efficiency η and the clogging susceptibility of pumps.
In this paper, the methodology of an optimization for a sewage impeller is described. As an example, a semi-open two-channel impeller is designed. By means of simulation and functional performance tests on the test rig, a hydraulic system is to be developed, which, in addition to good efficiency, should have a low susceptibility to clogging. A classification of the susceptibility to clogging for the semi-open two-channel impeller is carried out using the evaluation criteria of the long-time functional performance test.

2. Materials and Methods

2.1. Basic Design

The new impeller is designed as a semi-open two-channel impeller. In contrast to closed impellers, which have both a hub and a shroud, semi-open impellers do not have a rotating shroud. For this impeller, the shroud is installed stationary in the housing, which creates a small gap between the impeller and the volute casing. This gap shall assist the discharge of added fibrous materials.
The impeller should be designed as a radial impeller and be within a range for the specific speed of nq = 30…50, which is typical for radial sewage impellers [7]. The specific speed nq is calculated according to [8] as follows, using the speed n (1/min), the flow Q (m3/s) and the head H (m):
n q = n Q H 3 / 4
The design point for this impeller is given in normalised form, as the main focus in this paper is on the methodology of optimisation. The design point is continuously given for the flow with Qdesign = 1.0; analogously, the head results in Hdesign = 1.0.
One requirement of the impeller is the maximum variability for changing the leading-edge geometry of the blades. Previous investigations have shown that impellers with classic leading edges often tend to increase clogging in two-channel impellers. The aim for this impeller is to be able to incorporate a 3D-printed geometry to connect the leading edges of the impeller, so-called connected leading edges (CLE), with maximum variability for the basic impeller. The classic impeller with two leading edges and a possible design of CLE are shown schematically in Figure 2.
The upper part of Figure 2 shows a classic approach for a semi-open two-channel impeller. The lower part of the figure shows two variants of a possible meridional contour for CLE: (A) shows a convex shape, which is intended to follow the course of the blade widths of the original blades. (B) shows a meridional contour for CLE that is flat and parallel to the suction side of the pump.
For the basic design of the impeller, the shape of two leading edges is chosen according to the upper part of Figure 2. The impeller is designed for the maximum specific speed according to the said range with a specific speed of nq,design = 50, since a shift of the best efficiency point (BEP) due to the CLE in the direction of smaller flows is expected. This shift of the best efficiency point towards smaller flows is caused, among other things, by the fact that the effective area of the impeller suction side due to a decreasing inlet diameter as well as the blade inlet angle β1 are reduced. Accordingly, a steeper characteristic curve is to be expected for the impeller with CLE compared to the impeller with two leading edges [4].
The impeller is designed for a given sewage volute. Previous investigations of this volute casing have shown that it is particularly resistant to clogging. This is necessary in order to evaluate the impeller in terms of susceptibility to clogging. Clogging in the volute casing has a negative influence on the general susceptibility of the hydraulic and thus on the measurement result, because it is only possible to measure the total amount of wet wipes within the pump after the end of the test.
The spiral contour of the volute casing is circular. The built-in stationary shroud is used for all measurements.
The theoretical throttle curve is calculated for the impeller according to [8]. However, this is only a reference and is verified by the subsequent simulation and the measurement results of the tests.

2.2. Numerical Support

The impeller with two leading edges is simulated before manufacturing to evaluate the design.
For the numerical simulation, the software ANSYS CFX is used. For the impeller, a structured mesh is used. The volute is meshed as an unstructured mesh. The setup including the mesh is shown in Figure 3. Details on the mesh qualities are shown in Table 1.
The simulation is calculated in a stationary manner in order to shorten the calculation time. The shear stress transport model (SST) is chosen as the turbulence model in order to generate good resolution and convergence both in near-wall areas and free streams [9].
Some simplifications are applied for the simulation: The impeller, which is designed as a semi-open two-channel impeller, is simulated without the sidewall gap, as primarily the simulation is used for estimating the general design. The same applies to the gap between the impeller and the stationary shroud, as the size of the gap has an influence on the discharge of the wet wipes, which must be determined experimentally. Likewise, disk friction losses are not represented in their entirety by the setup.
Accordingly, the focus of the simulation is on verifying the basic geometry of the impeller. It can be assumed that the simulated results are better than the manufactured impeller due to the neglected losses. This applies in particular to the efficiencies at higher volume flows, as the hydraulic losses for higher volume flows have greater influence.
Ten operating points are simulated. Of these, the design point as well as three operating points to smaller flows compared to the design point and six points to higher flows compared to the design point are simulated.
Since the impeller is a semi-open two-channel impeller simulated without a gap, the shroud is assumed to be a counter-rotating wall. In addition, the shaft-hub connection of the hub is assumed to be a free-slip wall, as this does not exist in the prototype, so that the described CLE can be installed.

2.3. Impeller Prototyping

The basic impeller with two leading edges is made of cast iron, the only design change compared to the simulation is the shaft–hub connection. The impeller is manufactured in such a way that a 3D-printed attachment can be placed on the central shaft screw to connect the leading edges.
The impeller manufactured from cast iron is shown in Figure 4.
The attachments are made from plastic polylactic acid (PLA) using a 3D printer, as this manufacturing is relatively inexpensive and fast concerning design changes. In addition, previous tests have shown that PLA exhibits sufficient strength when used with artificial sewage.

2.4. Test Procedure

The test rig for functional performance of the Chair of Fluid System Dynamics at the Technische Universität Berlin has two tanks, the wastewater tank (WWT) and the freshwater tank (FWT), each with a volume of 4 m3.
Two different clogging tests can be carried out on the test rig using tear-resistant wet wipes—the functional performance test and the long-time functional performance test. The test rig has pinch valves, which make it possible to switch between the different tests and shut off the pump. In addition, a filter is installed in the FWT, which is decoupled from the system and removes all residual fibres in the test rig. The results of this paper are generated with the long-time functional performance test. Tear-resistant wet wipes according to the contamination classes in Table 2 are used for the tests.
Figure 5 shows the wet wipes used for the experiment. These have the dimensions of 22 × 30 cm and a surface weight of 60 g/m2.
Generally, for both tests, the pumps are tested at their BEP, as well as at 80% of the BEP in partial load and at 120% of the BEP in overload. A total of nine measurements per impeller are thus carried out on the test bench.
  • Long-time functional performance test:
The long-time functional performance test describes the 60 min pumping of the artificial wastewater in a loop from the WWT to the WWT, shown in Figure 6. In the process, the measured values of the head, the flow and the electrical power are recorded every second. The efficiency η is determined using these data. After the test, the pump is shut off and opened, and the remaining wet wipes are documented and removed. From this, the degree of long-time functional performance (DLTF) is determined according to Equation (2):
D L T F = 1 2 η t e s t , 0 60 m i n η C W , O P + 1 2 m W , t o t a l g m W , p u m p g m W , t o t a l g
Here, the first part of the DLTF represents the ratio of the averaged efficiency over the 60-min measurement period ( η t e s t , 0 60 m i n ) to the clear water efficiency at the corresponding operating point ( η C W , O P ) . The second term of the DLTF represents the ratio of the difference between the total amount of wipes supplied (mW,total) and the wipes remaining in the pump (mW,pump) to the total amount of wipes supplied.
A DLTF of 0 indicates that the impeller is completely clogged, and conveying is no longer possible, while a value of 1 describes clog-free operation. Based on the tests already carried out, a DLTF of at least 0.7 is required for the prototype, as it has been shown that impellers above a value of 0.7 exhibit good clogging behaviour and can handle the added fibrous material well.
Figure 6. Long-time functional test cycle.
Ijtpp 08 00018 g006

2.5. Optical Access

The test rig has an optical access on the suction side, which is similar to the optical access presented in [10]. By means of an endoscope, an LED light ring and a high-speed camera, it is possible to obtain closer insights at the impeller inlet during operation. Figure 7 shows the installed access.
As an additional measurement method, this approach provides an opportunity to describe the interaction between the flow and the wet wipes during operation and to make targeted changes in the geometry from the results. For these tests, the camera records at 1000 frames per second (fps) over a period of 20 seconds with a resolution of 768 × 768 pixels. The test cycle is analogous to the long-time functional performance test, but the contamination class is different. For these tests, ten wet wipes per m3 of water are used, as it has been shown that with this quantity, initial clogging behaviour can be easily seen, while there are not too many wipes to impair the optimal measurement.
The endoscope has a diameter of 10 mm and a viewing direction of 45°. Due to the resulting installation position, this angle ensures that the wipes do not clog on the endoscope and thus a uniform supply of the wipes into the inlet of the pump is possible. The field of view is 88°. The LED light ring consists of eight individual LEDs, which provide a luminous flux of 5595 lumen each.

3. Results and Discussion

3.1. Results—Simulation

The simulation results in relation to the theoretical design curve are shown in Figure 8. For the simulation results, only the throttle curves are compared with each other, as an efficiency estimate was not carried out.
The results of the simulation show the same trend of the design characteristic. The simulated throttle curve shows a slightly higher level and is superior to all calculated operating points of the design throttle curve. This is due, among other things, to the simplifications of the simulation described above. This can also be said about the efficiency, for which a value of ηBEP,CFD = 79.5% is achieved in the simulation. However, it can be seen that the BEP of the hydraulic with QBEP,CFD = 1.2 is slightly larger than the design point.
Overall, this comparison shows that the design is well represented by the simulation with regard to its design characteristic. Due to the simplified assumptions, the efficiency reaches a higher value in the simulation than is to be expected in the measurement. Especially not all hydraulic losses are taken into account by the simplifications. Since these increase with higher flows, a shift of the optimal efficiency is to be expected with smaller flows. Likewise, a reduced efficiency at the BEP of the manufactured impeller can be assumed.

3.2. Results—Modification 0

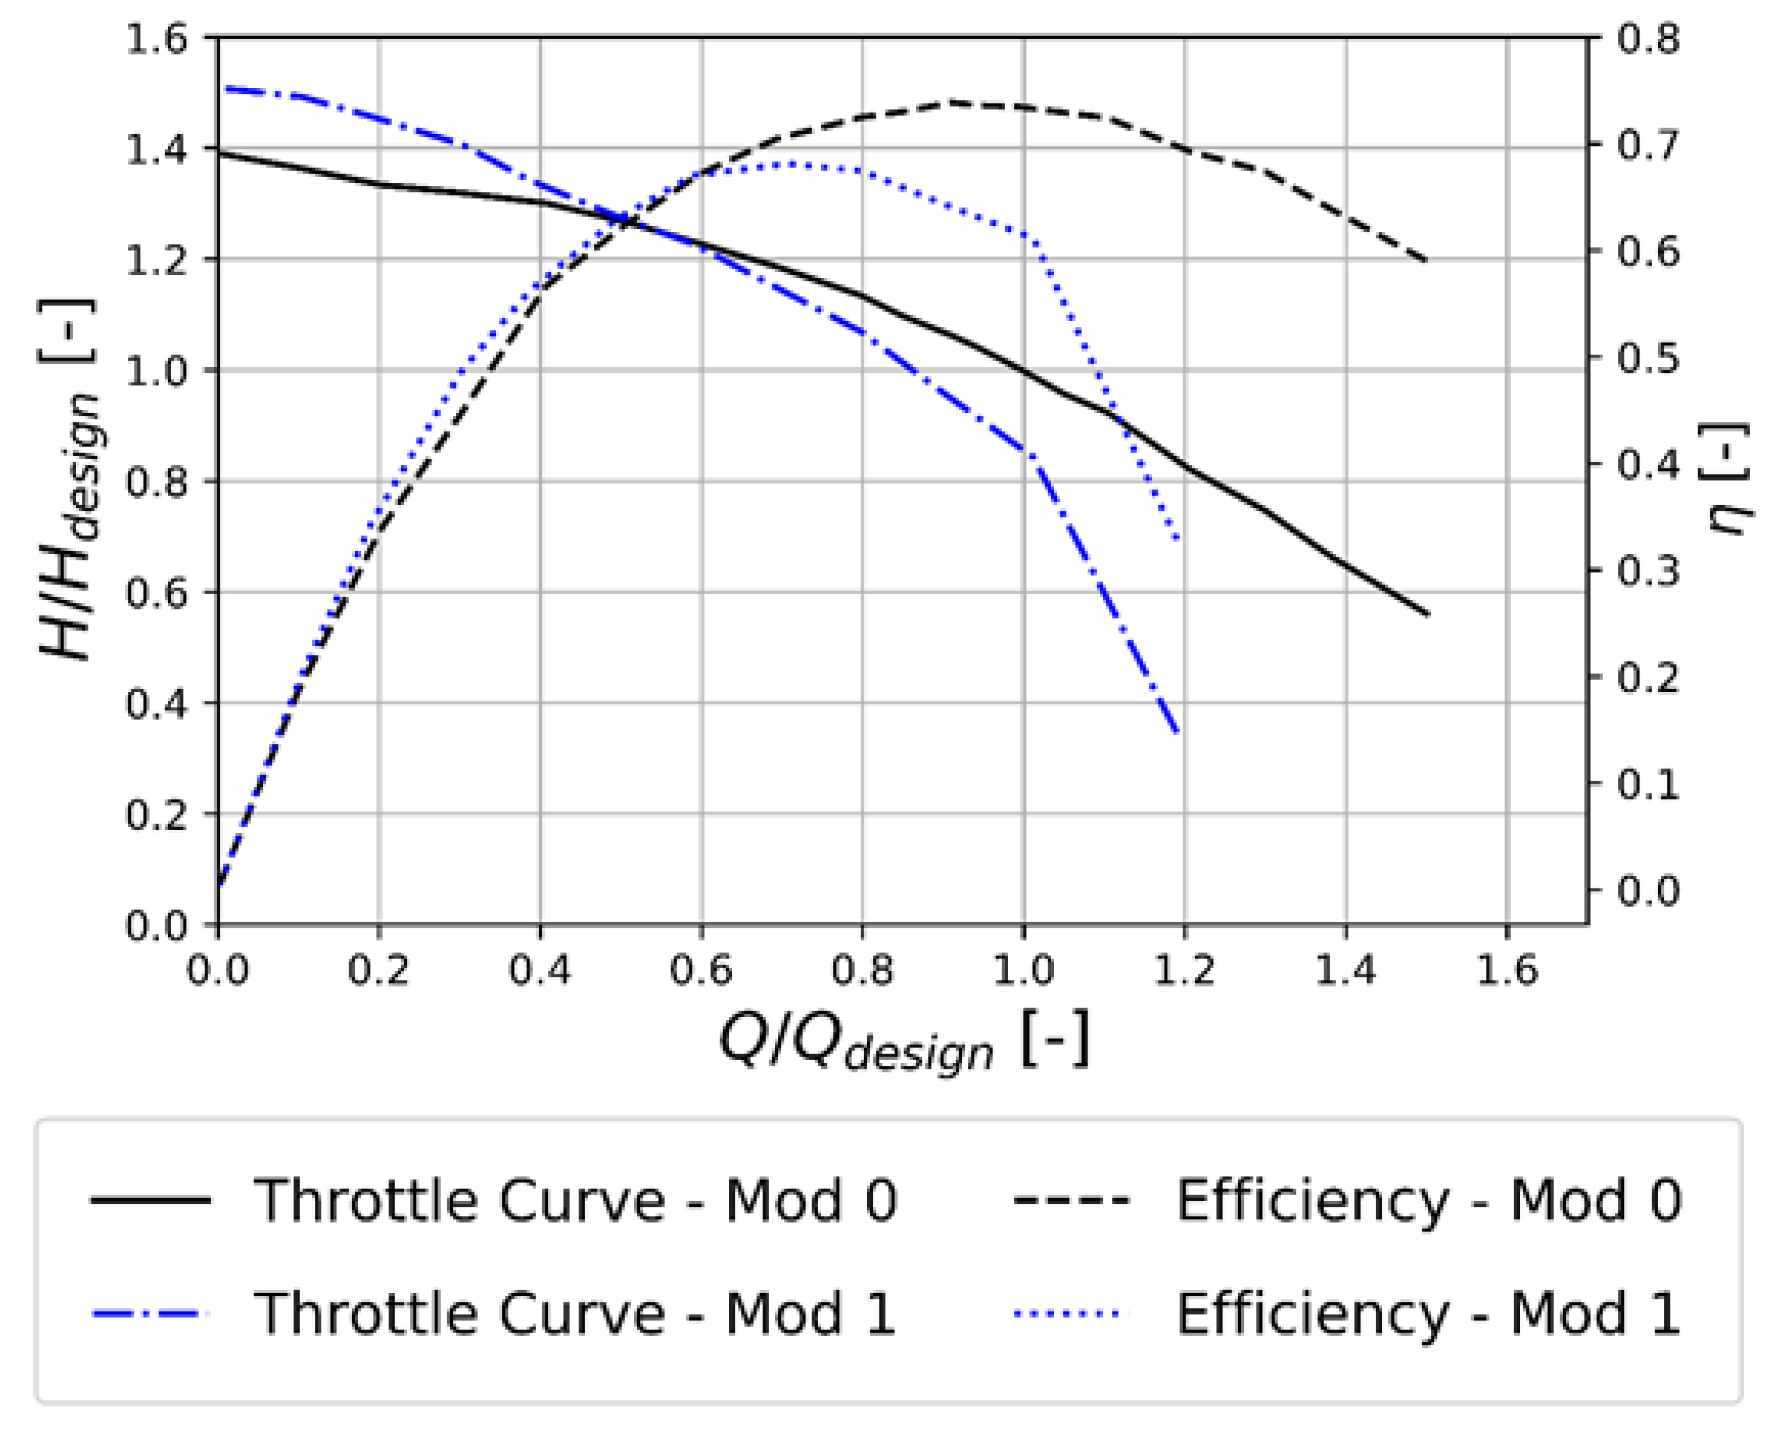
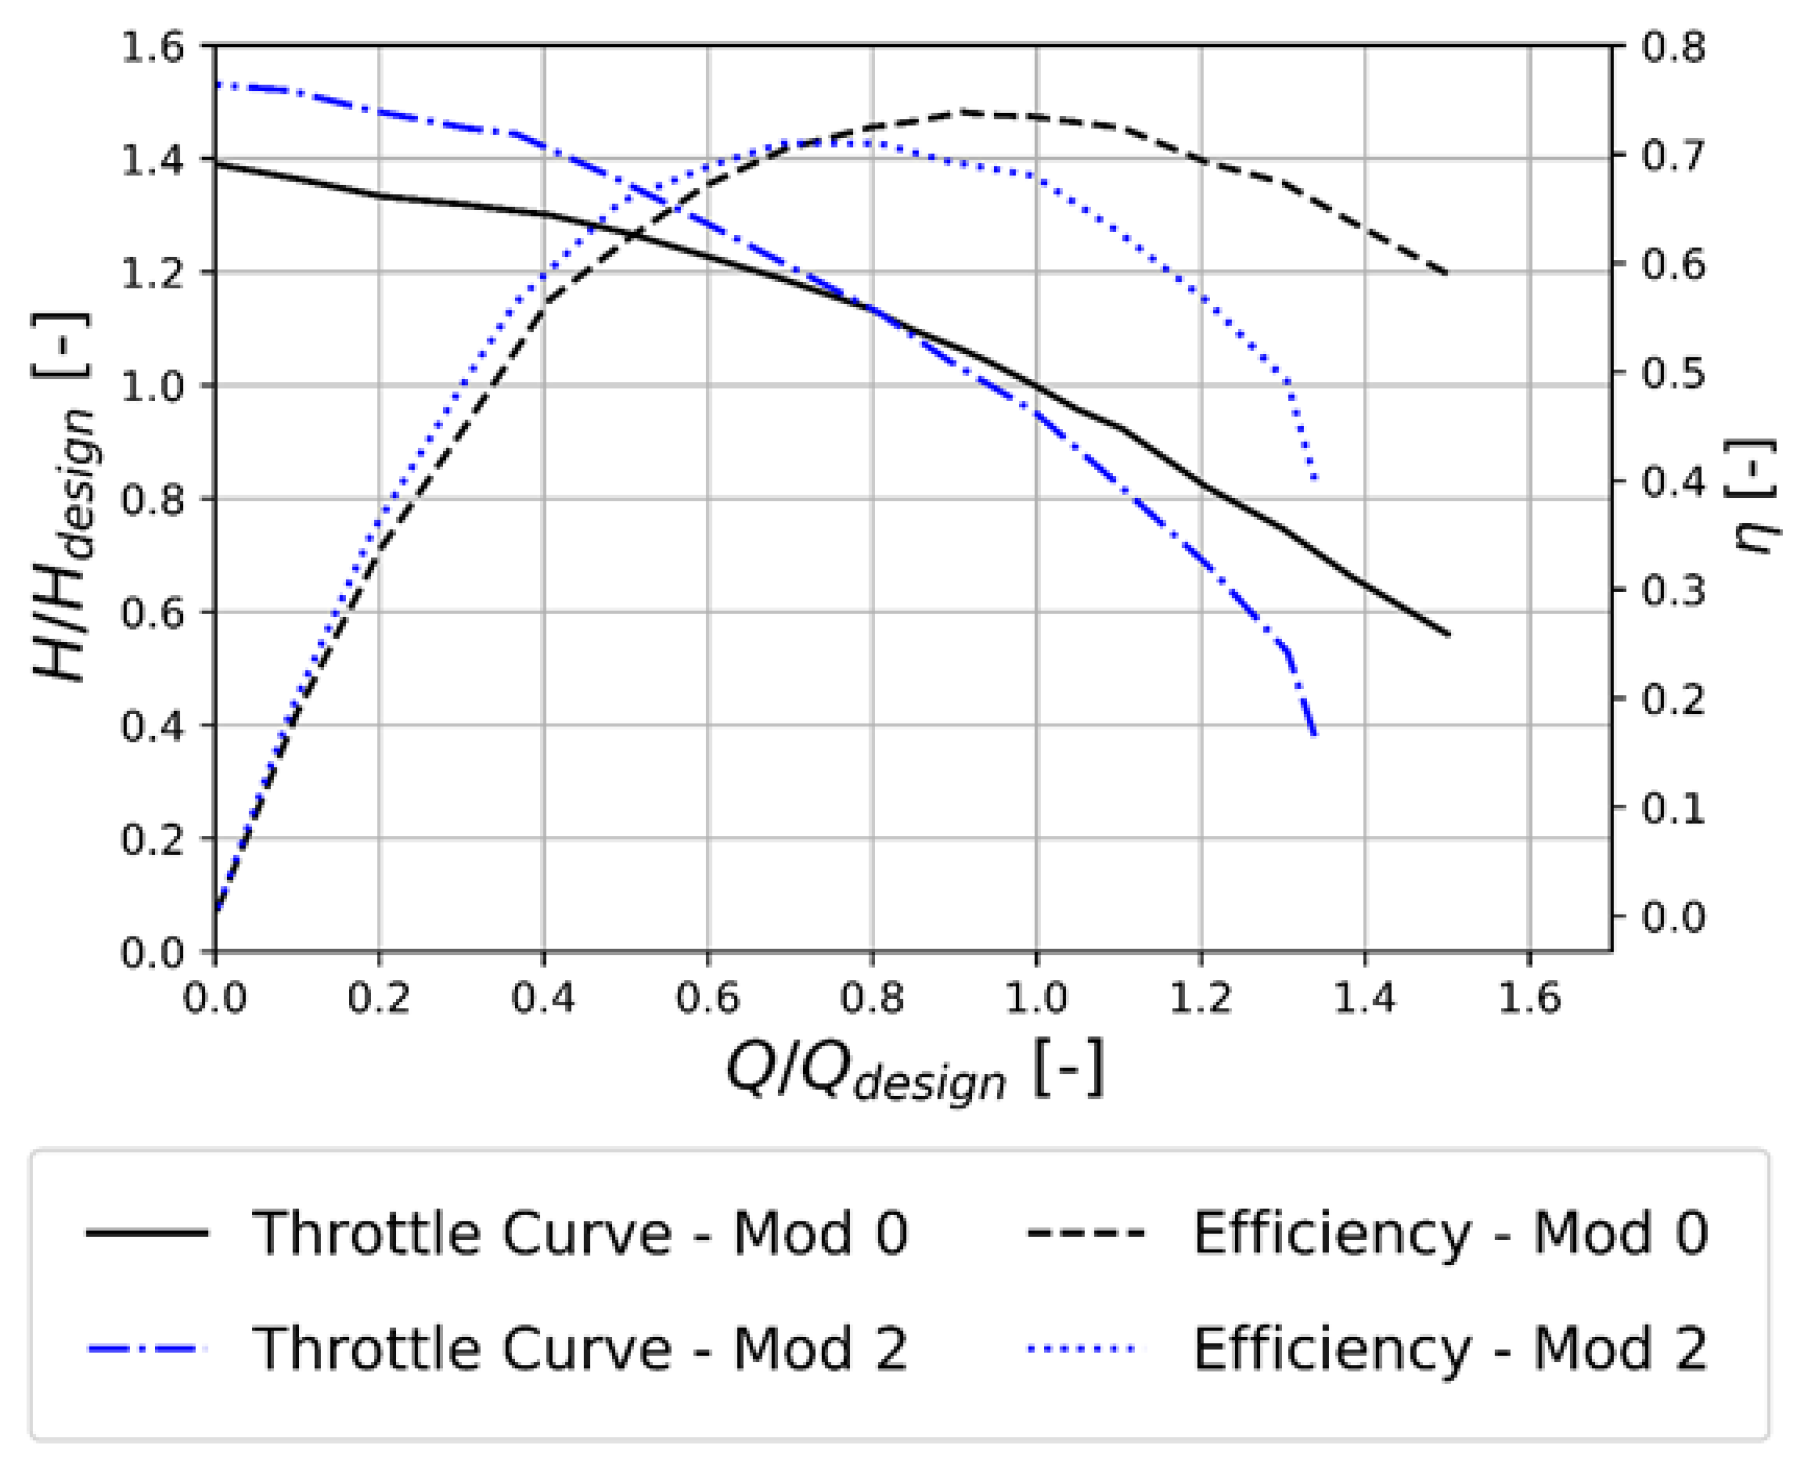
Figure 8 additionally shows the measurement of the characteristic curves of the impeller with two leading edges on the test bench in relation to the simulation results as well as the design throttle curve.
The measured characteristic curves show the same trend of the simulation around the design point. Especially in the direction of smaller flows of the design point, the simulated and the measured throttle curves show an almost identical trend.
For strong partial load and overload, the measured throttle curve deviates from the design throttle curve. However, the design throttle curve only represents a trend and is mainly to be assumed for the range of best efficiency.
The maximum efficiency of the measured impeller is around 5% lower than the best efficiency value of the simulation. The BEP of the impeller is thus at a flow of QBEP,0 = 0.9 with an efficiency value of ηBEP,0 = 73.9%. This deviation is again due to the simplified assumptions of the simulation. This BEP results in a specific speed of nq,0 = 48, which, taking into account the boundary conditions for the specific speed, provides a good starting point for the further process of inserting a printed part for CLE.
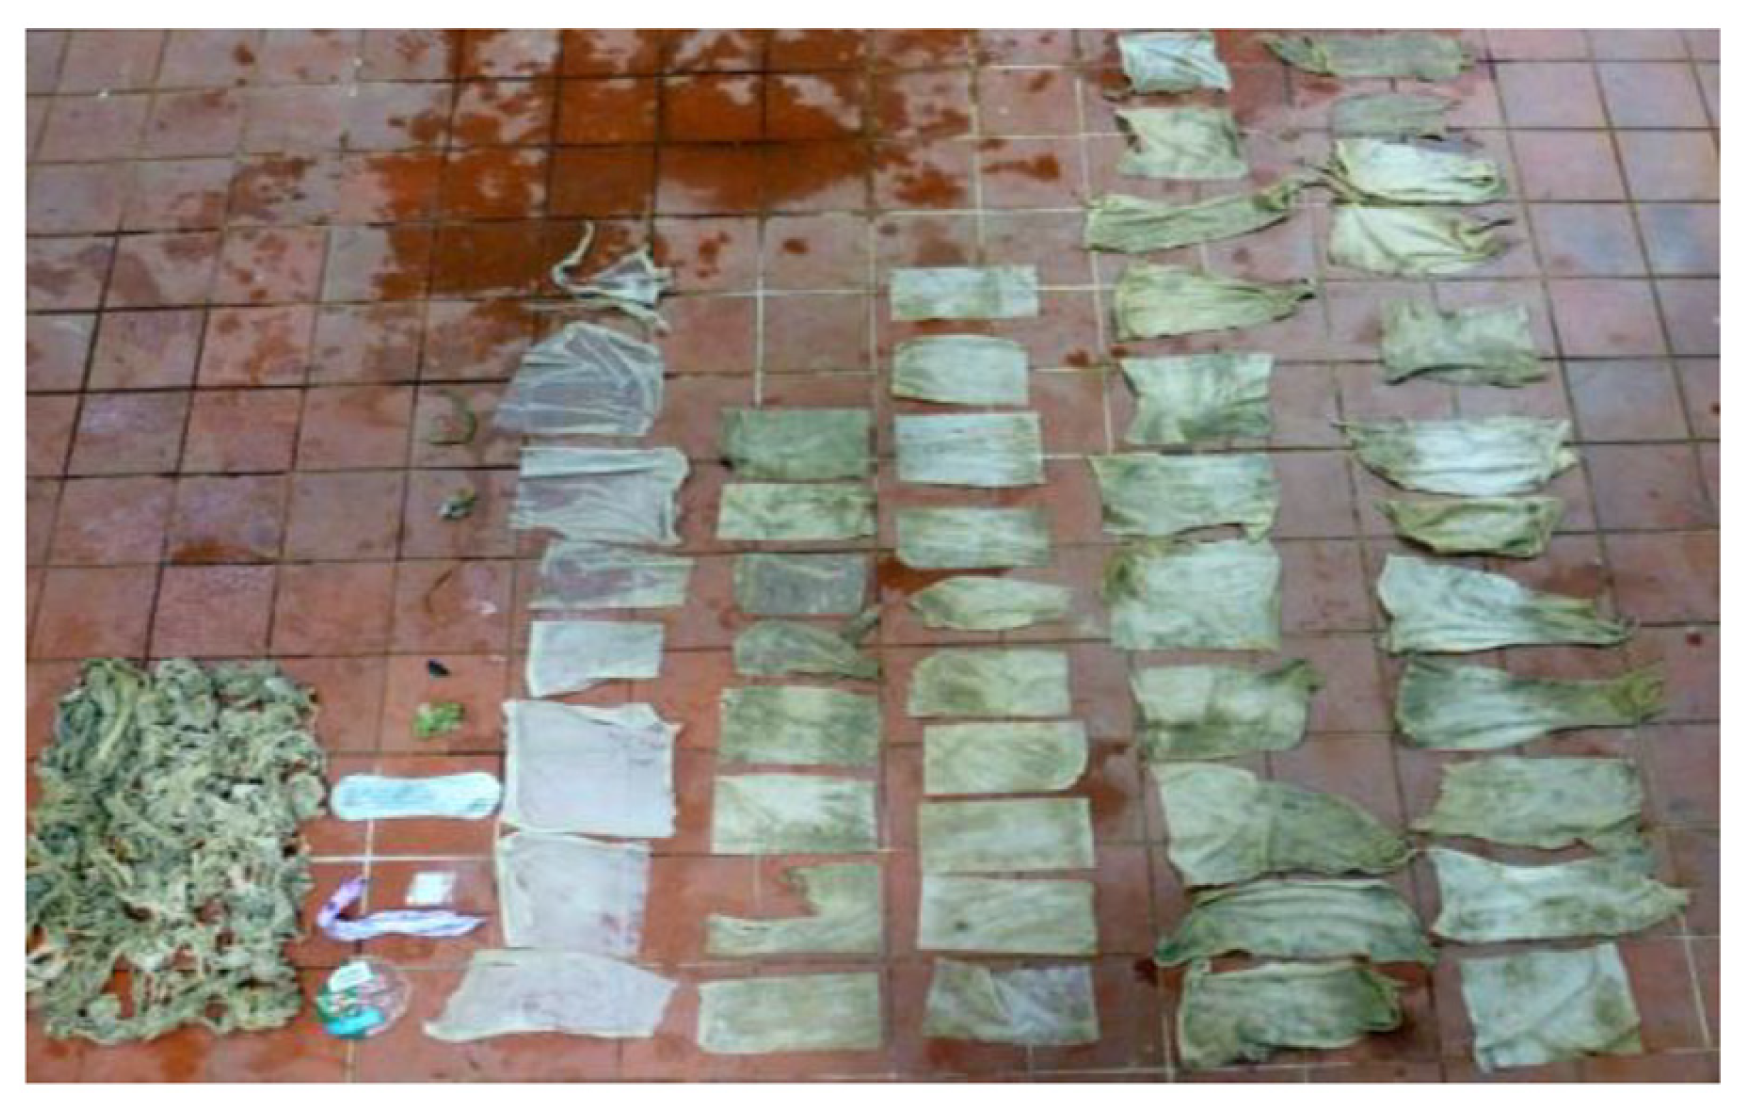
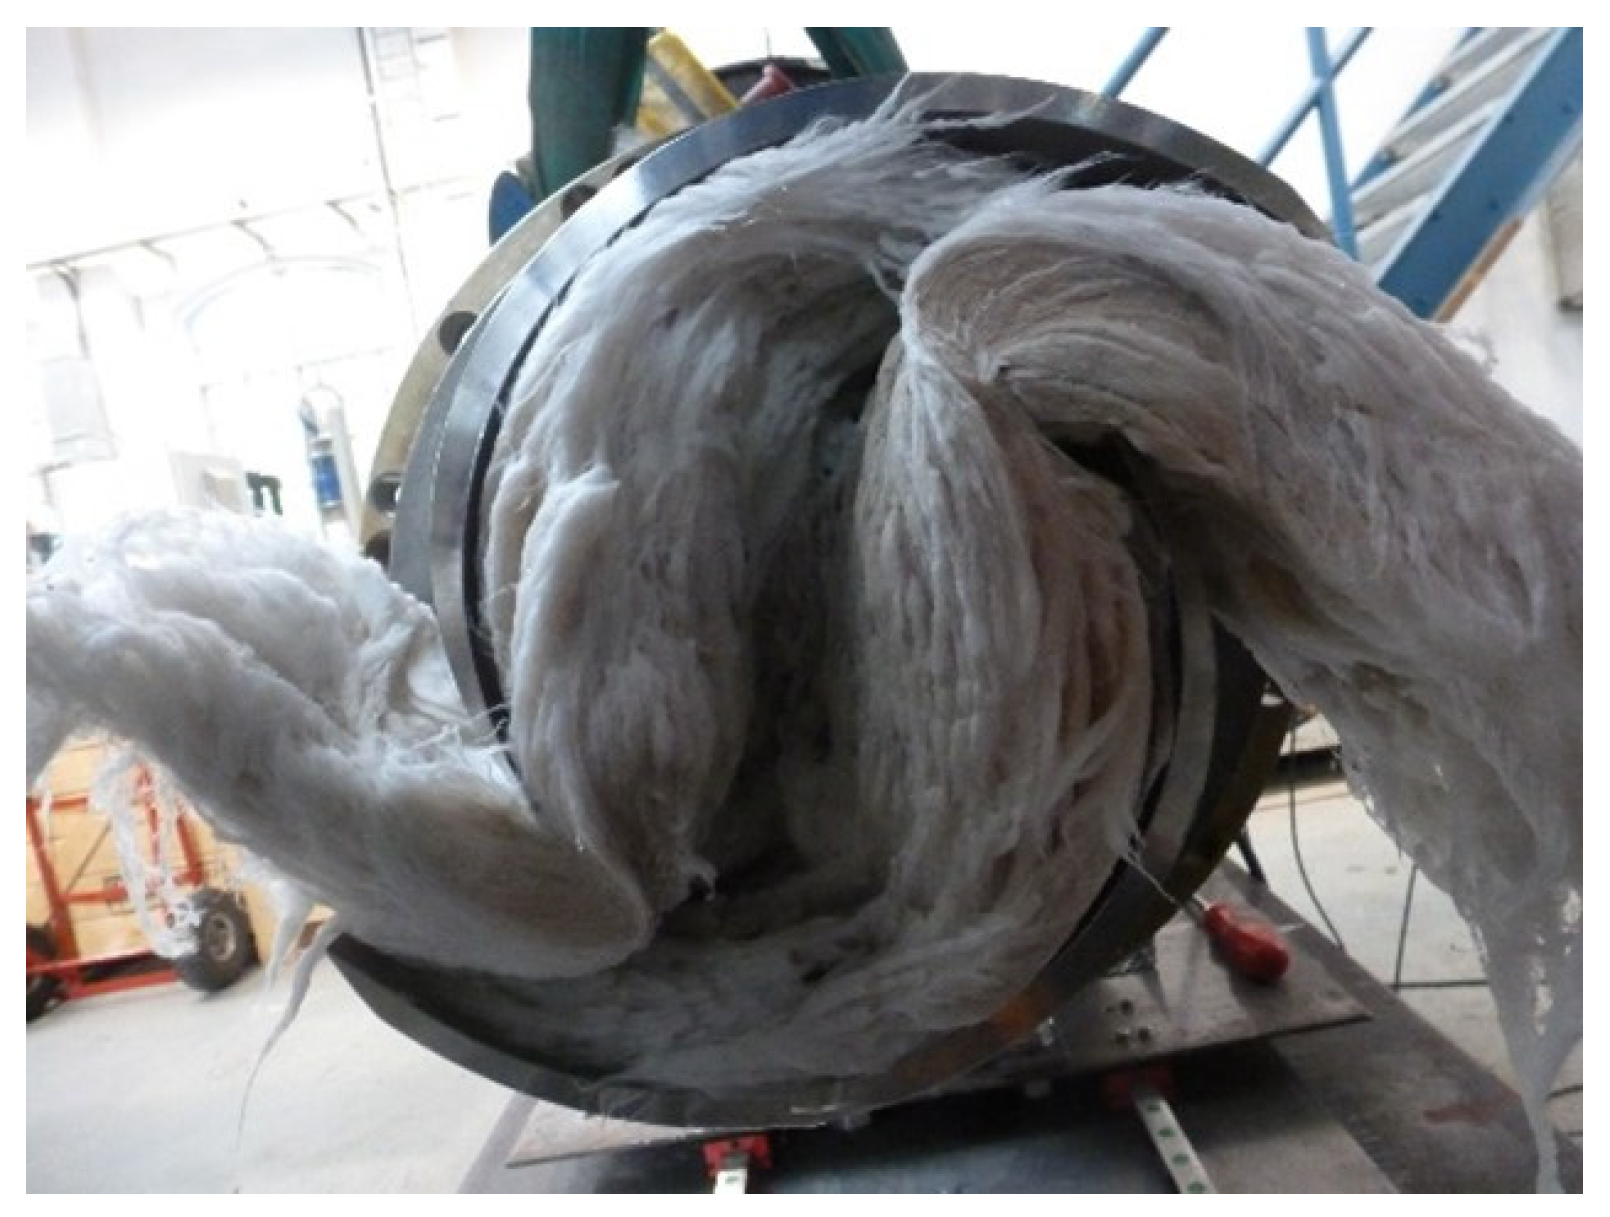
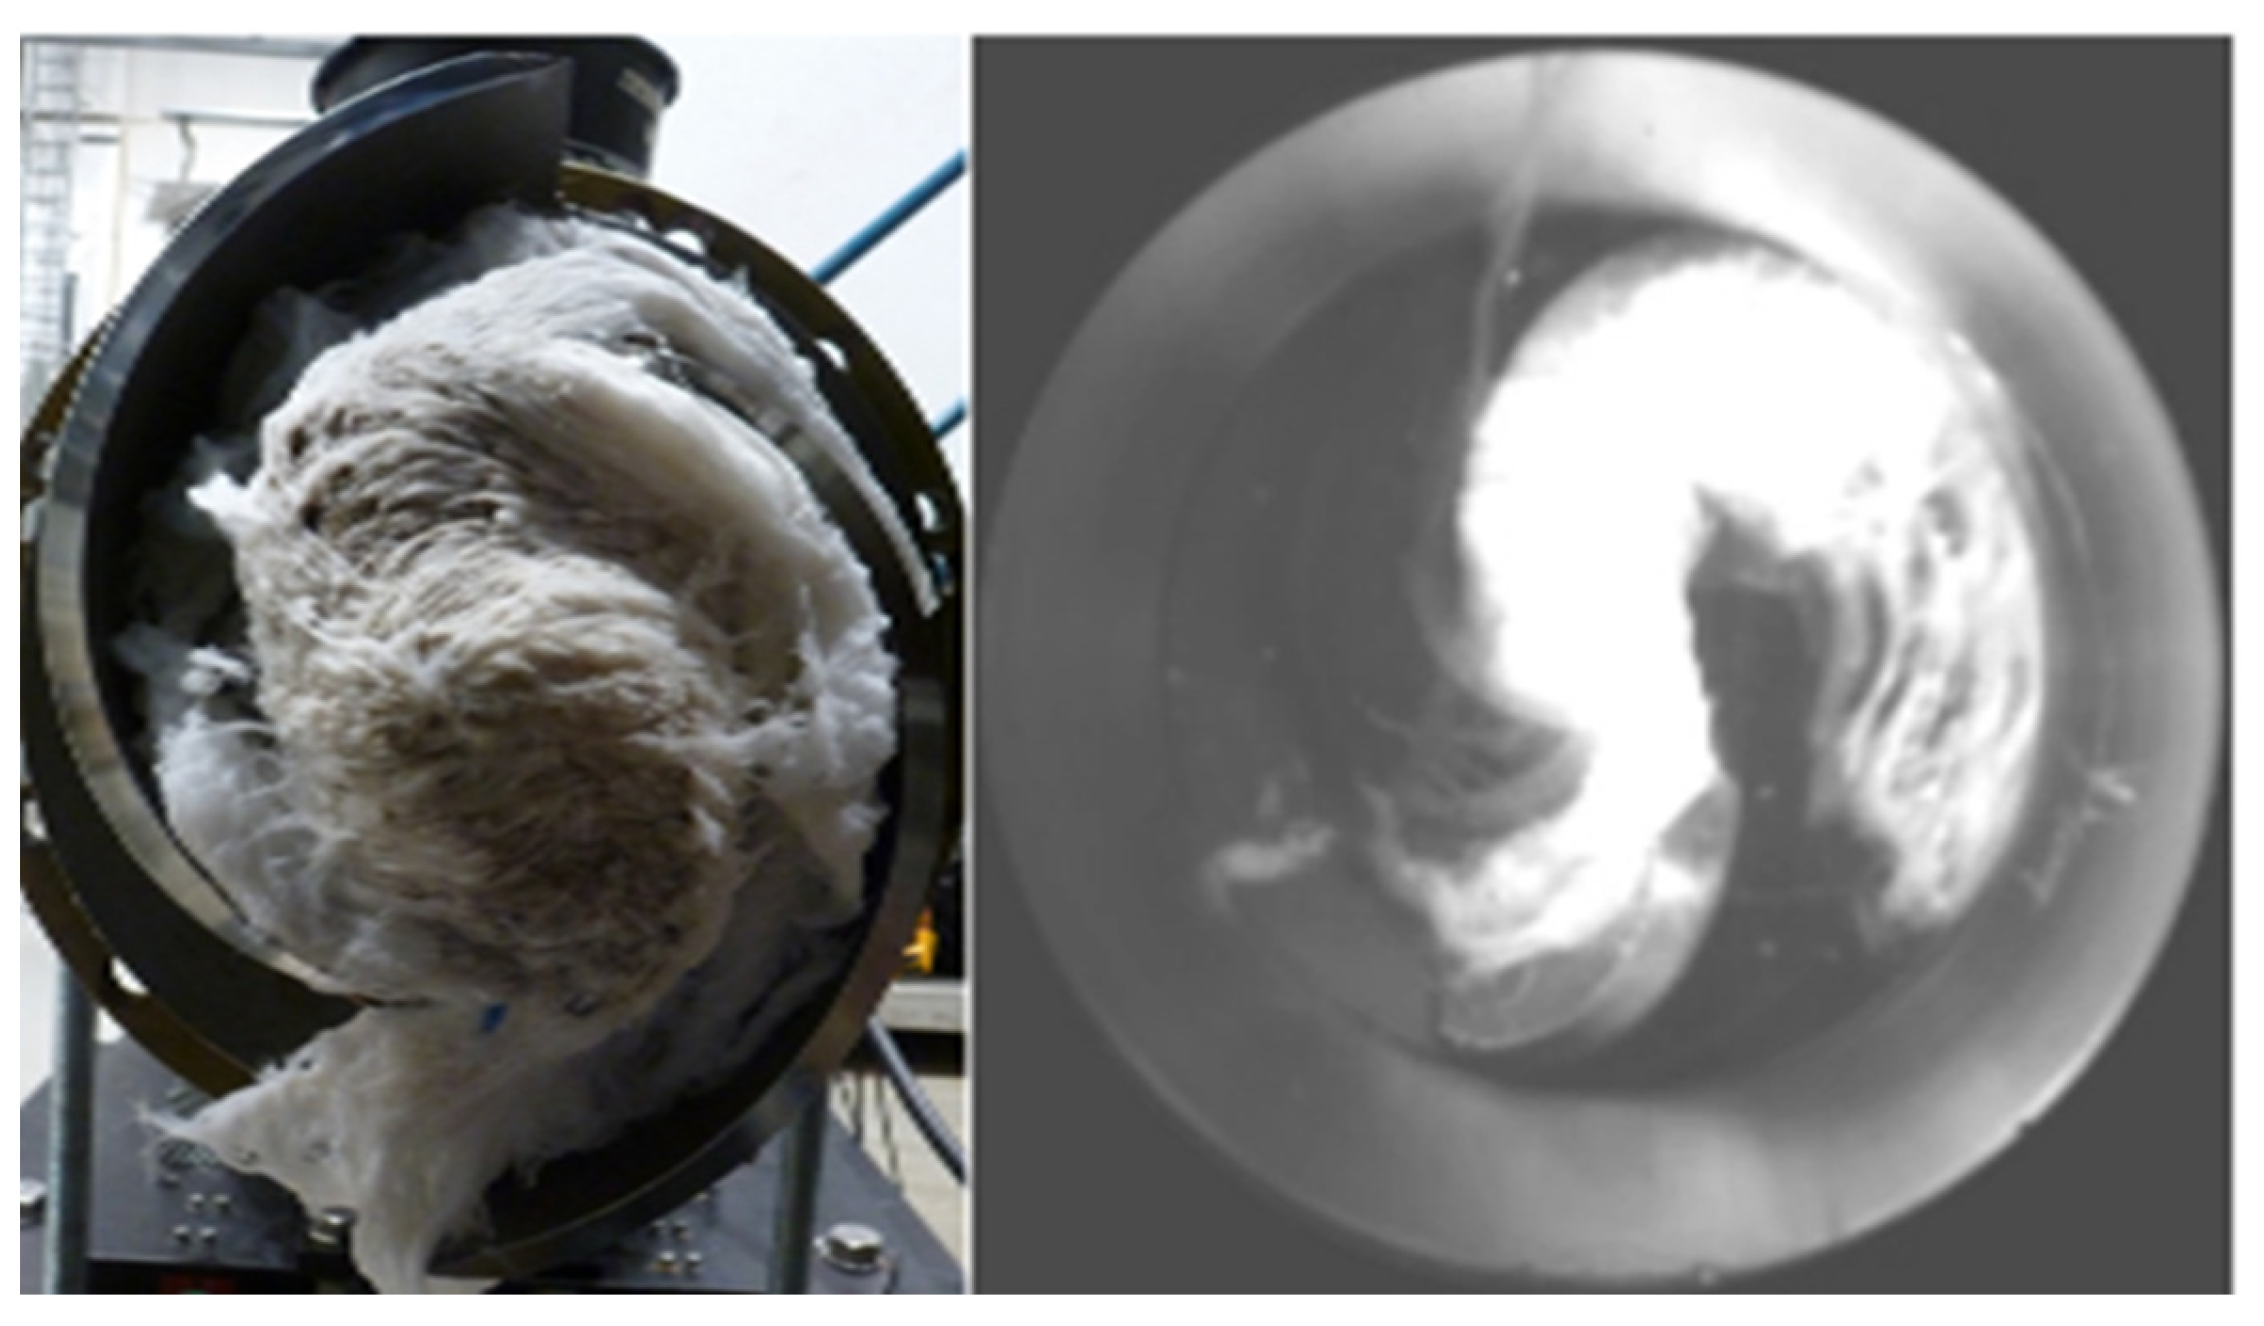
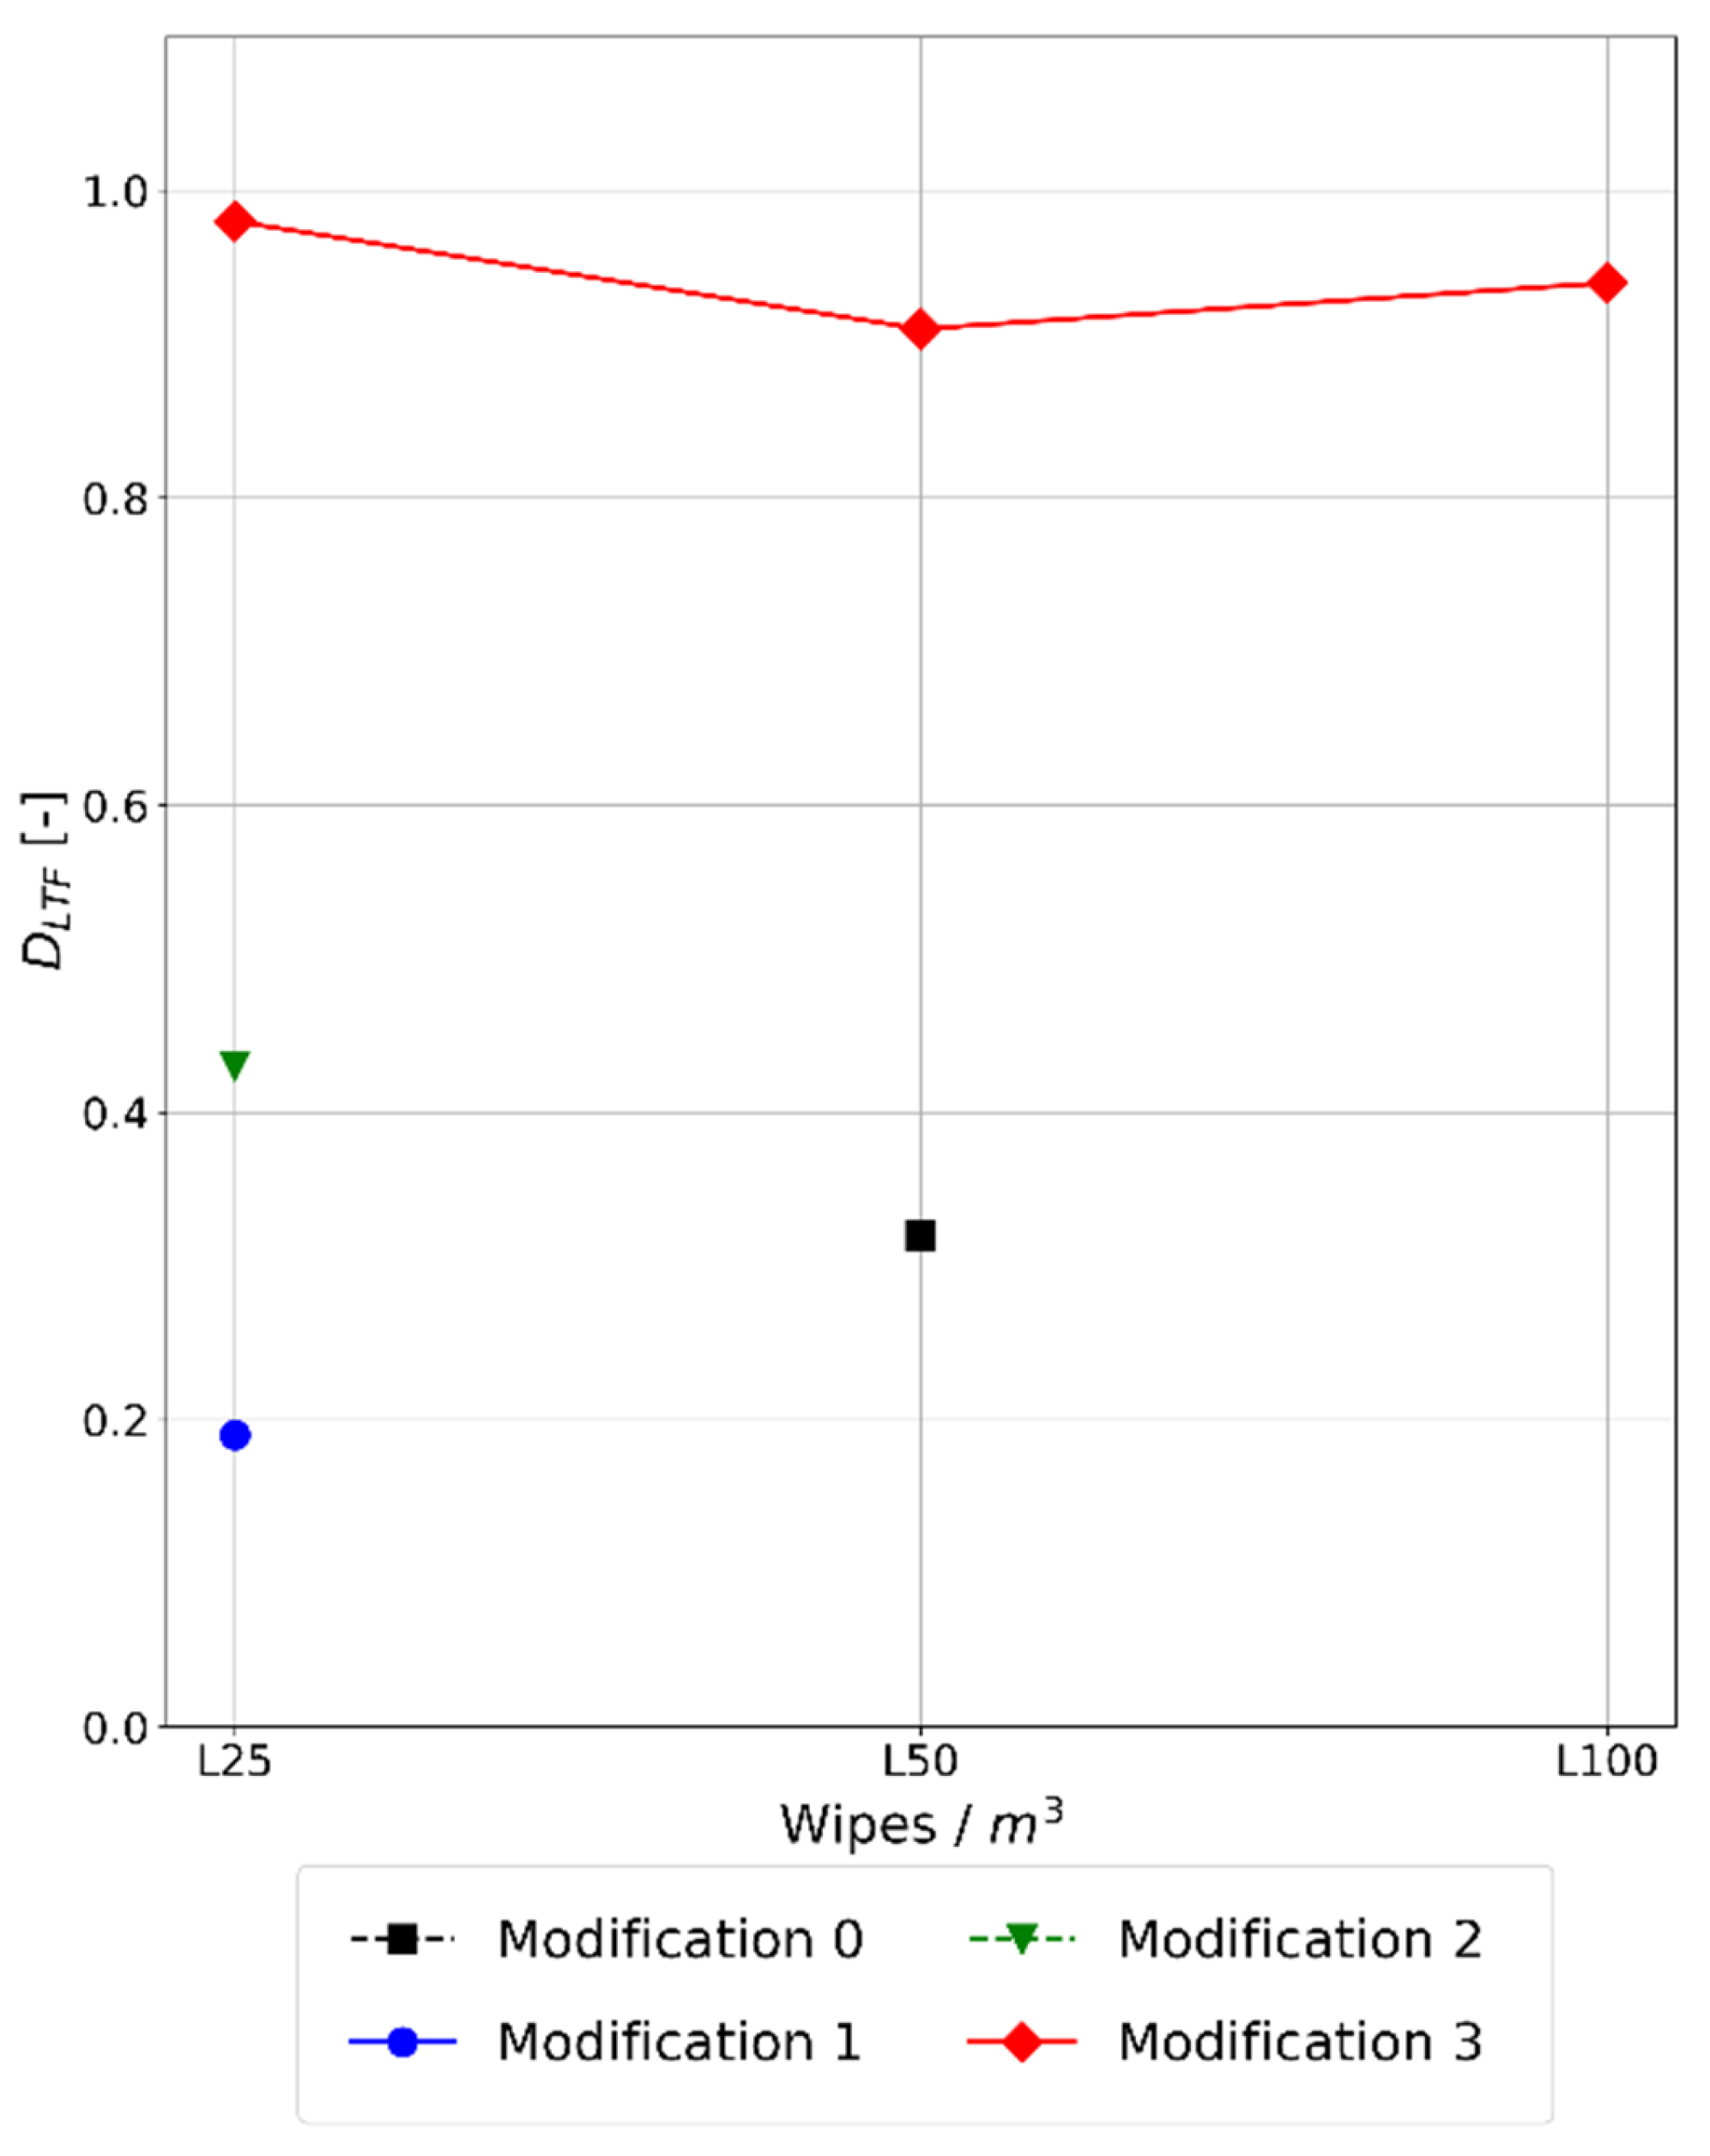
To obtain an impression of the susceptibility to clogging of the basic impeller, the long-time functional performance test with medium contamination (L50) is carried out for the impeller in Modification 0.
The impeller clogs with a result of DLTF,0 = 0.32. The amount of wet wipes removed from the impeller at the end of the test corresponds to 72% of the amount of wet wipes supplied. The clogging has accumulated at the leading edges during the test and has grown from there. The clogging inside the impeller after the end of the long-time functional performance test can be seen in Figure 9.
This impeller geometry is not able to discharge the wet wipes. Due to the high susceptibility to clogging, no further tests of the impeller are carried out.

3.3. Results—Optimization

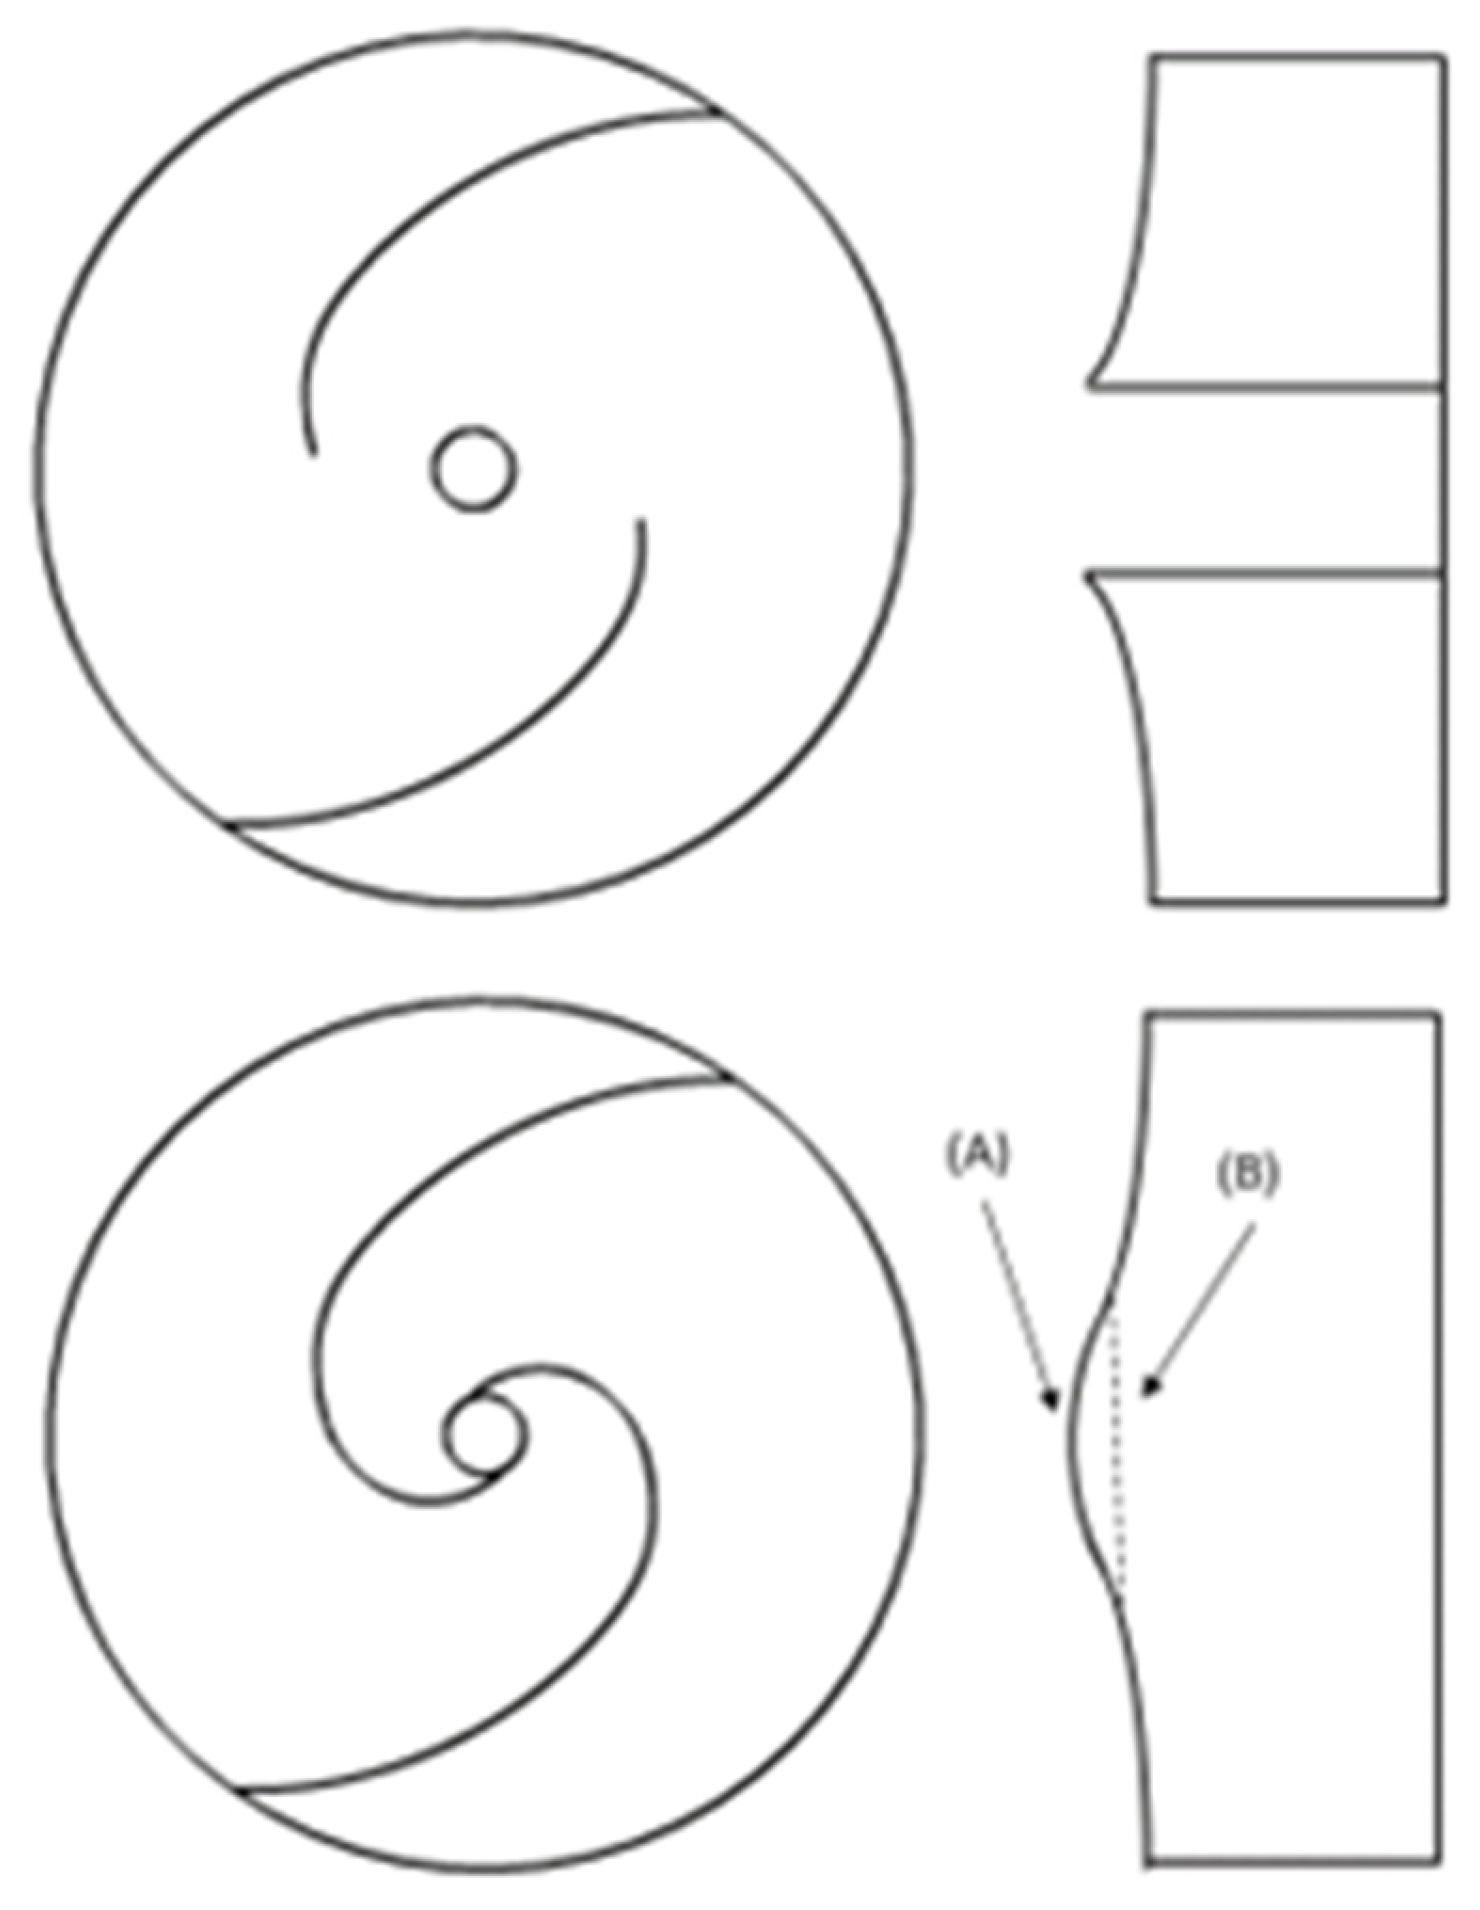
Modification 1: For the first modification, a printed part for the CLE with a strongly convex shape in the meridional section as shown in Figure 2, example (A), is used, which follows the width progression of the two blades. The characteristic curves of modification 1 compared to modification 0 are shown in Figure 10.
The characteristic curves of Modification 1 show that the BEP shifts towards smaller flows due to the CLE. The optimum efficiency of ηBEP,1 = 68.1% is achieved for a flow of QBEP,1 = 0.7. The resulting specific speed is nq,1 = 37 and is therefore within the specified limits.
The long-time functional performance test with low contamination (L25) at the BEP shows a poor clogging result with a DLTF,1 = 0.19, which is insufficient. Overall, 91% of 310 g of supplied wet wipes are absorbed. A conveying of the wipes does not seem possible due to this result of the long-time functional performance test.
The result of the long-time functional test suggests that conveying of the wet wipes cannot take place with high numbers of wet wipes arriving in the impeller at the same time, which clogs the impeller. In addition, the convex shape of the CLE extends very far forward into the inlet that the wipes cannot be discharged via the gap between the impeller and the volute casing as soon as the clogging has reached a certain degree.
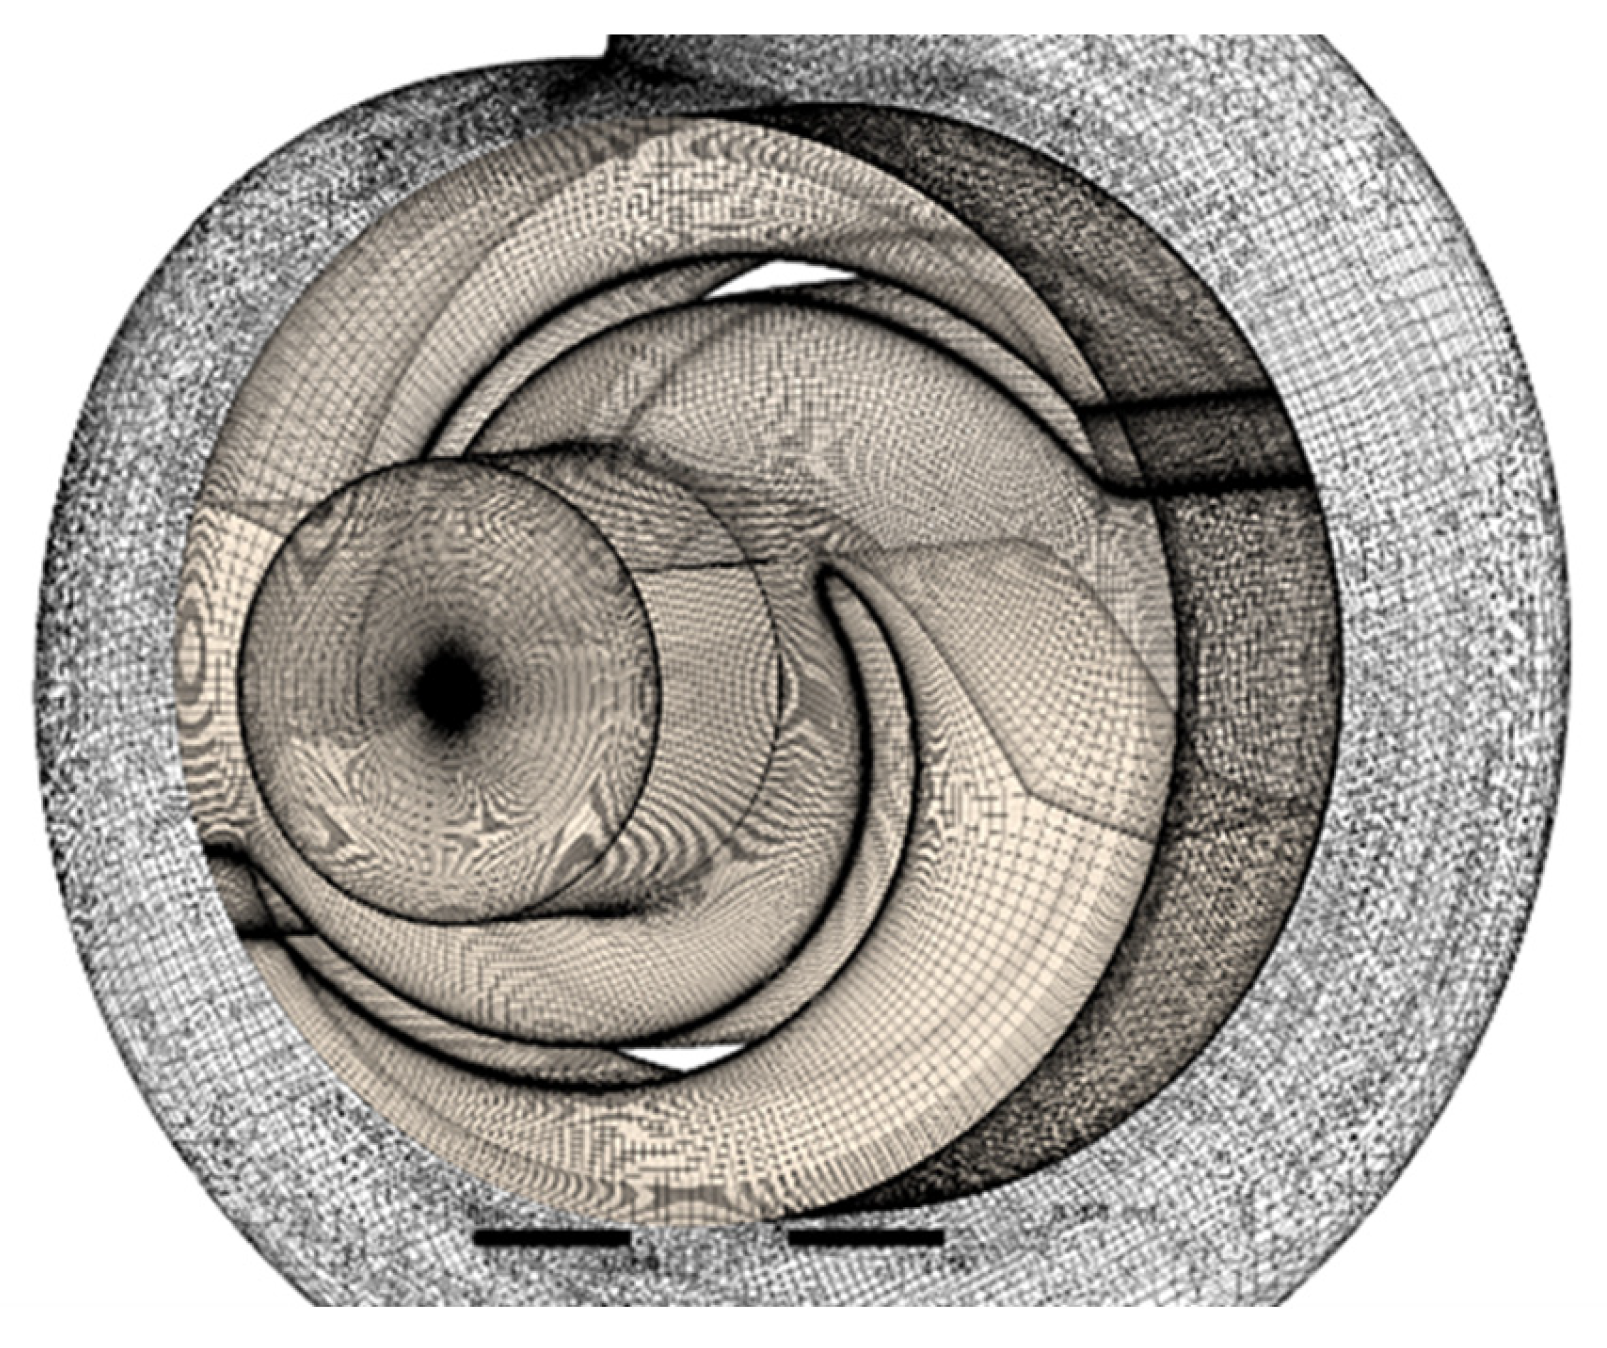
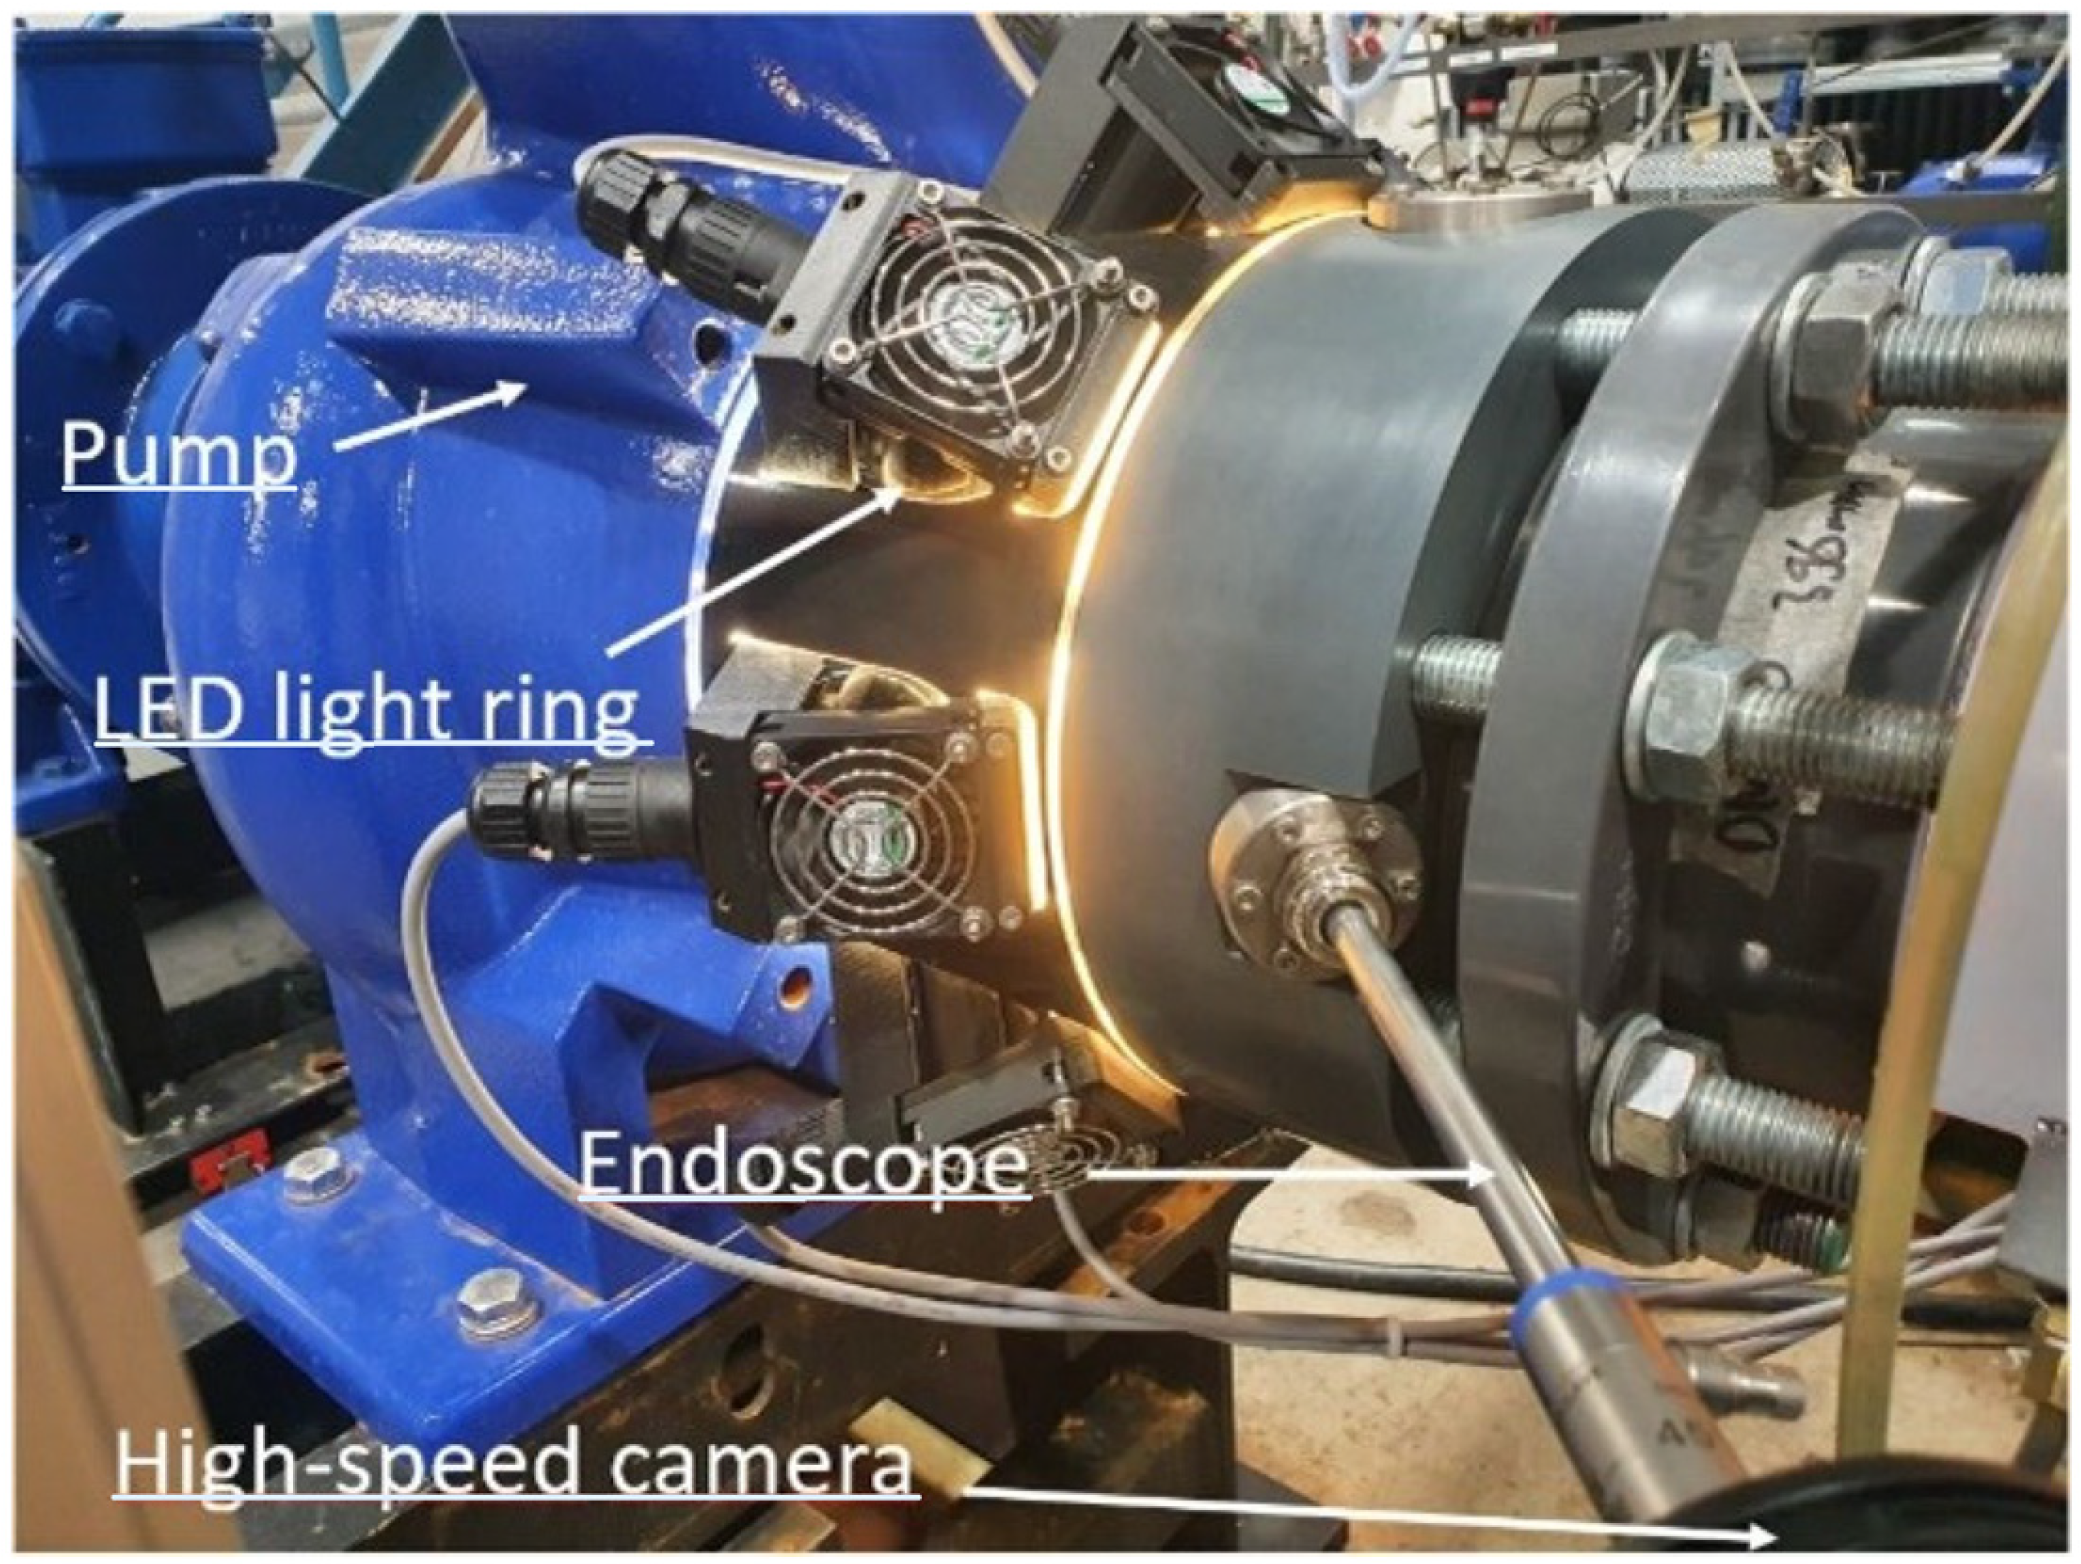
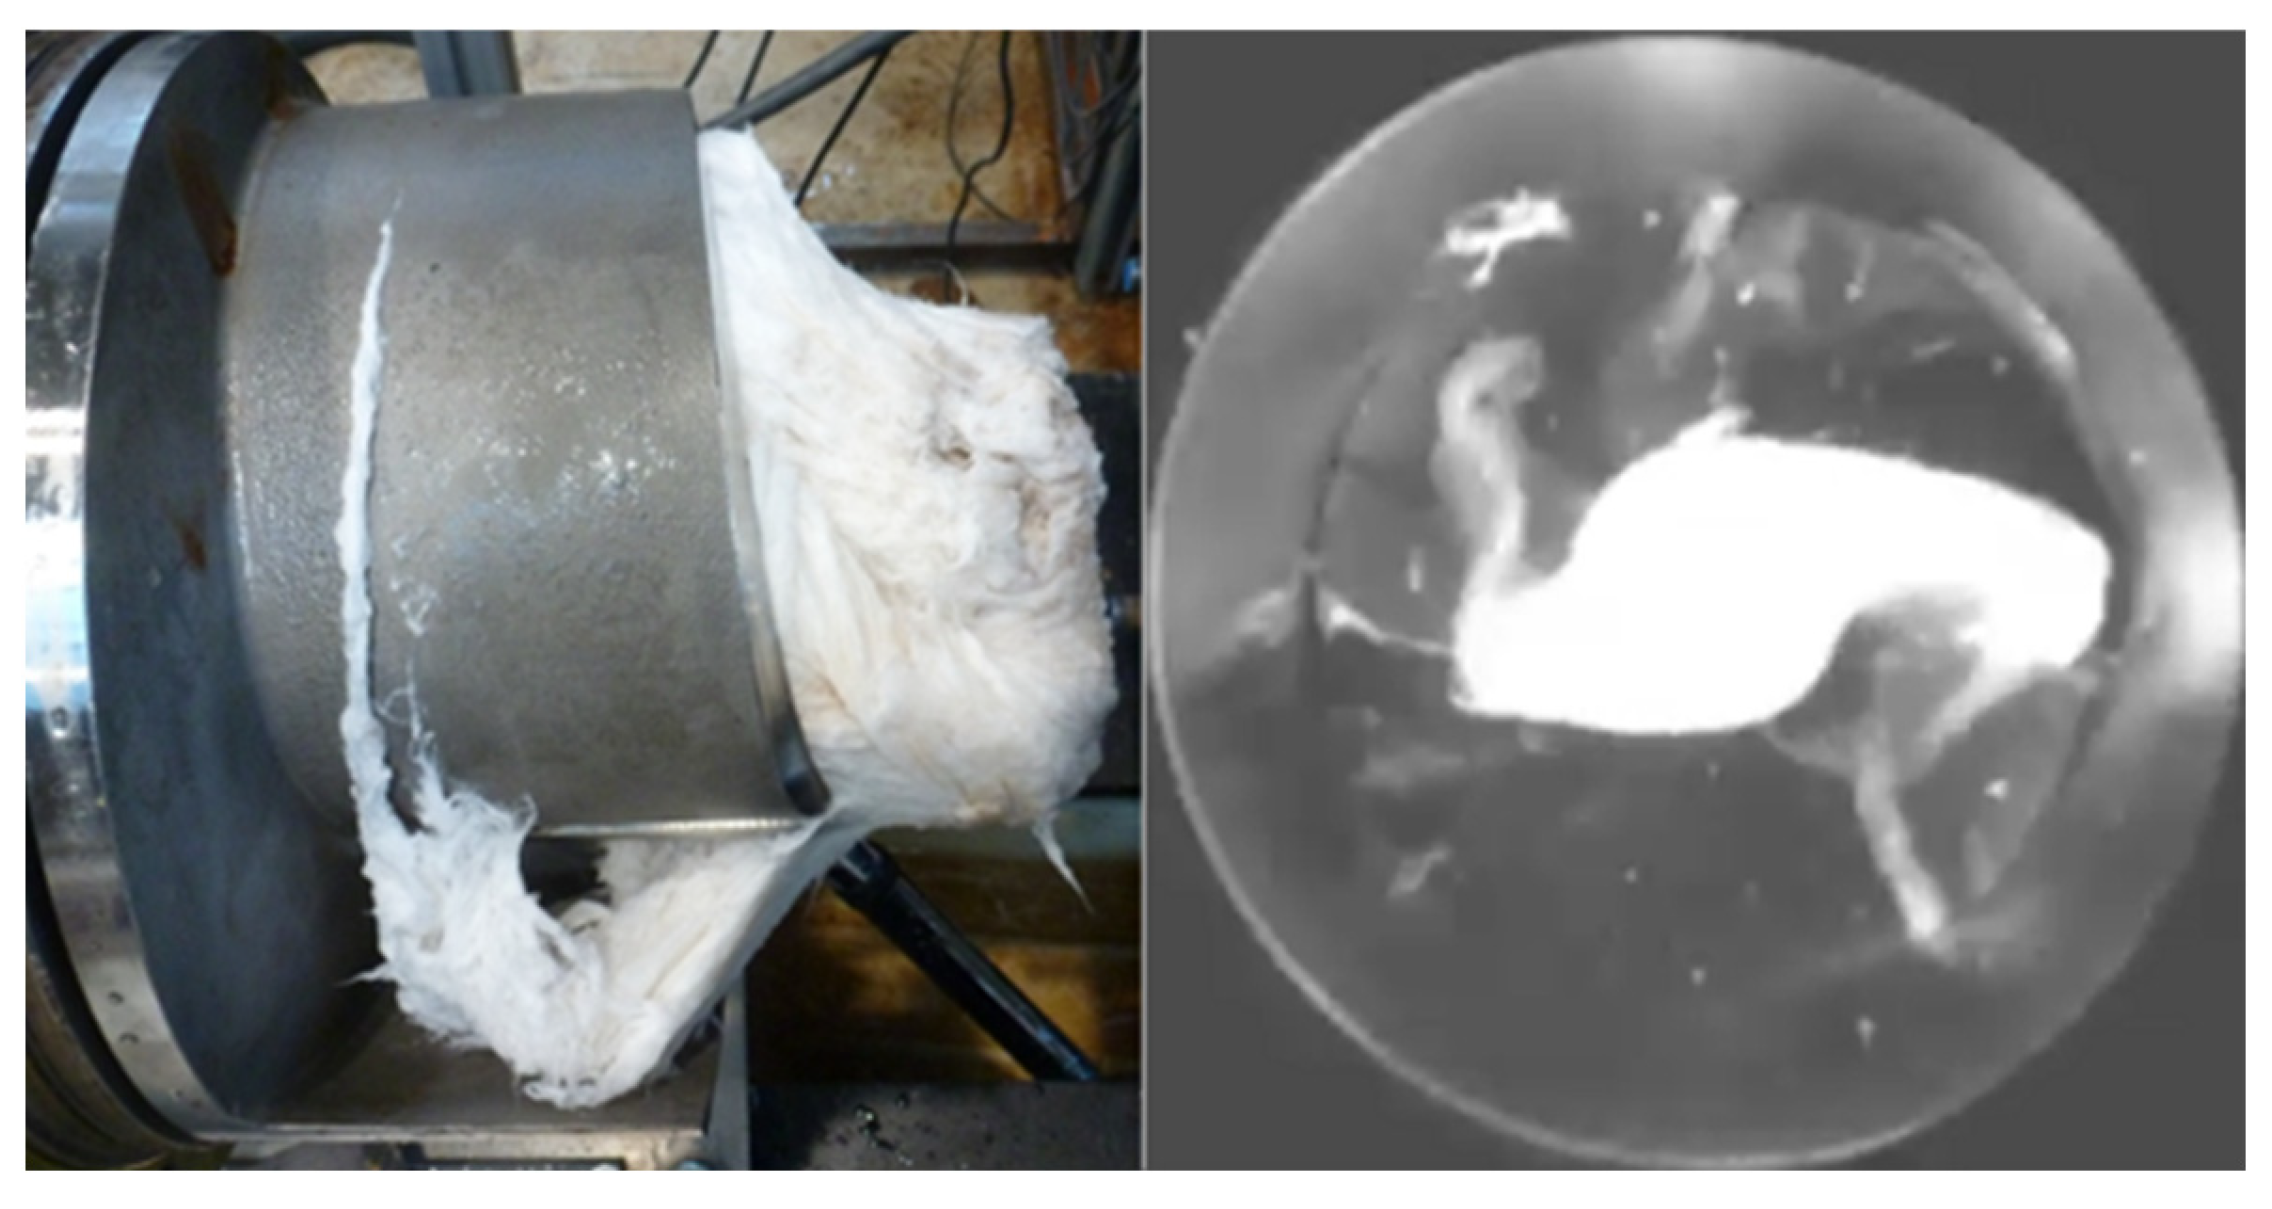
In Figure 11 on the left-hand side, it is shown that the accumulation of the wet wipes extends into the suction pipe. As soon as the wipes are lying on the CLE and are not conveyed, the clogging grows in the direction of the suction pipe. In this case, self-cleansing of the impeller can no longer be expected.
The optical measurement shows the extent to which the wet wipes interact with the impeller. The investigation has shown that single wet wipes lay loose on the printed part for the CLE but are conveyed within a few revolutions. A screenshot from the optical investigation is shown in Figure 11 on the right-hand side.
The impeller has suitable free-flushing characteristics for the arrival of single wet wipes, as the investigation has shown. Nevertheless, it can be said that the impeller is no longer able to flush off the wet wipes for higher incoming concentrations of wet wipes.
Modification 2: The second modification has a printed part for the CLE that is plane and parallel to the inlet of the pump, according to shape (B) in Figure 2. This is intended to prevent the flow from decreasing due to throttling on the suction side in the inlet pipe because of wet wipes, as can be seen for Modification 1.
While looking at the characteristic curves in Figure 12, the maximum efficiency of ηBEP,2 = 69.1% is reached at a flow of QBEP,2 = 0.7. As a result, the impeller achieves a specific speed of nq,2 = 35. The throttle curve of Modification 2 shows a similar behaviour to Modification 1.
The long-time functional performance test for Modification 2 results in a DLTF,2 = 0.43 for the BEP with low contamination (L25). In total, 64% of 309 g of supplied wet wipes are absorbed, which shows a significant improvement in clogging compared to Modification 1.
The clogging inside the impeller after the end of the long-time functional performance test can be seen in Figure 13 on the left-hand side.
Contrary to Modification 1, the wipes do not grow into the suction pipe and do not throttle the incoming flow. The impeller appears to have a degree of saturation, which, once reached, cannot accommodate any further wipes. This is particularly evident from the fact that a significantly lower proportion of wet wipes are absorbed compared with Modification 1.
By means of optical observations, it can be seen in Figure 13 on the right-hand side, that the wet wipes, which are sucked in centrally, also hit the centre of the CLE analogously to Modification 1, where they accumulate. In addition, the clogging on the CLE increases between the beginning of the test and the end of the test, which could be detected through the optical investigations. The geometry of the impeller is not able to discharge the wet wipes. Likewise, the wet wipes cannot be loosened by the impact of further incoming wet wipes. Accordingly, this flat contour is also not optimal for conveying wet wipes and tends to clog, even if the clogging result is improved compared to Modification 1.
Altogether, the modification is not able to convey wet wipes even in small concentrations, even if this modification shows a minor saturation of wet wipes and therefore has a higher DLTF.
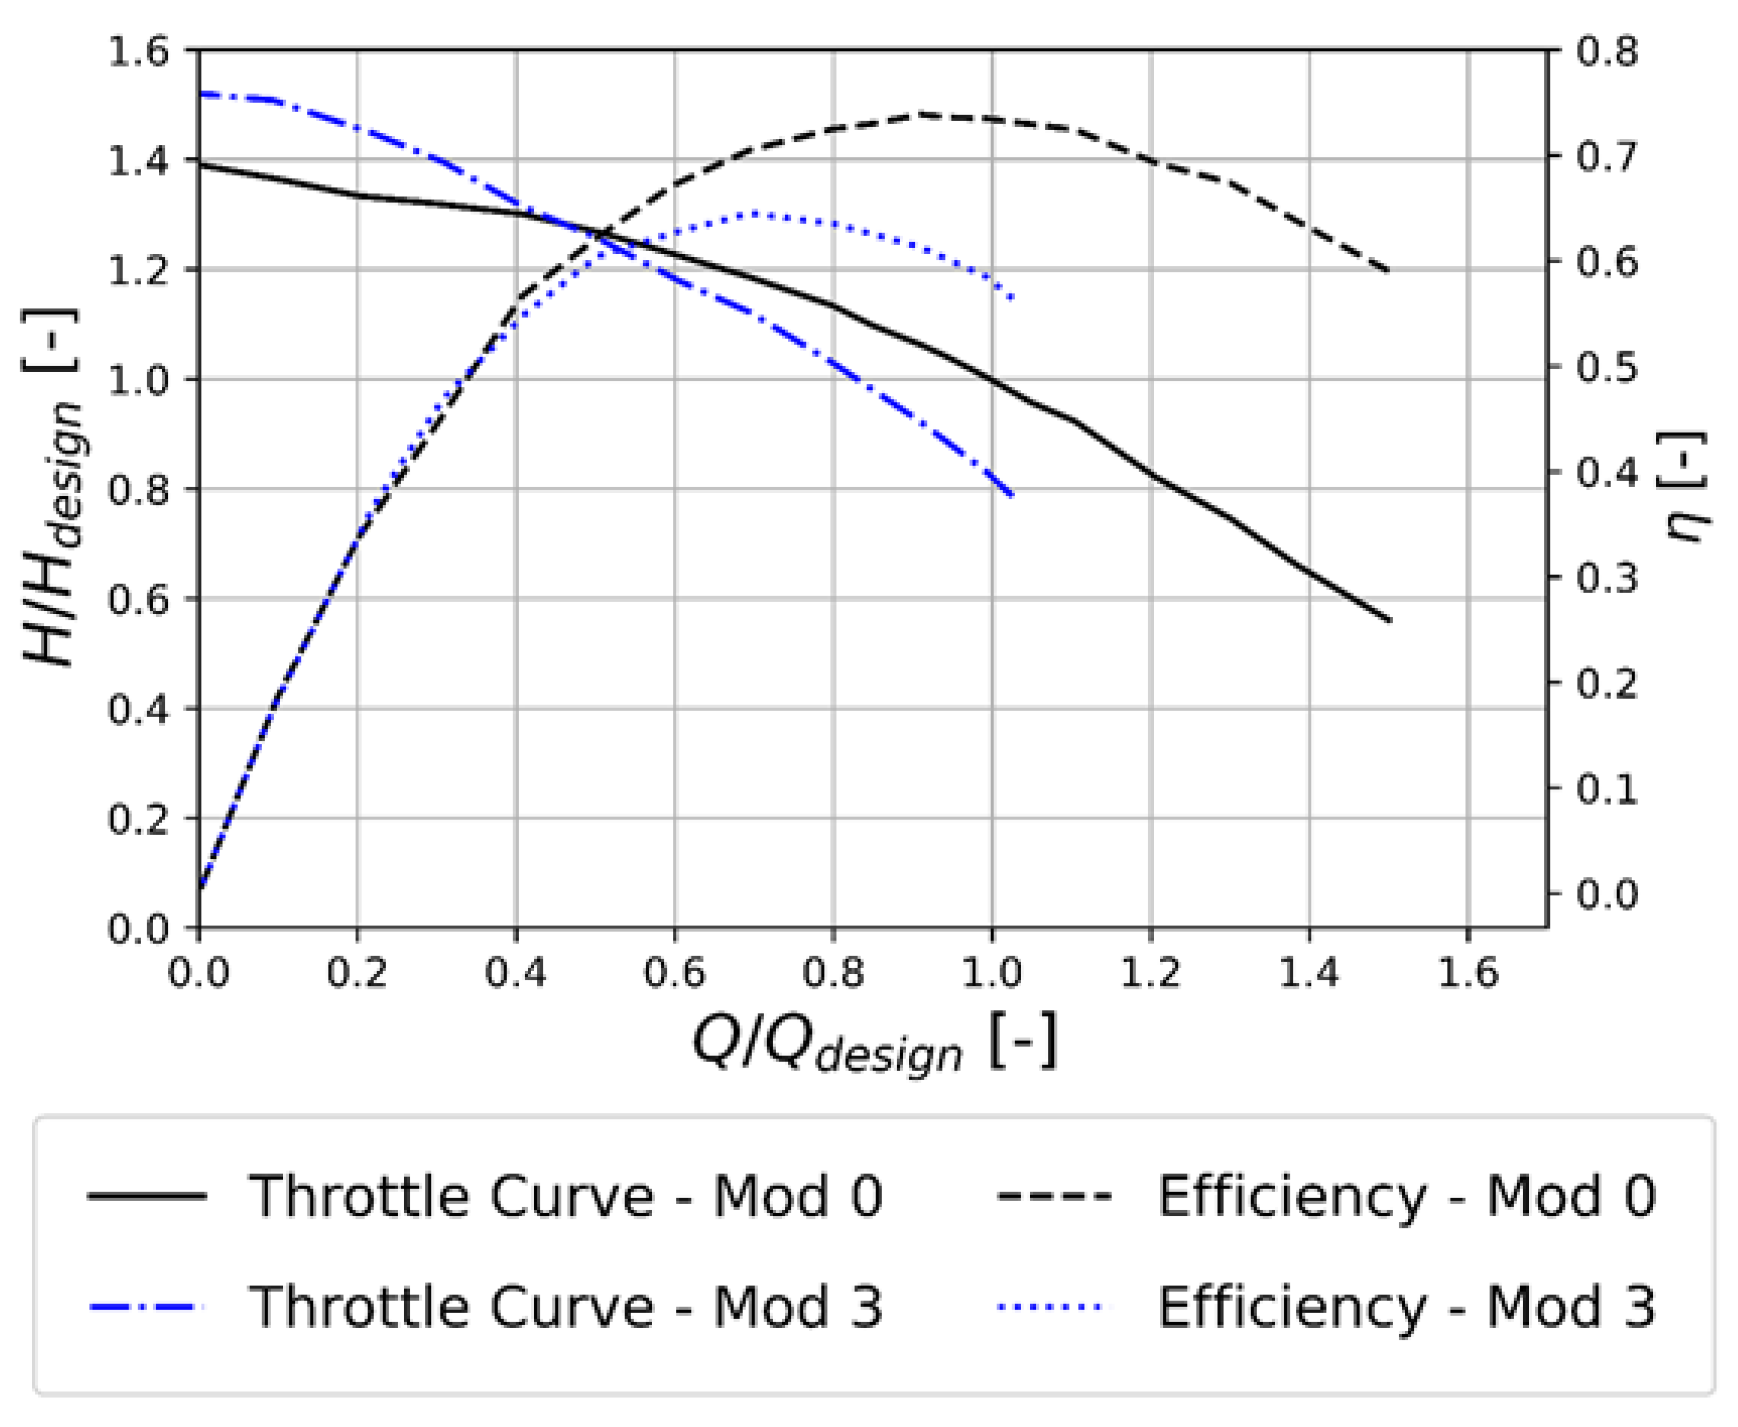
Modification 3: Another printed part is manufactured for the third modification, which combines the good conveying characteristics of Modification 1 with the advantages of the axial length of Modification 2 concerning the maximum amount of wet wipes absorbed.
The third modification shows a significantly smaller convex shape compared to Modification 1 to reduce the axial length and maintain the conveyance characteristics. Analogous to the first two modifications, Figure 14 shows the characteristic curves of Modification 3.
Modification 3 has its BEP as well as the other two modifications at QBEP,3 = 0.7. The best efficiency for this modification is ηBEP,3 = 64.5%. This modification results in a specific speed of nq,3 = 37.
A long-time functional performance test with low contamination (L25) is also carried out for this modification. The impeller achieved a DLTF,3 = 0.98. At the end of the measurement, the impeller had not absorbed any wet wipes from the 299 g supplied. The missing 2% of the DLTF also can be attributed concerning Equation (2) to slight hydraulic dips during the test, which occur due to brief blockages within the test caused by the wet wipes. However, the impeller manages to continuously discharge the wet wipes.
The impeller manages to convey the wet wipes into the channels continuously over the measurement period for this type of CLE.
Table 3 shows the results for the long-time functional performance tests for all nine measurement setups:
No further modification is necessary, as the impeller exceeds the required degree of long-time functional performance of 0.7 for all measurement points and thereby has the best clogging behaviour of all modifications.

3.4. Comparison of Results

Overall, the optimisation shows a considerable improvement in the DLTF and thus the susceptibility to clogging, as can be seen in Figure 15.
Modification 0 shows a poor clogging result for the medium contamination with two leading edges. By using the CLE, the first modification also achieves an insufficient result in the long-time functional performance test. This is improved by targeted changes in the geometry through the detection of the weak points by means of optical tests as well as the long-time functional test.
The second modification still shows a high susceptibility to clogging with wet wipes, even though the DLTF is improved a lot.
Through renewed optimization based on the findings of the optical tests and the test results of both previous modifications, a modification is tested that delivers a clog-free result for the low contamination. Likewise, the required DLTF of over 0.7 will be achieved for all contaminations, in the BEP, in partial load and in overload.

4. Conclusions

The use of simulations for a calculated sewage impeller in combination with a test rig to test the susceptibility to clogging has shown that impellers for sewage pumps can be designed and optimised according to specific criteria. The use of optical access is particularly noteworthy to specifically address the interaction between the wet wipes and the impeller and for making specific design changes.

Author Contributions

Conceptualization, D.B. and P.U.T.; methodology, D.B. and P.U.T.; software, D.B.; validation, D.B. and P.U.T.; formal analysis, D.B.; investigation, D.B.; resources, D.B. and P.U.T.; data curation, D.B.; writing—original draft preparation, D.B.; writing—review and editing, P.U.T.; visualization, D.B.; supervision, P.U.T.; project administration, P.U.T. All authors have read and agreed to the published version of the manuscript.

Funding

This research received no external funding.

Data Availability Statement

The data presented in this study are available on request from the corresponding author. The data are not publicly available due to the fact that it is standardized data that only supports the methodology of optimizing sewage impellers at the test bench in general.

Conflicts of Interest

The authors declare no conflict of interest.

References

  1. Von Sperling, M. Wastewater Characteristics, Treatment and Disposal; IWA Publishing: London, UK, 2007; Volume 1. [Google Scholar]
  2. Gerlach, S.; Thamsen, P.U. Cleaning sequence counters clogging—A quantitative Assessment under real operation conditions of a wastewater pump. In Proceedings of the ASME 2017 Fluids Engineering Division Summer Meeting, Waikoloa, HI, USA, 31 July–3 August 2017. [Google Scholar]
  3. Mitchell, R.-L. Causes, Effects and Solutions of Operational Problems in Wastewater Systems Due to Nonwoven Wet Wipes; Mensch und Buch Verlag: Berlin, Germany, 2019. [Google Scholar]
  4. Gülich, J. Centrifugal Pumps, 3rd ed.; Springer: Berlin, Germany, 2008. [Google Scholar]
  5. DIN EN ISO 9906: 2013-03; Kreiselpumpen–Hydraulische Abnahmeprüfungen–Klassen 1, 2 und 3. Beuth Verlag: Berlin, Germany, 2013.
  6. Pöhler, M. Experimentelle Entwicklung Eines Standardisierten Abnahmeverfahrens für Abwasserpumpen; Mensch und Buch Verlag: Berlin, Germany, 2020. [Google Scholar]
  7. Surek, D. Pumpen für Abwasser-und Kläranlagen: Auslegung und Praxisbeispiele; Springer: Berlin/Heidelberg, Germany, 2014. [Google Scholar]
  8. Pfleiderer, C.; Petermann, H. Strömungsmaschinen, 7th ed.; Springer: Berlin/Heidelberg, Germany, 2006. [Google Scholar]
  9. Versteeg, H.K.; Malalasekera, W. An Introduction to Computational Fluid Dynamics, 2nd ed.; Pearson Education Limited: Essex, UK, 2007. [Google Scholar]
  10. Steffen, M.; Thamsen, P.U. Visualization of interactions between impeller and textile in a wastewater pump. In Proceedings of the ASME 2021 Fluids Engineering Division Summer Meeting, Virtual, 10–12 August 2021. [Google Scholar]
Figure 1. Constituents of pump blockage [3].
Ijtpp 08 00018 g001
Figure 2. Meridional section and plan view for the semi-open two-channel impeller with two leading edges (top) and for the CLE (bottom), with a convex shape (A) as well as a flat shape (B).
Ijtpp 08 00018 g002
Figure 3. Mesh used for simulation.
Ijtpp 08 00018 g003
Figure 4. Modification 0—manufactured impeller.
Ijtpp 08 00018 g004
Figure 5. Wet wipes used for tests.
Ijtpp 08 00018 g005
Figure 7. Test setup for optical access.
Ijtpp 08 00018 g007
Figure 8. Modification 0—characteristic curves.
Ijtpp 08 00018 g008
Figure 9. Modification 0—clogging after long-time functional test (BEP, L50).
Ijtpp 08 00018 g009
Figure 10. Modification 1—characteristic curves.
Ijtpp 08 00018 g010
Figure 11. Modification 1—clogging after long-time functional test (BEP, L25) (left) and optical investigations (right).
Ijtpp 08 00018 g011
Figure 12. Modification 2—characteristic curves.
Ijtpp 08 00018 g012
Figure 13. Modification 2—clogging after long-time functional test (BEP, L25) (left) and optical investigations (right).
Ijtpp 08 00018 g013
Figure 14. Modification 3—characteristic curves.
Ijtpp 08 00018 g014
Figure 15. Overview over DLTF for tested modifications for Q/QBEP = 1.0.
Ijtpp 08 00018 g015
Table 1. Mesh statistics.
PartElements
Impeller827,772
Volute864,356
Table 2. Contamination classes.
Contamination ClassWipes/m3
Clear water (CW)0
Low contamination (L25)25
Medium contamination (L50)50
High contamination (L100)100
Table 3. Measurement results: DLTF for Modification 3 for three operating points.
Q/QBEPL25L50L100
0.80.970.990.94
1.00.980.910.94
1.20.740.900.74
Disclaimer/Publisher’s Note: The statements, opinions and data contained in all publications are solely those of the individual author(s) and contributor(s) and not of MDPI and/or the editor(s). MDPI and/or the editor(s) disclaim responsibility for any injury to people or property resulting from any ideas, methods, instructions or products referred to in the content.

