Article

Uniformity Index as a Universal Air-Cooled Condenser Fan Performance Metric

1
Solar Thermal Energy Research Group, Stellenbosch University, Stellenbosch 7600, South Africa
2
Department of Mechanical and Mechatronic Engineering, Stellenbosch University, Stellenbosch 7600, South Africa
3
Howden Netherlands, 7554 PA Hengelo, The Netherlands
*
Author to whom correspondence should be addressed.
Int. J. Turbomach. Propuls. Power 2022, 7(4), 35; https://doi.org/10.3390/ijtpp7040035
Submission received: 29 August 2022 / Revised: 9 September 2022 / Accepted: 14 November 2022 / Published: 1 December 2022
(This article belongs to the Special Issue Fan Noise, Aerodynamics, Applications and Systems)

Abstract

:
Ambient wind has a negative effect on mechanical forced-draft direct air-cooled steam condenser (ACC) fan volumetric performance, and increases dynamic fan blade loading. Investigating these effects directly using on-site measurement or numerical analysis is complicated, and most previous work has focused on only one effect at the expense of the other. In this study, fan axial velocity inflow uniformity is identified as a single metric offering the potential to holistically qualify ACC fan operation under windy conditions. A 3 × 6 fan cell ACC was modelled with CFD using a blade element theory-based fan model, and clear relationships between the fan inflow uniformity index and both fan volumetric performance and dynamic blade loading were observed in the results. The same relationships were observed in on-site test data collected at a single ACC fan, thus validating the numerical results. The uniformity index can be used in both numerical and experimental work as a means of investigating both fan volumetric performance and dynamic blade loading with less computational and measurement complexity; it also offers a potentially useful means of quantifying the severity of fan operating conditions, to assist with more reliable case-specific fan design and selection.

1. Introduction

Mechanical forced-draft direct air-cooled steam condensers (ACCs) are widely employed as condenser technology in thermal energy systems (steam cycles). ACCs use large axial fans to force ambient air through A-frame heat exchangers (Figure 1) and reject the required heat load to maintain the steam turbine backpressure at or near its design point. The thermal performance of an ACC is both directly and indirectly influenced by ambient wind via: (1) a reduction in fan volumetric performance and increased inlet air temperatures with increasing wind speed [1]; and (2) increased dynamic fan blade loading of the upwind edge fans. Dynamic blade loading results in increased gearbox wear and accelerated blade fatigue, and can result in physical damage to the fan blades [2]. Subsequently, the ACC will experience more frequent repair and maintenance outages and poorer average thermal performance.
Wind effects on ACC fans are caused by an increase in the horizontal velocity component of the air moving beneath the fan platform (cross-flow) under windy conditions. High cross-flow past the fan inlets causes distortions in the inlet flow distribution [3]. This non-uniform inlet flow negatively affects the fans’ ability to deliver their rated air volume flow rate [3], and results in a variation in aerodynamic loading on the fan blades as they rotate through the non-uniform flow field [4]. There are two types of cross-flow-related inlet flow distortions identified in the literature: flow separation at the fan inlet [3,5] and off-axis inflows [6,7] (shown in Figure 1). Flow separation at the fan inlet is considered the dominant cause of the wind-related degradation in fan volumetric performance [3] and increased dynamic fan blade loading [8].
Wind effects on ACCs are primarily investigated via full-scale testing at operating ACCs (e.g., [2,9]), or via computational fluid dynamics (CFD) simulation (e.g., [10,11]). On-site measurement provides “true” information but is complicated by uncontrollable environmental variables, the need for specialist measurement equipment and the difficulty of accurately measuring on-site wind velocity. In on-site testing, ACC fan volumetric performance is quantified using propeller anemometer measurements at various radial and tangential locations on the fan’s inlet grid [2,9]. These anemometers are used to measure the axial velocity at these fixed locations within the fan inlet, and are subsequently used to calculate the volume flow rate or average axial velocity through the fan. The CTI-PTG-143 standard [12] recommends 40 anemometer measurements (four quadrants with 10 measurements at equal radial spacing per quadrant) for fans with diameters exceeding 20 ft., as is common in ACCs (typically around 36 ft.). This makes continuous measurement of on-site airflow difficult, as it requires a large quantity of measuring equipment. Dynamic fan blade loading can be accurately evaluated using bending strain measurements, typically using strain gauges attached to the root of a fan blade in a full-bridge configuration [9]. Access to the fan blades for installation of strain gauges requires the fan to be stopped, and can complicate the scheduling of on-site tests (i.e., it may not be possible to stop a fan when the test engineers would ideally want access to the blades).
Numerical studies using CFD avoid the complications of on-site testing, and offer more control and flexibility in the analysis; they do, however, require simplifying assumptions, and are thus exposed to lower accuracy. Numerical studies tend to focus on fan volumetric performance, due to the challenges related to the prediction of dynamic blade loading in CFD. Dynamic blade loading can, however, be approximated numerically. This has been done by either utilising a blade element theory-based fan model, that makes it possible to calculate a flap-wise bending moment distribution [7,13], or by analysing the variation in static pressure within the fan rotational plane [14]. Of the two methods, only the flap-wise bending moment distribution method has been directly evaluated against experimental blade loading trends [15].
The literature relating to ACC fans and wind effects tends to focus on either volumetric performance or dynamic blade loading, due to the difficulties related to determining the former in full scale experimental work and the latter in numerical work. That these two performance metrics are related is implicit, as they are both affected by the same phenomenon: distorted inflow.
Laboratory research [8], conducted using a system meant to mimic ACC fan operating conditions, has indicated that the uniformity of the axial velocity inflow to a fan could be used to indicate the severity of the dynamic blade loading. Furthermore, the uniformity of the inflow axial velocity should have a proportional relationship with fan volumetric performance. For a uniform distribution, the fan is likely to be operating close to design conditions. Increasingly non-uniform inflow is indicative of off-design conditions, and would therefore typically result in reduced volumetric performance. The uniformity of the axial velocity at the fan inlet therefore potentially offers a single metric that could be determined experimentally or with CFD, and which could be used to infer both fan volumetric performance and dynamic blade loading.
This study uses a CFD-based approach to investigate the relationship between ACC fan inflow uniformity, quantified by means of a uniformity index, and both fan volumetric performance and dynamic blade loading under windy conditions. The numerical correlations were also validated against on-site test data obtained from a third party.

2. Materials and Methods

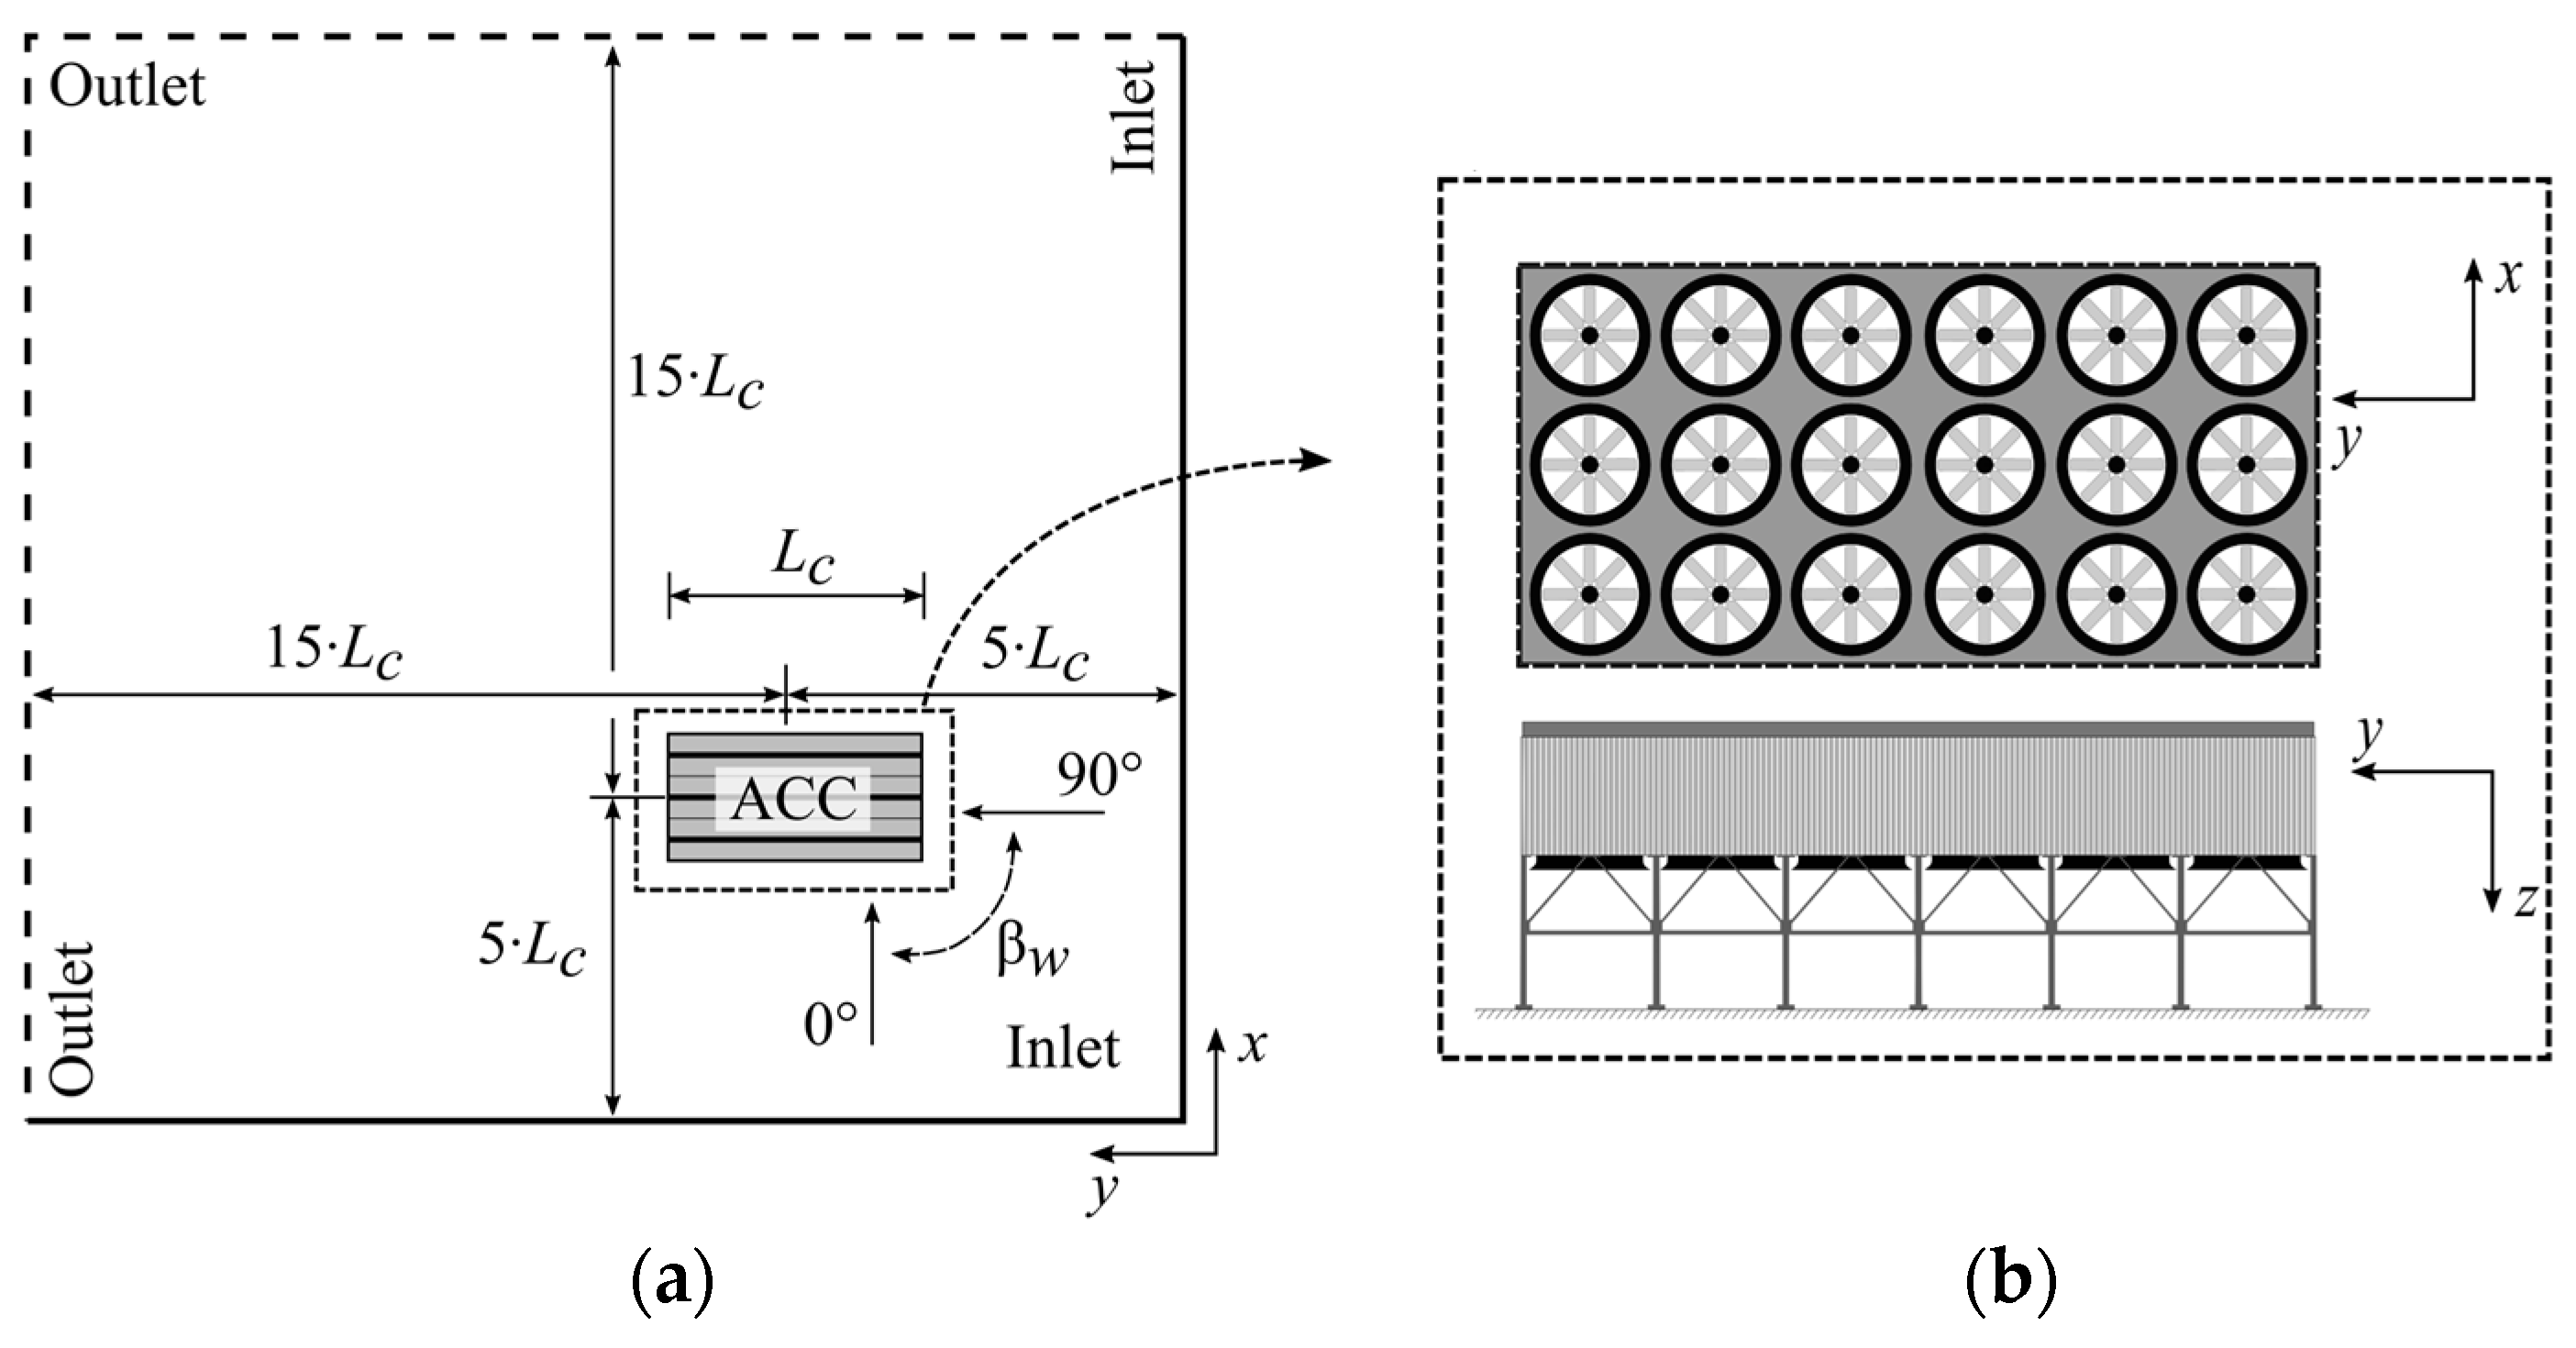
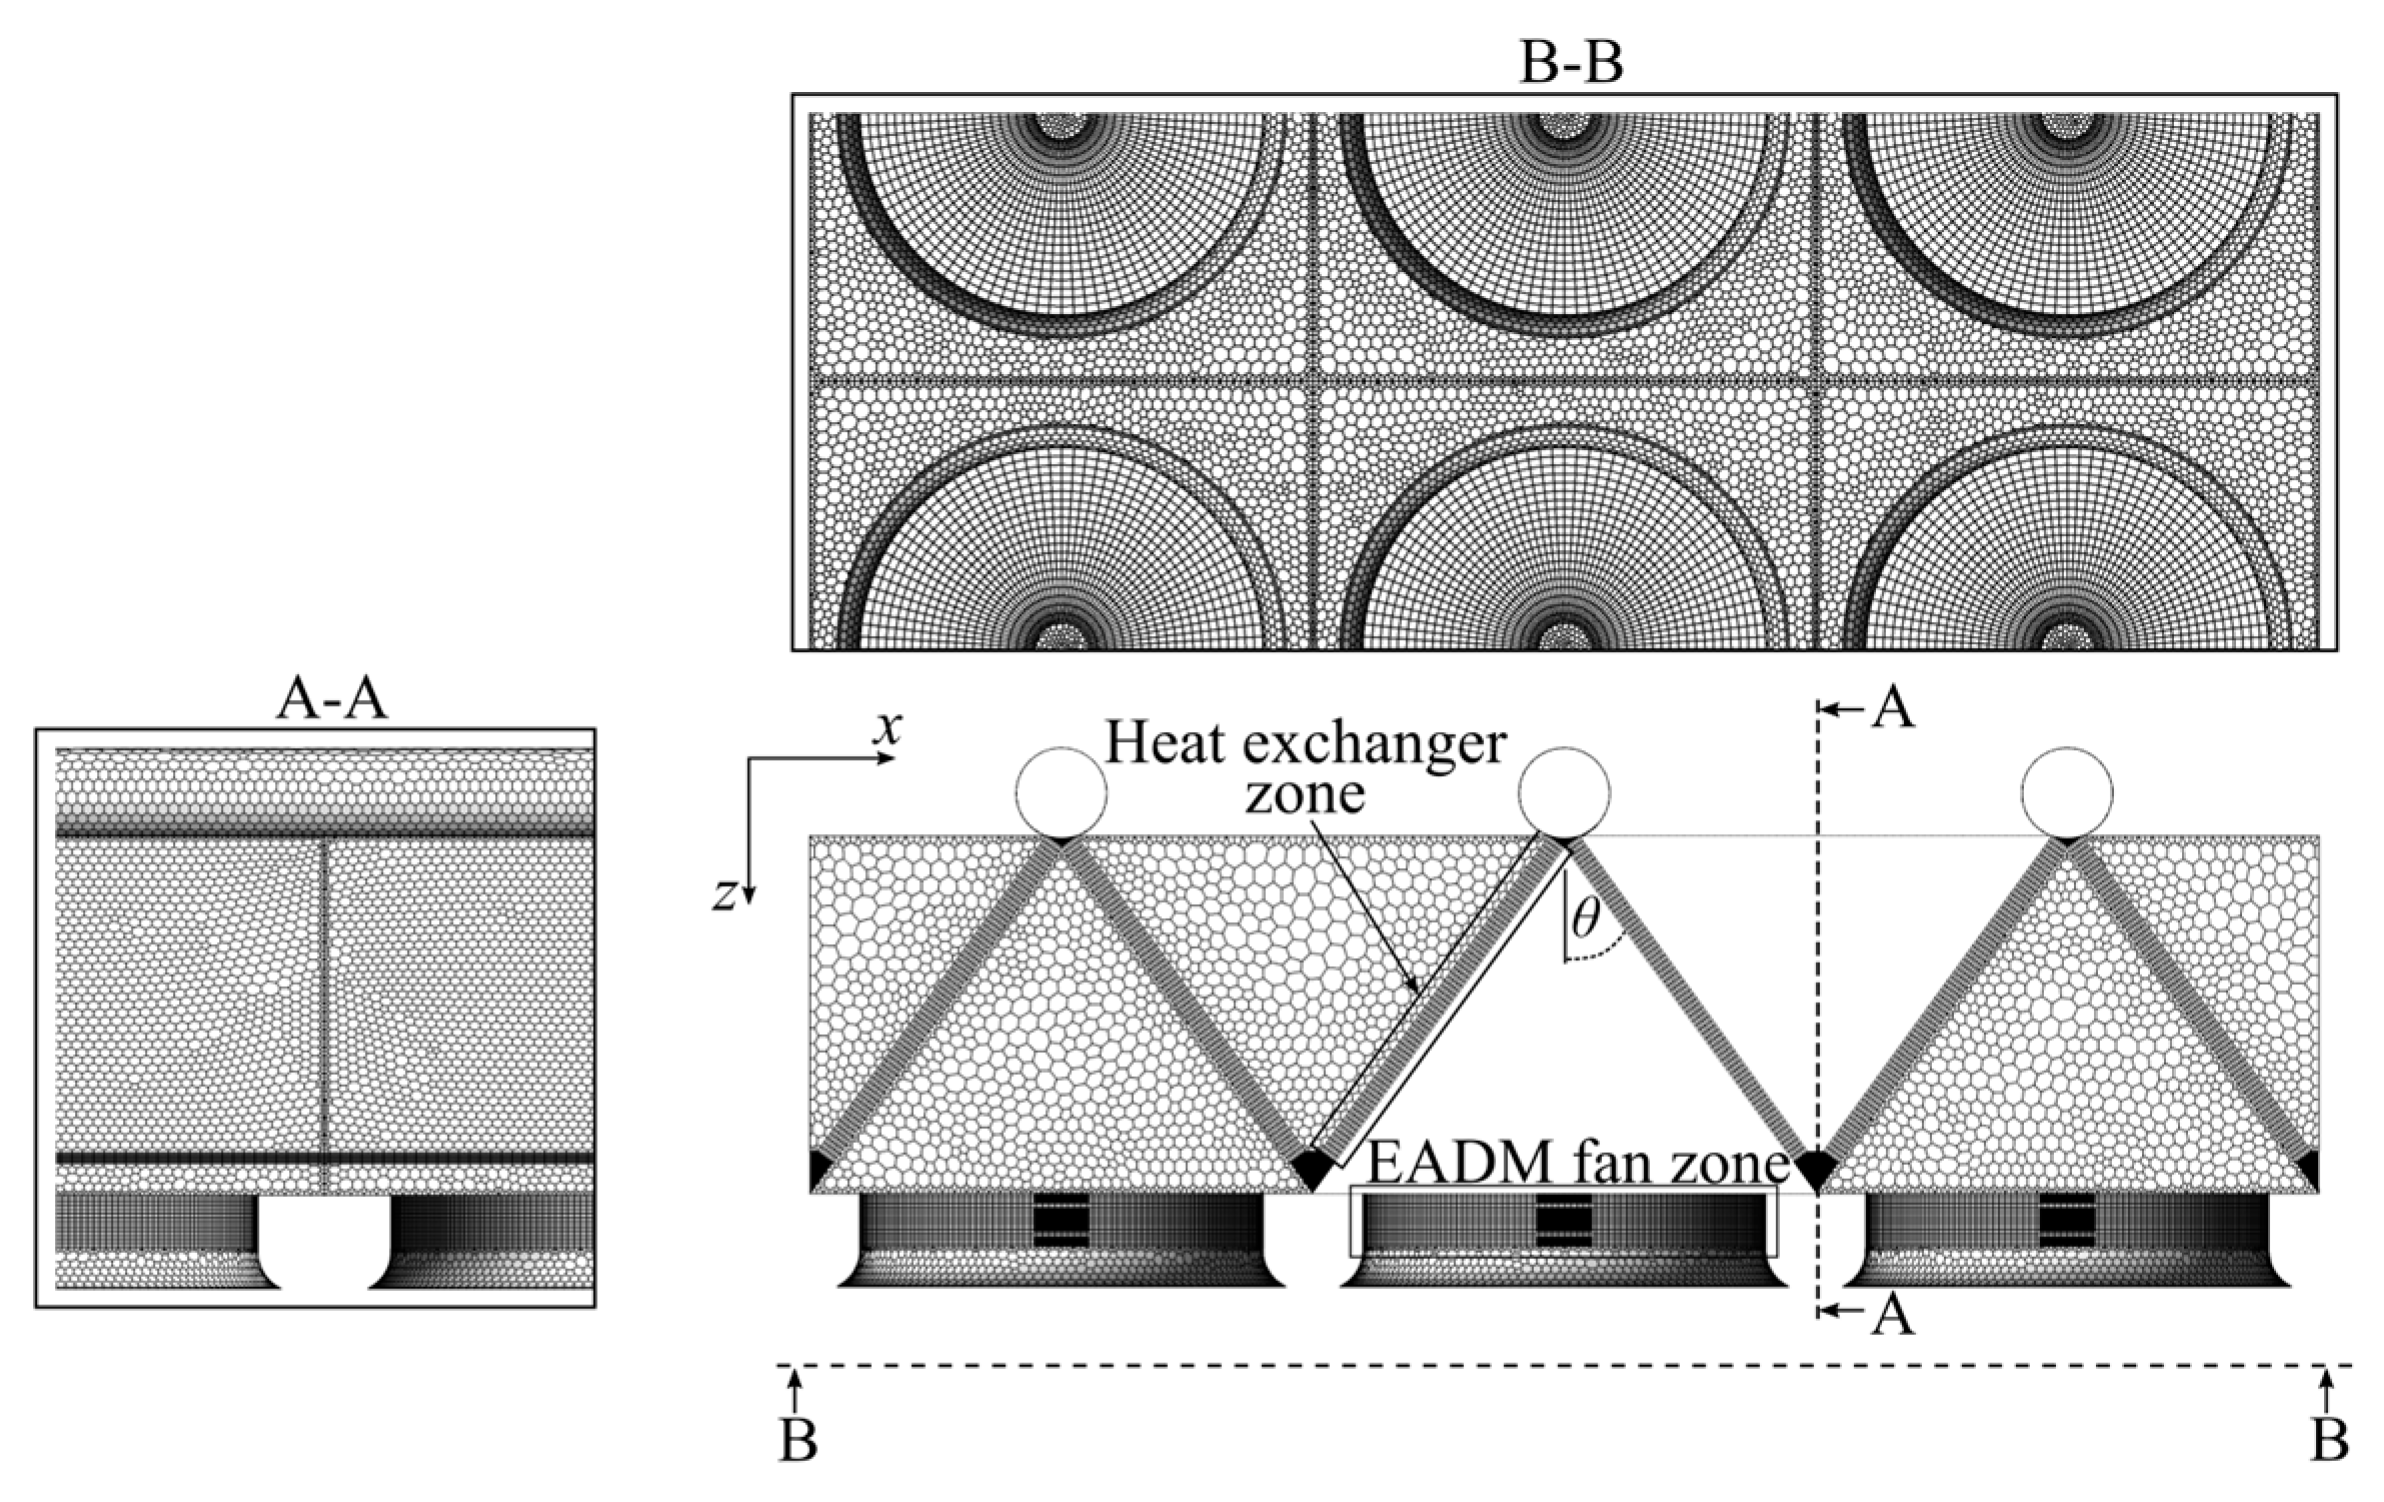
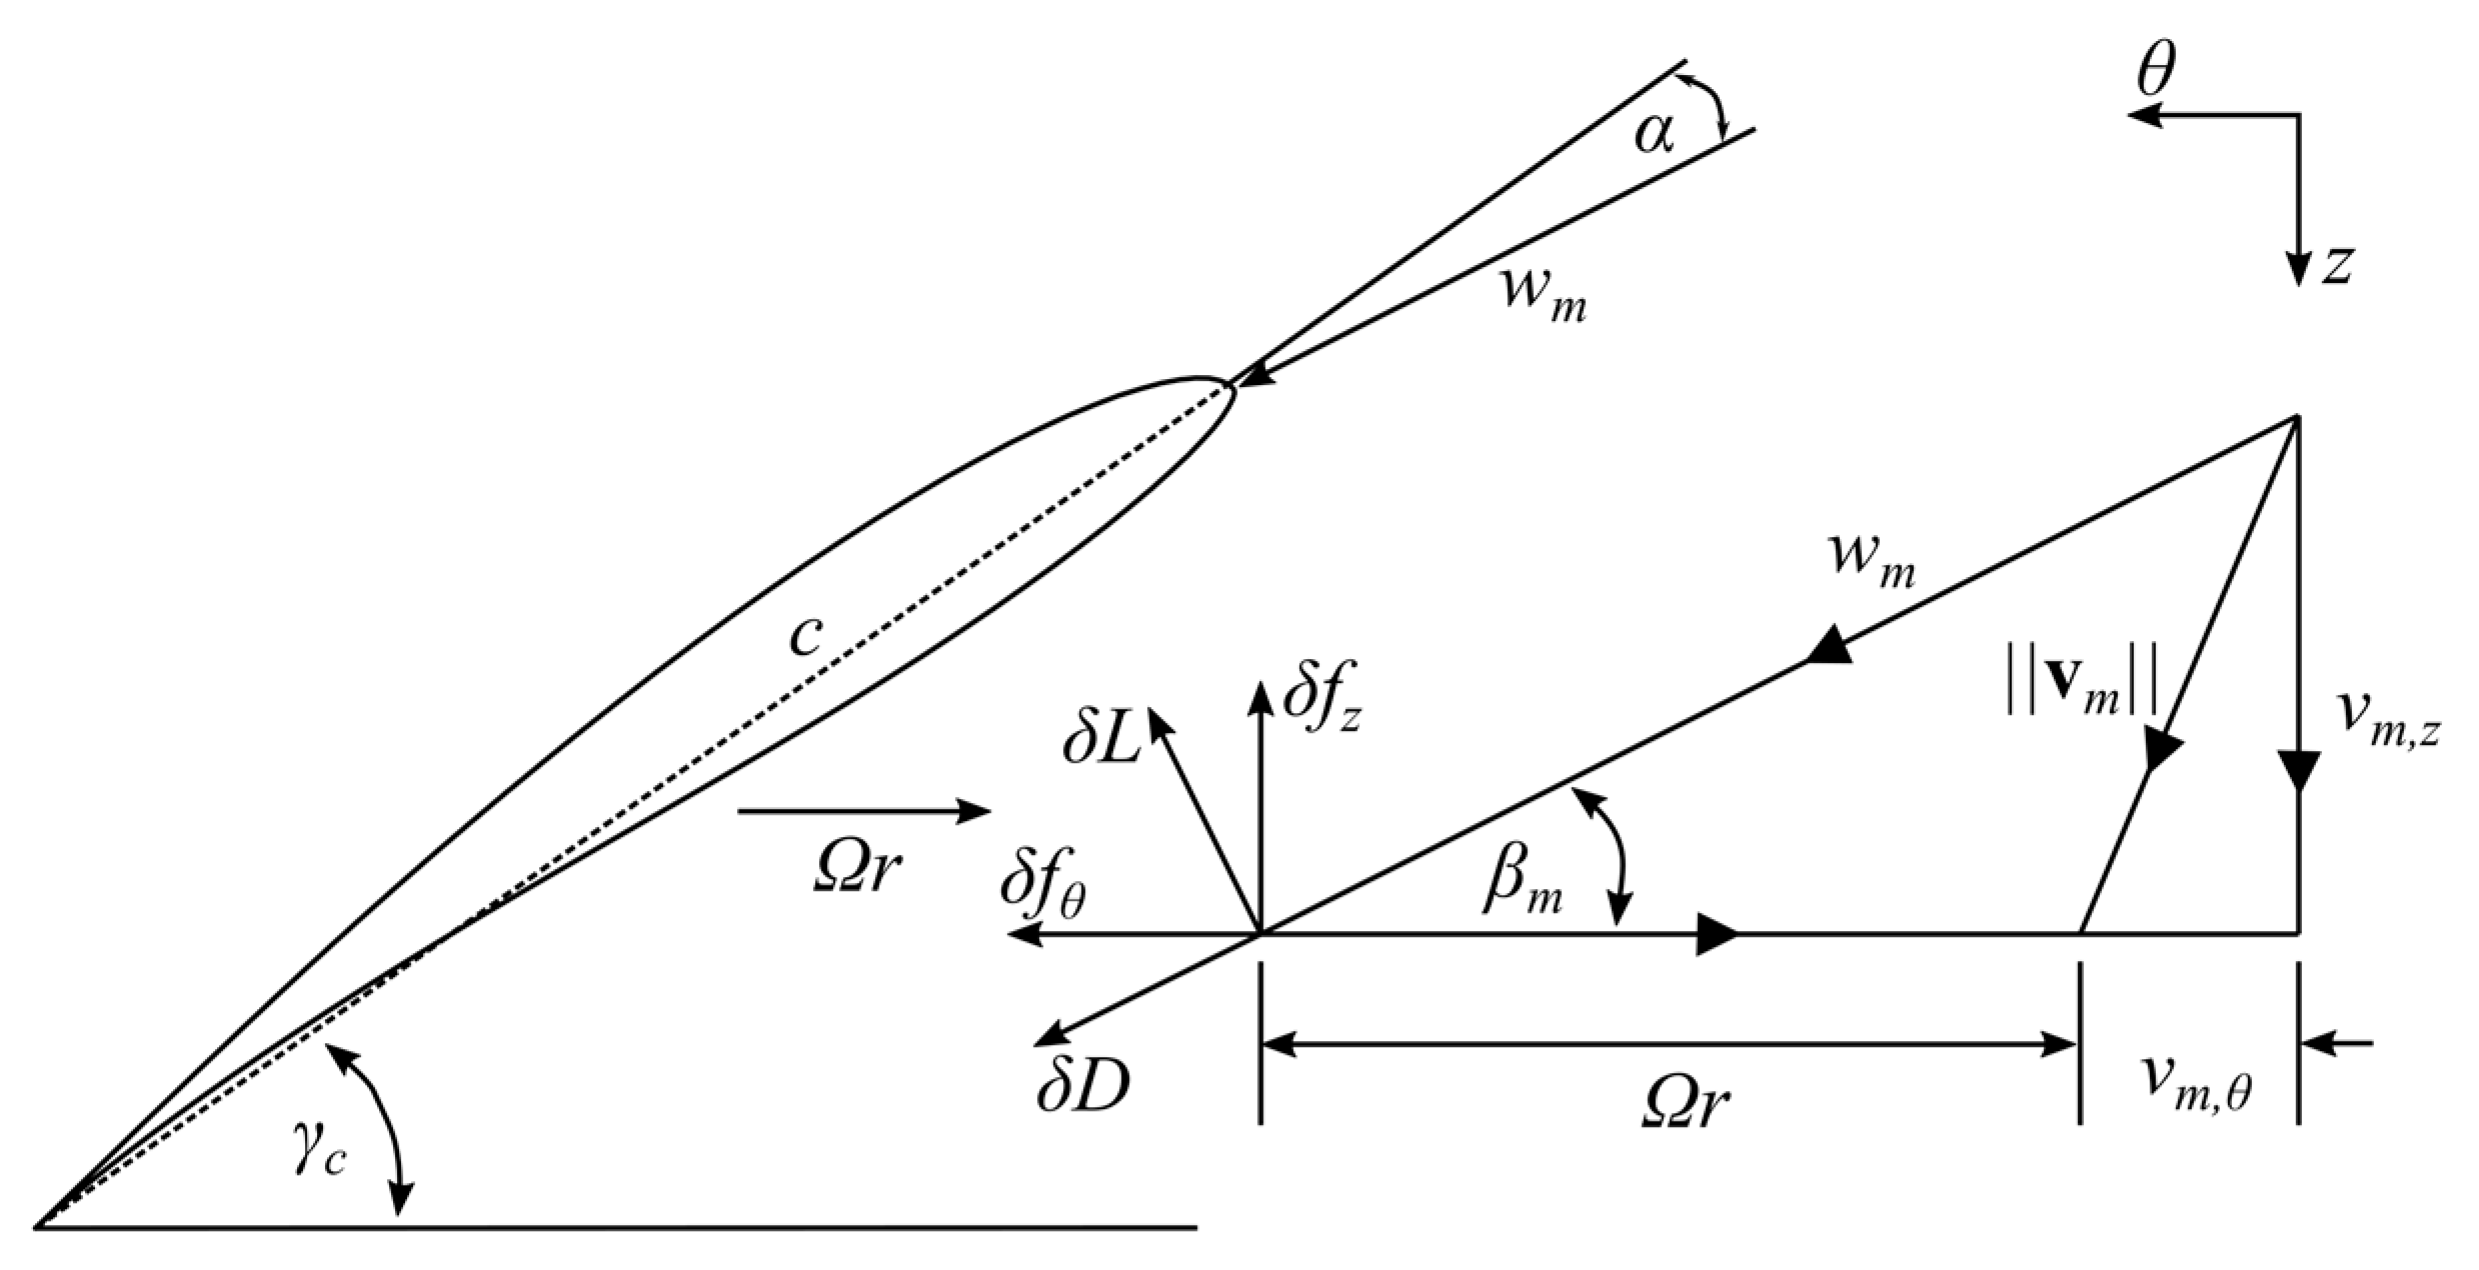
2.1. Numerical Model

The numerical model consisted of a 3 × 6 fan cell ACC placed in a large flow domain (see Figure 2). Simulations were run in ANSYS Fluent 20 R1 using the steady, single-precision, pressure-based solver. Second-order discretization was used for the energy equation, and first-to-higher-order blended discretisation was applied to the momentum equations to improve the convergence of the fan model. Turbulence was modelled using the realizable k-ε model with standard wall functions (consistent with, e.g., [16,17]) and first-order upwind discretization. Buoyancy was accounted for using the Boussinesq approximation. A detailed description of the model, including information on grid sensitivity analyses, is available in [18].
Figure 2 shows the location of the domain inlet and outlet boundaries for 0° ≤ βw ≤ 90° as well as the definition of the wind direction (βw) used in this paper. The domain dimensions were based on Franke et al.’s [19] recommendations for computational modelling for wind engineering purposes. The ACC’s longest dimension was used as a conservative characteristic length (Lc), and a domain height (z-direction) of 6Lc was used. Richards and Hoxey’s [20] atmospheric wind boundary profiles for the z-velocity distribution, turbulent kinetic energy and dissipation rate were used to simulate a horizontally homogeneous turbulent atmospheric boundary layer when using a k-ε turbulence model. The wind speed (vw) and direction ranges considered were 1 ≤ vw ≤ 11 m/s and −90° ≤ βw ≤ 90°. Note that the computational domain shown in Figure 2 was mirrored for −90° ≤ βw < 0° such that the relative inlet and outlet boundary positions remained appropriate for all wind directions.
Each fan cell consisted of an axial flow fan, an A-frame heat exchanger and a steam supply duct, as shown in Figure 3.
The ACC’s finned tube heat exchangers (see Table 1) were modelled using porous media zones with appropriate momentum sink and energy source terms to replicate the flow resistance and heat transfer rate. Momentum sink terms for the x, y and z momentum equations were defined by the Darcy–Forcheimer equation, with the viscous and inertial loss coefficients derived from the empirical pressure loss coefficients [21]. The energy source term was calculated using the e-NTU method of heat exchanger analysis [22] with the empirical heat transfer characteristics provided in [21].
The axial flow fan considered in this work was based on a commercially available industrial fan; the specifications are given in Table 2.
The fans were modelled using the Extended Actuator Disk Fan Model (EADM—see [23] for a full description), similar to [16,17]. The EADM is an adaptation of the blade element theory-based actuator disk model [4], and was implemented in a structured grid region with single element thickness and nr = 20 radial and nθ = 120 tangential divisions representing the fan’s rotor (see Figure 3, plane B–B). Each rotor region cell was approximated as a two-dimensional aerofoil (blade element) with lift (δL) and drag (δD) forces dependant on the relative velocity (wm) and the lift (CL) and drag (CD) coefficients of the blade element’s aerofoil profile. The relative velocity was calculated from the incoming velocity vector (vm) and the tangential velocity (Ωr) linked to the fan speed. The lift and drag forces were introduced into the solver’s momentum equations as axial (Equation (1)) and tangential (Equation (2)) source terms:
S z = δ f z δ V = 1 2 ρ   w m 2   σ t ( C L cos β m C D sin β m ) ,
S θ = δ f θ δ V = 1 2 ρ   w m 2   σ t ( C L sin β m + C D cos β m ) ,
where βm was the relative velocity angle, as shown in Figure 4, t was the rotor-zone thickness and σ was the blade solidity. Figure 4 shows the velocity vectors and force directions for a single blade element:

2.2. Numerical Evaluation Metrics

A uniformity index of unity represents perfectly uniform flow. The variation in the axial velocity within the fan rotor region was quantified using the uniformity index (γi) defined in Equation (3) [24]:
γ i = 1 k = 1 n r j = 1 n θ | v z , k j v ¯ A z | A z , k j 2 v ¯ A z k = 1 n r j = 1 n θ A z , k j ,
where vz,kj was the axial velocity in element (k,j) of the fan’s rotor region, Az,kj was the corresponding surface area normal to the axial direction and v ¯ A z was the area-weighted average axial velocity given by Equation (4):
v ¯ A z = k = 1 n r j = 1 n θ v z , k j A z , k j k = 1 n r j = 1 n θ A z , k j ,
The volumetric performance of each individual fan was quantified using a volumetric effectiveness metric (ξi), as shown in Equation (5):
ξ i = v ¯ A z , i v ¯ A z , i d ,
where v ¯ A z , i was the area-weighted average axial velocity through fan (i) and v ¯ A z , i d was the “ideal” area-weighted average axial velocity through the fan with the most uniform axial velocity (highest uniformity index) within the dataset.
The flap-wise bending moment distribution (Mz,θ) was used to evaluate the fan blade loading [7,13]. This distribution was calculated using the differential axial forces (δfZ,kj, see Equation (1)) exerted on each of the rotor region elements, as shown in Equation (6):
m z , j = k = 1 n r δ f z , k j ( r k j r h )   for   j = 1 , , n θ ,
where mz,j was the jth entry of the Mz,θ array, rkj was the radius to the center of element (k,j) and rh was the fan hub radius.
The peak bending moment (Mp) (Equation (7)) was used as the indicator of the severity of the dynamic blade loading. Venter [15] found this metric to provide the best correlation to experimental dynamic blade loading trends:
M p = max ( | M z , θ | ) ,
This peak bending moment was normalized with the peak bending moment at the “ideal” most uniform inlet airflow condition (Mp,id at v ¯ A z , i d ), as per Equation (8):
ϕ i = M p , i M p , i d ,

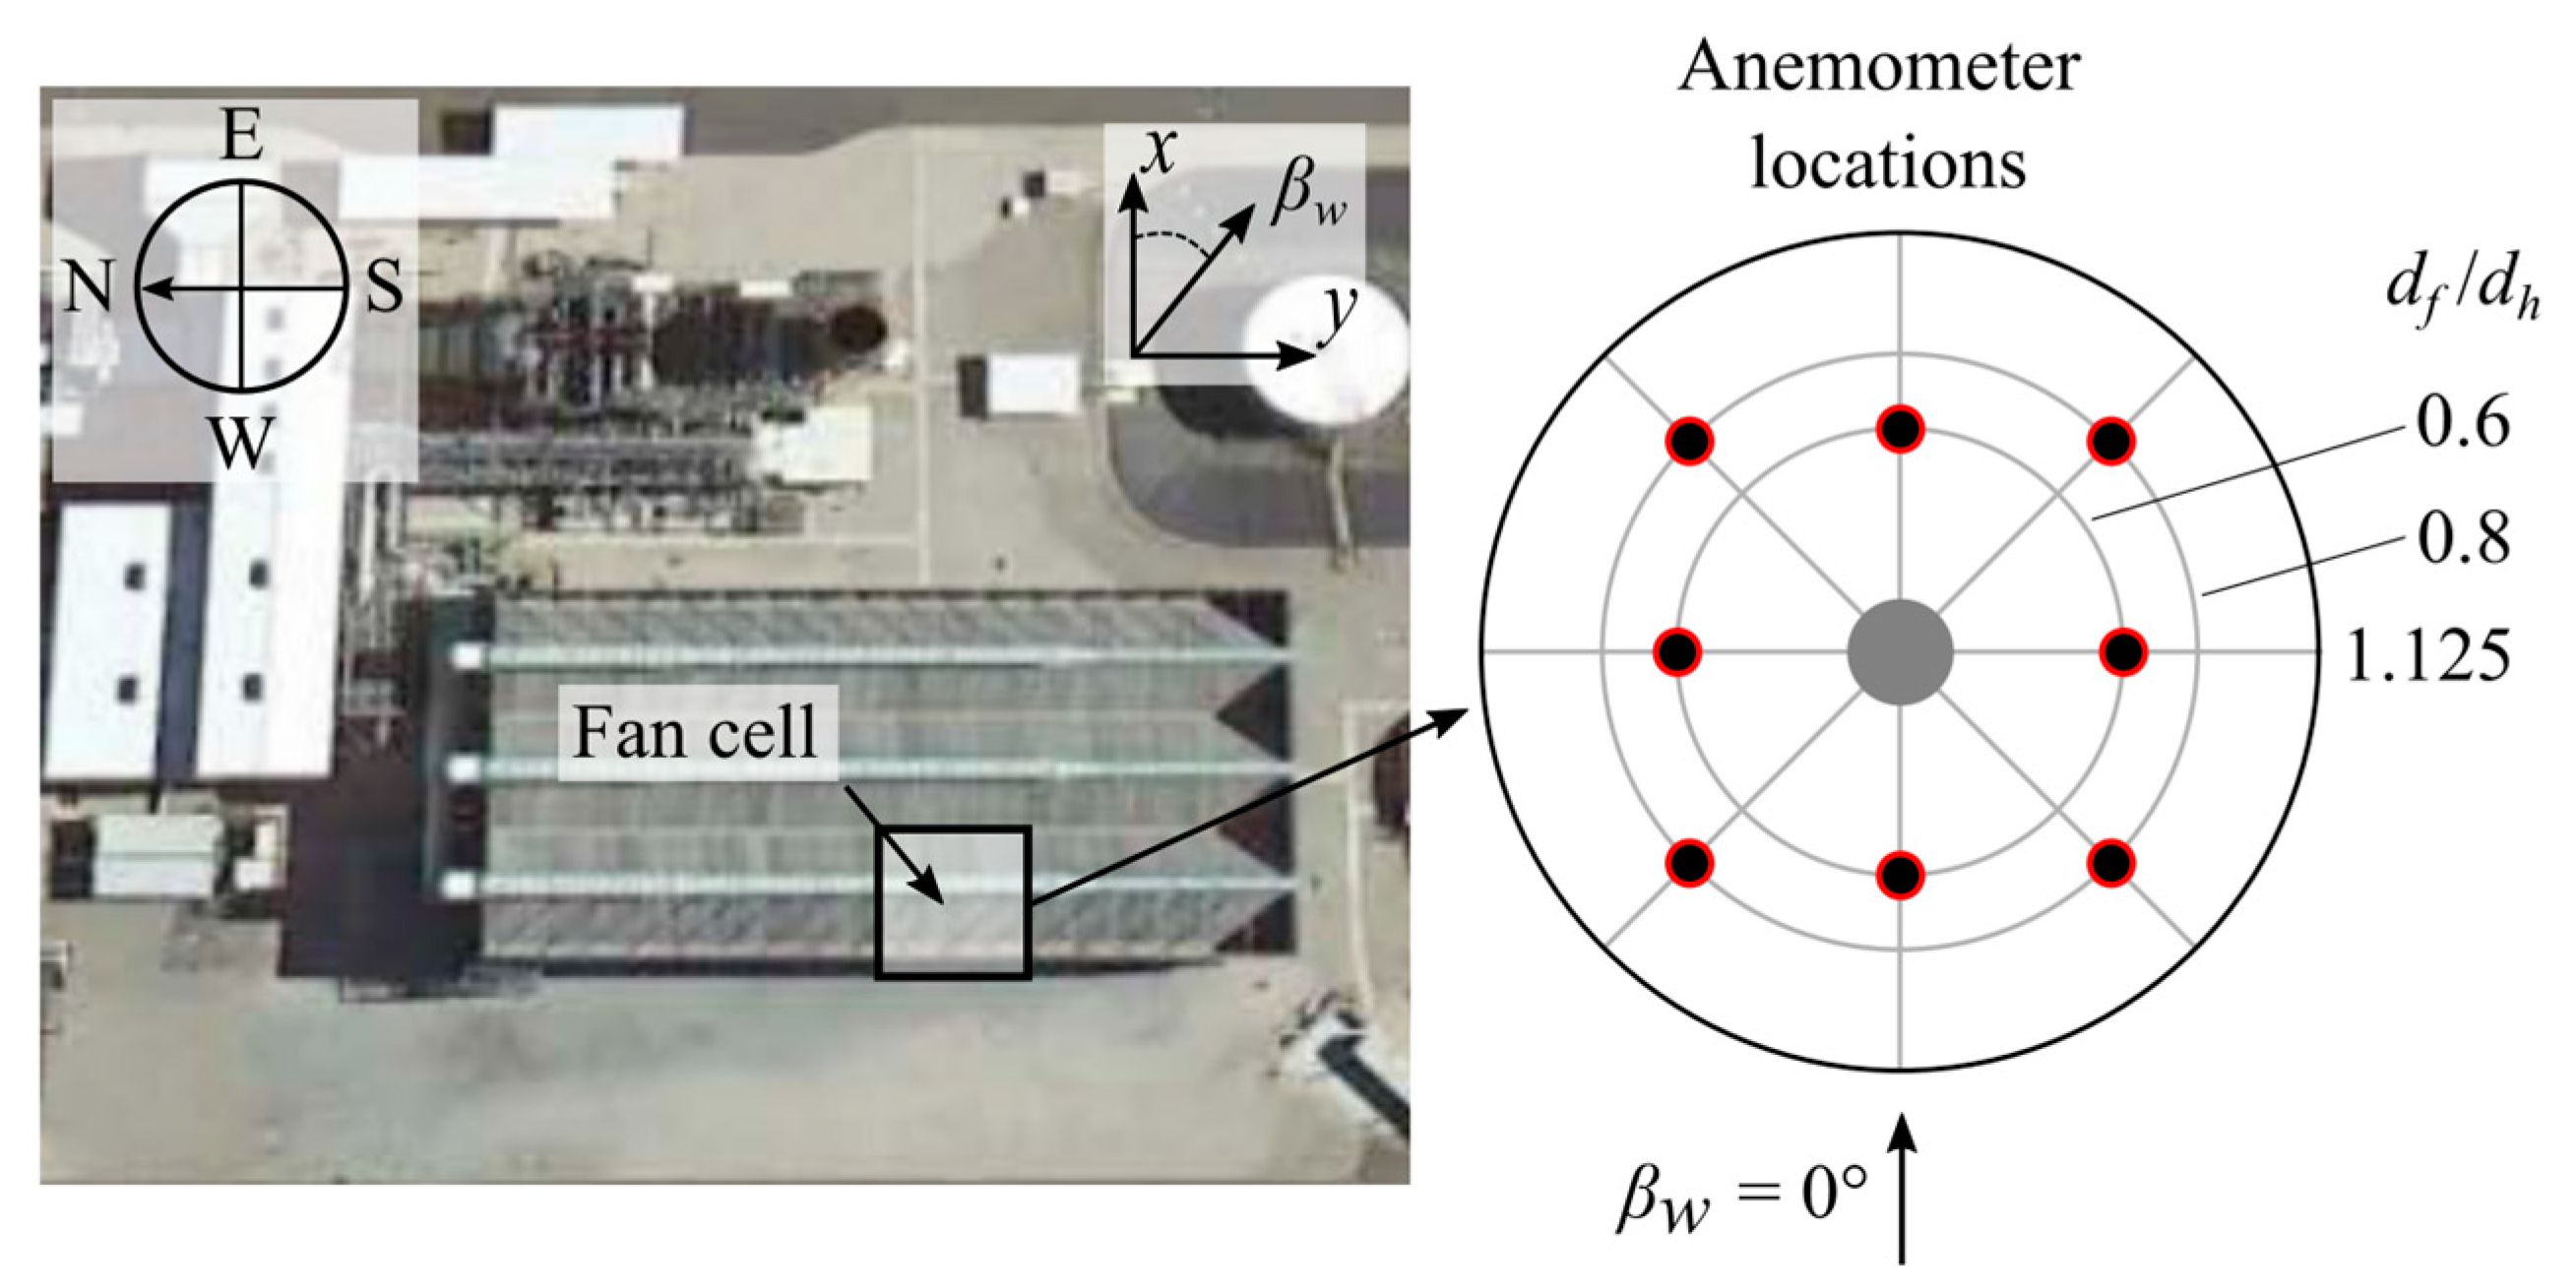
2.3. Experimental Measurements and Evaluation Metrics

Experimental data collected during tests described in [2] were used for validation of the CFD results in this study. The on-site tests conducted in [2] took place at a power plant that utilized a 3 × 6 cell ACC (Figure 5) with a fan platform height of Hp/df = 1.353, and the same axial fan was used in the numerical model. The axial flow and blade loading data of a single fan over a three-day period are used here. The wind direction within this time period was predominantly south-westerly to north-westerly (i.e., −45° ≤ βW ≤ 45°).
The fan and anemometer locations on the fan inlet screen are shown in Figure 5. Blade loading was measured using load cells installed at the retaining bolts of six of the nine fan blades. Data from a single load cell are considered here. The raw data (anemometers and load cell) were processed into average and standard deviation values, calculated over three-minute interval segments.
The experimental uniformity index (γex) was quantified using the average axial velocity ( v ¯ z ) of the eight anemometer measurements (na = 8), and not the area-weighted average. Equation (3) was therefore adapted to yield Equation (9):
γ e x = 1 j = 1 n a | v z , j v ¯ z | / n a     2 v ¯ z ,
The fan volumetric performance is presented in terms of volumetric effectiveness (ξex, Equation (5)) using the average of the eight anemometer measurements. The experimental dynamic blade loading was expressed as a normalized peak load (ϕex) using Equation (8). The peak load (Lp) was determined from the standard deviation of the load cell measurement over the three-minute interval (Lσ), using Equation (10) based on the assumption that the signal was purely sinusoidal:
L p = L σ 2 ,

3. Results

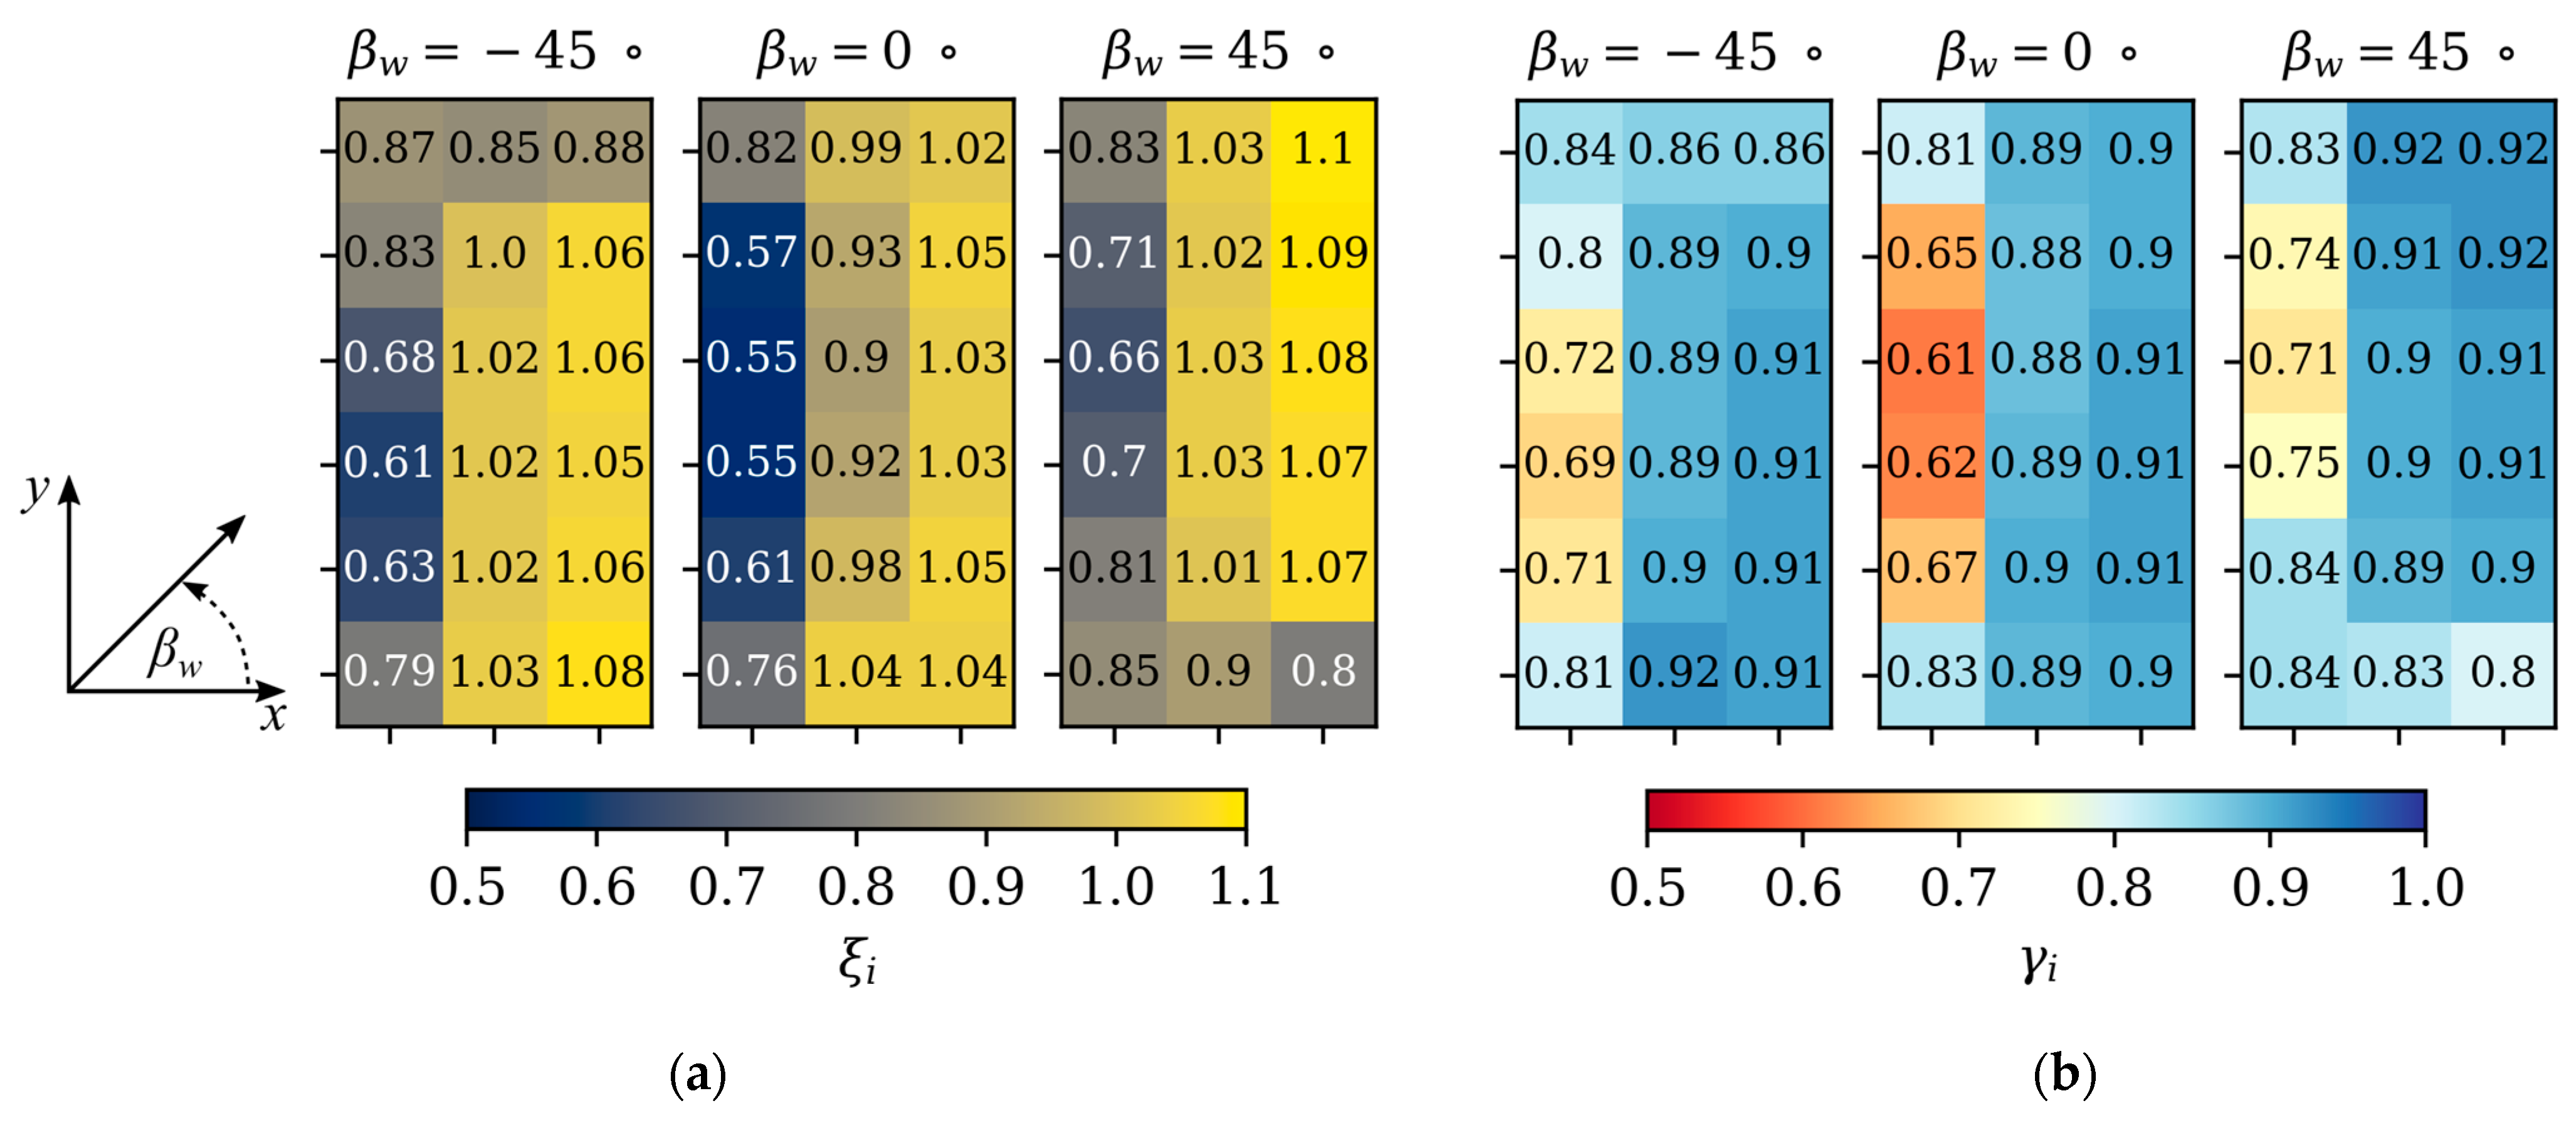
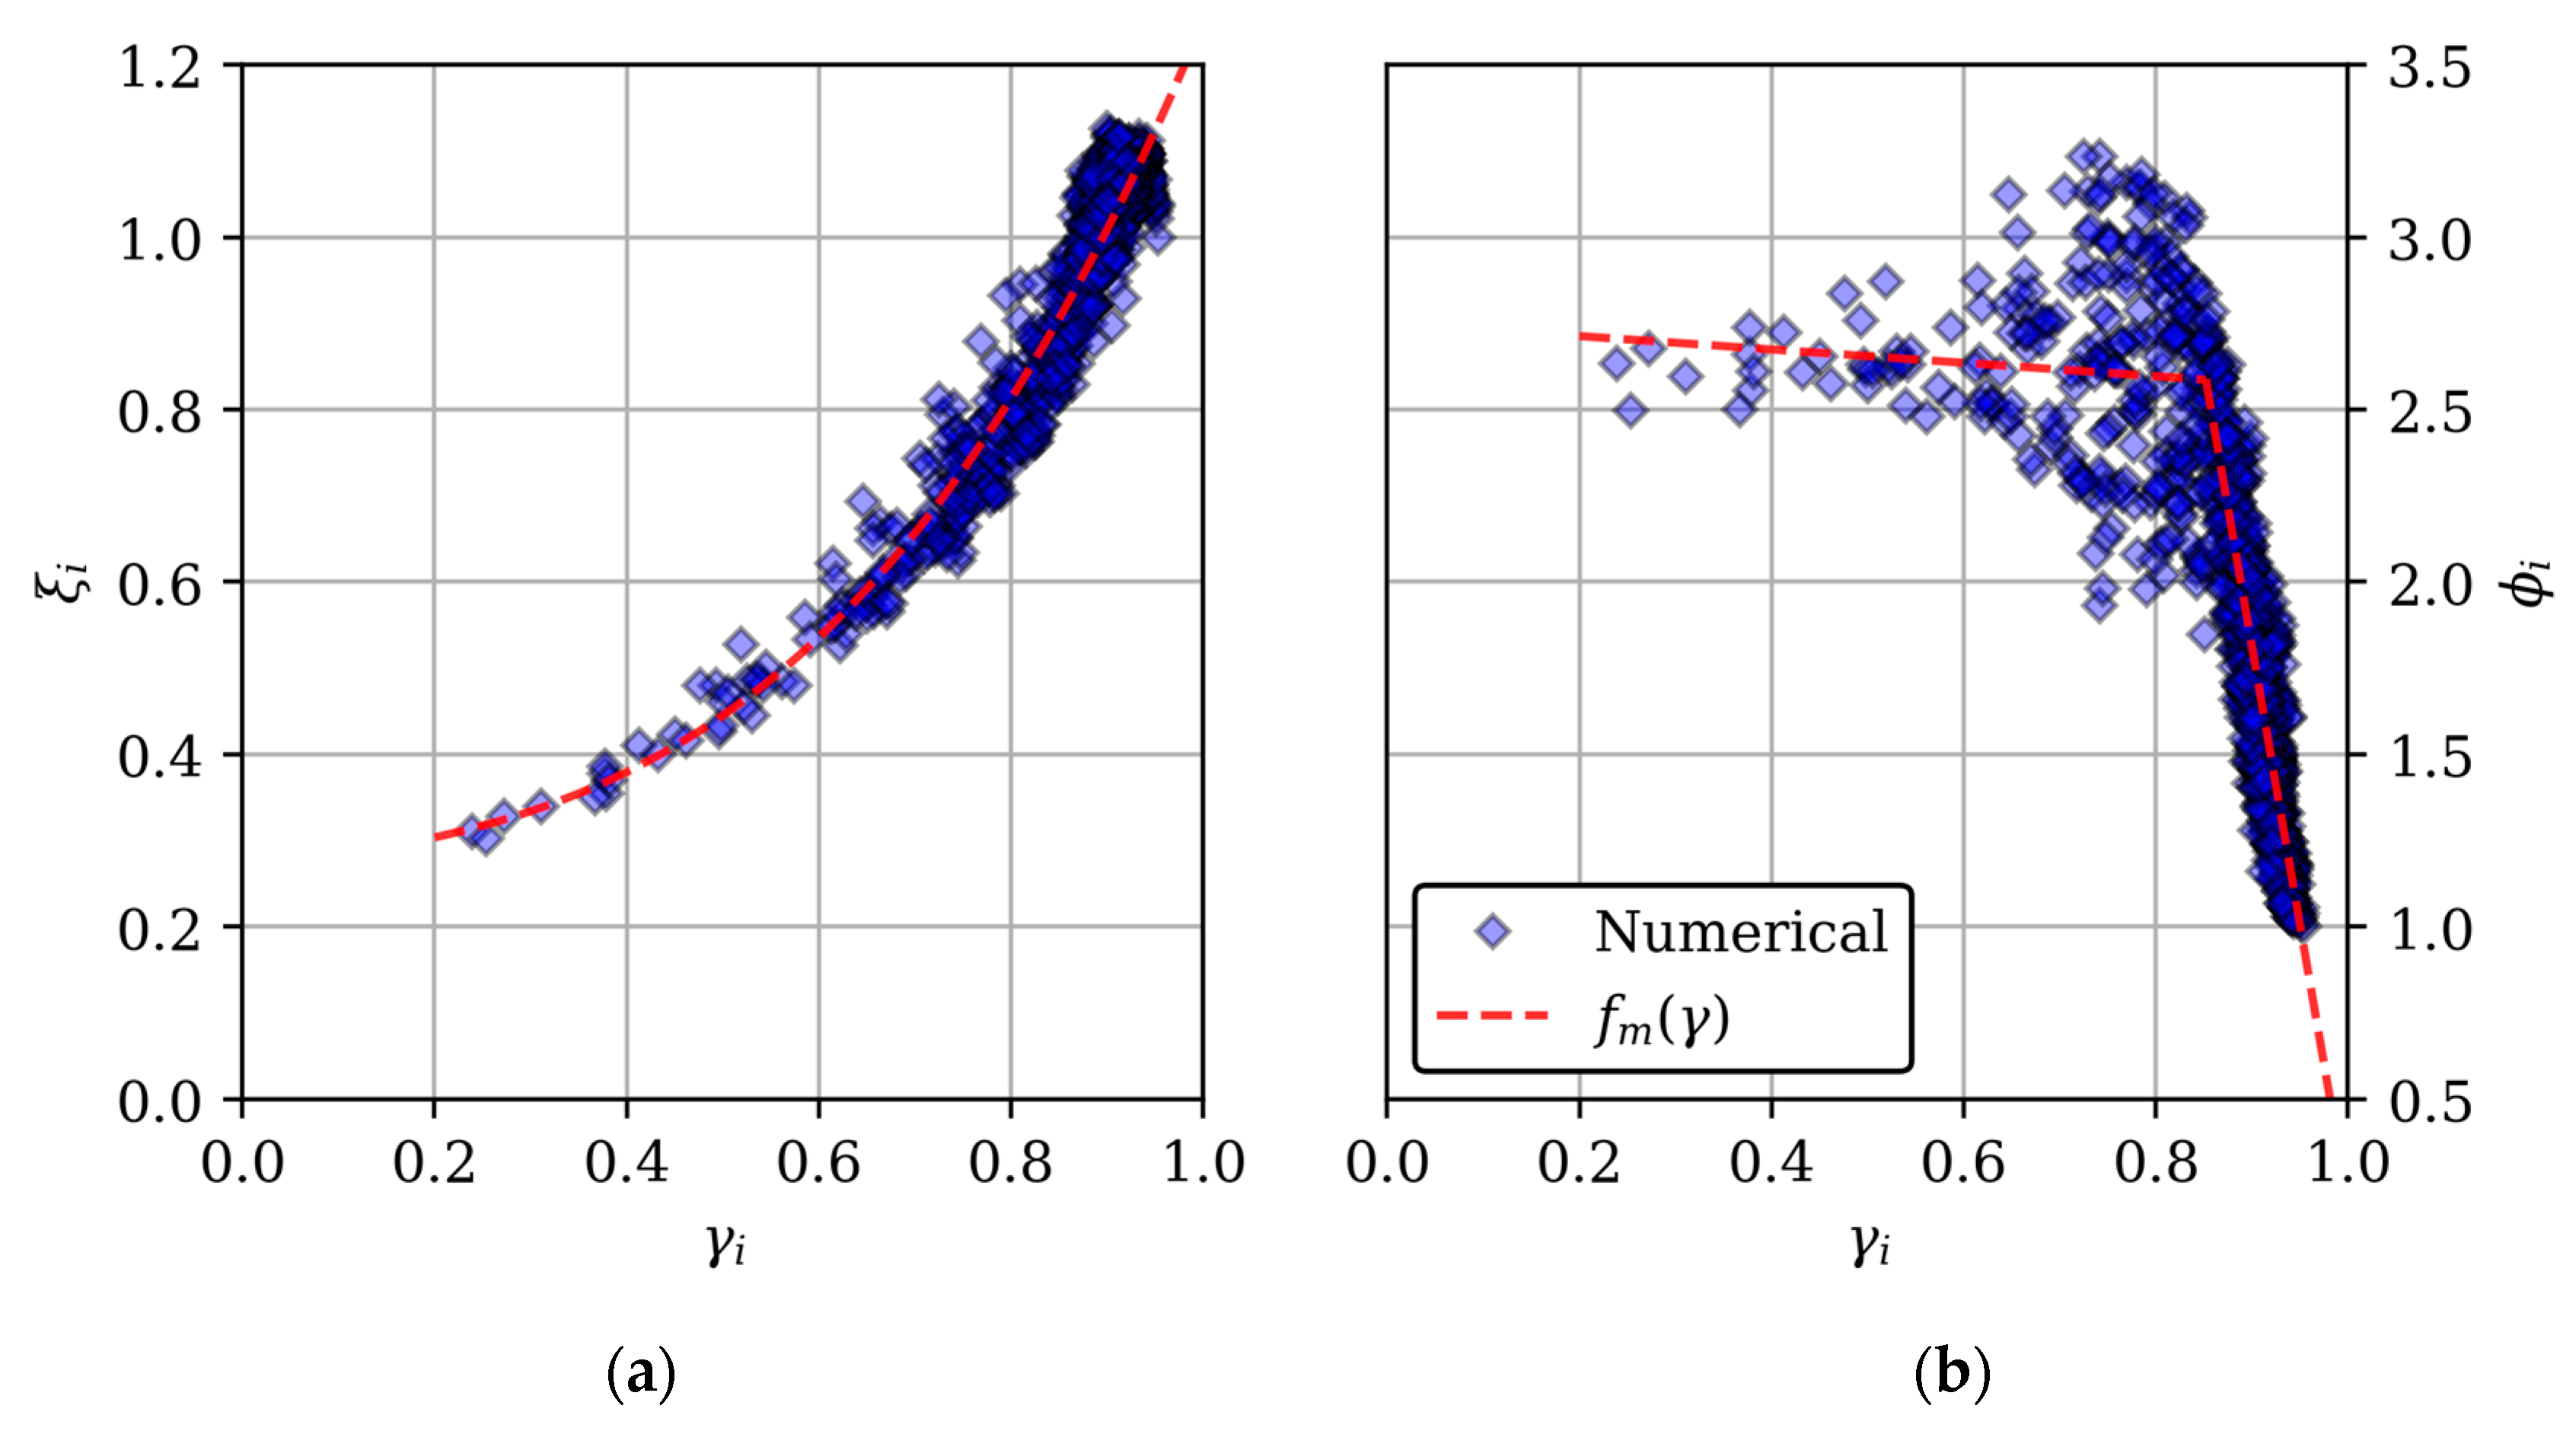
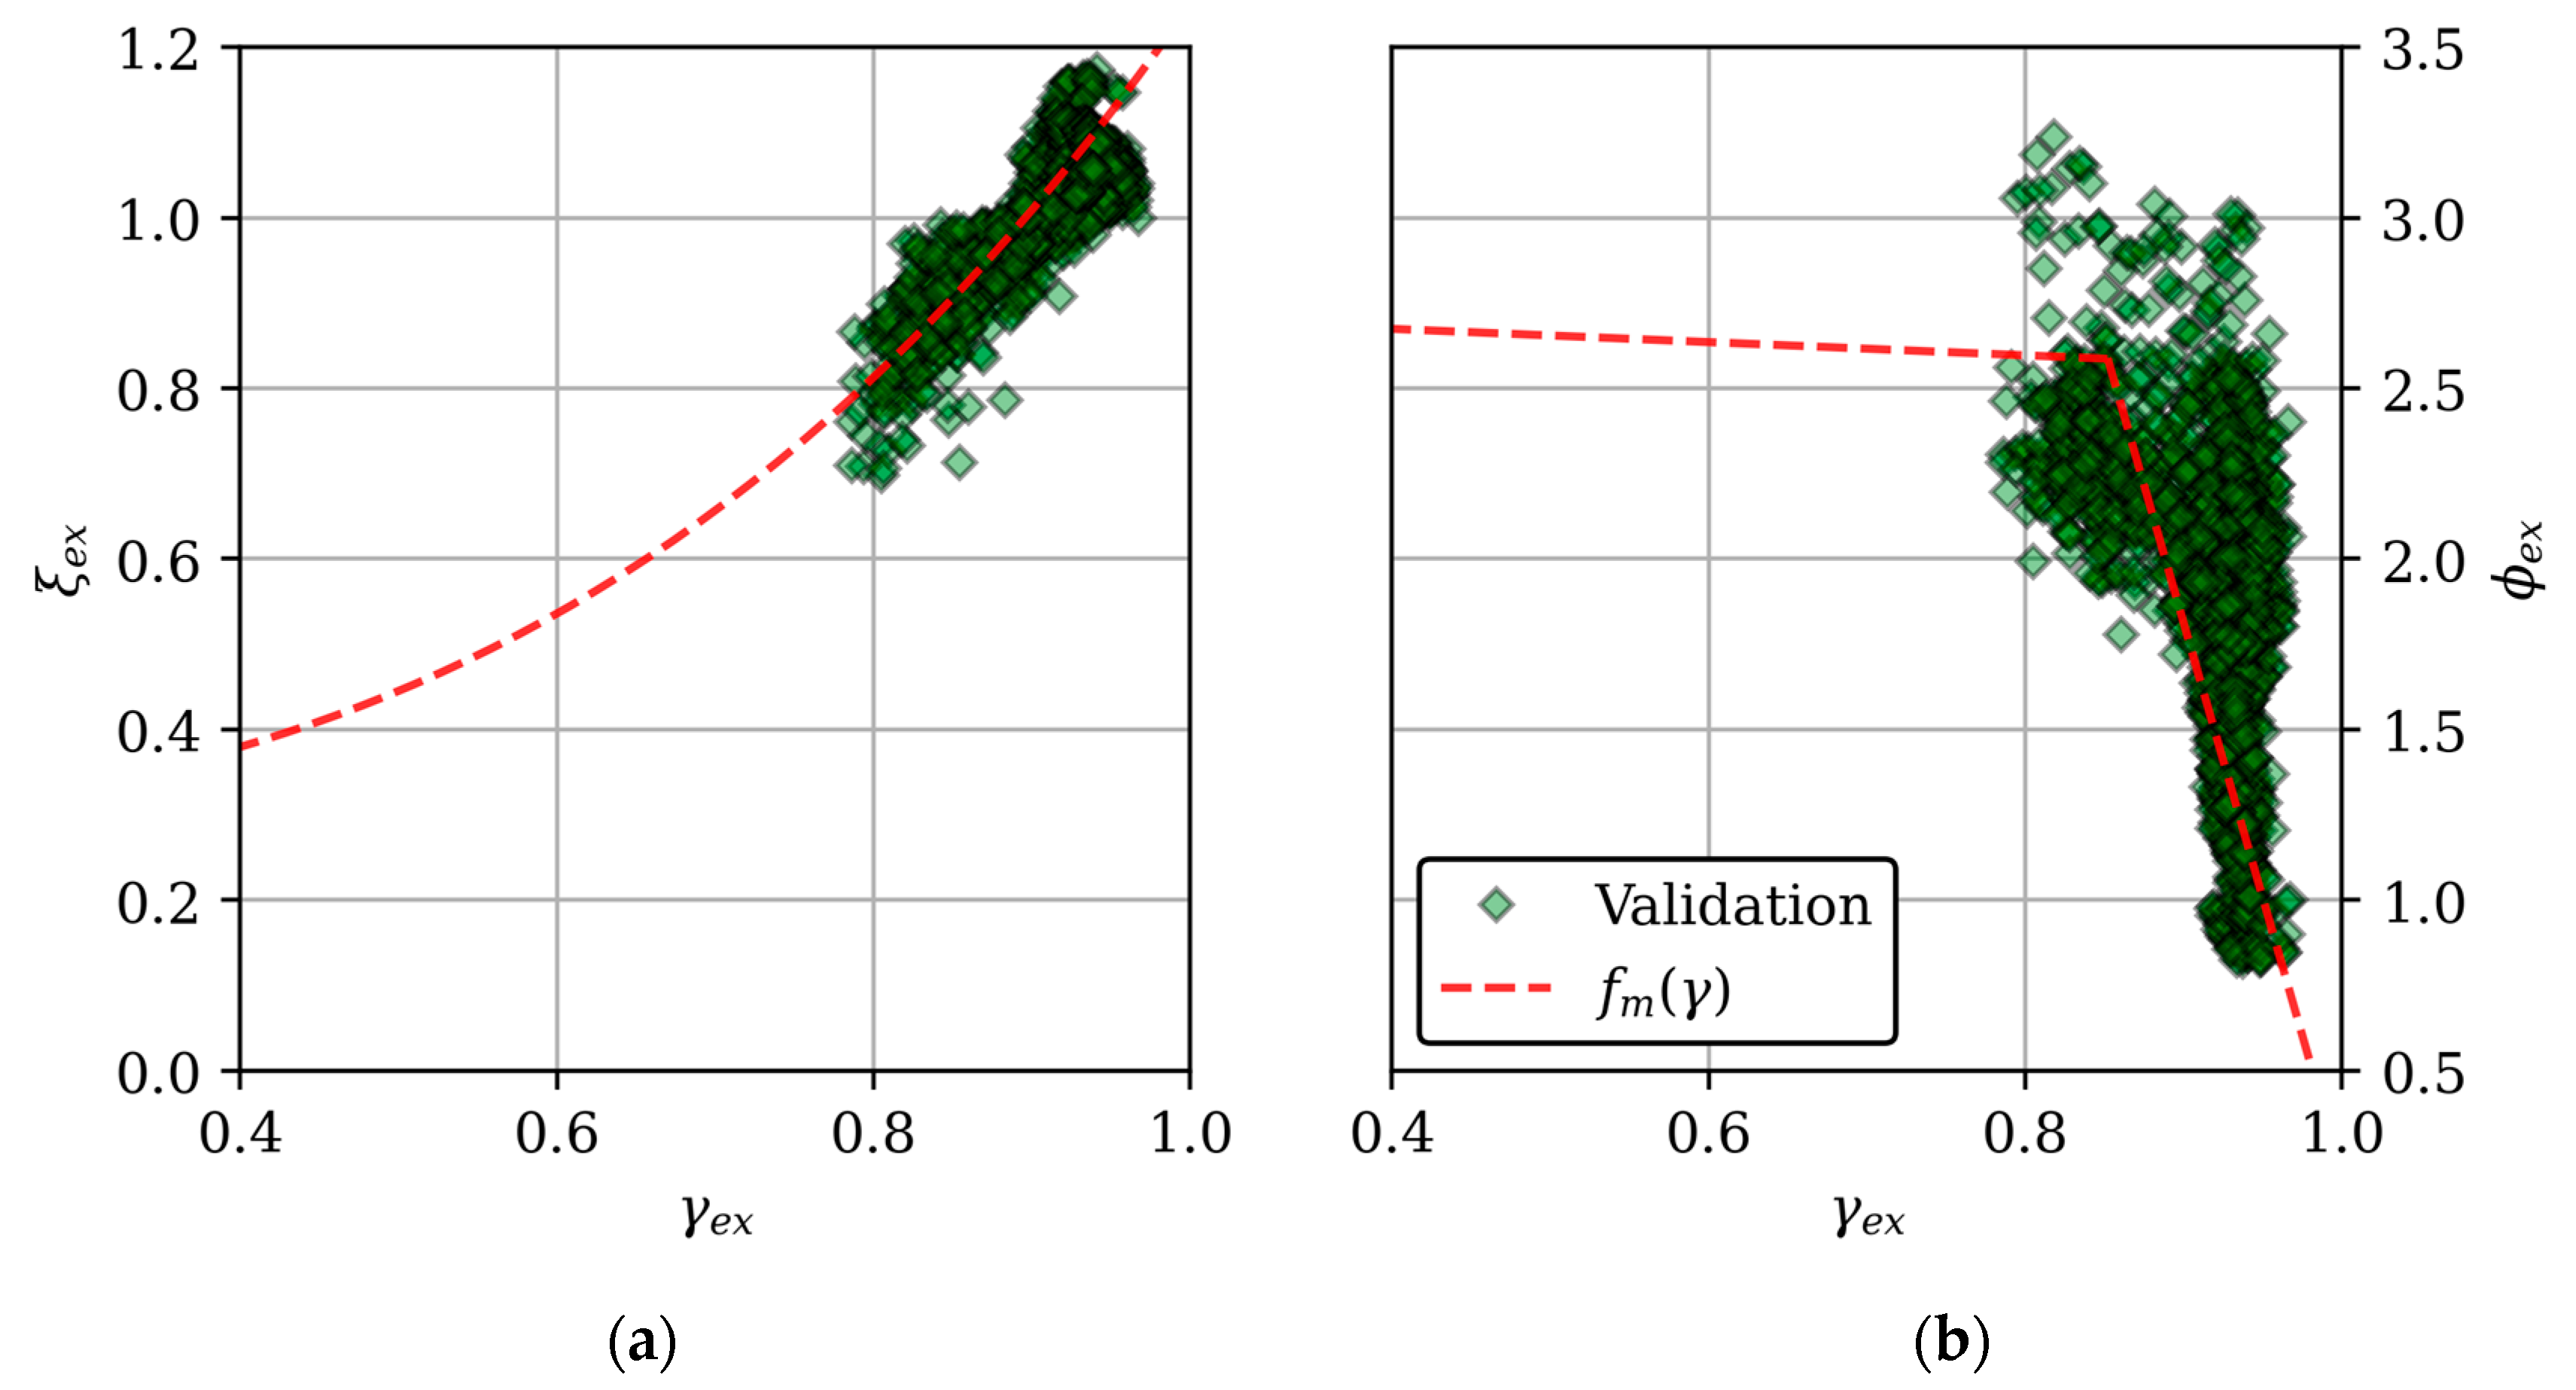
3.1. The Effect of Uniformity Index on Fan Performance and Dynamic Blade Loading

Figure 6 shows the numerically predicted individual fan cell volumetric effectiveness (ξi, Equation (5)) and uniformity index (γi, Equation (3)), for the 3 × 6 cell ACC at a wind speed of vw = 7 m/s.
Figure 6 shows similar trends in both volumetric effectiveness (ξi) and uniformity index (γi). This is expected since, for a uniformity index close to unity, the fan is likely operating close to design or “ideal” conditions, and thus ξi → 1. A decreasing uniformity index implies that the fan is subjected to distorted inlet conditions, which are known to negatively impact the volume flow rate through the fan (ξi < 1). It is interesting to note that the results are not simply mirrored for βw = −45° and βw = 45°. This “asymmetry” is due to the fact that the fans were all rotating in the same direction (clockwise in Figure 6). As a result, the relative velocities experienced by the fan blades differed with wind direction, causing differences in fan performance and blade loading.
In Figure 7, the individual fan cell volumetric effectiveness and normalized peak bending moment (ϕi, Equation (8)) are plotted against the uniformity index. The figure shows results for all 18 fan cells across the full range of simulated wind speeds (1 ≤ vw ≤ 11 m/s) and directions (−90° ≤ βw ≤ 90°). A total of 972 fan cell operating points are included in Figure 7. Mean trend lines through the data (fm(γ)) are also shown.
Figure 7 shows clear relationships between the fan uniformity index and both metrics of interest. A smooth, exponential trend is evident for volumetric effectiveness. The normalized peak bending moment increased rapidly with decreasing γi, reaching a maximum at γi ≈ 0.85. Thereafter (i.e., with further decreasing uniformity), the influence of γi decayed and eventually plateaued. The plateau was likely due to the fan inlet velocity vectors (specifically axial velocity) in the upwind half of the fan’s rotational plane reaching conditions that led to a loading scenario that could not necessarily have gotten much worse.
Figure 8 shows the corresponding experimental data as well as the trend lines (fm)) from Figure 7. It is clear that the numerical and experimental data correspond closely, and the numerical results are thus deemed valid.

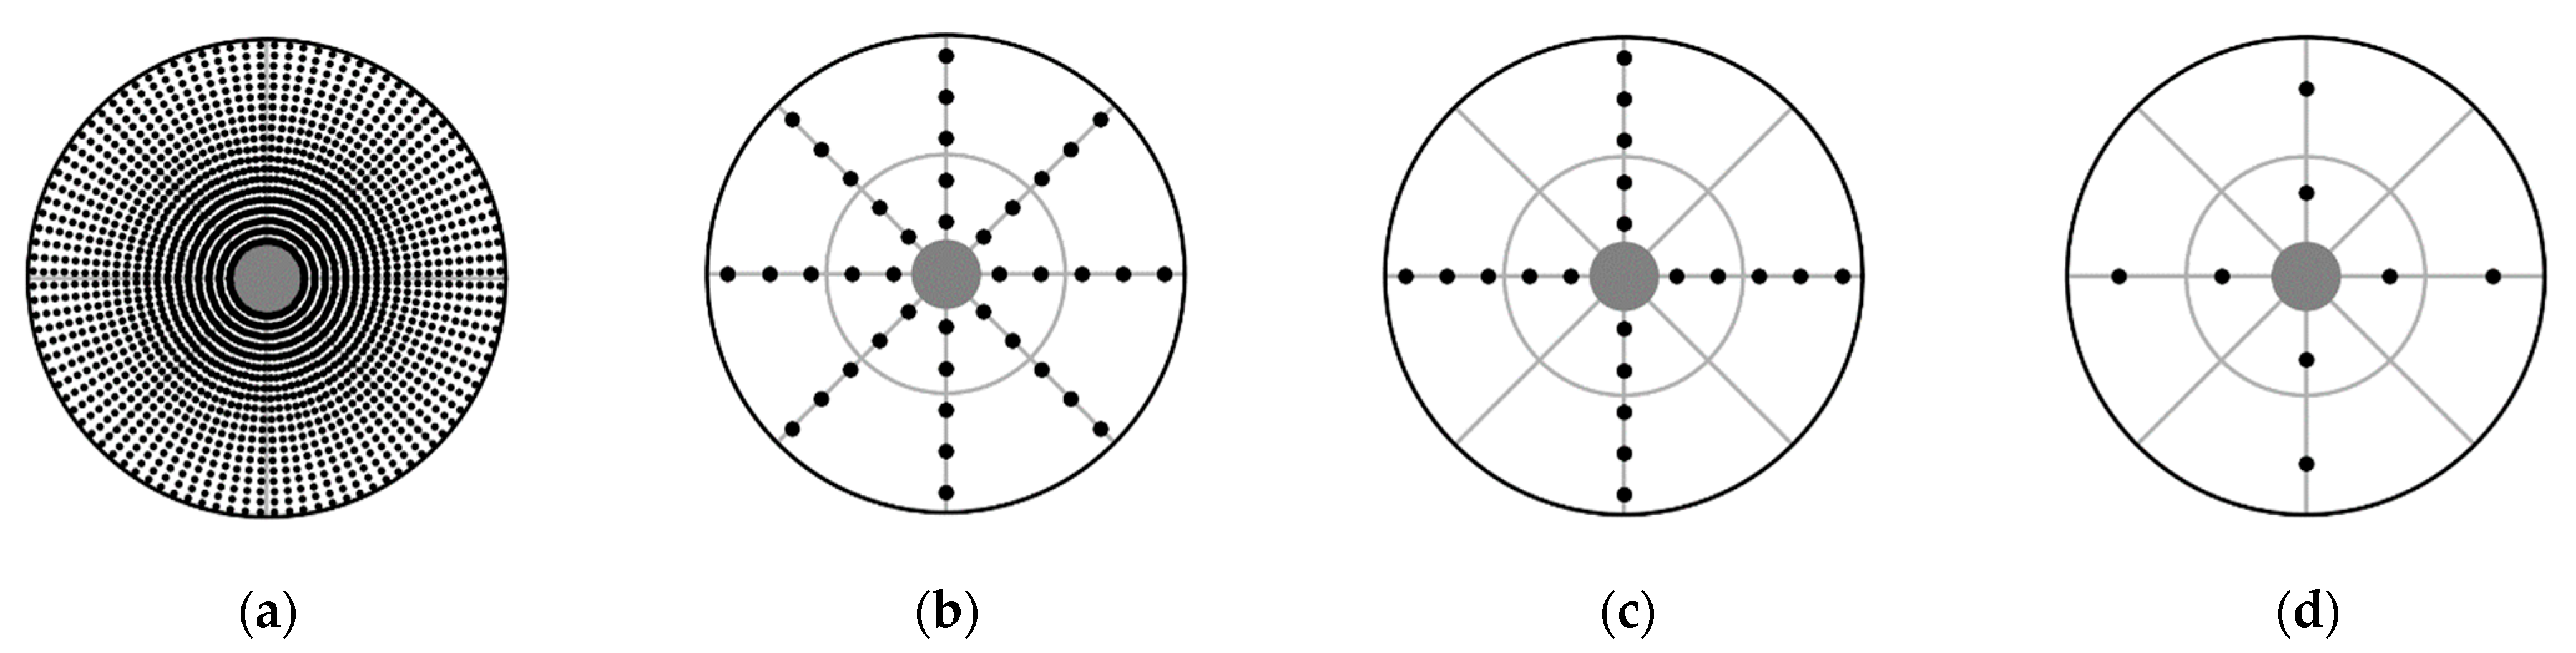
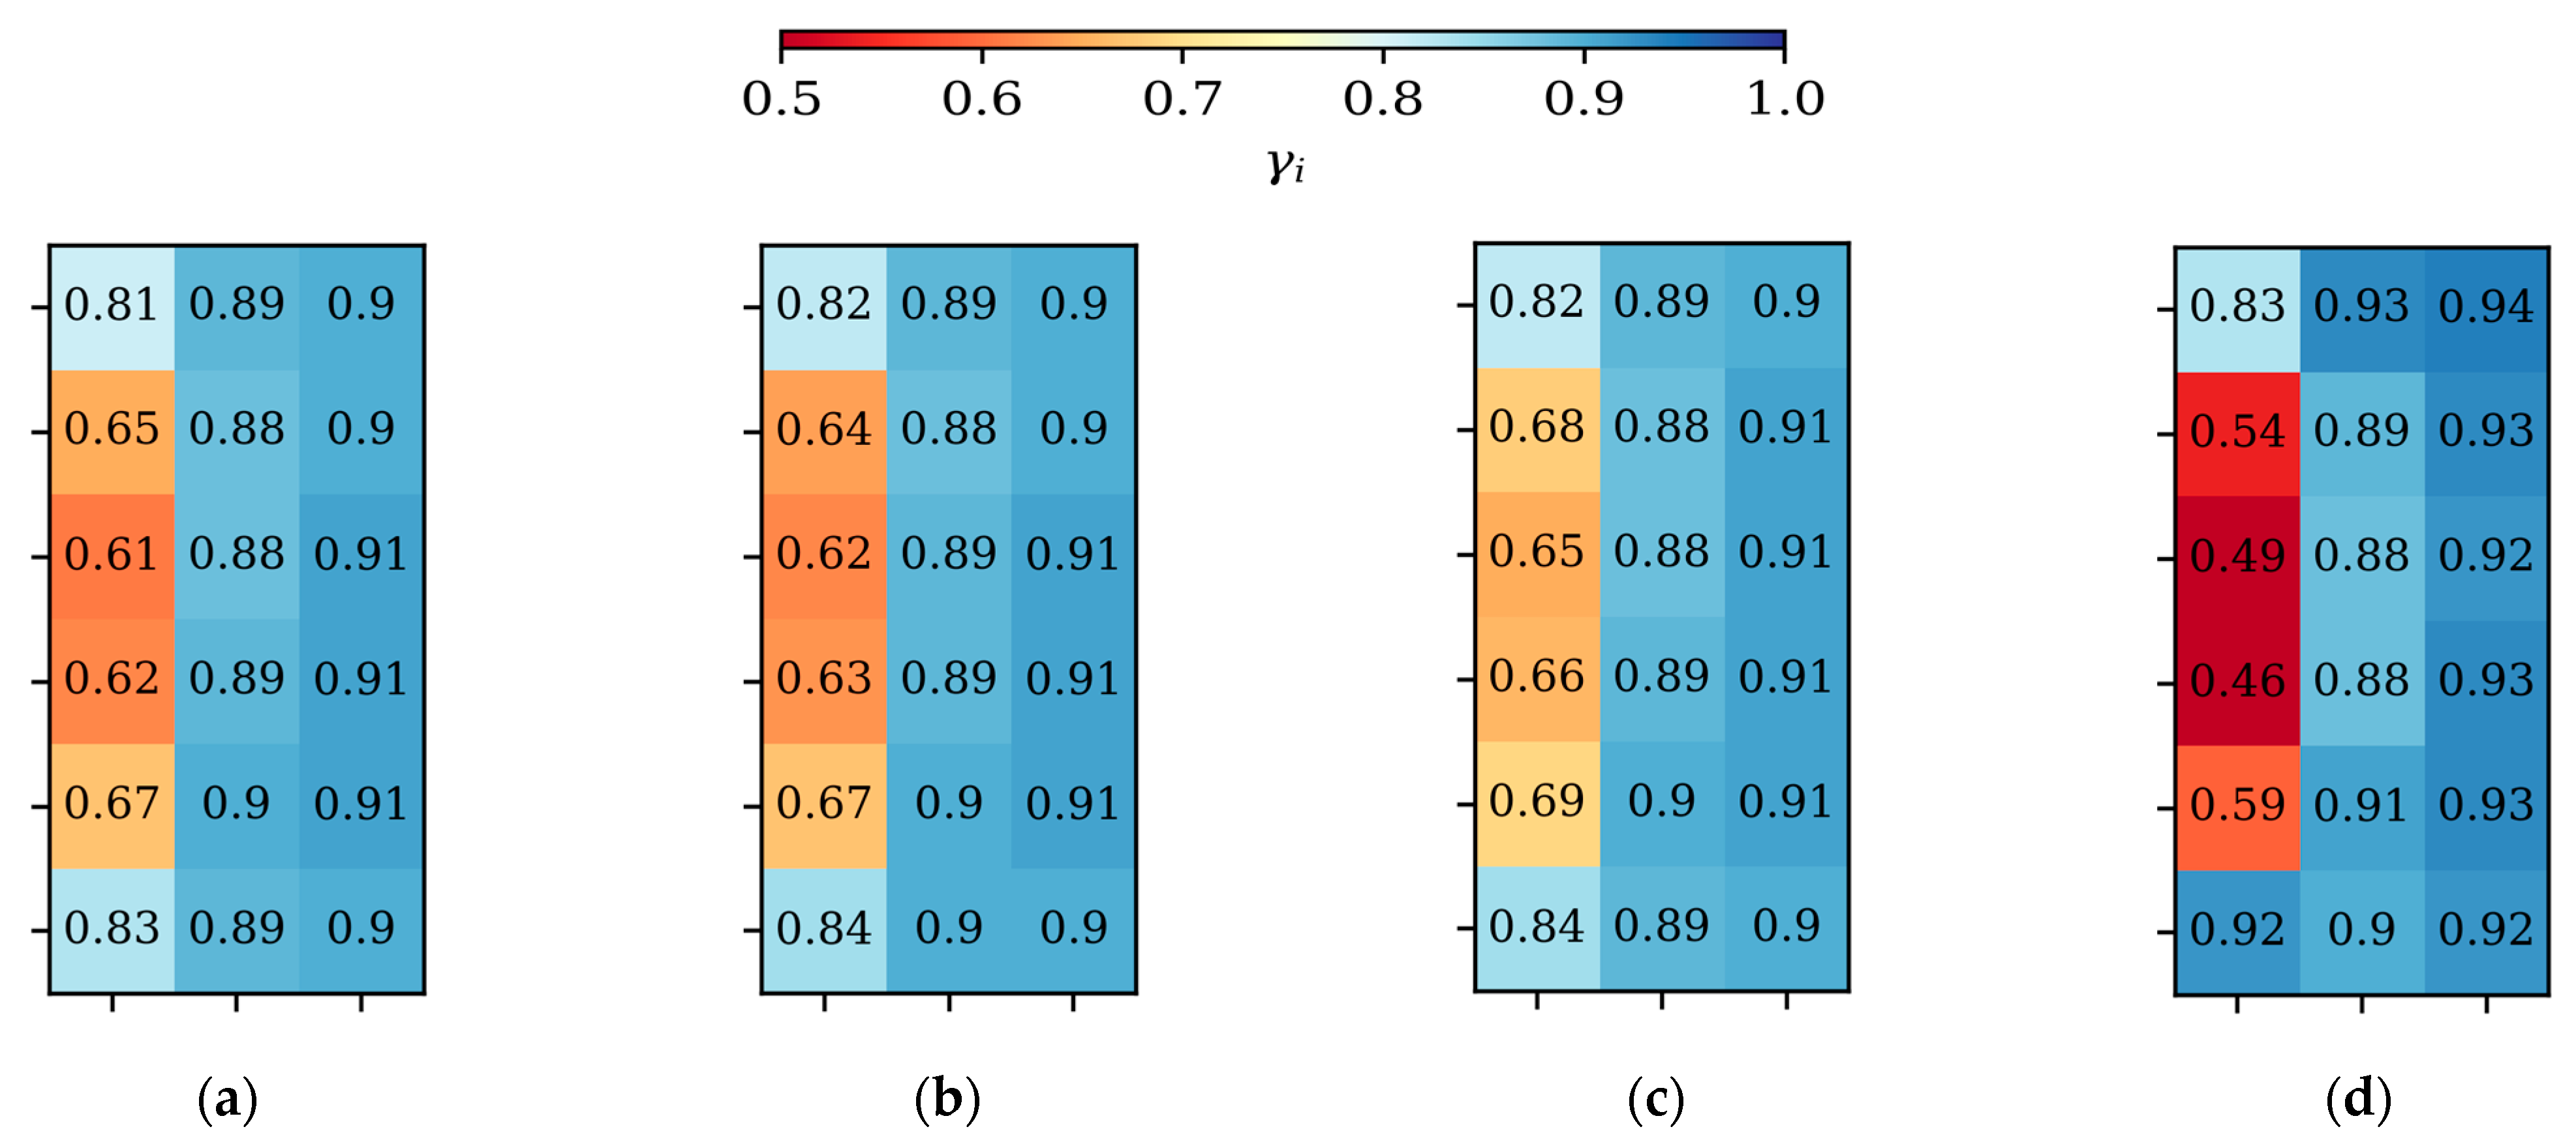
3.2. Sensitivity of Uniformity Index to Sampling Resolution

The experimental uniformity index is calculated using the measured axial velocities at discrete points within a polar coordinate grid. Changing the sampling resolution may thus influence the value of the uniformity index for a given scenario. This sensitivity was investigated by sampling the simulated fan inlet axial velocity distribution (originally (nr = 20) × (nθ = 120) = 2400 data points) using a coarser resolution and recalculating the uniformity index (Equation (3)) from the sampled numerical results. The sample location for the coarser uniformity index calculation within the fan rotor is shown in Figure 9. Figure 9c shows the minimum measurement resolution of the CTI-PTG-143 standard [12]:
The sampled uniformity index results are shown in Figure 10 for a wind speed of vw = 7 m/s with βw = 0°. The effect of sampling resolution clearly becomes significant at low resolutions (e.g., Figure 10c,d). The minimum resolution recommended by the CTI (Figure 9c) seems relatively robust in this case, where the wind was aligned with one of the sampling directions. It may be expected that such a sampling configuration, with fewer tangential divisions, may have a larger impact on the accuracy of the uniformity index for non-aligned wind directions (e.g., βw = 45°).
Based on our results, we tentatively recommend a sampling resolution of nr = 5 and nθ = 8 in order to accurately determine the uniformity index in ACCs from on-site measurements; however, further investigation is needed to account for the impact of a wider variety of wind conditions.

4. Discussion

Ambient wind has a negative effect on ACC fan volumetric performance, and increases dynamic fan blade loading. Investigating these effects directly using on-site measurement or numerical analysis is complicated, and most previous work has focused on only one effect at the expense of the other. Fan axial velocity inflow uniformity was identified as offering the potential to holistically qualify ACC fan operation under windy conditions. Fan inflow uniformity was thus investigated for a range of wind conditions using CFD with validation against on-site measurements for a specific ACC.
The results indicate clear relationships between the inflow uniformity index (γ—Equation (3)) and both fan volumetric effectiveness and dynamic blade loading (see Figure 7). The fan inlet airflow uniformity index (γ) can therefore be used as a single metric to estimate the severity of both the reduction in fan volumetric performance and the increase in dynamic blade loading under windy conditions. The same proportional relationship was observed in both the numerical and experimental data, suggesting that the uniformity index can be used in both numerical and experimental work, to allow for qualitative investigation of wind effects (and their mitigation).
The potential utility of the uniformity index in numerical simulation is that the state of fan blade dynamic loading can be inferred without additional data processing or the need for blade element theory-based fan models. For continuous on-site experimental measurements, the uniformity index can indicate a fan cell’s volumetric performance and dynamic blade loading using significantly less measurement equipment (less than 40 anemometers, and no need for strain gauges, bridge amplifiers and wireless transmitters). Furthermore, the uniformity index (generated using simplified CFD models) can be used to specify the potential severity of the operating conditions expected at an axial fan installation, and to assist vendors and clients in designing and selecting more reliable fans (both in terms of performance and structural integrity).

Author Contributions

Conceptualization, M.O. and J.M.; methodology, F.M.; software, F.M.; validation, F.M., M.O. and J.M.; formal analysis, F.M.; investigation, P.H.; resources, M.O. and J.M.; data curation, F.M. and P.H.; writing—original draft preparation, F.M.; writing—review and editing, M.O. and J.M.; visualization, F.M.; supervision, M.O. and J.M.; project administration, M.O.; funding acquisition, M.O. and J.M. All authors have read and agreed to the published version of the manuscript.

Funding

This research received financial support from the Solar Thermal Energy Research Group, Stellenbosch University, Stellenbosch 7600, South Africa.

Institutional Review Board Statement

Not applicable.

Informed Consent Statement

Not applicable.

Data Availability Statement

Numerical data are available on request from the corresponding author. The raw experimental data were provided by a third party, and are restricted.

Acknowledgments

The authors acknowledge the computational resources provided by the Centre for High-Performance Computing (CHPC), South Africa.

Conflicts of Interest

The authors declare no conflict of interest.

References

  1. Maulbetsch, J.; DiFilippo, M. Effect of Wind Speed and Direction on the Performance of Air-Cooled Condensers; California Energy Commission: Sacramento, CA, USA, 2008; Publication Number CEC-5002013-065-APB. [Google Scholar]
  2. Maulbetsch, J.; DiFilippo, M. The Use of Wind Barriers to Mitigate the Effect of Wind on Air-Cooled Condensers; California Energy Commission: Sacramento, CA, USA, 2016; Publication number: CEC-500-2016-047. [Google Scholar]
  3. Bredell, J.R.; Kröger, D.G.; Thiart, G.D. Numerical investigation of fan performance in a forced draft air-cooled steam condenser. Appl. Therm. Eng. 2006, 26, 846–852. [Google Scholar] [CrossRef] [Green Version]
  4. Thiart, G.D.; Von Backström, T.W. Numerical simulation of the flow field near an axial flow fan operating under distorted inflow conditions. J. Wind Eng. Ind. Aerodyn. 1993, 45, 189–214. [Google Scholar] [CrossRef]
  5. Meyer, C.J. Numerical investigation of the effect of inlet flow distortions on forced draught air-cooled heat exchanger performance. Appl. Therm. Eng. 2005, 25, 1634–1649. [Google Scholar] [CrossRef]
  6. Stinnes, W.H.; Von Backström, T.W. Effect of cross-flow on the performance of air-cooled heat exchanger fans. Appl. Therm. Eng. 2002, 22, 1403–1415. [Google Scholar] [CrossRef]
  7. Hotchkiss, P.J.; Meyer, C.J.; Von Backström, T.W. Numerical investigation into the effect of cross-flow on the performance of axial flow fans in forced draught air-cooled heat exchangers. Appl. Therm. Eng. 2006, 26, 200–208. [Google Scholar] [CrossRef]
  8. Marincowitz, F.S. Experimental Investigation of the Effects of Windscreens on Air-Cooled Condenser Fan Performance and Dynamic Blade Loading. Master’s Thesis, University of Stellenbosch, Stellenbosch, South Africa, 2019. [Google Scholar]
  9. Muiyser, J.; Els, D.N.J.; Van der Spuy, S.J.; Zapke, A. Measurement of air flow and blade loading at a large-scale cooling system fan. J. S. Afr. Inst. Mech. Eng. 2014, 30, 30–38. [Google Scholar]
  10. Yang, L.J.; Du, X.Z.; Yang, Y.P. Wind effect on the thermo-flow performances and its decay characteristics for air-cooled condensers in a power plant. Int. J. Therm. Sci. 2012, 53, 175–187. [Google Scholar] [CrossRef]
  11. Marincowitz, F.S.; Owen, M.T.F.; Muiyser, J. The Effect of Windscreens and Walkways on Air-cooled Condenser Performance and Fan Blade Dynamic Loading. J. Eng. Gas Turbines Power 2021, 143, 101019. [Google Scholar] [CrossRef]
  12. Cooling Tower Institute. CTI Standard PTG-143: Recommended Practice For Airflow Testing of Cooling Towers; Cooling Tower Institute: Houston, TX, USA, 1994. [Google Scholar]
  13. Bredell, J.R.; Kröger, D.G.; Thiart, G.D. Numerical investigation into aerodynamic blade loading in large axial flow fans operating under distorted inflow conditions. J. S. Afr. Inst. Mech. Eng. 2006, 22, 12. [Google Scholar]
  14. Bianchini, C.; Mirsky, G.; Frumkin, M. Windscreen effect on performance and structure, before and after, and comparison with CFD. In Proceedings of the ACC User Group, Colorado Springs, CO, USA, 8–11 October 2018. [Google Scholar]
  15. Venter, A.J. Numerical Analysis of Windscreen Effects on Air-Cooled Condenser Fan Performance and Blade Loading. Master’s Thesis, University of Stellenbosch, Stellenbosch, South Africa, 2020. [Google Scholar]
  16. Engelbrecht, R.A.; Meyer, C.J.; Van der Spuy, S.J. Modeling Strategy for the Analysis of Forced Draft Air-Cooled Condensers Using Rotational Fan Models. J. Therm. Sci. Eng. Appl. 2019, 11, 051011. [Google Scholar] [CrossRef]
  17. Venter, A.J.; Owen, M.T.F.; Muiyser, J. A numerical analysis of windscreen effects on air-cooled condenser fan performance. Appl. Therm. Eng. 2021, 186, 116416. [Google Scholar] [CrossRef]
  18. Marincowitz, F.S. Optimisation towards a Wind-Resistant Air-Cooled Condenser for the Modern Energy Sector. Ph.D. Thesis, University of Stellenbosch, Stellenbosch, South Africa, 2021. [Google Scholar]
  19. Franke, J.; Hirsch, C.; Jensen, G.; Krüs, G.W.; Miles, S.D.; Schatzmann, M.; Westbury, P.S.; Wisse, J.A.; Wright, N. Recommendations on the use of CFD in wind engineering. In Proceedings of the International Conference on Urban Wind Engineering and Buildings Aerodynamics, Sint-Genesius-Rode, Belgium, 5–7 May 2004. [Google Scholar]
  20. Richards, P.J.; Hoxey, R.P. Appropriate boundary conditions for computational wind engineering models using the k-ε turbulence model. J. Wind Eng. Ind. Aerodyn. 1993, 46–47, 145–153. [Google Scholar] [CrossRef]
  21. Kröger, D.G. Air-Cooled Heat Exchangers and Cooling Towers: Thermal-Flow Performance Evaluation and Design; PennWell Corporation: Tulsa, OK, USA, 2004. [Google Scholar]
  22. Kays, W.M.; London, A.L. Compact Heat Exchangers, 3rd ed.; McGraw-Hill: New York, NY, USA, 1984. [Google Scholar]
  23. Van der Spuy, S.J.; Von Backström, T.W. An evaluation of simplified CFD models applied to perimeter fans in air-cooled steam condensers. Proc. Inst. Mech. Eng. Part A J. Power Energy 2015, 229, 948–967. [Google Scholar] [CrossRef]
  24. ANSYS Inc. ANSYS Fluent Theory Guide; Release 15.0; ANSYS Inc.: Canonsburg, PA, USA, 2013. [Google Scholar]
Figure 1. Air-cooled condenser schematic showing primary components and wind effects.
Ijtpp 07 00035 g001
Figure 2. Computational domain for 0° ≤ βw ≤ 90°: (a) top view; (b) 3 × 6 fan array layout.
Ijtpp 07 00035 g002
Figure 3. Numerical fan cell configuration and mesh.
Ijtpp 07 00035 g003
Figure 4. EADM vector diagram.
Ijtpp 07 00035 g004
Figure 5. ACC layout and anemometer locations (adapted from [2]).
Ijtpp 07 00035 g005
Figure 6. Numerically predicted individual fan cell: (a) volumetric effectiveness; (b) uniformity index, with changing wind direction (vw = 7 m/s).
Ijtpp 07 00035 g006
Figure 7. The effect of individual fan cell uniformity index (γi) on: (a) volumetric effectiveness; (b) normalized peak bending moment.
Ijtpp 07 00035 g007
Figure 8. Experimental measured effect of uniformity index on: (a) volumetric effectiveness; (b) normalized peak blade load.
Ijtpp 07 00035 g008
Figure 9. Sampling resolution used for calculating uniformity index: (a) nr = 20, nθ = 120; (b) nr = 5, nθ = 8; (c) nr = 5, nθ = 4; (d) nr = 2, nθ = 4.
Ijtpp 07 00035 g009
Figure 10. The influence of sampling resolution on uniformity index: (a) nr = 20, nθ = 120; (b) nr = 5, nθ = 8; (c) nr = 5, nθ = 4; (d) nr = 2, nθ = 4 (vw = 7 m/s; βw = 0°).
Ijtpp 07 00035 g010
Table 1. Heat exchanger specifications.
Parameter NameSymbolValue
Tube lengthLt10 m
Number of tubes (row 1)nt1228
Number of tubes (row 2)nt2232
Inner tube heightHt0.097 m
Inner tube widthWt0.017 m
Half apex angleθ36°
Heat exchanger frontal areaAfr137.7 m2
Table 2. Axial fan specifications.
Parameter NameSymbolValue
Fan diameterdf10.363 m
Hub diameterdh1.4 m
Number of bladesnb9
Rotational speedN93.2 rpm
Design flow rate 1 V ˙ 576.54 m3/s
Design pressure rise 1p119.8 Pa
1 At a reference air density of ρa = 1.22 kg/m3.
Publisher’s Note: MDPI stays neutral with regard to jurisdictional claims in published maps and institutional affiliations.

