

Identification of Hazard and Socio-Demographic Patterns of Dengue Infections in a Colombian Subtropical Region from 2015 to 2020: Cox Regression Models and Statistical Analysis

 , ,
, ,  , , , and
Abstract
:1. Introduction
2. Methodology
2.1. Case Study
2.2. Dataset
2.3. Statistical Analyses
3. Results
3.1. Dengue in Antioquia: 2015–2020
3.2. Symptomatological Behavior by Both Subregion and by Type of Dengue
3.3. Impact of Socio-Demographic Variables in Clinical Deterioration Time of Hospitalized Patients
4. Discussion
4.1. Dengue in Colombia
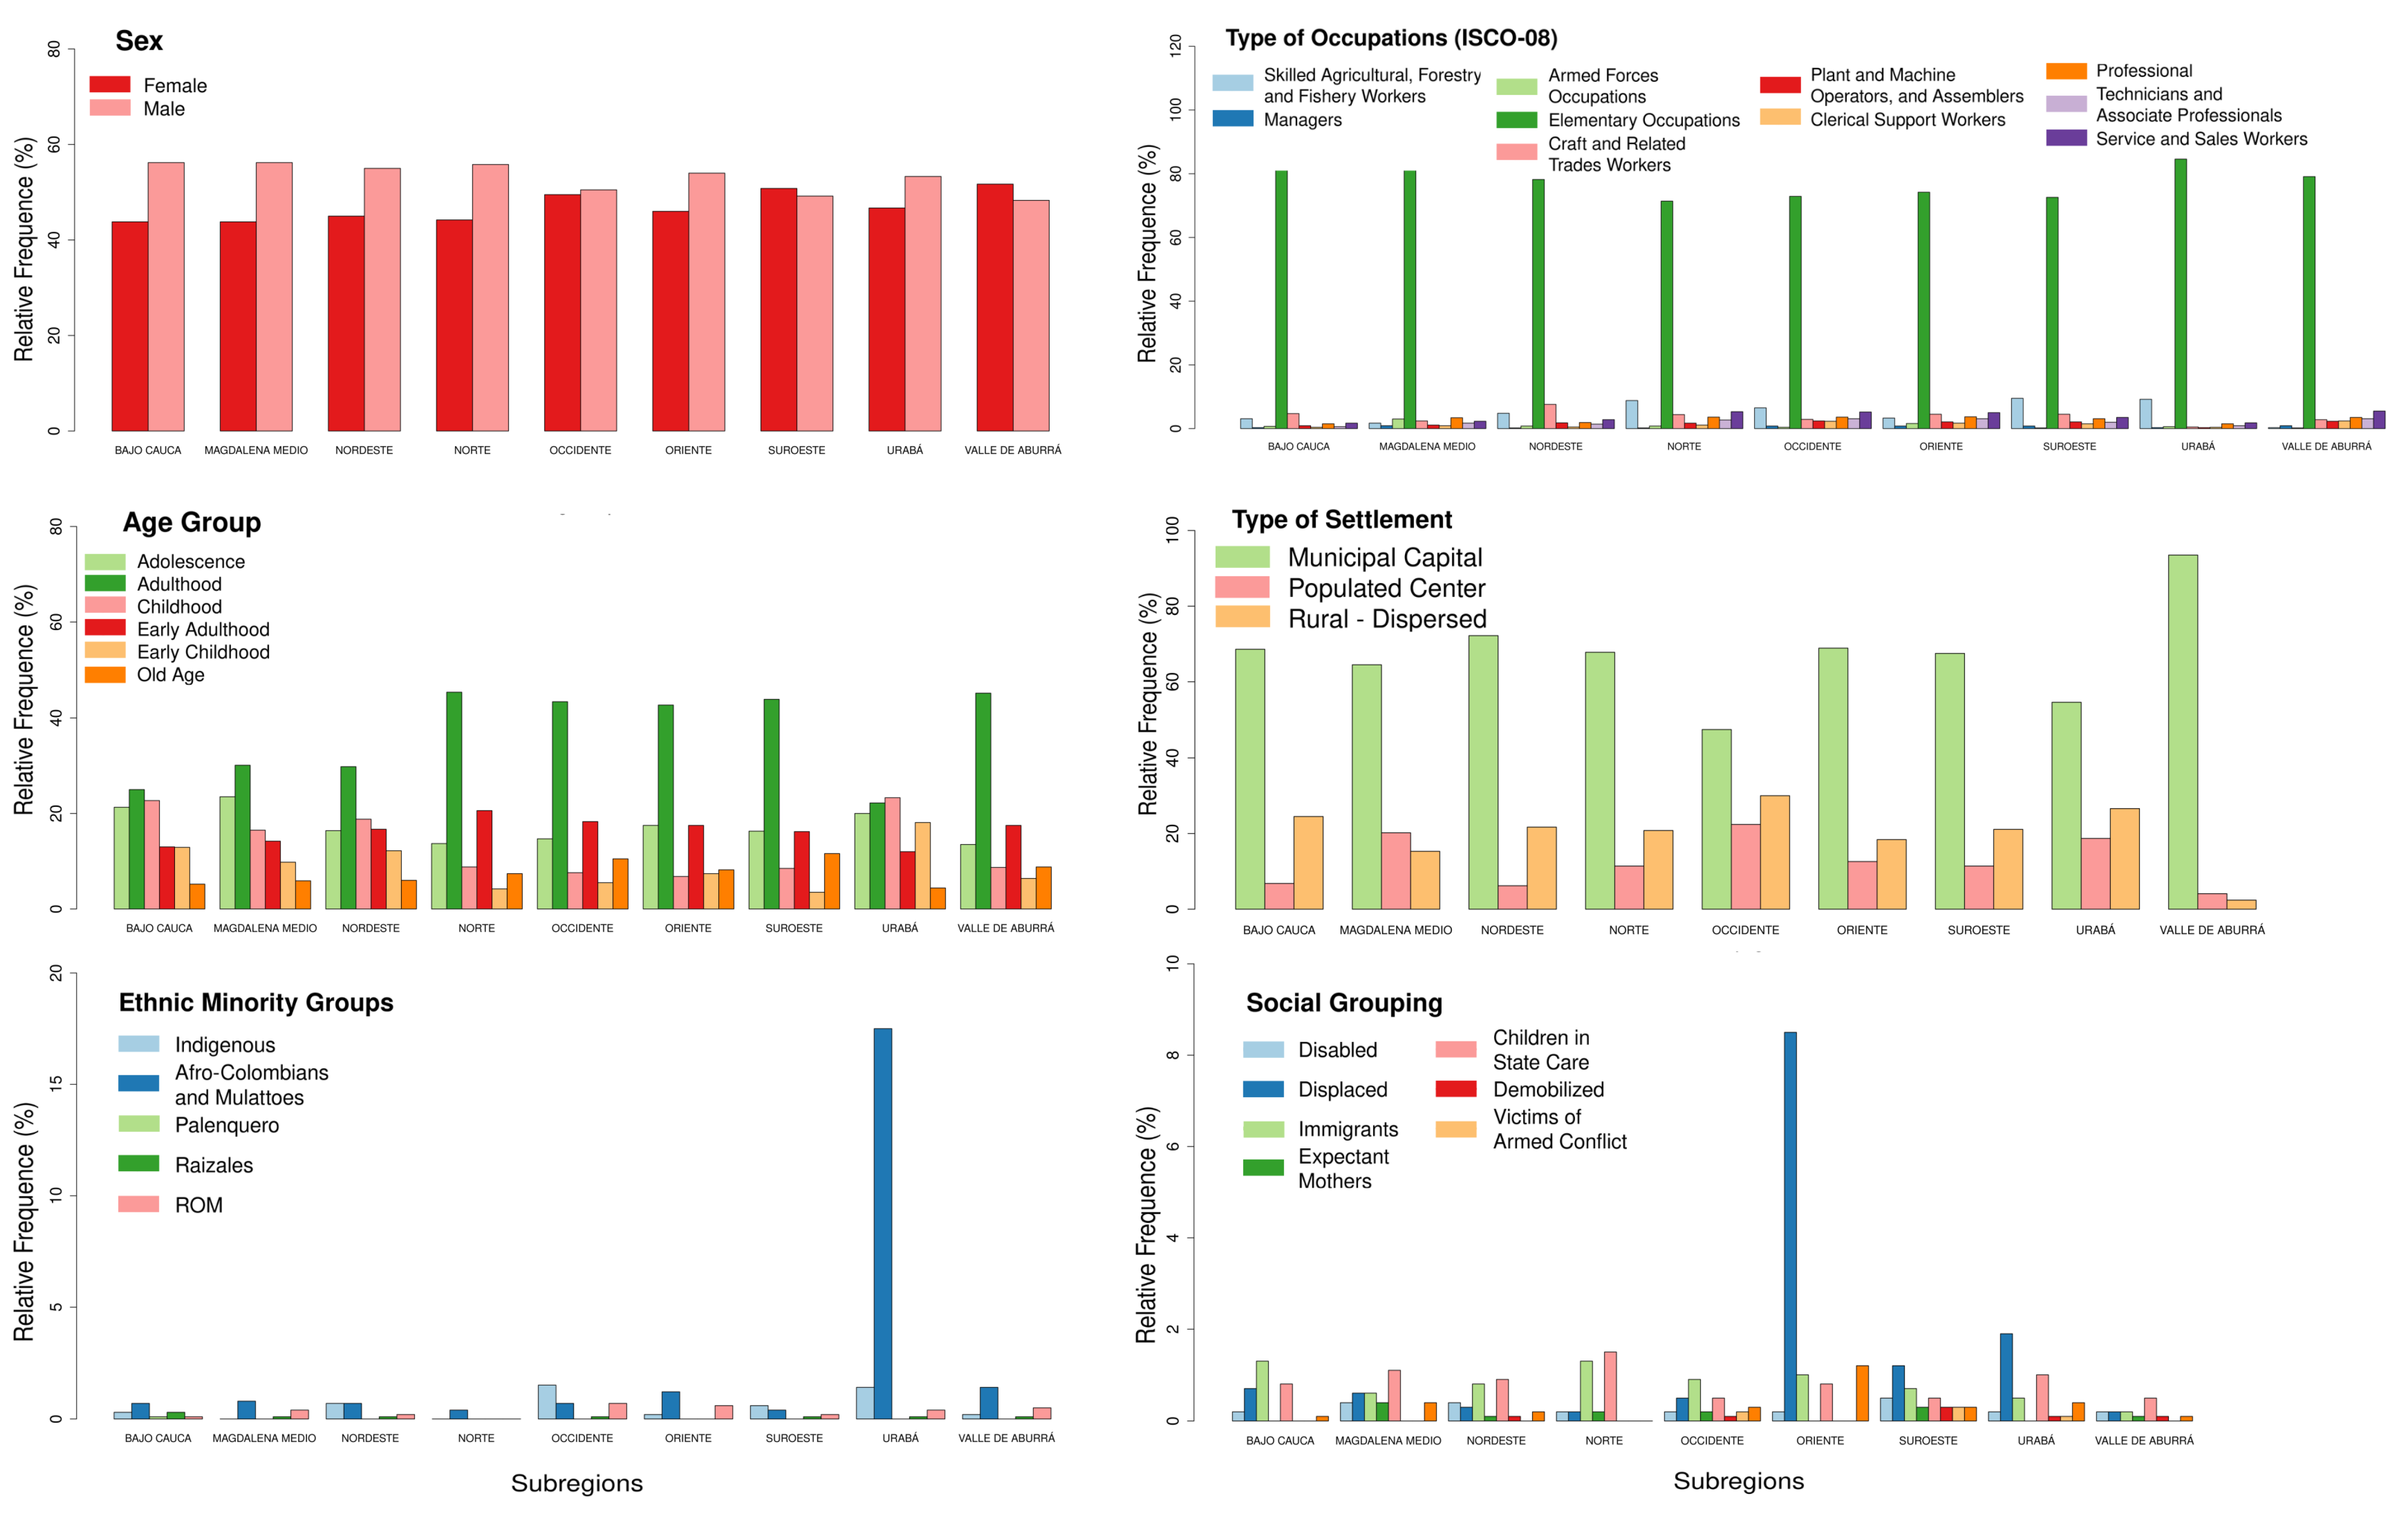
4.2. Socio-Economic State of Dengue in Antioquia
- (i)
- Poverty indicates the percentage of people that cannot pay for essential resources.
- (ii)
- The health barrier shows the percentage of individuals or families that cannot access health services in hospitals.
- (iii)
- No access to water measures the percentage of households with no access to an adequate water supply, such as potable water.
- (iv)
- Overcrowding measures homes with over three people per room, counting the living rooms and dining room but excluding bathrooms, garages, and rooms used for businesses.
- (i)
- Adulthood, a working age that represents 44.3% of the total population [20].
- (ii)
- People in elementary occupations (all subregions).
- (iii)
- (iv)
- Afro-Colombians in Oriente and Urabá; the last region is this community’s major settlement, and 36% of its population lives in rural zones [46].
- (v)
- Immigrant groups, where 81% of the population is made up of people from Venezuela, followed by people from the United States and Ecuador [46].
- (vi)
- Children in state care (all subregions).
4.3. Socio-Demographic Hazards and Relationship of Dengue and Severe Dengue Symptoms
4.4. Dengue Infections with the COVID-19 Pandemic
5. Conclusions
Author Contributions
Funding
Institutional Review Board Statement
Informed Consent Statement
Data Availability Statement
Acknowledgments
Conflicts of Interest
References
- Calderón, A.; Guzmán, C.; Oviedo-Socarras, T.; Mattar, S.; Rodríguez, V.; Castañeda, V.; Moraes Figueiredo, L.T. Two cases of natural infection of dengue-2 virus in bats in the Colombian Caribbean. Trop. Med. Infect. Dis. 2021, 6, 35. [Google Scholar] [CrossRef] [PubMed]
- Ioos, S.; Mallet, H.P.; Goffart, I.L.; Gauthier, V.; Cardoso, T.; Herida, M. Current zika virus epidemiology and recent epidemics. Med. Mal. Infect. 2014, 44, 302–307. [Google Scholar] [CrossRef]
- Mordecai, E.A.; Cohen, J.M.; Evans, M.V.; Gudapati, P.; Johnson, L.R.; Lippi, C.A.; Miazgowicz, K.; Murdock, C.C.; Rohr, J.R.; Ryan, S.J.; et al. Detecting the impact of temperature on transmission of zika, dengue, and chikungunya using mechanistic models. PLoS Negl. Trop. Dis. 2017, 11, e0005568. [Google Scholar] [CrossRef] [PubMed] [Green Version]
- Wang, H.; Naghavi, M.; Allen, C.; Barber, R.M.; Bhutta, Z.A.; Carter, A.; Casey, D.C.; Charlson, F.J.; Chen, A.Z.; Coates, M.M.; et al. Global, regional, and national life expectancy, all-cause mortality, and cause-specific mortality for 249 causes of death, 1980–2015: A systematic analysis for the global burden of disease study 2015. Lancet 2016, 388, 1459–1544. [Google Scholar] [CrossRef] [PubMed] [Green Version]
- Desjardins, M.R.; Casas, I.; Victoria, A.M.; Carbonell, D.; Dávalos, D.M.; Delmelle, E.M. Knowledge, attitudes, and practices regarding dengue, chikungunya, and zika in Cali, Colombia. Health Place 2020, 63, 102339. [Google Scholar] [CrossRef]
- Mora-Salamanca, A.F.; Porras-Ramírez, A.; De la Hoz Restrepo, F.P. Estimating the burden of arboviral diseases in Colombia between 2013 and 2016. Int. J. Infect. Dis. 2020, 97, 81–89. [Google Scholar] [CrossRef]
- Villar, L.A.; Rojas, D.P.; Besada-Lombana, S.; Sarti, E. Epidemiological trends of dengue disease in Colombia (2000–2011): A systematic review. PLoS Negl. Trop. Dis. 2015, 9, e0003499. [Google Scholar] [CrossRef] [PubMed]
- Padilla, J.C.; Rojas, D.P.; Gómez, R.S. Dengue en Colombia: Epidemiologia de la Reemergencia y la Hiperendemia; Ministerio de la Protección Social-Instituto Nacional de Salud: Bogotá, Colombia, 2012. [Google Scholar]
- Carabali, M.; Jaramillo-Ramirez, G.I.; Rivera, V.A.; Mina Possu, N.J.; Restrepo, B.N.; Zinszer, K. Assessing the reporting of dengue, chikungunya and zika to the national surveillance system in Colombia from 2014–2017: A capture-recapture analysis accounting for misclassification of arboviral diagnostics. PLoS Neglected Trop. Dis. 2021, 15, e0009014. [Google Scholar] [CrossRef] [PubMed]
- Rico-Mendoza, A.; Alexandra, P.R.; Chang, A.; Encinales, L.; Lynch, R. Co-circulation of dengue, chikungunya, and zika viruses in colombia from 2008 to 2018. Rev. Panam. Salud Pública 2019, 43, 1. [Google Scholar] [CrossRef] [Green Version]
- Cardona-Ospina, J.A.; Arteaga-Livias, K.; Villamil-Gómez, W.E.; Pérez-Díaz, C.E.; Katterine Bonilla-Aldana, D.; Mondragon-Cardona, á.; Solarte-Portilla, M.; Martinez, E.; Millan-Oñate, J.; López-Medina, E.; et al. Dengue and COVID-19, overlapping epidemics? An analysis from Colombia. J. Med. Virol. 2020, 93, 522–527. [Google Scholar] [CrossRef]
- Aliota, M.T.; Peinado, S.A.; Velez, I.D.; Osorio, J.E. The wMel strain of Wolbachia reduces transmission of zika virus by Aedes Aegypti. Sci. Rep. 2016, 6, 28792. [Google Scholar] [CrossRef] [PubMed] [Green Version]
- Ocampo, C.B.; Salazar-Terreros, M.J.; Mina, N.J.; McAllister, J.; Brogdon, W. Insecticide resistance status of Aedes Aegypti in 10 localities in Colombia. Acta Trop. 2011, 118, 37–44. [Google Scholar] [CrossRef] [PubMed]
- Lima, E.C.B.D.; Montarroyos, U.R.; Magalhães, J.J.F.D.; Dimech, G.S.; Lacerda, H.R. Survival analysis in non-congenital neurological disorders related to dengue, chikungunya and zika virus infections in northeast Brazil. Rev. Inst. Med. Trop. S. Paulo 2020, 62. [Google Scholar] [CrossRef]
- Oviedo-Pastrana, M.; Méndez, N.; Mattar, S.; Arrieta, G.; Gomezcaceres, L. Epidemic outbreak of chikungunya in two neighboring towns in the Colombian caribbean: A survival analysis. Arch. Public Health 2017, 75, 1. [Google Scholar] [CrossRef] [Green Version]
- Pinzón, M.A.; Ortiz, S.; Holguín, H.; Betancur, J.F.; Cardona Arango, D.; Laniado, H.; Arias Arias, C.; Muñoz, B.; Quiceno, J.; Jaramillo, D.; et al. Dexamethasone vs methylprednisolone high dose for COVID-19 pneumonia. PLoS ONE 2021, 16, e0252057. [Google Scholar] [CrossRef]
- Departamento Administrativo de Planeación. Temperatura Promedio Anual, en los Municipios de ANTIOQUIA. 2016. Available online: http://www.antioquiadatos.gov.co/index.php/20-4-1-temperatura-promedio-anual-en-los-municipios-de-antioquia-ano-2015 (accessed on 9 May 2021).
- Departamento Administrativo de Planeación. Situación Geográfica, Extensión km2, Altura y Temperatura de los Municipios de Antioquia, por Subregión. 2016. Available online: http://www.antioquiadatos.gov.co/index.php/1-4-1-situacion-geografica-extension-km-altura-y-temperatura-de-los-municipios-de-antioquia-por-subregion (accessed on 9 May 2021).
- United Nations Development Programme. Antioquia: Retos y desafíos para el Desarrollo Sostenible. 2019. Available online: https://www.co.undp.org/content/colombia/es/home/library/democratic_governance/antioquia–retos-y-desafios-para-el-desarrollo-sostenible.html (accessed on 9 May 2021).
- Secretaria Seccional de Salud y Protección Social de Antioquia. Análisis de Situación de Salud Actualización 2020; Gobernación de Antioquia: Medellín, Colombia, 2020; pp. 1–372. [Google Scholar]
- Secretaria Seccional de Salud y Protección Social de Antioquia. Plataforma Entornos Familiar y Saludable; Gobernación de Antioquia: Medellín, Colombia, 2021. [Google Scholar]
- Secretaria Seccional de Salud y Protección Social de Antioquia. Política Pública de Discapacidad e Inclusión Social Departamento de Antioquia; Gobernación de Antioquia: Medellín, Colombia, 2015; pp. 1–94. [Google Scholar]
- Ministerio de Salud de Colombia. Boletines Poblacionales: Personas con Discapacidad; Gobernación de Antioquia: Medellín, Colombia, 2020; pp. 1–15. [Google Scholar]
- Departamento Administrativo Nacional de Estadística. Estadísticas de las Personas Desmovilizadas que han Ingresado al Proceso de Reintegración; Datos Abiertos Colombia. 2022. Available online: www.datos.gov.co (accessed on 5 December 2022).
- Reinhold, J.M.; Lazzari, C.R.; Lahondère, C. Effects of the environmental temperature on Aedes Aegypti and Sedes albopictus mosquitoes: A review. Insects 2018, 9, 158. [Google Scholar] [CrossRef] [PubMed] [Green Version]
- Méndez, J.A.; Usme-Ciro, J.A.; Domingo, C.; Rey, G.J.; Sánchez, J.A.; Tenorio, A.; Gallego-Gomez, J.C. Phylogenetic reconstruction of dengue virus type 2 in Colombia. Virol. J. 2012, 9, 64. [Google Scholar] [CrossRef] [Green Version]
- Quintero-Herrera, L.L.; Ramírez-Jaramillo, V.; Bernal-Gutiérrez, S.; Cárdenas-Giraldo, E.V.; Guerrero-Matituy, E.A.; Molina-Delgado, A.H.; Montoya-Arias, C.P.; Rico-Gallego, J.A.; Herrera-Giraldo, A.C.; Botero-Franco, S.; et al. Potential impact of climatic variability on the epidemiology of dengue in Risaralda, Colombia, 2010–2011. J. Infect. Public Health 2015, 8, 291–297. [Google Scholar] [CrossRef] [Green Version]
- Vincenti-Gonzalez, M.F.; Tami, A.; Lizarazo, E.F.; Grillet, M.E. ENSO-driven climate variability promotes periodic major outbreaks of dengue in Venezuela. Sci. Rep. 2018, 8, 5727. [Google Scholar] [CrossRef] [Green Version]
- Giedion, U.; Uribe, M.V. Colombia’s universal health insurance system. Health Aff. 2009, 28, 853–863. [Google Scholar] [CrossRef]
- International Labour Office (ILO). International Standard Classification of Occupations 2008 (ISCO-08): Structure, Group Definitions and Correspondence Tables; International Labour Office: Geneva, Switzerland, 2012; Volume 1. [Google Scholar]
- R Core Team. R: A Language and Environment for Statistical Computing; R Foundation for Statistical Computing: Vienna, Austria, 2022. [Google Scholar]
- Minder, C.E.; Bednarski, T. A robust method for proportional hazards regression. Stat. Med. 1996, 15, 1033–1047. [Google Scholar] [CrossRef]
- Cox, D.R. Regression models and life-tables. J. R. Stat. Soc. B 1972, 34, 187–220. [Google Scholar] [CrossRef]
- Bednarski, T.; Borowicz, F. Coxrobust: Robust Estimation in Cox Model; R Package Version 1.0; 2006. Available online: cran.rproject.org/web/packages/coxrobust (accessed on 1 November 2022).
- Lee, J.S.; Mogasale, V.; Lim, J.K.; Carabali, M.; Lee, K.S.; Sirivichayakul, C.; Dang, D.A.; Palencia-Florez, D.C.; Nguyen, T.H.A.; Riewpaiboon, A.; et al. A multi-country study of the economic burden of dengue fever: Vietnam, Thailand, and Colombia. PLoS Negl. Trop. Dis. 2017, 11, e0006037. [Google Scholar] [CrossRef] [PubMed] [Green Version]
- Catano-Lopez, A.; Rojas-Diaz, D.; Laniado, H.; Arboleda-Sánchez, S.; Puerta-Yepes, M.E.; Lizarralde-Bejarano, D.P. An alternative model to explain the vectorial capacity using as example Aedes Aegypti case in dengue transmission. Heliyon 2019, 5, e02577. [Google Scholar] [CrossRef] [Green Version]
- Velasco, H.; Laniado, H.; Toro, M.; Catano-López, A.; Leiva, V.; Lio, Y. Modeling the risk of infectious diseases transmitted by Sedes Aegypti using survival and aging statistical analysis with a case study in Colombia. Mathematics 2021, 9, 1488. [Google Scholar] [CrossRef]
- Jácome, G.; Vilela, P.; Yoo, C. Social-ecological modelling of the spatial distribution of dengue fever and its temporal dynamics in Guayaquil, Ecuador for climate change adaption. Ecol. Inform. 2019, 49, 1–12. [Google Scholar] [CrossRef]
- Gutierrez-Barbosa, H.; Medina-Moreno, S.; Zapata, J.C.; Chua, J.V. Dengue infections in Colombia: Epidemiological trends of a hyperendemic country. Trop. Med. Infect. Dis. 2020, 5, 156. [Google Scholar] [CrossRef]
- Santoso, A.; Mcphaden, M.J.; Cai, W. The defining characteristics of ENSO extremes and the strong 2015/2016 El Niño. Rev. Geophys. 2017, 55, 1079–1129. [Google Scholar] [CrossRef]
- Giraldo-Osorio, J.D.; Trujillo-Osorio, D.E.; Baez-Villanueva, O.M. Analysis of ENSO-driven variability, and long-term changes, of extreme precipitation indices in Colombia, using the satellite rainfall estimates chirps. Water 2022, 14, 1733. [Google Scholar] [CrossRef]
- Fuentes-Vallejo, M. Space and space-time distributions of dengue in a hyper-endemic urban space: The case of Girardot, Colombia. BMC Infect. Dis. 2017, 17, 512. [Google Scholar] [CrossRef]
- Murray, N.E.A.; Quam, M.B.; Wilder-Smith, A. Epidemiology of dengue: Past, present and future prospects. Clin. Epidemiol. 2013, 5, 299. [Google Scholar] [PubMed] [Green Version]
- Krystosik, A.R.; Curtis, A.; Buritica, P.; Ajayakumar, J.; Squires, R.; Dávalos, D.; Pacheco, R.; Bhatta, M.P.; James, M.A. Community context and sub-neighborhood scale detail to explain dengue, chikungunya and zika patterns in Cali, Colombia. PLoS ONE 2017, 12, e0181208. [Google Scholar] [CrossRef] [Green Version]
- Lippi, C.A.; Stewart-Ibarra, A.M.; Muñoz, á.G.; Borbor-Cordova, M.J.; Mejía, R.; Rivero, K.; Castillo, K.; Cárdenas, W.B.; Ryan, S.J. The social and spatial ecology of dengue presence and burden during an outbreak in Guayaquil, Ecuador, 2012. Int. J. Environ. Res. Public Health 2018, 15, 827. [Google Scholar] [CrossRef] [PubMed] [Green Version]
- Departamento Administrativo Nacional de Estadística; Censo Nacional de Población y Vivienda: Bogotá, Colombia, 2018.
- Gaviria, C.F.; Muñoz, J.C. Desplazamiento forzado y propiedad de la tierra en Antioquia, 1996–2004. Lect. Econ. 2009, 66, 9–46. [Google Scholar] [CrossRef]
- Jurisdicción Especial para la Paz (JEP). Macrocaso 04: Situación Territorial de la Región de Urabá. 2022. Available online: https://www.jep.gov.co/especiales1/macrocasos/04.html (accessed on 7 September 2022).
- López-Medina, E.; Biswal, S.; Saez-Llorens, X.; Borja-Tabora, C.; Bravo, L.; Sirivichayakul, C.; Vargas, L.M.; Alera, M.T.; Velásquez, H.; Reynales, H.; et al. Efficacy of a Dengue Vaccine Candidate (TAK-003) in Healthy Children and Adolescents 2 Years after Vaccination. J. Infect. Dis. 2022, 9, 1521–1532. [Google Scholar] [CrossRef]
- Vaccine, D. WHO Position Paper. Wkly. Epidemiol. Rec. 2018, 93, 457–476. [Google Scholar]
- Guerra-Silveira, F.; Abad-Franch, F. Sex bias in infectious disease epidemiology: Patterns and processes. PLoS ONE 2013, 8, e62390. [Google Scholar] [CrossRef] [Green Version]
- Yung, C.F.; Lee, K.S.; Thein, T.L.; Tan, L.K.; Gan, V.C.; Wong, J.G.; Lye, D.C.; Ng, L.C.; Leo, Y.S. Dengue serotype-specific differences in clinical manifestation, laboratory parameters and risk of severe disease in adults, Singapore. Am. J. Trop. Med. Hyg. 2015, 92, 999–1005. [Google Scholar] [CrossRef]
- Arshad, H.; Bashir, M.; Mushtaq, U.S.; Imtiaz, H.; Rajpar, R.; Alam, M.F.; Fatima, S.; Rehman, A.; Abbas, K.; Talpur, A.S. Clinical characteristics and symptomatology associated with dengue fever. Cureus 2022, 14, e26677. [Google Scholar] [CrossRef]
- Souza, L.J.D.; Pessanha, L.B.; Mansur, L.C.; Souza, L.A.D.; Ribeiro, M.B.T.; Silveira, M.D.V.D.; Souto Filho, J.T.D. Comparison of clinical and laboratory characteristics between children and adults with dengue. Braz. J. Infect. Dis. 2013, 17, 27–31. [Google Scholar] [CrossRef] [Green Version]
- Hammond, S.N.; Balmaseda, A.; Perez, L.; Tellez, Y.; Saborío, S.I.; Mercado, J.C.; Videa, E.; Rodriguez, Y.; Perez, M.A.; Cuadra, R.; et al. Differences in dengue severity in infants, children, and adults in a 3-year hospital-based study in Nicaragua. Am. J. Trop. Med. Hyg. 2005, 73, 1063–1070. [Google Scholar] [CrossRef] [PubMed]
- Chaudhry, K.A.; Jamil, F.; Razzaq, M.; Jilani, B.F. Survival analysis of dengue patients of Pakistan. Int. J. Mosq. Res. 2018, 5, 5–9. [Google Scholar]
- Khormi, H.M.; Kumar, L. Modeling dengue fever risk based on socioeconomic parameters, nationality and age groups: GIS and remote sensing based case study. Sci. Total Environ. 2011, 409, 4713–4719. [Google Scholar] [CrossRef] [PubMed]
- Annas, S.; Nusrang, M.; Arisandi, R.; Fadillah, N.; Kartikasari, P. Cox proportional hazard regression analysis of dengue hemorrhagic fever. J. Phys. Conf. Ser. 2018, 1028, 012242. [Google Scholar]
- Irfan, M.; Usman, M.; Saidi, S.; Kurniasari, D. Survival analysis using cox proportional hazard regression approach in dengue hemorrhagic fever (DHF) case in Abdul Moeloek hospital Bandar Lampung in 2019. J. Phys. Conf. Ser. 2021, 1751, 012011. [Google Scholar] [CrossRef]
- Microbe, T.L. Arboviruses and COVID-19: The need for a holistic view. Lancet Microbe 2020, 1, e136. [Google Scholar] [CrossRef]
- Sasmono, R.T.; Santoso, M.S. Movement dynamics: Reduced dengue cases during the COVID-19 pandemic. Lancet Infect. Dis. 2022, 22, 570–571. [Google Scholar] [CrossRef]
- Awan, U.A.; Zahoor, S.; Ayub, A.; Ahmed, H.; Aftab, N.; Afzal, M.S. COVID-19 and arboviral diseases: Another challenge for Pakistan’s dilapidated healthcare system. J. Med. Virol. 2020, 93, 4065–4067. [Google Scholar] [CrossRef]
- Chen, Y.; Li, N.; Lourenço, J.; Wang, L.; Cazelles, B.; Dong, L.; Li, B.; Liu, Y.; Jit, M.; Bosse, N.I.; et al. Measuring the effects of covid-19-related disruption on dengue transmission in southeast Asia and latin America: A statistical modelling study. Lancet Infect. Dis. 2022, 22, 657–667. [Google Scholar] [CrossRef]


| Subregion | Location | Area (km2) | Altitude (MSL) | Temperature Range (°C) |
|---|---|---|---|---|
| Valle de Aburrá | South center | 1158 | 1300–1775 | 12–21 |
| Bajo Cauca | Northeast, in the spur of the CC | 8585 | 30–125 | 17–29 |
| Norte | North, in CC | 7516 | 1200–2550 | 12–23 |
| Nordeste | Eastern slopes of the CC | 8645 | 650–1975 | 19–27 |
| Suroeste | Southwestern, between WC and CC | 6589 | 600–2350 | 12–26 |
| Occidente | Northwest, between WC and CC | 6571 | 450–1925 | 10–26 |
| Oriente | Southeast | 7103 | 1000–2500 | 13–23 |
| Urabá | North, Coastal region | 11,799 | 2–200 | 22–29 |
| Magdalena Medio | CC | 4833 | 75–950 | 24–29 |
| Subregion | Population | Gender Men | Social Groups | Settlement (Urban) | Minorities | |||
|---|---|---|---|---|---|---|---|---|
| Disabled | Displaced | Victims * | Indigenous | Mixed-Race and Afro-Colombian | ||||
| Valle de Aburrá | 3,969,222 | 53% | 2.1% | 0.07% | 2% | 97% | 0.1% | 1.9% |
| Bajo Cauca | 255,064 | 50% | 1.7% | 2.21% | 21% | 65% | 2.3% | 6.9% |
| Norte | 244,995 | 51% | 3.1% | 1.61% | 19% | 50% | 0.22% | 1.26% |
| Nordeste | 199,335 | 50% | 2.9% | 1.17% | 16% | 54% | 0.46% | 0.91% |
| Suroeste | 367,467 | 50% | 3.1% | 0.84% | 14% | 48% | 1.22% | 0.75% |
| Occidente | 210,371 | 51% | 3.3% | 3.65% | 24% | 38% | 4.15% | 1.50% |
| Oriente | 683,968 | 49% | 2.6% | 2.34% | 18% | 60% | 0.05% | 0.37% |
| Urabá | 514,423 | 49% | 1.8% | 5.22% | 28% | 59% | 2.67% | 39% |
| Magdalena Medio | 105,361 | 51% | 3.7% | 2.38% | 9% | 56% | 0.11% | 2.55% |
| Subregion | Year | Median Incidence | |||||
|---|---|---|---|---|---|---|---|
| 2015 | 2016 | 2017 | 2018 | 2019 | 2020 | ||
| BC | 0.90 | 0.61 | 0.57 | 2.32 | 2.39 | 0.55 | 0.755 |
| MM | 1.44 | 1.11 | 0.64 | 0.59 | 4.00 | 0.84 | 0.975 |
| NE | 0.64 | 1.73 | 0.48 | 0.13 | 2.26 | 0.88 | 0.760 |
| NO | 0.28 | 0.88 | 0.12 | 0.17 | 0.40 | 0.08 | 0.225 |
| OC | 1.66 | 3.51 | 1.11 | 0.27 | 0.88 | 0.39 | 0.995 |
| OR | 0.20 | 0.32 | 0.04 | 0.03 | 0.11 | 0.06 | 0.085 |
| SO | 1.14 | 4.84 | 0.50 | 0.17 | 0.19 | 0.63 | 0.565 |
| UR | 1.01 | 1.01 | 1.20 | 2.75 | 3.08 | 1.05 | 1.125 |
| VA | 1.29 | 5.94 | 0.68 | 0.38 | 0.39 | 0.21 | 0.535 |
| Median Incidence | 1.01 | 1.11 | 0.57 | 0.27 | 0.88 | 0.55 | 0.725 |
| Variable | BC (n = 1874) | MM (n = 908) | NE (n = 1218) | NO (n = 475) | OC (n = 1644) | OR (n = 515) | NG (n = 491) | SO (n = 2741) | UR (n = 5196) | VA (n = 35,335) | p-Value | |
|---|---|---|---|---|---|---|---|---|---|---|---|---|
| Age | 16 (15–16.5) | 19 (17-20) | 19 (18–21) | 28 (26-30) | 28.5 (27–29.5) | 27 (25–29) | 28 (26–31) | 30 (29–31) | 14 (14–15) | 28 (28–29) | <0.0001 | |
| Age group | Early childhood (0–5) | 241 (12.9%) | 89 (9.8%) | 149 (12.2%) | 20 (4.2%) | 90 (5.5%) | 38 (7.4%) | 37 (7.5%) | 95 (3.5%) | 943 (18.1%) | 2251 (6.4%) | <0.0001 |
| Childhood (6–11) | 426 (22.7%) | 150 (16.5%) | 229 (18.8%) | 42 (8.8%) | 125 (7.6%) | 35 (6.8%) | 46 (9.4%) | 234 (8.5%) | 1209 (23.3%) | 3085 (8.7%) | ||
| Adolescence (12–18) | 399 (21.3%) | 213 (23.5%) | 200 (16.4%) | 65 (13.7%) | 241 (14.7%) | 90 (17.5%) | 62 (12.6%) | 446 (16.3%) | 1039 (20%) | 4773 (13.5%) | ||
| Early adulthood (19–26) | 243 (13%) | 129 (14.2%) | 204 (16.7%) | 98 (20.6%) | 301 (18.3%) | 90 (17.5%) | 85 (17.3%) | 444 (16.2%) | 622 (12%) | 6196 (17.5%) | ||
| Adulthood (27–59) | 468 (25%) | 273 (30.1%) | 363 (29.8%) | 215 (45.3%) | 714 (43.4%) | 220 (42.7%) | 214 (43.6%) | 1204 (43.9%) | 1154 (22.2%) | 15932 (45.1%) | ||
| Old age (60+) | 97 (5.2%) | 54 (5.9%) | 73 (6%) | 35 (7.4%) | 173 (10.5%) | 42 (8.2%) | 47 (9.6%) | 318 (11.6%) | 229 (4.4%) | 3098 (8.8%) | ||
| Sex | Female | 820 (43.8%) | 398 (43.8%) | 548 (45%) | 210 (44.2%) | 814 (49.5%) | 237 (46%) | 235 (47.9%) | 1392 (50.8%) | 2429 (46.7%) | 18256 (51.7%) | <0.0001 |
| Male | 1054 (56.2%) | 510 (56.2%) | 670 (55%) | 265 (55.8%) | 830 (50.5%) | 278 (54%) | 256 (52.1%) | 1349 (49.2%) | 2767 (53.3%) | 17079 (48.3%) | ||
| Type of settlement | Municipal capital | 1286 (68.6%) | 586 (64.5%) | 879 (72.2%) | 322 (67.8%) | 781 (47.5%) | 355 (68.9%) | 442 (90%) | 1849 (67.5%) | 2844 (54.7%) | 33055 (93.5%) | <0.0001 |
| Populated center | 128 (6.8%) | 183 (20.2%) | 75 (6.2%) | 54 (11.4%) | 369 (22.4%) | 65 (12.6%) | 19 (3.9%) | 313 (11.4%) | 970 (18.7%) | 1443 (4.1%) | ||
| Rural–dispersed | 460 (24.5%) | 139 (15.3%) | 264 (21.7%) | 99 (20.8%) | 494 (30%) | 95 (18.4%) | 30 (6.1%) | 579 (21.1%) | 1382 (26.6%) | 837 (2.4%) | ||
| Type of occupation (ISCO-08) | Skilled agricultural, forestry, and fishery workers | 460 (24.5%) | 139 (15.3%) | 264 (21.7%) | 99 (20.8%) | 494 (30%) | 95 (18.4%) | 30 (6.1%) | 579 (21.1%) | 1382 (26.6%) | 837 (2.4%) | <0.0001 |
| Managers | 5 (0.3%) | 8 (0.9%) | 2 (0.2%) | 1 (0.2%) | 13 (0.8%) | 4 (0.8%) | 9 (1.8%) | 23 (0.8%) | 14 (0.3%) | 328 (0.9%) | ||
| Armed forces | 13 (0.7%) | 27 (3%) | 10 (0.8%) | 4 (0.8%) | 6 (0.4%) | 8 (1.6%) | 11 (2.2%) | 6 (0.2%) | 29 (0.6%) | 63 (0.2%) | ||
| Elementary occupations | 1612 (86%) | 751 (82.7%) | 953 (78.2%) | 339 (71.4%) | 1198 (72.9%) | 382 (74.2%) | 340 (69.2%) | 1989 (72.6%) | 4398 (84.6%) | 27950 (79.1%) | ||
| Craft and related trades workers | 88 (4.7%) | 22 (2.4%) | 93 (7.6%) | 21 (4.4%) | 48 (2.9%) | 23 (4.5%) | 15 (3.1%) | 124 (4.5%) | 25 (0.5%) | 993 (2.8%) | ||
| Plant and machine operators and assemblers | 17 (0.9%) | 10 (1.1%) | 22 (1.8%) | 8 (1.7%) | 39 (2.4%) | 11 (2.1%) | 11 (2.2%) | 58 (2.1%) | 14 (0.3%) | 800 (2.3%) | ||
| Clerical support workers | 8 (0.4%) | 8 (0.9%) | 6 (0.5%) | 5 (1.1%) | 37 (2.3%) | 9 (1.7%) | 9 (1.8%) | 42 (1.5%) | 21 (0.4%) | 840 (2.4%) | ||
| Professionals | 29 (1.5%) | 31 (3.4%) | 23 (1.9%) | 17 (3.6%) | 60 (3.6%) | 19 (3.7%) | 38 (7.7%) | 86 (3.1%) | 76 (1.5%) | 1221 (3.5%) | ||
| Technicians and associate professionals | 12 (0.6%) | 15 (1.7%) | 17 (1.4%) | 13 (2.7%) | 51 (3.1%) | 16 (3.1%) | 30 (6.1%) | 56 (2%) | 47 (0.9%) | 1107 (3.1%) | ||
| Service and sales workers | 31 (1.7%) | 21 (2.3%) | 34 (2.8%) | 25 (5.3%) | 85 (5.2%) | 26 (5%) | 21 (4.3%) | 97 (3.5%) | 93 (1.8%) | 1940 (5.5%) | ||
| Variable | BC (n = 1874) | MM (n = 908) | NE (n = 1218) | NO (n = 475) | OC (n = 1644) | OR (n = 515) | NG (n = 491) | SO (n = 2741) | UR (n = 5196) | VA (n = 35,335) | p-Value | |
|---|---|---|---|---|---|---|---|---|---|---|---|---|
| Ethnic minority groups | Indigenous | 5 (0.3%) | 0 (0%) | 9 (0.7%) | 0 (0%) | 24 (1.5%) | 1 (0.2%) | 2 (0.4%) | 16 (0.6%) | 72 (1.4%) | 66 (0.2%) | <0.0001 |
| Afro-Colombians and mixed-race | 13 (0.7%) | 7 (0.8%) | 9 (0.7%) | 2 (0.4%) | 11 (0.7%) | 6 (1.2%) | 6 (1.2%) | 12 (0.4%) | 907 (17.5%) | 496 (1.4%) | ||
| Palenquero | 1 (0.1%) | 0 (0%) | 0 (0%) | 0 (0%) | 0 (0%) | 0 (0%) | 0 (0%) | 0 (0%) | 1 (0%) | 2 (0%) | ||
| Raizales | 5 (0.3%) | 1 (0.1%) | 1 (0.1%) | 0 (0%) | 2 (0.1%) | 0 (0%) | 1 (0.2%) | 2 (0.1%) | 4 (0.1%) | 28 (0.1%) | ||
| ROM | 2 (0.1%) | 4 (0.4%) | 3 (0.2%) | 0 (0%) | 11 (0.7%) | 3 (0.6%) | 1 (0.2%) | 6 (0.2%) | 20 (0.4%) | 171 (0.5%) | ||
| Social groups | Disabled | 4 (0.2%) | 4 (0.4%) | 5 (0.4%) | 1 (0.2%) | 4 (0.2%) | 1 (0.2%) | 3 (0.6%) | 15 (0.5%) | 12 (0.2%) | 59 (0.2%) | 0.002 |
| Displaced | 14 (0.7%) | 5 (0.6%) | 4 (0.3%) | 1 (0.2%) | 8 (0.5%) | 44 (8.5%) | 4 (0.8%) | 34 (1.2%) | 100 (1.9%) | 60 (0.2%) | <0.0001 | |
| Immigrants | 24 (1.3%) | 5 (0.6%) | 10 (0.8%) | 6 (1.3%) | 14 (0.9%) | 5 (1%) | 4 (0.8%) | 20 (0.7%) | 25 (0.5%) | 70 (0.2%) | <0.0001 | |
| Convicts | 0 (0%) | 4 (0.4%) | 1 (0.1%) | 1 (0.2%) | 3 (0.2%) | 0 (0%) | 3 (0.6%) | 9 (0.3%) | 2 (0%) | 27 (0.1%) | <0.0001 | |
| Expectant mothers | 15 (0.8%) | 10 (1.1%) | 11 (0.9%) | 7 (1.5%) | 8 (0.5%) | 4 (0.8%) | 2 (0.4%) | 15 (0.5%) | 51 (1%) | 194 (0.5%) | <0.0001 | |
| Children in state care | 0 (0%) | 0 (0%) | 1 (0.1%) | 0 (0%) | 2 (0.1%) | 0 (0%) | 3 (0.6%) | 9 (0.3%) | 6 (0.1%) | 19 (0.1%) | <0.0001 | |
| Demobilized | 0 (0%) | 0 (0%) | 0 (0%) | 0 (0%) | 3 (0.2%) | 0 (0%) | 3 (0.6%) | 9 (0.3%) | 4 (0.1%) | 16 (0%) | <0.0001 | |
| Victims of armed conflict | 1 (0.1%) | 4 (0.4%) | 2 (0.2%) | 0 (0%) | 5 (0.3%) | 6 (1.2%) | 4 (0.8%) | 9 (0.3%) | 20 (0.4%) | 33 (0.1%) | <0.0001 | |
| Variable | BC (n = 1874) | MM (n = 908) | NE (n = 1218) | NO (n = 475) | OC (n = 1644) | OR (n = 515) | NG (n = 491) | SO (n = 2741) | UR (n = 5196) | VA (n = 35,335) | p-Value | |
|---|---|---|---|---|---|---|---|---|---|---|---|---|
| Medical consultation time (in days) | 3 (3-4) | 3 (3–3) | 2 (2–3) | 4 (3–4) | 2 (2–3) | 3 (3–4) | 4 (3–4) | 3 (3–3) | 4 (4-4) | 4 (4–4) | <0.0001 | |
| Hospitalized patients | 907 (48.4%) | 362 (39.9%) | 457 (37.5%) | 191 (40.2%) | 426 (25.9%) | 218 (42.3%) | 99 (20.2%) | 660 (24.1%) | 3000 (57.7%) | 8640 (24.5%) | <0.0001 | |
| Severe dengue | 20 (1.1%) | 11 1.2%) | 17 (1.4%) | 4 (0.8%) | 13 (0.8%) | 8 (1.6%) | 3 (0.6%) | 11 (0.4%) | 66 (1.3%) | 143 (0.4%) | <0.0001 | |
| Clinical deterioration time (in days) | 4 (4–4) | 4 (3–4) | 4 (4–5) | 5 (4–5) | 4 (4–4) | 4 (4–5) | 5 (4–5) | 4 (4–5) | 4 (4–4) | 5 (4–5) | <0.0001 | |
| Symptoms | Fever | 1874 (100%) | 908 (100%) | 1218 (100%) | 475 (100%) | 1644 (100%) | 515 (100%) | 491 (100%) | 2741 (100%) | 5194 (99.9%) | 35328 (99.9%) | <0.0001 |
| Headache | 1651 (88.1%) | 815 (89.8%) | 964 (79.1%) | 412 (86.7%) | 1407 (85.6%) | 425 (82.5%) | 425 (86.6%) | 2422 (88.4%) | 4702 (90.5%) | 30168 (85.4%) | <0.0001 | |
| Retro-ocular pain | 794 (42.4%) | 482 (53.1%) | 519 (42.6%) | 241 (50.7%) | 762 (46.4%) | 239 (46.4%) | 315 (64.2%) | 1471 (53.7%) | 2390 (46%) | 17030 (48.2%) | <0.0001 | |
| Myalgia | 1558 (83.1%) | 745 (82%) | 1008 (82.8%) | 419 (88.2%) | 1430 (87%) | 455 (88.3%) | 442 (90%) | 2384 (87%) | 4331 (83.4%) | 30595 (86.6%) | <0.0001 | |
| Arthralgia | 1354 (72.3%) | 663 (73%) | 876 (71.9%) | 372 (78.3%) | 1337 (81.3%) | 398 (77.3%) | 408 (83.1%) | 2182 (79.6%) | 3719 (71.6%) | 27202 (77%) | <0.0001 | |
| Rash | 552 (29.5%) | 327 (36%) | 455 (37.4%) | 201 (42.3%) | 754 (45.9%) | 246 (47.8%) | 314 (64%) | 1259 (45.9%) | 1604 (30.9%) | 18494 (52.3%) | <0.0001 | |
| Abdominal pain | 766 (40.9%) | 347 (38.2%) | 356 (29.2%) | 94 (19.8%) | 380 (23.1%) | 161 (31.3%) | 83 (16.9%) | 653 (23.8%) | 2231 (42.9%) | 8166 (23.1%) | <0.0001 | |
| Vomiting | 624 (33.3%) | 315 (34.7%) | 301 (24.7%) | 95 (20%) | 336 (20.4%) | 130 (25.2%) | 92 (18.7%) | 614 (22.4%) | 2066 (39.8%) | 7013 (19.8%) | <0.0001 | |
| Diarrhea | 256 (13.7%) | 155 (17.1%) | 165 (13.5%) | 56 (11.8%) | 202 (12.3%) | 97 (18.8%) | 57 (11.6%) | 388 (14.2%) | 1082 (20.8%) | 5146 (14.6%) | <0.0001 | |
| Drowsiness | 109 (5.8%) | 48 (5.3%) | 58 (4.8%) | 19 (4%) | 39 (2.4%) | 30 (5.8%) | 13 (2.6%) | 105 (3.8%) | 309 (5.9%) | 934 (2.6%) | <0.0001 | |
| Hypotension | 54 (2.9%) | 18 (2%) | 35 (2.9%) | 13 (2.7%) | 32 (1.9%) | 13 (2.5%) | 4 (0.8%) | 53 (1.9%) | 124 (2.4%) | 477 (1.3%) | <0.0001 | |
| Hepatomegaly | 33 (1.8%) | 13 (1.4%) | 30 (2.5%) | 8 (1.7%) | 23 (1.4%) | 15 (2.9%) | 5 (1%) | 54 (2%) | 128 (2.5%) | 310 (0.9%) | <0.0001 | |
| Oral ecchymosis | 87 (4.6%) | 28 (3.1%) | 47 (3.9%) | 16 (3.4%) | 67 (4.1%) | 26 (5%) | 9 (1.8%) | 104 (3.8%) | 133 (2.6%) | 1361 (3.9%) | <0.0001 | |
| Hypothermia | 16 (0.9%) | 3 (0.3%) | 16 (1.3%) | 0 (0%) | 14 (0.9%) | 5 (1%) | 2 (0.4%) | 19 (0.7%) | 20 (0.4%) | 137 (0.4%) | <0.0001 | |
| Thrombocytopenia | 764 (40.8%) | 213 (23.5%) | 323 (26.5%) | 144 (30.3%) | 340 (20.7%) | 156 (30.3%) | 61 (12.4%) | 592 (21.6%) | 1880 (36.2%) | 6519 (18.4%) | <0.0001 | |
| High hematocrit level | 76 (4.1%) | 27 (3%) | 45 (3.7%) | 29 (6.1%) | 57 (3.5%) | 39 (7.6%) | 11 (2.2%) | 145 (5.3%) | 146 (2.8%) | 1065 (3%) | <0.0001 | |
| Subregion | BC | MM | NE | NO | OC | OR | NG | SO | UR |
|---|---|---|---|---|---|---|---|---|---|
| Variable “age” | |||||||||
| MM | 0.0001 | - | - | - | - | - | - | - | - |
| NE | 0.001 | 1 | - | - | - | - | - | - | - |
| NO | <0.0001 | <0.0001 | <0.0001 | - | - | - | - | - | - |
| OC | <0.0001 | <0.0001 | <0.0001 | 1 | - | - | - | - | - |
| OR | <0.0001 | <0.0001 | <0.0001 | 1 | 0.52 | - | - | - | - |
| NG | <0.0001 | <0.0001 | <0.0001 | 1 | 1 | 1 | - | - | - |
| SO | <0.0001 | <0.0001 | <0.0001 | 1 | 0.52 | 0.007 | 0.47 | - | - |
| UR | <0.0001 | <0.0001 | <0.0001 | <0.0001 | <0.0001 | <0.0001 | <0.0001 | <0.0001 | - |
| VA | <0.0001 | <0.0001 | <0.0001 | 1 | 1 | 0.66 | 1 | 0.0003 | <0.0001 |
| Variable “medical consultation time” | |||||||||
| MM | <0.0001 | - | - | - | - | - | - | - | - |
| NE | <0.0001 | 0.002 | - | - | - | - | - | - | - |
| NO | 0.02 | <0.0001 | <0.0001 | - | - | - | - | - | - |
| OC | <0.0001 | 0.04 | 1 | <0.0001 | - | - | - | - | - |
| OR | 1 | 0.04 | <0.0001 | 0.04 | <0.0001 | - | - | - | - |
| NG | 0.11 | <0.0001 | <0.0001 | 1 | <0.0001 | 0.11 | - | - | - |
| SO | 0.01 | 0.11 | <0.0001 | <0.0001 | <0.0001 | 0.97 | <0.0001 | - | - |
| UR | <0.0001 | <0.0001 | <0.0001 | 1 | <0.0001 | <0.0001 | 1 | <0.0001 | - |
| VA | <0.0001 | <0.0001 | <0.0001 | 1 | <0.0001 | 0.01 | 1 | <0.0001 | <0.0001 |
| Variable “clinical deterioration length time” | |||||||||
| MM | 0.67 | - | - | - | - | - | - | - | - |
| NE | 0.57 | 0.01 | - | - | - | - | - | - | - |
| NO | 0.08 | 0.002 | 1 | - | - | - | - | - | - |
| OC | 1 | 0.29 | 1 | 0.87 | - | - | - | - | - |
| OR | 1 | 0.04 | 1 | 1 | 1 | - | - | - | - |
| NG | 0.05 | 0.003 | 1 | 1 | 0.41 | 1 | - | - | - |
| SO | 0.02 | 0.0001 | 1 | 1 | 1 | 1 | 1 | - | - |
| UR | 0.05 | 0.0002 | 1 | 1 | 1 | 1 | 0.74 | 1 | - |
| VA | <0.0001 | <0.0001 | 0.67 | 1 | 0.003 | 1 | 1 | 0.74 | <0.0001 |
| Variable | Dengue (n = 50,101) | Severe Dengue (n = 296) | p-Value | |
|---|---|---|---|---|
| Age | 23 (20–25) | 26 (26–26) | 0.14 | |
| Age group | Early childhood (0–5) | 3924 (7.8%) | 29 (9.8%) | 0.2 |
| Childhood (6–11) | 5541 (11.1%) | 40 (13.5%) | 0.2 | |
| Adolescence (12–18) | 7477 (14.9%) | 51 (17.2%) | 0.3 | |
| Early adulthood (19–26) | 8359 (16.7%) | 53 (17.9%) | 0.6 | |
| Adulthood (27–59) | 20,669 (41.3%) | 88 (29.7%) | <0.0001 | |
| Old age (60+) | 4131 (8.2%) | 35 (11.8%) | 0.03 | |
| Sex | Female | 25,190 (50.3%) | 149 (50.3%) | 1 |
| Male | 24,911 (49.7%) | 147 (49.7%) | ||
| Clinical variables | Medical consultation time (in days) | 3 (3–4) | 4 (4–5) | <0.0001 |
| Hospitalized patients | 14,670 (29.3%) | 290 (98%) | <0.0001 | |
| Clinical deterioration time (in days) | 4 (4–5) | 5 (4-5) | 0.27 | |
| Symptoms | Fever | 50,092 (100%) | 296 (100%) | 1 |
| Headache | 43,155 (86.1%) | 236 (79.7%) | 0.002 | |
| Retro-ocular pain | 24,099 (48.1%) | 144 (48.6%) | 0.9 | |
| Myalgia | 43,112 (86.1%) | 255 (86.1%) | 1 | |
| Arthralgia | 38,275 (76.4%) | 236 (79.7%) | 0.2 | |
| Rash | 24,092 (48.1%) | 114 (38.5%) | 0.001 | |
| Abdominal pain | 13,019 (26%) | 218 (73.6%) | <0.0001 | |
| Vomiting | 11,425 (22.8%) | 161 (54.4%) | <0.0001 | |
| Diarrhea | 7508 (15%) | 96 (32.4%) | <0.0001 | |
| Drowsiness | 1599 (3.2%) | 65 (22%) | <0.0001 | |
| Hypotension | 740 (1.5%) | 83 (28%) | <0.0001 | |
| Hepatomegaly | 579 (1.2%) | 40 (13.5%) | <0.0001 | |
| Oral ecchymosis | 1820 (3.6%) | 58 (19.6%) | <0.0001 | |
| Hypothermia | 212 (0.4%) | 20 (6.8%) | <0.0001 | |
| Thrombocytopenia | 10,776 (21.5%) | 216 (73%) | <0.0001 | |
| High hematocrit level | 1570 (3.1%) | 70 (23.6%) | <0.0001 | |
| Variable | Coefficient | Exp (Coefficient) | SE | p-Value |
|---|---|---|---|---|
| Sex (male) | 0.047 | 1.048 | 0.019 | 0.013 |
| Type of dengue (severe) | −0.104 | 0.902 | 0.070 | 0.139 |
| Type of settlement (populated center) | 0.120 | 1.127 | 0.037 | 0.001 |
| Type of settlement (rural–dispersed) | −0.010 | 0.990 | 0.032 | 0.760 |
| Subregion (MM) | 0.154 | 1.166 | 0.073 | 0.036 |
| Subregion (NE) | −0.153 | 0.858 | 0.067 | 0.022 |
| Subregion (NO) | −0.192 | 0.826 | 0.093 | 0.039 |
| Subregion (OC) | 0.013 | 1.014 | 0.068 | 0.843 |
| Subregion (OR) | −0.129 | 0.879 | 0.087 | 0.137 |
| Subregion (SO) | −0.073 | 0.930 | 0.059 | 0.215 |
| Subregion (UR) | −0.164 | 0.848 | 0.044 | <0.0001 |
| Subregion (VA) | −0.156 | 0.856 | 0.041 | <0.0001 |
| Subregion | BC | MM | NE | NO | OC | OR | SO | UR | VA |
|---|---|---|---|---|---|---|---|---|---|
| Poverty | |||||||||
| Urban | 46% | 28% | 27% | 24% | 24% | 17% | 24% | 40% | 10% |
| Rural | 67% | 48% | 56% | 53% | 52% | 36% | 47% | 71% | 22% |
| Total | 56% | 35% | 42% | 41% | 43% | 31% | 37% | 59% | 12% |
| Health barrier | |||||||||
| Urban | 4% | 4% | 2% | 3% | 3 % | 3% | 3% | 6% | 3% |
| Rural | 4% | 3% | 4% | 4% | 3 % | 2% | 3% | 5% | 3% |
| Total | 4% | 3% | 4% | 4% | 3 % | 3% | 4% | 5% | 3% |
| No access to drinking water | |||||||||
| Urban | 8% | 2% | 2% | 2 % | 1% | 1% | 1 % | 5 % | 1% |
| Rural | 36% | 23% | 60% | 60% | 29% | 37% | 41% | 70% | 18% |
| Total | 19% | 12% | 32% | 26% | 16% | 14% | 21% | 43% | 3% |
| Overcrowding | |||||||||
| Urban | 19% | 10% | 8% | 7% | 9% | 6% | 6% | 15% | 4% |
| Rural | 15% | 6% | 6% | 6% | 7% | 4% | 4% | 14% | 3% |
| Total | 17% | 7% | 6% | 7 % | 7% | 5% | 5% | 15% | 4% |
Disclaimer/Publisher’s Note: The statements, opinions and data contained in all publications are solely those of the individual author(s) and contributor(s) and not of MDPI and/or the editor(s). MDPI and/or the editor(s) disclaim responsibility for any injury to people or property resulting from any ideas, methods, instructions or products referred to in the content. |
© 2022 by the authors. Licensee MDPI, Basel, Switzerland. This article is an open access article distributed under the terms and conditions of the Creative Commons Attribution (CC BY) license (https://creativecommons.org/licenses/by/4.0/).
Share and Cite
Ortiz, S.; Catano-Lopez, A.; Velasco, H.; Restrepo, J.P.; Pérez-Coronado, A.; Laniado, H.; Leiva, V. Identification of Hazard and Socio-Demographic Patterns of Dengue Infections in a Colombian Subtropical Region from 2015 to 2020: Cox Regression Models and Statistical Analysis. Trop. Med. Infect. Dis. 2023, 8, 30. https://doi.org/10.3390/tropicalmed8010030
Ortiz S, Catano-Lopez A, Velasco H, Restrepo JP, Pérez-Coronado A, Laniado H, Leiva V. Identification of Hazard and Socio-Demographic Patterns of Dengue Infections in a Colombian Subtropical Region from 2015 to 2020: Cox Regression Models and Statistical Analysis. Tropical Medicine and Infectious Disease. 2023; 8(1):30. https://doi.org/10.3390/tropicalmed8010030
Chicago/Turabian StyleOrtiz, Santiago, Alexandra Catano-Lopez, Henry Velasco, Juan P. Restrepo, Andrés Pérez-Coronado, Henry Laniado, and Víctor Leiva. 2023. "Identification of Hazard and Socio-Demographic Patterns of Dengue Infections in a Colombian Subtropical Region from 2015 to 2020: Cox Regression Models and Statistical Analysis" Tropical Medicine and Infectious Disease 8, no. 1: 30. https://doi.org/10.3390/tropicalmed8010030