Mapping the Geographic Distribution of Tungiasis in Sub-Saharan Africa


Department of Geography, Texas State University; 601 University Drive, San Marcos, TX 78666, USA
Trop. Med. Infect. Dis. 2020, 5(3), 122; https://doi.org/10.3390/tropicalmed5030122
Submission received: 2 July 2020
/
Revised: 14 July 2020
/
Accepted: 19 July 2020
/
Published: 24 July 2020
(This article belongs to the Special Issue Spatial Epidemiology of Infectious Diseases)
Abstract
:The geographic distribution of tungiasis is poorly understood, despite the frequent occurrence of the disease in marginalized populations of low socioeconomic status. To date, little work is available to define the geography of this neglected tropical disease (NTD). This exploratory study incorporated geostatistical modeling to map the suitability for tungiasis transmission in sub-Saharan Africa (SSA). In SSA, environmental suitability is predicted in 44 countries, including Angola, Nigeria, Ghana, Cameroon, Cote de Ivoire, Mali, Ethiopia, the Democratic Republic of the Congo, Kenya, Gabon, Uganda, Rwanda, Tanzania, Zambia, Zimbabwe, Madagascar, and South Africa. In total, an estimated 668 million people live in suitable areas, 46% (304 million) of which reside in East Africa. These evidence-based maps provide vital evidence of the potential geographic extent in SSA. They will help to guide disease control programs, inform policymakers, and raise awareness at the global level. Likewise, these results will hopefully provide decisionmakers with the pertinent information necessary to lessen morbidity and mortality in communities located in environmentally suitable areas.

1. Introduction
Tungiasis is a neglected tropical disease (NTD) caused by the parasitic flea Tunga penetrans (order: Siphonaptera, family: Hectopsyllidae). The disease has a widespread geographic distribution throughout the neotropical realm and sub-Saharan Africa (SSA). Ancient parasites like those from the genus Tunga have traditional roots in the Western Hemisphere among pre-Columbian Andean societies and were first described after the arrival of Columbus by Spanish chroniclers [1]. Documents from the early 20th century indicate that tungiasis caused severe morbidity in indigenous populations [2]. The spread of the ectoparasite to Africa was triggered in 1872 by the illegal dumping of sand ballast in Angola, having sailed from Rio de Janeiro, Brazil [2]. Prevalence rates in hyperendemic zones range from 21% to 83%, with a higher range found in Nigeria, Brazil, Trinidad, and Tobago [3,4,5]. As of 2009, tungiasis is endemic or potentially endemic in 89 countries worldwide [6]. The population estimated to be at risk of tungiasis in SSA is poorly documented. For example, in 2014, an estimated 1.4 million Kenyans suffered from the disease, and in 2011, there were 265 deaths, although it is likely that the number of fatalities is underreported [7].
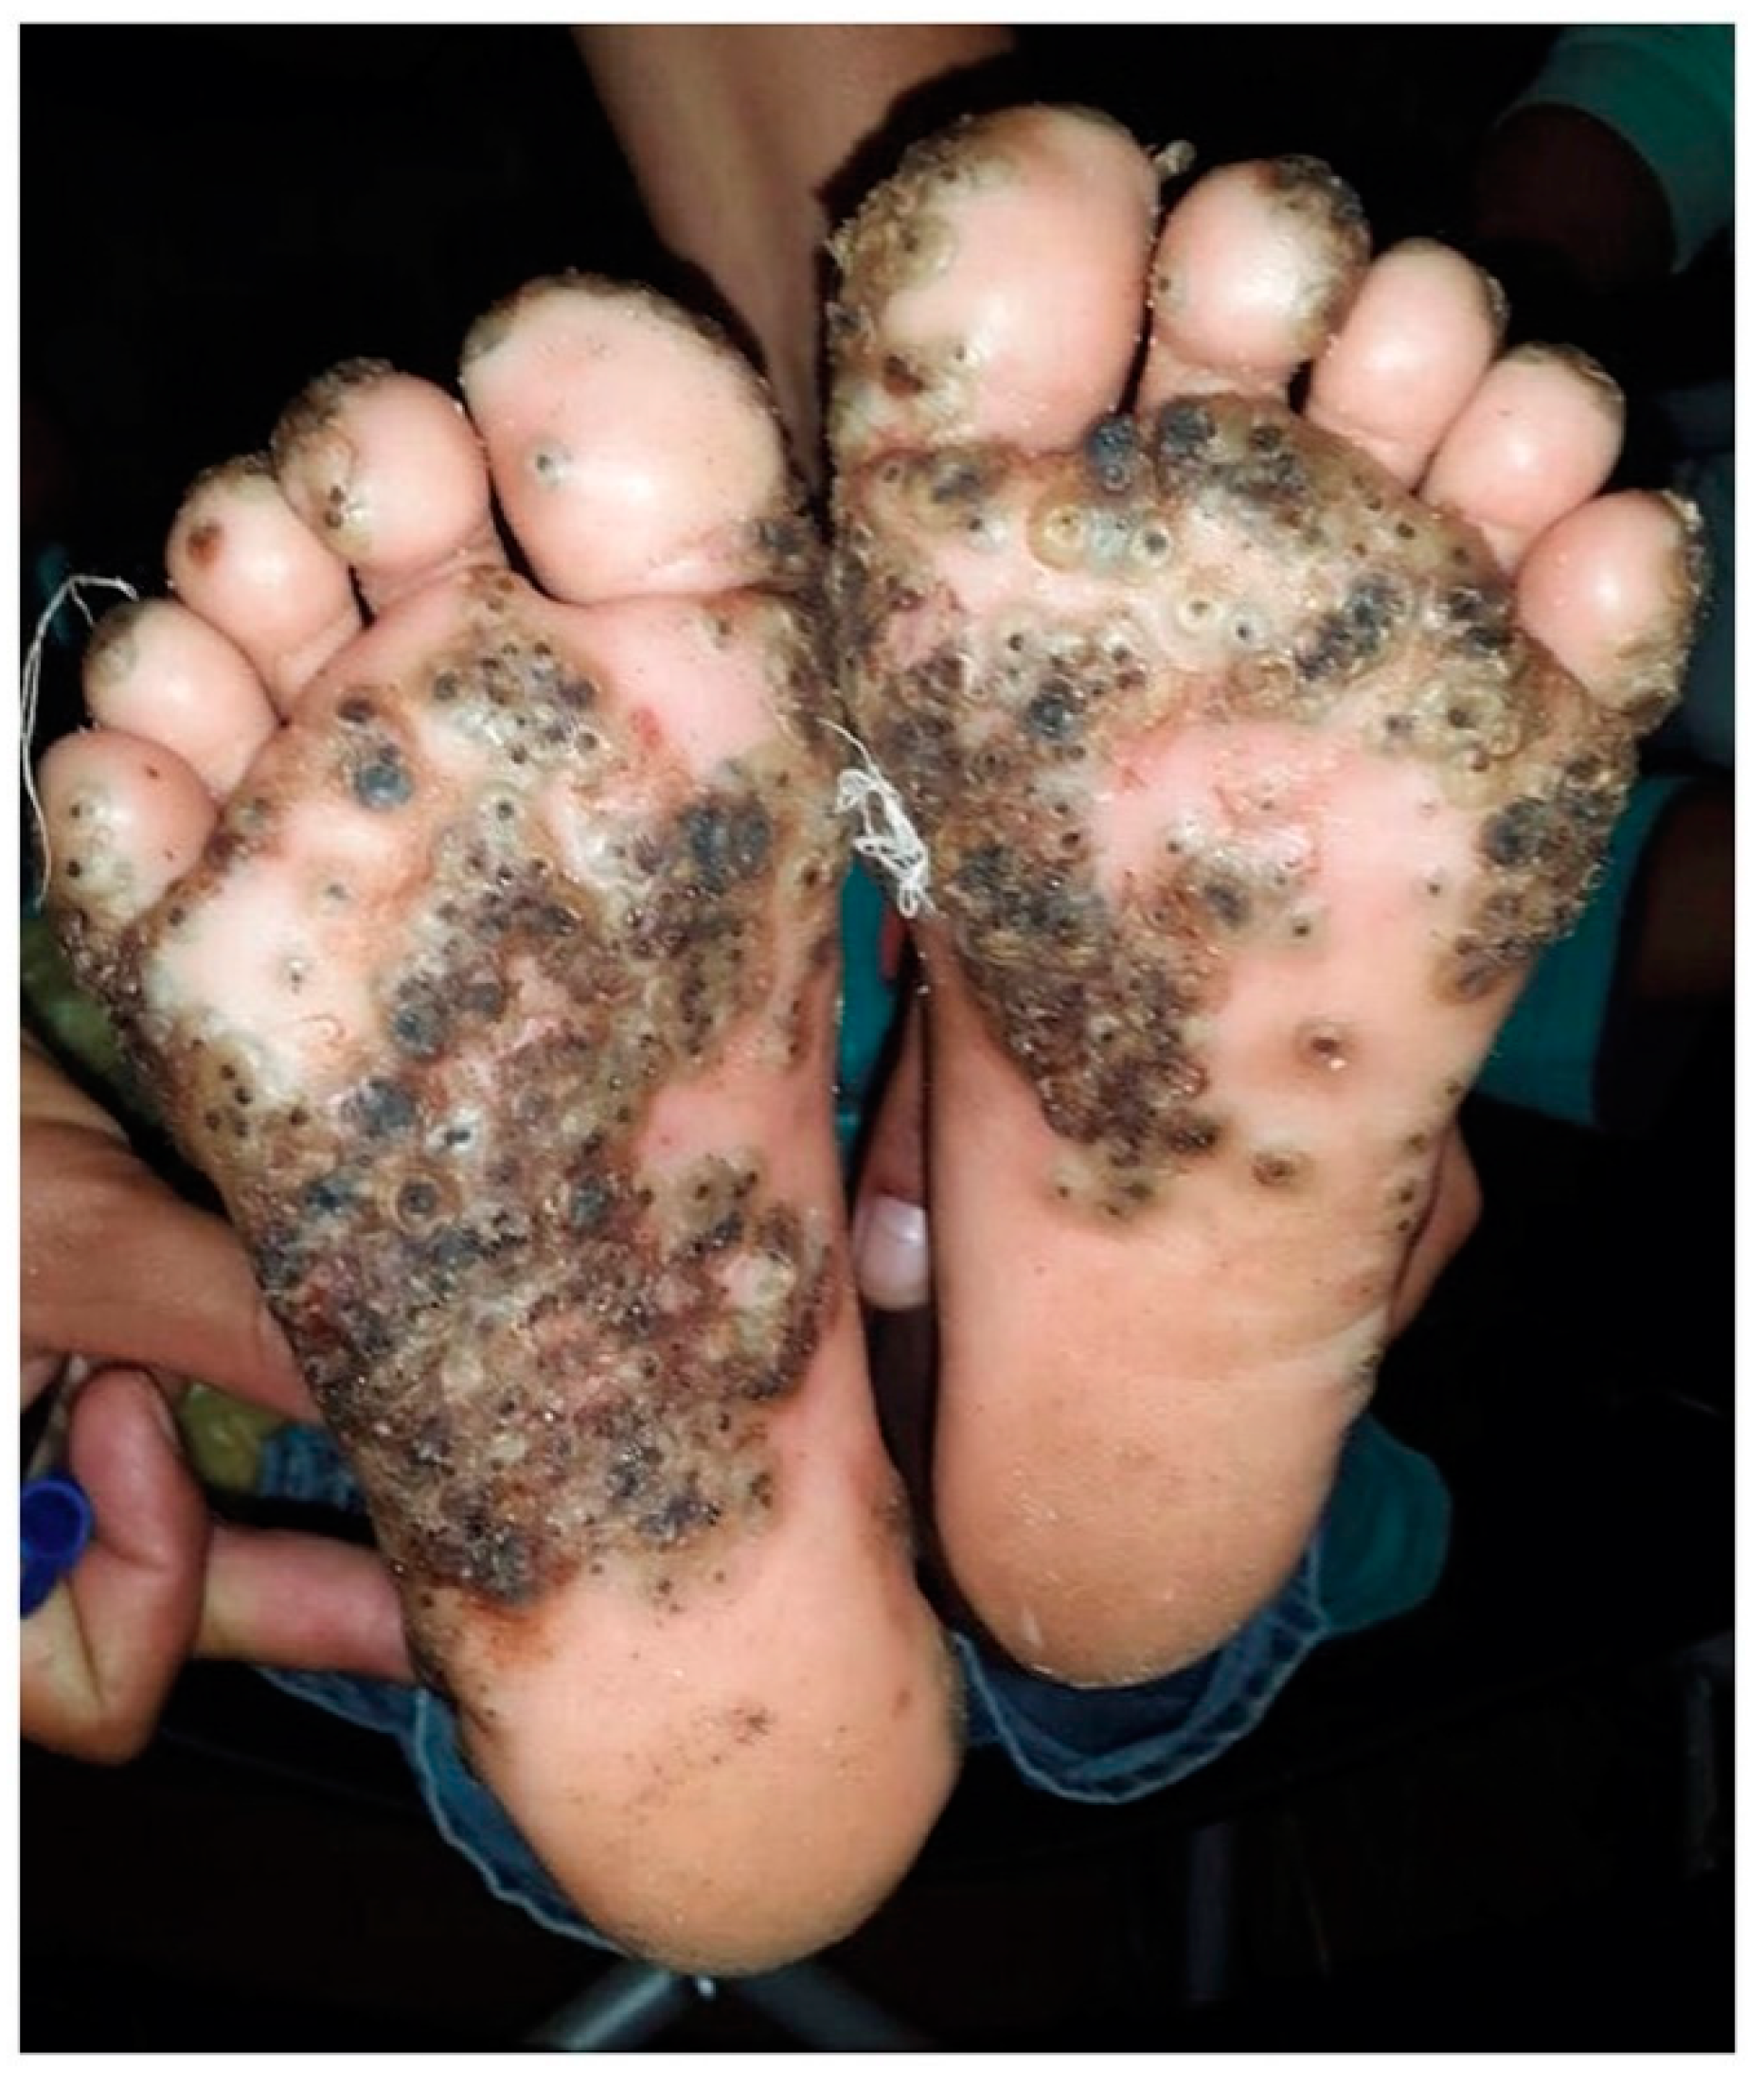
To date, two species, Tunga penetrans and Tunga trimamillata are known to affect humans and domestic animals [8]. The disease develops when the female sand flea (jigger flea or chigoe flea), the smallest known flea in the world (< 1 mm), burrows into the host’s epidermis primarily in the hands, knees, heels, and soles [9,10] (Figure 1). This process causes acute clinical manifestations resulting in severe pain, itching, and a lesion at the site of penetration. The flea remains burrowed for a period of up to five weeks—during which, within one to two weeks, it increases its volume by a factor of roughly 2000–3000, before reaching a diameter of up to 1 cm [11,12]. Sand fleas have several unique physical features that give them the ability to burrow and remain buried in the epidermis. These include a well-developed laciniae and an epipharynx [13]. The entire parasite remains buried, with exception to the anus, the genital opening, and four pairs of stigmata [11].
Severe infestations can lead to the development of fissures, disfigurement, amputation, immobilization, and chronic lymphedema, as well as secondary infections like septicemia, tetanus, and toxic shock syndrome [14,15,16,17]. Individuals suffering from secondary medical conditions are at an increased risk of developing life-threatening complications [18]. Tungiasis is a disease of poverty that causes significant morbidity and mortality in children, the disabled, and the elderly [19]. The utilization of sharp instruments like needles or pins and even thorns to extract the fleas has been documented [15,19]. This practice raises the risk of contracting human immunodeficiency virus (HIV) and other blood-borne pathogens like Hepatitis B and C [18,20]. Ectopic infections of the genitals [21], eyelids [22], and tongue [23] have been documented. In resource-poor communities with low tetanus vaccination coverage, evidence points to an association between tungiasis and tetanus [16,24]. Individuals living with the disease often face social stigmatization and marginalization. In 2007, an estimated 800,000 Kenyans could not vote because of the inability to walk to voting stations due to disability from the disease [25].
Disease mapping is a field of spatial epidemiology involved in estimating the spatial patterns of disease risk to facilitate public health interventions [26]. Exploratory disease mapping provides insights, as opposed to diffusion, trends, or precise locational estimates [27]. Recent advances in geospatial technologies allow for greater flexibility in disease mapping. Data availability is a significant challenge to mapping the spatial distribution of parasitic, vector-borne, or zoonotic diseases. The availability of accurate epidemiological data, including precise spatially accurate occurrence and prevalence data, represents a significant barrier to progress. This challenge is no different with regards to tungiasis, a disease receiving little attention from policymakers, funding institutions, pharmaceutical companies, and the scientific community. To date, no systematic data on disease occurrence exist [28]. Likewise, control programs aimed at reducing severe morbidity are nonexistent [29].
The conceptual foundation of this study comes from two emerging fields, disease biogeography, and precision public health. Disease biogeography incorporates geospatial techniques, spatial epidemiology, and ecological niche modeling (ENM) to provide robust analytical and predictive analyses in the study of the geographic distribution of disease [30]. Examples of this application include mapping the potential risk of Mycetoma [31], Ebola virus disease (EVD) [32], anthrax (Bacillus anthracis) [33], Nipah virus (NiV) [34], and global hotspots of zoonotic diseases in mammals [35]. Precision public health integrates the geographic perspectives to pinpoint with greater accuracy the regions of elevated health risk at multiple scales of analyses. Literature examples of this include vaccine coverage [36], malaria [37], diarrhea [38], and child growth failure [39].
In this research, the goals were to map the geographic distribution of tungiasis in sub-Saharan Africa (SSA) by occurrences and remotely sensed environmental data. Despite representing a significant health burden, a thorough investigation of the geographic distribution of tungiasis in SSA is nonexistent. Thus, an exploratory analysis is necessary to (i) develop inductive models of environmental suitability and (ii) and to determine the total population living in areas of significant environmental heterogeneity where prioritization is needed. This study will be of interest to medical scientists, public health decisionmakers, policymakers, and other stakeholders interested in using geospatial techniques, especially regarding decisions on the equitable distribution of resources aimed at combating this disease.
2. Materials and Methods
2.1. Study Area and Occurrence Records
The model calibration area (Figure 2) encompasses the whole of sub-Saharan Africa, a region defined broadly by the transition zone between the Saharan desert and the Sahel region. According to the World Bank, the total population of Sub-Saharan Africa in 2018 was 1,078,306,520 (https://data.worldbank.org/indicator/SP.POP.TOTL?locations=ZG). The study area is divided into designations from the WHO Global Burden of Disease Regions (GBD) [40]. These regional designations will serve as the basis for reporting the total population living in environmentally suitable areas. Tungiasis occurrences records (n = 86) (please see Supplementary Materials: Table S2) were assembled through a search of the literature from 1324–2019 [23,24,25,41,42,43,44,45,46,47,48,49,50,51,52,53,54,55,56,57,58,59,60,61,62,63,64,65,66,67,68,69,70,71,72,73,74,75,76,77,78,79,80,81,82,83,84,85,86,87,88,89,90,91,92,93,94,95,96,97]. The usually accepted arrival of T. penetrans in Africa is 1872, although evidence exists for its presence among a caravan traveling along the trans-Saharan trade route at Oualata (present-day Mauritania) in 1324 [97].
The date of this description is too early (548 years), assuming that T. penetrans was introduced to Africa after Columbus; however, it cannot be entirely dismissed based on historical accounts from Wiener [98], Hooton [99], and Hutton [75]. This record was not included in the modeling, though, due to these concerns. Briefly, the search for these records was conducted in the databases PubMed (https://pubmed.ncbi.nlm.nih.gov/) and Google Scholar (https://scholar.google.com/). Literature included cross-sectional surveys, monographs, and country-specific reports on the disease. The following search terms were used: "tungiasis", "tungiasis animals", and "tungiasis climate", as well as search terms for individual countries. For example, "tungiasis Kenya" or "tungiasis Nigeria". No time or article type limits were applied. Occurrence data were supplemented with Global Biodiversity Information Facility (GBIF) (https://www.gbif.org/) [41] records for T. penetrans in Gabon, Cameroon, and Uganda (n = 4) (GBIF.org (13 May 2020) GBIF Occurrence Download https://doi.org/10.15468/dl.xcpprz). Spatial information for each location (cities, towns, or villages) was collected manually from online geocoding services like Google Earth (https://earth.google.com/) and the Open Street Map project (openstreetmap.org). Geographic coordinates for these locations were standardized to decimal degrees to be displayed in a geographic coordinate system (WGS84).
2.2. Description of Environmental Covariates
Data on the ecological determinants of tungiasis were obtained from a variety of remotely sensed datasets (Table 1). The geographic coordinates for the occurrence data (n = 86) were used to extract raster data estimates of (1) the bioclimatic variables; (2) enhanced vegetation index (EVI); (3) landcover type; (4) soil composition (sand, clay, and silt) and soil pH; (5) livestock densities; (6) distance to water bodies; (7) and the distribution of rural poor populations (person/square km). All datasets were resampled at a spatial resolution of 2.5 arcminutes (5-km) in ArcGIS desktop v10.7.1. [100].
Bioclimatic estimates were obtained from the ENVIREM (ENVIronmental Rasters for Ecological Modeling) [101] dataset at a 2.5-arcminute (5-km) resolution (https://envirem.github.io/). ENVIREM represents an alternative to the widely cited WorldClim database [101] and contains additional novel environmental information reflecting more specific underlying ecological and physiological processes [101]. ENVIREM is generated at the same resolution as WorldClim to facilitate integration and is processed for the present (1960–1990), mid-Holocene (~ 6000 years ago), and last glacial maximum (LGM) (~ 22,000 years ago) periods. Although these data are generated from the same underlying dataset as WorldClim, Title, and Bemmels [101] demonstrated marked improvements in the performances and projections of species distributions. Here, data for the current period (1960–1990) were obtained for the African continent in a GeoTiff format. Studies on the environmental factors influencing tungiasis are limited in scope; however, two previous studies have analyzed the off-host life stages of T. penetrans [13,102]. Linardi and colleagues [102] determined that, when examining T. penetrans larva, there was a difference in the air temperature and relative humidity between indoor and outdoor environments, with median values of 27.7 °C and 70.4% outdoors and 26.8 °C and 56.9% indoors, respectively. Furthermore, inside dwellings, larval T. penetrans could survive at air temperatures between 22.0–31.2 °C and relative humidity between 51.4–95.1% [102]. The evidence of tungiasis and soil characteristics has not been substantiated in previous research. However, Nagy and colleagues [13] found that 58% of larvae samples in a Brazilian study were located between 2–5 cm below the surface of the soil. Based on this information, edaphic variables: sand, clay, soil Ph, and silt content (5-cm depth, g/100 (w%)) were obtained at a 1-kilometer resolution from the International Soil Reference and Information Centre (ISRIC) (https://soilgrids.org/) at a 0–5-cm depth [103]. Local-level studies have documented an association between tungiasis and sandy, clay soils in Trinidad and Tobago [5], Brazil [104], and Kenya [51].
Enhanced vegetation index (EVI) (2001–2012) imagery was obtained from the United States Geological Survey Land Processes Distributed Active Archive Center (LP-DAAC) (http://LPDAAC.usgs.gov). Enhanced vegetation index (EVI) is an optimized vegetation index that increases the vegetation signal, with an emphasis on improved sensitivity in high biomass regions [105]. EVI has been identified as a proxy in previous studies of vector-borne [106] and parasitic diseases [107,108]. Complementing the EVI data were landcover coverages representing the predominant distribution of croplands, forests, grasslands, shrublands, and herbaceous vegetations (~1 km). These data were obtained from the Global Landcover Network Share database (GLC-Share) (2013) (http://www.fao.org/geonetwork/srv/en/main.home) managed by the Food and Agricultural Organization of the United Nations (FAO). The risk to humans is higher for individuals living with or in close contact with animals [109]. Thus, livestock densities were obtained from the Gridded Livestock of the World (v2.01) database at a 1~kilometer resolution from the Food and Agricultural Organization of the United Nations (FAO) (livestock.geo-wiki.org). These data include the densities of chickens [110], goats [24], and pigs [110]. Domestic animals serving as reservoirs for T. penetrans are numerous and include cats, dogs, chickens, goats, pigs, cattle, monkeys, and rats [7,15].
Socioeconomic and geographic factors, like with so many NTDs, are paramount to the persistence of these diseases. Tungiasis is highly prevalent among people living in extreme poverty in Latin America and SSA [15,18]. Epidemiological hotspots develop through the combination of pervasive poverty, behavioral attributes, and environmental risk factors [25]. With these facts in mind, estimates of the density of rural poor populations in SSA (2010) (person/square km) (5 km) (2.5-arcminute resolutions) were obtained from the Center for International Earth Science Information Network (CIESIN) (http://www.ciesin.org/) at Columbia University (New York, NY, USA). This data product combines several datasets: the 2005 Global Subnational Rates of Underweight Child Status, Global Rural-Urban Mapping Project (GRUMP), LandScan 2007 Global Population Database, the Demographic and Health Survey 2008, and the WHO Prevalence of Child Malnutrition database. Additionally, tens of millions of people in SSA suffer from a lack of access to adequate water resources or what is termed as "water poverty" [111]. The interface between water access and poverty is strongly interlinked [112,113]. Globally, it is estimated that hygiene and sanitation-related diseases account for 7% of the total disease burden and 19% of child mortality [114]. To represent this geographic determinant, the distances to water bodies (km) in SSA (2014) were obtained from the ESRI (Environmental Systems Research Institute) (https://www.arcgis.com/home/item.html?id=46cbfa5ac94743e4933b6896f1dcecfd) and were derived from the Global Lithological Map and a world landcover layer at a 250-meter resolution.
3. Data Analysis
3.1. Principal Component Analysis
A principal component analysis (PCA) was carried out on all sets of variables to reduce the overall multicollinearity and dimensionality [115,116]. The covariates were separated into five separate groups to calculate the principal components for each set using the cross-platform application, Niche Analyst (NicheA) [117]. For the ENVIREM data, the first eight PCs were retained, which represented 99% of the total variance. The first three PCs for soil (99.5%) and the first five PCs for landcover (99.9%) were retained, as were the first three for livestock densities (99.9%). Finally, for set five, two PCs (99.9%), corresponding to the distribution of rural poor populations in SSA and the distances to water bodies, were retained. Thus, the analysis was performed with a total of 21 environmental layers.
3.2. Ensemble ENM Approach
Ecological niche modeling (ENM) is a quantitative technique that links presence data with environmental variables, allowing for the development of a correlative model of environmental suitability. A "black box" approach, focusing on reconstructing the environmental conditions of disease persistence based on individual spatial information only, was implemented. The “black box” approach is advantageous for rare diseases where epidemiological information is scarce [118]. The ENM algorithms in this study were selected based on recommendations from Elith [119] and Eberhand [120]. These include generalized linear models (GLM) [121], generalized additive models (GAM) [121], generalized boosted regression models (GBM) [122], random forest (RF) [123], and maximum entropy (Maxent) [124]. Ensemble forecasting enabled the development of a more robust model that overcame the inherent uncertainties derived from each model [125].
The models were developed with the R programming language [126] package biomod2 [127]. The model calibration specified that 80% of the data be assigned as a random sample, with the remaining 20% used for verifying the model accuracy using three metrics: the area under the curve (AUC) of the receiver operating characteristic (ROC) [128], the true skill statistic (TSS) [129], and Cohen’s Kappa (Heidke skill score) [130]. The algorithm parameters for the generalized linear models (GLM) specified a stepwise feature selection based on the Akaike Information Criterion (AIC); the generalized boosted regression models (GBM) featured 5000 maximum trees, a minimum of 10 tree terminal nodes, a learning rate of 0.01, and an interaction depth of 7. The generalized additive models (GAM) featured a binomial distribution and logit link function with a degree of smoothing set at 4; the random forest (RF) algorithm settings specified a node size of 5 and 500 maximum trees. Finally, the maximum entropy algorithm (Maxent) specified linear, quadratic, product, threshold, and hinge features and the number of iterations was increased from 500 to 5000 to ensure algorithm convergence.
Biomod2 requires a pseudo-absence generation when true absences are not available. Based on the small sample size, a conservative 1:1 ratio (86 pseudo-absences) between the pseudo-absences and occurrences was generated [131], with the pseudo-absence selection parameter “disk” that defined a minimal distance (250 km) to the occurrence points for selecting the pseudo-absence candidates. The pseudo-absences were randomly selected within the calibration area due to Maxent being a presence/background modeling technique. In total, ten replicates were specified, with a TSS evaluation metric threshold of > 0.50. The individual models were internally evaluated, with a subset of the data to determine the model performances and accuracies. Thus, only the models exceeding the evaluation metric cutoff of > 0.50 were retained. The final ensemble forecasts were estimated by weighting the mean of the TSS scores or, more specifically, the weighted sum of the predictions.
The coefficient of variation (CV) across all the predictions served as the measure of uncertainty (please see Map S1). The variable importance of the principal components was based on the decrease in accuracy and correlating the fitted data of the full models with the randomly permuted predictor values [132]. The subsequent uncertainty model was compared to the poverty estimates for the proportion of people living in poverty, as defined by the Multidimensional Poverty Index (MPI) [133] at a one-kilometer resolution for Kenya, Uganda, Tanzania, Nigeria, and Malawi. These estimates represent the proportion of people living on $1.25 a day. These data were obtained from the University of Southampton WorldPop project (https://www.worldpop.org/).
3.3. Estimating the Population Living in Environmentally Suitable Areas
The estimated population living in the areas of environmental suitability was determined by calculating a threshold value (i.e., ecological limits) that best represented the trade-off between the model sensitivity, specificity, and accuracy. The estimated number of individuals living in these areas in 2020 was calculated by overlaying this binary raster with the WorldPop (https://www.worldpop.org/) gridded population density surface. The calculated total population in these areas was quantified based on the number of individuals per grid cell based on the Global Rural-Urban Mapping Project (GRUMP) v1 (CIESIN) (https://sedac.ciesin.columbia.edu/data/collection/grump-v1) Columbia University (New York, NY, USA). The urban extent polygons delineated areas where the population density was greater than or equal to 1000 people per km2 based on the extent of nighttime light satellite imagery [134]. The areas with populations greater than or equal to 1000 were classified as urban, while cell values less than 1000 were assigned as nonurban. The resulting maps were created in ArcGIS desktop v10.7.1 [100]. The analytical strategy of this study is available in Figure 3.
3.4. Environmental Suitability in SSA
The compiled database (n = 86) of occurrences are located on landcover types that are primarily composed of croplands (27.7%), forests (22%), shrublands (13.3%), and grasslands (12.6%). Sand (49.13) and clay (33.20) contents were found to a higher degree when compared to silt (18.27), while the average soil pH was 5.7. The average headcount/km2 of livestock was highest among chickens (585.49), goats (32.05), and pigs (8.48). The average distance from each occurrence point to a water body was 64.25 km, and the average population density for rural poor per/km2 was 65.26. The average max temperature of the coldest month and the minimum temperature of the warmest month ranged from 26.4 °C (minimum: 17.5 °C, maximum: 33.8 °C) to 18.3 °C (minimum: 7.7 °C, maximum: 25.6 °C). The Thornthwaite aridity index average value of 55.19 (minimum: 4.67, maximum: 88.75) implied that occurrences were, on average, located in dry sub-humid environments. Dry sub-humid lands included grasslands and savannah biomes. The environmental suitability was further partitioned into climate zones based on the Koppen Climate Classification System [135]. Suitable environments were primarily found in tropical savanna (Aw), semi-arid (Bsh), humid subtropical (Cwa), tropical monsoon (Am), tropical rainforest (Af), and subtropical highland (Cwb) climates.
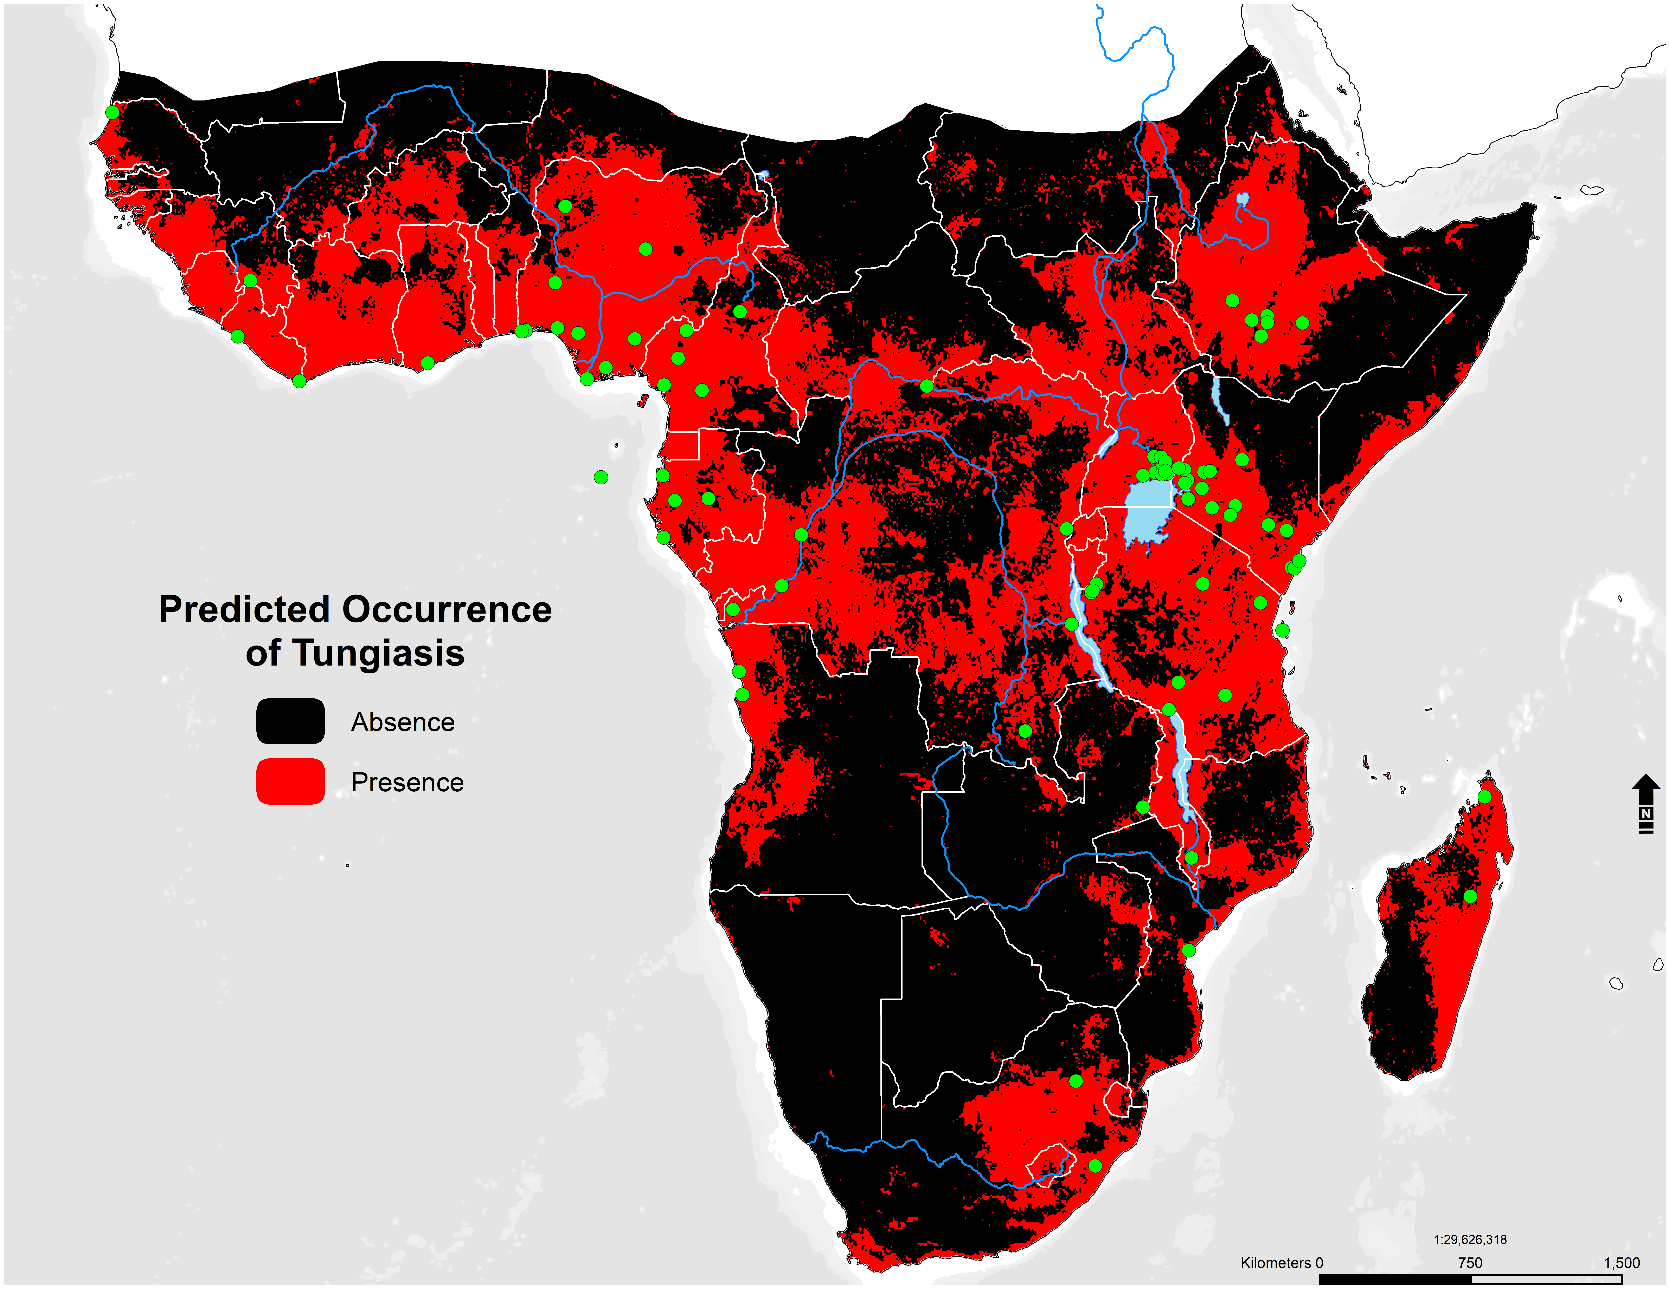
The probability of occurrence based on the weighted mean output is presented in Figure 4. High suitability was predicted in 44 countries in SSA, along with areas surrounding the African Great Lakes (Kyoga, Albert, Edward, Victoria, Kivu, Tanganyika, Rukwa, Mweru, and Malawi); Eastern and Central Madagascar; the Ethiopian Highlands; Eastern South Africa; Nigeria; Cameroon; Tanzania; and Western Angola. Suitability was also present in South Sudan, the Central African Republic, Cote de Ivoire, Guinea-Bissau, Ghana, Liberia, Sierra Leone, and The Gambia. Additionally, environmental signals were captured in Burkina Faso, Zimbabwe, Mali, Somalia, and Gabon. Most of Southwestern Africa (Namibia and Botswana) and Southern Mauritania was not predicted to be suitable. Please see the Supplementary Materials for the map of the model uncertainty (CV) (Map S2).
Validation statistics (Figure 5) for the selected algorithms indicated good-strong performances. Overall, the random forest (RF) (AUC: 0.94; TSS: 0.86; KAPPA: 0.83), generalized boosted regression (GBM) (AUC: 0.86; TSS: 0.70; KAPPA: 0.68), and generalized linear models (GLM) (AUC: 0.83; TSS: 0.65; KAPPA: 0.63) outperformed both the GAM and Maxent (see Supplementary Materials: Table S1). Variable contributions for the principal components strongly favored bioclimatic factors (Set1 PC2—16.28, Set1 PC3—14.17, Set1 PC1—12, Set1 PC6—11.13, Set1 PC7—10.59, Set1 PC5—10.58, and Set1 PC4—10.54); livestock densities (Set4 PC1—8.6 and Set4 PC2—7.9); the distance to water and the distribution of rural poor populations (Set5 PC1—13.65). An environmental suitability threshold of 0.438 provided the best estimate when measuring the relationships between the weighted mean model sensitivity, specificity, and accuracy. The population living in environmentally suitable areas is estimated at 668 million (Table 2) or 62% of the total population of SSA. The largest proportion of the population is located in East Africa (46%), followed by West Africa (40%) and Central Africa (9%). East Africa has the largest total population living in nonurban areas (217,725,514), while West Africa has the largest total population living in urban areas (148,452,658). The total area of environmentally suitable areas (threshold > 0.438) totaled 8,110,107 sq. kilometers or 3,131,329 sq. miles.
4. Discussion
Since the first description of Tungiasis in 1526 among members of Columbus’ crew of the Santa Maria [2] to the subsequent expansion of the parasitosis across Africa in the 19th century, the disease has become unfortunately commonplace among underprivileged communities facing extreme poverty and underdevelopment. This study is the first to examine tungiasis at a continental scale and contributes to the recent literature that examined the disease from a geographic perspective [15,51]. An ecological niche modeling (ENM) approach was applied to understand better the relationship between the distribution of occurrence locations and environmental covariates to develop a broad-scale predictive map of suitability across SSA. These findings are useful for measuring the degree of spatial heterogeneity and to estimate the total human population living in environmentally suitable areas. Mapping the geographic distribution of tungiasis in SSA represents a positive step towards greater awareness in not only Africa but much of the Western world, where the disease, its impact on human life, and the ectoparasite T. penetrans are unheard of by many. Likewise, model-based guidance is useful for identifying environmentally suitable areas and the potential allocation of resources. NTDs are intimately linked to poverty [136] and thrive in areas with poor sanitation, lack of access to clean water, and among people who live near infected disease vectors and animals [137]. These predictions can further guide surveillance and facilitate dialogue between public health interests located in areas predicted to be suitable, especially those of low socioeconomic status (Figure 6 and Figure 7).
Environmental factors play a vital role in governing the distribution of disease vectors, pathogenic microorganisms, and/or the persistence and transmission of the disease [138]. These results illustrate that bioclimatic factors, the density of livestock, the distance to water, and the distribution of rural poor populations were significant contributors to the potential geographic distribution. Since no previous work has analyzed tungiasis at a broad, continental scale, it is admittedly challenging to compare the results from this study to the previous literature. The broad geography of the occurrence data should be considered, as this clearly reflects the magnitude of the problem for potentially hundreds of millions of people living in suitable areas throughout SSA. This study predicted 44 countries as being suitable for tungiasis. The potential distribution of suitable environments in SSA corresponds to countries with confirmed cases, and these include Angola, Nigeria, Ghana, Cameroon, Ethiopia, the Democratic Republic of the Congo, Kenya, Gabon, Uganda, Tanzania, Zambia, Madagascar, and South Africa. Countries predicted as environmentally suitable but without documented cases include Burkina Faso, Cote de Ivoire, Mali, Chad, Niger, the Central African Republic, Senegal, Sudan, South Sudan, Somalia, and Zimbabwe. Countries with limited suitability are Botswana, Namibia, and Mauritania. These environmentally suitable areas are located predominately within tropical savanna (Aw), semi-arid (Bsh), humid subtropical (Cwa), tropical monsoon (Am), tropical rainforest (Af), and subtropical highland (Cwb) climates.
Geographically, the natural biomes found in these classifications range from grasslands in South Africa, Ethiopia, Zimbabwe, and Zambia to savannas and shrubland biomes in Angola, Tanzania, Kenya, Uganda, South Sudan, and Nigeria. Additionally, tropical rainforests and woodlands stretching from Liberia, Southern Cote d’Ivoire, Nigeria, Western Cameroon, and Eastern Madagascar were highlighted. The population living in environmentally suitable areas is estimated at 668 million (2020), with the majority of these individuals residing in WHO GBD east (46%) and west (40%) regions, which, combined with GBD central and south regions, represent approximately 62% of the total population of SSA. NTDs primarily inflict suffering in poor rural agricultural communities, particularly in regions with subsistence agriculture [139]. East Africa is home to the largest population living in environmentally suitable areas, with an estimated 217 million residents. East Africa is noted as being the most isolated region on the continent, with an estimated 74.4% of the population residing in rural areas [140]. Given the high degree of local and individual heterogeneity within the geographic regions or enumeration units, an effective policy design requires detailed knowledge of the spatial demographics of populations residing in environmentally suitable areas. Disease transmission, because of the clustered nature of the human population, tends to trend towards being spatially focal and heterogeneous. This study contributes to the incorporation of spatial demographic and epidemiological data in disease mapping. Previous efforts in this realm include estimating the burden of malaria in children under five years old [141] and the risk of schistosomiasis [142] and soil-transmitted helminths [143].
This study was grounded in a conceptual foundation of precision public health [144] and disease biogeography [30]; both are rapidly evolving fields that play a critical role in mapping the disease transmission risk in public and animal health. Due to the complex web of causation associated with tungiasis prevalence and hyperendemicity, a multidisciplinary approach incorporating both conceptual frameworks with the expert advice of medical doctors, entomologists, ecologists, parasitologists, and public health officials has the potential to lessen the burden of the disease considerably in geographies of high suitability. Gaining greater insights at more granular resolutions to the inherent risks to human populations is a central theme to frameworks like precision public health, which, at its core, uses the best available data to target more efficient interventions to those most in need [145]. Understanding and anticipating “where” an outbreak may take place or “where” resources need to be allocated to have the most impact are valuable tools for public health interventions.
Although the techniques described in this study offered useful information, there were limitations associated with this research. First, the data on tungiasis in SSA is scarce in comparison to other NTDs on the continent. Therefore, the occurrence records collected in this study spanned many centuries and were compiled from a wide variety of literature sources; thus, there is some inherent uncertainty associated with these data. Some of the oldest records included in the final dataset, particularly the description of apparent jigger infestations at Oualata in 1324, need additional investigation. Though it may never be confirmed, this record brought to light by Lugard [97] raises further questions about the existence of the ectoparasite on the African continent hundreds of years before the historically accepted arrival data of 1872. Other records in this study only include the district name or relative location within these enumeration units.
Second, the suitability model does not measure tungiasis prevalence or incidence. The correlative model characterizes the similarities between the occurrence locations based on environmental covariates and does not estimate the magnitude or confirm their presence. Moreover, the development of inductive models can lead to difficulties in extracting causality. Tungiasis represents a disease with a complex web of causation due to the broad spectrum of domestic and wild animal hosts and prevalence in resource-poor communities. It is crucial to appreciate that these maps delineate areas that are environmentally suitable for tungiasis, and they do not predict the likelihood of the disease in humans and animals and the subsequent human, domestic, and sylvatic cycles. Third, another limitation of these geostatistical estimates is that the entire transmission cycle can occur indoors without the involvement of a zoonotic reservoir [146]. As demonstrated by Linardi and colleagues [102], in resource-poor communities and urban-rural environments, T. penetrans can develop from eggs to adults either indoors or in “indoor-outdoor” habitats. Future mapping efforts at the local scale would benefit from the incorporation of risk factors associated with tungiasis, as well as data representing the status of poor or improved housing conditions.
5. Conclusions
In conclusion, this work highlights, for the first time, the potential geographic distribution of tungiasis in sub-Saharan Africa. This work has identified areas potentially suitable for tungiasis, which need priority for future mapping endeavors and interventions. Significant findings from this research:
- An estimated 668 million individuals live in environmentally suitable areas: 304 million in WHO GBD East Africa and 263 million in WHO GBD West Africa.
- Geographically, environmental suitability is broad and diverse, ranging from tropical savanna (Aw), semi-arid (Bsh), humid subtropical (Cwa), tropical monsoon (Am), tropical rainforest (Af), and subtropical highland (Cwb) climates.
- Environmental suitability is predicted in 44 countries; these include Angola, Nigeria, Ghana, Cameroon, Cote de Ivoire, Mali, South Sudan, Sudan, Somalia, Ethiopia, the Democratic Republic of the Congo, Kenya, Gabon, Central African Republic, Uganda, Rwanda, Tanzania, Zambia, Zimbabwe, Madagascar, Mozambique, and South Africa.
- The total area of environmental suitability (weighted mean threshold > 0.438) is 8,110,107 sq. kilometers or 3,131,329 sq. miles.
Future research would benefit from transdisciplinary collaborations in the development of the first suitability maps for Latin America and improved estimates for SSA. It is imperative to increase the scientific knowledge about the disease and advance greater awareness. Geographically targeted surveillance activities in epidemiological hotspots are critical to managing tungiasis. These maps provide a foundational and baseline assessment that is an essential prerequisite for data-driven control programs.
Supplementary Materials
The following are available online at https://www.mdpi.com/2414-6366/5/3/122/s1: Table S1: Modeling algorithm predictive performance (ROC, TSS, and KAPPA). Map S1: Model Uncertainty Map (Coefficient of Variation). Map S2: Binary (presence/absence)—weighted mean threshold: 0.438. Table S2: Tungiasis occurrence locations in SSA (n = 87).
Funding
This research received no external funding.
Conflicts of Interest
The author declares no conflicts of interest.
References
- Maco, V.; Tantaleán, M.; Gotuzzo, E. Evidence of tungiasis in pre-Hispanic America. Emerg. Infect. Dis. 2011, 17, 855. [Google Scholar] [CrossRef]
- Hoeppli, R. Early References to the Occurrence of Tunga pénétrons in Tropical Africa. Acta Trop. 1963, 20, 143–153. [Google Scholar] [PubMed]
- Heukelbach, J.; Costa, A.; Wilcke, T.; Mencke, N.; Feldmeier, H. The animal reservoir of Tunga penetrans in severely affected communities of north-east Brazil. Med. Vet. Entomol. 2004, 18, 329–335. [Google Scholar] [CrossRef] [PubMed]
- Ade-Serrano, M.A.; Ejezie, G.C. Prevalence of tungiasis in Oto-Ijanikin village, Badagry, Lagos State, Nigeria. Ann. Trop. Med. Parasitol. 1981, 75, 471–472. [Google Scholar] [CrossRef] [PubMed]
- Chadee, D.D. Tungiasis among five communities in south—Western Trinidad, West Indies. Ann. Trop. Med. Parasitol. 1998, 92, 107–113. [Google Scholar]
- Karunamoorthi, K. Tungiasis: A neglected epidermal parasitic skin disease of marginalized populations—A call for global science and policy. Parasitol. Res. 2013, 112, 3635–3643. [Google Scholar] [CrossRef]
- Ahadi Kenya Trust. The Jigger Menace in Kenya. In Anti Jigger Magazine Final Indd; 2011; Volume 2, Available online: http://jigger-ahadi.org/anti_jigger_magazine_year_2_final.pdf (accessed on 2 April 2020).
- Pampiglione, S.; Fioravanti, M.L.; Gustinelli, A.; Onore, G.; Mantovani, B.; Luchetti, A.; Trentini, M. Sand flea (Tunga spp.) infections in humans and domestic animals: State of the art. Med. Vet. Entomol. 2009, 23, 172–186. [Google Scholar] [CrossRef]
- Barbosa, M.M.; Barbosa, A.D. Tungiasis. N. Engl. J. Med. 2019, 380, e19. [Google Scholar] [CrossRef]
- Chen, C.-W.; Thong, H.-Y.; Jee, S.-H. Tungiasis: A case report and review of the literature. Dermatol. Sin. 2011, 29, 29–31. [Google Scholar] [CrossRef] [Green Version]
- Eisele, M.; Heukelbach, J.; Van Marck, E.; Mehlhorn, H.; Meckes, O.; Franck, S.; Feldmeier, H. Investigations on the biology, epidemiology, pathology and control of Tunga penetrans in Brazil: I. Natural history of tungiasis in man. Parasitol. Res. 2003, 90, 87–99. [Google Scholar] [CrossRef]
- Geigy, J.R.; Herbig, A. Die hypertrophie der Organe beim Weibchen von Tunga penetrans; Verlag f. Recht u. Gesellschaft: Bethesda, MD, USA, 1949. [Google Scholar]
- Nagy, N.; Abari, E.; D’Haese, J.; Calheiros, C.; Heukelbach, J.; Mencke, N.; Feldmeier, H.; Mehlhorn, H. Investigations on the life cycle and morphology of Tunga penetrans in Brazil. Parasitol. Res. 2007, 101, 233–242. [Google Scholar] [CrossRef] [PubMed]
- Mullen, G.R.; Durden, L.A. Medical and Veterinary Entomology; Academic press: Amsterdam, The Netherlands, 2009; ISBN 0-08-091969-3. [Google Scholar]
- Elson, L.; Wright, K.; Swift, J.; Feldmeier, H. Control of tungiasis in absence of a roadmap: Grassroots and global approaches. Trop. Med. Infect. Dis. 2017, 2, 33. [Google Scholar] [CrossRef] [Green Version]
- Kimotho, S.; Miller, A.N.; Ngure, P. Managing communication surrounding tungiasis stigma in Kenya. Communication 2015, 41, 523–542. [Google Scholar] [CrossRef]
- Nyangacha, R.M.; Odongo, D.; Oyieke, F.; Ochwoto, M.; Korir, R.; Ngetich, R.K.; Nginya, G.; Makwaga, O.; Bii, C.; Mwitari, P.; et al. Secondary bacterial infections and antibiotic resistance among tungiasis patients in Western, Kenya. PLoS Negl. Trop. Dis. 2017, 11, e0005901. [Google Scholar] [CrossRef] [PubMed] [Green Version]
- Miller, H.; Ocampo, J.; Ayala, A.; Trujillo, J.; Feldmeier, H. Very severe tungiasis in Amerindians in the Amazon lowland of Colombia: A case series. PLoS Negl. Trop. Dis. 2019, 13, e0007068. [Google Scholar] [CrossRef]
- Feldmeier, H.; Eisele, M.; Sabóia-Moura, R.C.; Heukelbach, J. Severe Tungiasis in Underprivileged Communities: Case Series from Brazil. Emerg. Infect. Dis. 2003, 9, 949–955. [Google Scholar] [CrossRef]
- Obengui, I. La tungose et le tétanos au CHU de Brazzaville. Dakar Médical 1989, 34, 44–48. [Google Scholar]
- Shrivastav, S.; Adhikari, R.C. Tungiasis: A rare parasitic infestation in genitals of a native male from Kathmandu. J. Nepal Health Res. Counc. 2017, 15, 295–297. [Google Scholar] [CrossRef] [Green Version]
- Kaimbo, D.K.W.; Bifuko, A.; Parys-Van Ginderdeuren, R. Upper eyelid localisation of Tunga penetrans. Ophthalmologica 2007, 221, 439–442. [Google Scholar] [CrossRef]
- Sentongo, E.; Wabinga, H. Tungiasis presenting as a soft tissue oral lesion. BMC Oral Health 2014, 14, 112. [Google Scholar] [CrossRef] [Green Version]
- Mutebi, F.; Krücken, J.; Feldmeier, H.; Waiswa, C.; Mencke, N.; Sentongo, E.; von Samson-Himmelstjerna, G. Animal reservoirs of zoonotic tungiasis in endemic rural villages of Uganda. PLoS Negl. Trop. Dis. 2015, 9, e0004126. [Google Scholar] [CrossRef] [PubMed]
- Ruttoh, S.K.; Ochieng’ Omondi, D.; Wanyama, N.I. Tunga penetrans A Silent Setback to Development in Kenya. J. Environ. Sci. Eng. B 2012, 1, 1. [Google Scholar]
- Anderson, C.; Lee, D.; Dean, N. Identifying clusters in Bayesian disease mapping. Biostatistics 2014, 15, 457–469. [Google Scholar] [CrossRef] [PubMed] [Green Version]
- Kafadar, K. Simultaneous smoothing and adjusting mortality rates in US counties: Melanoma in white females and white males. Stat. Med. 1999, 18, 3167–3188. [Google Scholar] [CrossRef]
- Feldmeier, H.; Heukelbach, J.; Ugbomoiko, U.S.; Sentongo, E.; Mbabazi, P.; von Samson-Himmelstjerna, G.; Krantz, I. Tungiasis—A neglected disease with many challenges for global public health. PLoS Negl. Trop. Dis. 2014, 8, e3133. [Google Scholar] [CrossRef] [Green Version]
- Ugbomoiko, U.S.; Ofoezie, I.E.; Heukelbach, J. Tungiasis: High prevalence, parasite load, and morbidity in a rural community in Lagos State, Nigeria. Int. J. Dermatol. 2007, 46, 475–481. [Google Scholar] [CrossRef]
- Escobar, L.E.; Craft, M.E. Advances and limitations of disease biogeography using ecological niche modeling. Front. Microbiol. 2016, 7, 1174. [Google Scholar] [CrossRef] [Green Version]
- Samy, A.M.; van de Sande, W.W.; Fahal, A.H.; Peterson, A.T. Mapping the potential risk of mycetoma infection in Sudan and South Sudan using ecological niche modeling. PLoS Negl. Trop. Dis. 2014, 8, e3250. [Google Scholar] [CrossRef] [Green Version]
- Pigott, D.M.; Golding, N.; Mylne, A.; Huang, Z.; Henry, A.J.; Weiss, D.J.; Brady, O.J.; Kraemer, M.U.; Smith, D.L.; Moyes, C.L.; et al. Mapping the zoonotic niche of Ebola virus disease in Africa. Elife 2014, 3, e04395. [Google Scholar] [CrossRef] [Green Version]
- Carlson, C.J.; Kracalik, I.T.; Ross, N.; Alexander, K.A.; Hugh-Jones, M.E.; Fegan, M.; Elkin, B.T.; Epp, T.; Shury, T.K.; Zhang, W.; et al. The global distribution of Bacillus anthracis and associated anthrax risk to humans, livestock and wildlife. Nat. Microbiol. 2019, 4, 1337–1343. [Google Scholar] [CrossRef] [Green Version]
- Deka, M.A.; Morshed, N. Mapping disease transmission risk of Nipah virus in South and Southeast Asia. Trop. Med. Infect. Dis. 2018, 3, 57. [Google Scholar] [CrossRef] [PubMed] [Green Version]
- Han, B.A.; Kramer, A.M.; Drake, J.M. Global patterns of zoonotic disease in mammals. Trends Parasitol. 2016, 32, 565–577. [Google Scholar] [CrossRef] [PubMed]
- Takahashi, S.; Metcalf, C.J.E.; Ferrari, M.J.; Tatem, A.J.; Lessler, J. The geography of measles vaccination in the African Great Lakes region. Nat. Commun. 2017, 8, 15585. [Google Scholar] [CrossRef] [PubMed]
- Gething, P.W.; Patil, A.P.; Smith, D.L.; Guerra, C.A.; Elyazar, I.R.; Johnston, G.L.; Tatem, A.J.; Hay, S.I. A new world malaria map: Plasmodium falciparum endemicity in 2010. Malar. J. 2011, 10, 378. [Google Scholar] [CrossRef] [PubMed] [Green Version]
- Reiner, R.C., Jr.; Graetz, N.; Casey, D.C.; Troeger, C.; Garcia, G.M.; Mosser, J.F.; Deshpande, A.; Swartz, S.J.; Ray, S.E.; Blacker, B.F.; et al. Variation in childhood diarrheal morbidity and mortality in Africa, 2000–2015. N. Engl. J. Med. 2018, 379, 1128–1138. [Google Scholar] [CrossRef]
- Osgood-Zimmerman, A.; Millear, A.I.; Stubbs, R.W.; Shields, C.; Pickering, B.V.; Earl, L.; Graetz, N.; Kinyoki, D.K.; Ray, S.E.; Bhatt, S.; et al. Mapping child growth failure in Africa between 2000 and 2015. Nature 2018, 555, 41–47. [Google Scholar] [CrossRef] [Green Version]
- Moran, A.E.; Oliver, J.T.; Mirzaie, M.; Forouzanfar, M.H.; Chilov, M.; Anderson, L.; Morrison, J.L.; Khan, A.; Zhang, N.; Haynes, N.; et al. Assessing the global burden of ischemic heart disease: Part 1: Methods for a systematic review of the global epidemiology of ischemic heart disease in 1990 and 2010. Glob. Heart 2012, 7, 315–329. [Google Scholar] [CrossRef] [Green Version]
- GBIF. GBIF Occurrence Download. Available online: https://doi.org/10.15468/dl.xcpprz (accessed on 13 May 2020).
- Ames, C.G. Gazetteers of the Northern Provinces of Nigeria: The Highland Chieftaincies (Plateau Province); Cambridge University Press: Cambridge, UK, 1934; Volume 4. [Google Scholar]
- Partridge, C. Cross River Natives: Being Some Notes on the Primitive Pagans of Obubura Hill District, Southern Nigeria, Including a Description of the Circles of Upright Sculptured Stones on the Left Bank of the Aweyong River; Forgotten Books: London, UK, 1905. [Google Scholar]
- Bindloss, H. In the Niger Country; W. Blackwood and Sons: Edinburgh, London, UK, 1898. [Google Scholar]
- Ramaswamy, V. Assessment of socioeconomic status and the prevalence of Tungiasis in Jimma and Wolaita Sodo, Ethiopia. Int. J. Intgr. Med. Sci. 2016, 3, 211–215. [Google Scholar]
- Tadele, H. Clinical profile and outcome of pediatrics tetanus: The experience of a tertiary hospital in Ethiopia. Ethiop. J. Health Sci. 2017, 27, 559–564. [Google Scholar] [CrossRef]
- Walker, S.L.; Lebas, E.; De Sario, V.; Deyasso, Z.; Doni, S.N.; Marks, M.; Roberts, C.H.; Lambert, S.M. The prevalence and association with health-related quality of life of tungiasis and scabies in schoolchildren in southern Ethiopia. PLoS Negl. Trop. Dis. 2017, 11, e0005808. [Google Scholar] [CrossRef]
- Chelimo, J.J. Risk Factors Associated with Jigger Infestation in Kitany Location, Keiyo Marakwet County, Kenya. Master’s Thesis, Moi University, Kesses, Kenya, 2015. [Google Scholar]
- Mørkve, Å. "Getting Rid of the Plague": Jiggers Removal Program in Bungoma, Kenya. Community and Health Workers Perspectives on Tungiasis in a High Prevalence Area; The University of Bergen: Bergen, Norway, 2013. [Google Scholar]
- Wafula, S.T.; Ssemugabo, C.; Namuhani, N.; Musoke, D.; Ssempebwa, J.; Halage, A.A. Prevalence and risk factors associated with tungiasis in Mayuge district, Eastern Uganda. Pan Afr. Med. J. 2016, 24, 24. [Google Scholar] [CrossRef]
- Nyangacha, R.M.; Odongo, D.; Oyieke, F.; Bii, C.; Muniu, E.; Chasia, S.; Ochwoto, M. Spatial distribution, prevalence and potential risk factors of Tungiasis in Vihiga County, Kenya. PLoS Negl. Trop. Dis. 2019, 13, e0007244. [Google Scholar] [CrossRef] [Green Version]
- Zabron, W. Tungiasis Risk Factors in Rural Community in Murang’ a County. Master’s Thesis, Kenyatta University, Nairobi, Kenya, 2017. [Google Scholar]
- Mwai, J.; Mutai, J.; Karanja, S.; Karani, G. Factors Influencing Practices Towards Water, Sanitation and Hygiene with Occurrence of Tungiasis Among Pupils in Schools with a Feeding Programme in Ganze Sub County, Kenya. Glob. J. Health Sci. 2018, 3, 1–23. [Google Scholar]
- Mazigo, H.D.; Behamana, E.; Zinga, M.; Heukelbach, J. Tungiasis infestation in Tanzania. J. Infect. Dev. Ctries. 2010, 4, 187–189. [Google Scholar] [CrossRef] [Green Version]
- Mwakanyamale, J.G.; Towett, R.K.; Mtango, F.; Bundala, J.; Kisanga, F. Contributions of socioeconomic and cultural factors in Tungiasis at Kwakombo village in Korogwe district, Tanzania. Imtu. Med. J. 2015, 6, 54–61. [Google Scholar]
- Jeffreys, M. Pulex penetrans: The jigger’s arrival and spread in Africa. S. Afr. J. Sci. 1952, 48, 249–255. [Google Scholar]
- Ugbomoiko, U.S.; Ariza, L.; Ofoezie, I.E.; Heukelbach, J. Risk factors for tungiasis in Nigeria: Identification of targets for effective intervention. PLoS Negl. Trop. Dis. 2007, 1, e87. [Google Scholar] [CrossRef] [Green Version]
- Ugbomoiko, U.S.; Ariza, L.; Heukelbach, J. Parasites of importance for human health in Nigerian dogs: High prevalence and limited knowledge of pet owners. BMC Vet. Res. 2008, 4, 49. [Google Scholar] [CrossRef] [Green Version]
- Mulambya, N.L.; Sakubita, P.; Hamoonga, R.; Mulubwa, B.; Namafente, O.; Mutengo, M.; Yard, E. Tungiasis Outbreak Investigation In Masaiti District, Zambia. Health Press Zamb. Bull 2018, 2, 8–16. [Google Scholar]
- Nájera Villagrana, S.M.; García Naranjo Santisteban, A. Tungiasis: A highly neglected disease among neglected diseases. Case series from Nduta refugee camp (Tanzania). Oxf. Med. Case Rep. 2019, 2019, 49. [Google Scholar] [CrossRef] [Green Version]
- Thielecke, M.; Raharimanga, V.; Rogier, C.; Stauss-Grabo, M.; Richard, V.; Feldmeier, H. Prevention of tungiasis and tungiasis-associated morbidity using the plant-based repellent Zanzarin: A randomized, controlled field study in rural Madagascar. PLoS Negl. Trop. Dis. 2013, 7, e2426. [Google Scholar] [CrossRef] [Green Version]
- Richardson, D.J.; Mangili, A.M. Infection with the Sand Flea Tunga penetrans (Tungiasis) in a Traveller Returning from Cameroon, Africa. JAAS 2016, 70, 199. [Google Scholar]
- Bourée, P.; Simeni Njonnou, R.; Takougang, I.; Kaptue, L. Tungiasis in Bangou (West Cameroon). Med Sante Trop. 2012, 22, 440–443. [Google Scholar] [CrossRef]
- Arene, F.O.I. The prevalence of sand flea (Tunga penetrans) among primary and post-primary school pupils in Choba area of the Niger Delta. Public Health 1984, 98, 282–283. [Google Scholar] [CrossRef]
- Collins, G.; McLeod, T.; Njilah Issac, K.; Lamnyam, C.; Ngarka, L.; Leo Njamnshi, N. Tungiasis: A eglected Health Problem in Rural Cameroon. Int. J. Collab. Res. Intern. Med. Public Health 2009, 1, 2–10. [Google Scholar]
- Bentley, W.H. Pioneering on the Congo; Religious tract society: London, UK, 1900; Volume 1. [Google Scholar]
- Monteiro, J.J. Angola and the River Congo; Macmillan and Company: London, UK, 1876. [Google Scholar]
- Ukonu, B.A.; Eze, E.U. Pattern of Skin Diseases at University of Benin Teaching Hospital, Benin City, Edo State, South-South Nigeria: A 12 Month Prospective Study. Glob. J. Health Sci. 2012, 4, 148–157. [Google Scholar] [CrossRef] [PubMed] [Green Version]
- Stanley, H.M. Through the Dark Continent: Or, the Sources of the Nile, Around the Great Lakes of Equatorial Africa, and Down the Livingstone River to the Atlantic Ocean; Sampson, Low: London, UK, 1889. [Google Scholar]
- Thielecke, M.; Raharimanga, V.; Stauss-Grabo, M.; Rogier, C.; Richard, V.; Feldmeier, H. Regression of severe tungiasis-associated morbidity after prevention of re-infestation: A case series from rural Madagascar. Am. J. Trop. Med. Hyg. 2013, 89, 932–936. [Google Scholar] [CrossRef] [Green Version]
- Hesse, P. Die Ausbreitung des Sandflohs in Afrika. Ein tiergeographischer Versuch. Geogr. Z. 1899, 5, 522–530. [Google Scholar]
- Heukelbach, J.; Ugbomoiko, U.S. Tungiasis in the past and present: A dire need for intervention. Niger. J. Parasitol. 2007, 28, 1–5. [Google Scholar] [CrossRef]
- Dias, J.R. Famine and disease in the history of Angola c. 1830–1930. J. Afr. Hist. 1981, 22, 349–378. [Google Scholar] [CrossRef]
- Barbot, J. A description of the Coasts of Guinea in Churchill’s A Collection of Voyages and Travels; British Library: London, UK, 1732. [Google Scholar]
- Hutton, W. A Voyage to Africa: Including a Narrative of an Embassy to One of the Interior Kingdoms, in the Year 1820, with Remarks on the Course and Termination of the Niger, and Other Principal Rivers in that Country; Longman, Hurst, Rees, Orme, and Brown: London, UK, 1821. [Google Scholar]
- comte de Mollien, G.T. Travels in the Interior of Africa, to the Sources of the Senegal and Gambia: Performed by Command of the French Government, in the Year 1818; Henry Colburn & Company: London, UK, 1820. [Google Scholar]
- Johnston, H. Liberia; Hutchinson & Company: London, UK, 1906; Volume 1. [Google Scholar]
- Johnston, H. The River Congo, from Its Mouth to Bolobo: A General Description of the Natural History and Anthropology of Its Western Basin; Sampson Low, Marston & Company: London, UK, 1895. [Google Scholar]
- Crawford, D. Thinking Black: 22 Years without a Break in the Long Grass of Central Africa; Morgan and Scott: London, UK, 1912. [Google Scholar]
- Decle, L. Three Years in Savage Africa; Methuen & Company: London, UK, 1898. [Google Scholar]
- Spencer, H.A. Chigger Flea or" Chigoe" in the Transvaal. TMJ 1912, 8, 833. [Google Scholar]
- Mockler-Ferryman, A.F. British West Africa: Its Rise and Progress; Swan Sonnenshein: Oxford, UK, 1900. [Google Scholar]
- Mwangi, M.M. Factors Influencing Participation of Stakeholders in Eradication of Jiggers: A case of Kandara sub County. Master’s Thesis, University of Nairobi, Muranga County, Kenya, 2015. [Google Scholar]
- Pampiglione, S.; Trentini, M.; Gentili, F.M.; Mendes, J.; Pampiglione, C.; Rivasi, F. Tunga penetrans (Insecta: Siphonaptera) in pigs in Sao Tomé (Equatorial Africa): Epidemiological, clinical, morphological and histopathological aspects. Rev. Elev. Med. Vet. Pays Trop. 1998, 51, 201–205. [Google Scholar]
- Gibbons, A.S.H. Africa from South to North through Marotseland; Lane, J., Ed.; Oxford University Press: Oxford, UK, 1904; Volume 2. [Google Scholar]
- Girma, M.; Astatkie, A.; Asnake, S. Prevalence and risk factors of tungiasis among children of Wensho district, southern Ethiopia. BMC Infect. Dis. 2018, 18, 456. [Google Scholar] [CrossRef] [PubMed] [Green Version]
- Gadisa, E.; Jote, K. Prevalence and factors associated with intestinal parasitic infection among under-five children in and around Haro Dumal Town, Bale Zone, Ethiopia. BMCP 2019, 385, 1–8. [Google Scholar] [CrossRef]
- Reiss, F. Tungiasis in New York City. Arch. Dermatol. 1966, 93, 404–407. [Google Scholar] [CrossRef]
- Dassoni, F.; Polloni, I.; Margwe, S.B.; Veraldi, S. Tungiasis in northern Tanzania: A clinical report from Qameyu village, Babati District, Manyara Region. J. Infect. Dev. Ctries. 2014, 8, 1456–1460. [Google Scholar] [CrossRef] [Green Version]
- Karuga, J. Factors contributing to prevalence of jigger infestation among community members of Mugumoini sublocation. Ph.D. Thesis, Kenya Medical Training College, Gatanga District, Kenya, 2013. [Google Scholar]
- Mazigo, H.D.; Bahemana, E.; Dyegura, O.; Mnyone, L.L.; Kweka, E.J.; Zinga, M.; Konje, E.T.; Waihenya, R.; Heukelbach, J. Severe tungiasis in Western Tanzania: Case series. J. Public Health Afr. 2011, 2, 21. [Google Scholar] [CrossRef] [Green Version]
- Okoth, A.A. Morbidity, Risk Factors, and flea species responsible for Tungiasis in selected villages in Kisumu County. Master’s Thesis, University of Nairobi, Nairobi, Kenya, 2015. [Google Scholar]
- Proctor, E.M. Tunga penetrans Acquired while Traveling in Africa. Can. J. Infect. Dis. 1970, 5, 82–83. [Google Scholar] [CrossRef] [Green Version]
- Alfred, K. Factors Associated with Jigger Infestation in Kituro, Baringo Central District. A Rapid Appraisal Report, Kisumo, Kenya, 2009. [Google Scholar]
- Waruguru, C.; Mwaniki, P.; Karama, M.; Muthami, L. Prevalence of tungiasis and its associated factors among residents of Kipkelion west sub-county; Kericho county, Kenya. Int. J. Health Sci. Res. 2015, 5, 434–445. [Google Scholar]
- Weise, S.; Feldmeier, H.; Larson, L.; Mambo, B. Household-related risk factors of tungiasis and severe disease in Kilifi County, Kenya. TMIH 2015, 20, 114–115. [Google Scholar]
- Lugard, L. A Tropical Dependency; J. Nisbet & Co. Limited: London, UK, 1905. [Google Scholar]
- Wiener, L. Africa and the Discovery of America; Innes & Sons: Brooklyn, NY, USA, 1922; Volume 3. [Google Scholar]
- Hooton, E.A. Apes, Men, and Morons; GP Putnam’s Sons: New York, NY, USA, 1937. [Google Scholar]
- ESRI. ArcGIS Desktop: Release 10.7.1; Environmental Systems Research Institute: Redlands, CA, USA, 2019. [Google Scholar]
- Title, P.O.; Bemmels, J.B. ENVIREM: An expanded set of bioclimatic and topographic variables increases flexibility and improves performance of ecological niche modeling. Ecography 2018, 41, 291–307. [Google Scholar] [CrossRef] [Green Version]
- Linardi, P.; Calheiros, C.; Campelo-Junior, E.; Duarte, E.; Heukelbach, J.; Feldmeier, H. Occurrence of the off-host life stages of Tunga penetrans (Siphonaptera) in various environments in Brazil. Ann. Trop. Med. Parasitol. 2010, 104, 337–345. [Google Scholar] [CrossRef]
- Dent, D. International Soil Reference and Information Centre (ISRIC). In Encyclopedia of Soil Science; Springer, Dordrecht: Berlin, Germany, 2017; pp. 1232–1236. [Google Scholar]
- Winter, B.; Oliveira, F.A.; Wilcke, T.; Heukelbach, J.; Feldmeier, H. Tungiasis-related knowledge and treatment practices in two endemic communities in northeast Brazil. J. Infect. Dev. Ctries. 2009, 3, 458–466. [Google Scholar] [CrossRef]
- Huete, A.; Didan, K.; Miura, T.; Rodriguez, E.P.; Gao, X.; Ferreira, L.G. Overview of the radiometric and biophysical performance of the MODIS vegetation indices. Remote Sens. Environ. 2002, 83, 195–213. [Google Scholar] [CrossRef]
- Hay, S.; Tatem, A.; Graham, A.; Goetz, S.; Rogers, D. Global environmental data for mapping infectious disease distribution. Adv. Parasitol. 2006, 62, 37–77. [Google Scholar]
- Bavia, M.E.; Malone, J.; Hale, L.; Dantas, A.; Marroni, L.; Reis, R. Use of thermal and vegetation index data from earth observing satellites to evaluate the risk of schistosomiasis in Bahia, Brazil. Acta Trop. 2001, 79, 79–85. [Google Scholar] [CrossRef] [Green Version]
- Danson, F.; Armitage, R.; Marston, C. Spatial and temporal modelling for parasite transmission studies and risk assessment. Parasite 2008, 15, 463–468. [Google Scholar] [CrossRef] [Green Version]
- Pilger, D.; Schwalfenberg, S.; Heukelbach, J.; Witt, L.; Mencke, N.; Khakban, A.; Feldmeier, H. Controlling tungiasis in an impoverished community: An intervention study. PLoS Negl. Trop. Dis. 2008, 2, e324. [Google Scholar] [CrossRef] [Green Version]
- Mutebi, F.; Krücken, J.; Feldmeier, H.; Waiswa, C.; Mencke, N.; von Samson-Himmelstjerna, G. Tungiasis-associated morbidity in pigs and dogs in endemic villages of Uganda. Parasit. Vectors 2016, 9, 44. [Google Scholar] [CrossRef] [Green Version]
- Feitelson, E.; Chenoweth, J. Water poverty: Towards a meaningful indicator. Water Policy 2002, 4, 263–281. [Google Scholar] [CrossRef]
- Manandhar, S.; Pandey, V.P.; Kazama, F. Application of water poverty index (WPI) in Nepalese context: A case study of Kali Gandaki River Basin (KGRB). Water Resour. Manag. 2012, 26, 89–107. [Google Scholar] [CrossRef]
- Koirala, S.; Fang, Y.; Dahal, N.M.; Zhang, C.; Pandey, B.; Shrestha, S. Application of Water Poverty Index (WPI) in Spatial Analysis of Water Stress in Koshi River Basin, Nepal. Sustainability 2020, 12, 727. [Google Scholar] [CrossRef] [Green Version]
- Pruss-Ustun, A. World Health Organization Safer Water, Better Health: Costs, Benefits and Sustainability of Interventions to Protect and Promote Health; World Health Organization: Geneva, Switzerland, 2008; ISBN 92-4-159643-0. [Google Scholar]
- Samy, A.M.; Alkishe, A.A.; Thomas, S.M.; Wang, L.; Zhang, W. Mapping the potential distributions of etiological agent, vectors, and reservoirs of Japanese Encephalitis in Asia and Australia. Acta Trop. 2018, 188, 108–117. [Google Scholar] [CrossRef] [PubMed]
- Okely, M.; Anan, R.; Gad-Allah, S.; Samy, A.M. Mapping the environmental suitability of etiological agent and tick vectors of Crimean-Congo hemorrhagic fever. Acta Trop. 2020, 203, 105319. [Google Scholar] [CrossRef]
- Qiao, H.; Peterson, A.T.; Campbell, L.P.; Soberón, J.; Ji, L.; Escobar, L.E. NicheA: Creating virtual species and ecological niches in multivariate environmental scenarios. Ecography 2016, 39, 805–813. [Google Scholar] [CrossRef] [Green Version]
- Johnson, E.E.; Escobar, L.E.; Zambrana-Torrelio, C. An ecological framework for modeling the geography of disease transmission. Trends Ecol. Evol. 2019, 34, 655–668. [Google Scholar] [CrossRef] [Green Version]
- Elith, J.; Graham, C.H.; Anderson, R.P.; Dudík, M.; Ferrier, S.; Guisan, A.; Hijmans, R.J.; Huettmann, F.; Leathwick, J.R.; Lehmann, A.; et al. Novel methods improve prediction of species’ distributions from occurrence data. Ecography 2006, 29, 129–151. [Google Scholar] [CrossRef] [Green Version]
- Eberhard, F.E.; Cunze, S.; Kochmann, J.; Klimpel, S. Modelling the climatic suitability of Chagas disease vectors on a global scale. Elife 2020, 9, e52072. [Google Scholar] [CrossRef]
- Guisan, A.; Edwards, T.C., Jr.; Hastie, T. Generalized linear and generalized additive models in studies of species distributions: Setting the scene. Ecol. Model. 2002, 157, 89–100. [Google Scholar] [CrossRef] [Green Version]
- Elith, J.; Leathwick, J.; Boosted Regression Trees for Ecological Modeling. R Documentation. Available online: https://cran.r-project.org/web/packages/dismo/vignettes/brt.pdf (accessed on 12 June 2011).
- Breiman, L. Bagging predictors. Mach. Learn. 1996, 24, 123–140. [Google Scholar] [CrossRef] [Green Version]
- Phillips, S.J.; Anderson, R.P.; Schapire, R.E. Maximum entropy modeling of species geographic distributions. Ecol. Model. 2006, 190, 231–259. [Google Scholar] [CrossRef] [Green Version]
- Araújo, M.B.; New, M. Ensemble forecasting of species distributions. Trends Ecol. Evol. 2007, 22, 42–47. [Google Scholar] [CrossRef] [PubMed]
- Team, R.C. R: A language and environment for statistical computing. Open J. Stat. 2013, 6, 3. [Google Scholar]
- Thuiller, W.; Georges, D.; Engler, R.; Breiner, F.; Georges, M.D.; Thuiller, C.W. Package’ biomod2.’ Ensemble Platform for Species Distribution Modeling. 2016. Available online: https://cran.r-project.org/web/packages/biomod2/biomod2.pdf (accessed on 20 July 2020).
- Elith, J.; Phillips, S.J.; Hastie, T.; Dudík, M.; Chee, Y.E.; Yates, C.J. A statistical explanation of MaxEnt for ecologists. Divers. Distrib. 2011, 17, 43–57. [Google Scholar] [CrossRef]
- Allouche, O.; Tsoar, A.; Kadmon, R. Assessing the accuracy of species distribution models: Prevalence, kappa and the true skill statistic (TSS). J. Appl. Ecol. 2006, 43, 1223–1232. [Google Scholar] [CrossRef]
- Sim, J.; Wright, C.C. The kappa statistic in reliability studies: Use, interpretation, and sample size requirements. Phys. Ther. 2005, 85, 257–268. [Google Scholar] [CrossRef] [Green Version]
- Barbet-Massin, M.; Jiguet, F.; Albert, C.H.; Thuiller, W. Selecting pseudo-absences for species distribution models: How, where and how many? Methods Ecol. Evol. 2012, 3, 327–338. [Google Scholar] [CrossRef]
- Gama, M.; Crespo, D.; Dolbeth, M.; Anastácio, P. Predicting global habitat suitability for Corbicula fluminea using species distribution models: The importance of different environmental datasets. Ecol. Model. 2016, 319, 163–169. [Google Scholar] [CrossRef] [Green Version]
- Alkire, S.; Roche, J.M.; Santos, M.E.; Seth, S. Multidimensional Poverty Index 2011: Brief Methodological Note; Oxford Poverty & Human Development Initiative: Oxford, UK, 2011. [Google Scholar]
- Balk, D.L.; Deichmann, U.; Yetman, G.; Pozzi, F.; Hay, S.I.; Nelson, A. Determining global population distribution: Methods, applications and data. Adv. Parasitol. 2006, 62, 119–156. [Google Scholar]
- Köppen, W. Die Wärmezonen der Erde, nach der Dauer der heissen, gemässigten und kalten Zeit und nach der Wirkung der Wärme auf die organische Welt betrachtet. Meteorol. Z. 1884, 1, 5–226. [Google Scholar]
- World Health Organization. Working to Overcome the Global Impact of Neglected Tropical Diseases: First WHO Report on Neglected Tropical Diseases; World Health Organization: Geneva, Switzerland, 2010; ISBN 92-4-156409-1.
- Engels, D.; Zhou, X.-N. Neglected tropical diseases: An effective global response to local poverty-related disease priorities. Infect. Dis. Poverty 2020, 9, 1–9. [Google Scholar] [CrossRef] [PubMed] [Green Version]
- Rood, E.J.; Goris, M.G.; Pijnacker, R.; Bakker, M.I.; Hartskeerl, R.A. Environmental risk of leptospirosis infections in the Netherlands: Spatial modelling of environmental risk factors of leptospirosis in the Netherlands. PLoS ONE 2017, 12, e0186987. [Google Scholar] [CrossRef]
- Hotez, P.J. Forgotten People, Forgotten Diseases: The Neglected Tropical Diseases and Their Impact on Global Health and Development; John Wiley & Sons: Hoboken, NJ, USA, 2013; ISBN 1-68367-348-4. [Google Scholar]
- Amzat, J.; Razum, O. Towards a Sociology of Health Discourse in Africa; Springer: Berlin, Germany, 2017; ISBN 3-319-61672-2. [Google Scholar]
- Riedel, N.; Vounatsou, P.; Miller, J.M.; Gosoniu, L.; Chizema-Kawesha, E.; Mukonka, V.; Steketee, R.W. Geographical patterns and predictors of malaria risk in Zambia: Bayesian geostatistical modelling of the 2006 Zambia national malaria indicator survey (ZMIS). Malar. J. 2010, 9, 37. [Google Scholar] [CrossRef] [PubMed] [Green Version]
- Schur, N.; Hürlimanftn, E.; Garba, A.; Traoré, M.S.; Ndir, O.; Ratard, R.C.; Tchuenté, L.-A.T.; Kristensen, T.K.; Utzinger, J.; Vounatsou, P. Geostatistical model-based estimates of schistosomiasis prevalence among individuals aged≤ 20 years in West Africa. PLoS Negl. Trop. Dis. 2011, 5, e1194. [Google Scholar] [CrossRef] [PubMed] [Green Version]
- Brooker, S.; Beasley, M.; Ndinaromtan, M.; Madjiouroum, E.M.; Baboguel, M.; Djenguinabe, E.; Hay, S.I.; Bundy, D.A. Use of remote sensing and a geographical information system in a national helminth control programme in Chad. Bull. World Health Organ. 2002, 80, 783–789. [Google Scholar] [PubMed]
- Khoury, M.J.; Iademarco, M.F.; Riley, W.T. Precision public health for the era of precision medicine. Am. J. Prev. Med. 2016, 50, 398. [Google Scholar] [CrossRef] [Green Version]
- Collins, F.S.; Varmus, H. A new initiative on precision medicine. N. Engl. J. Med. 2015, 372, 793–795. [Google Scholar] [CrossRef] [Green Version]
- Feldmeier, H. Personal Observation; Charité University Medicine: Berlin, Germany, 2015. [Google Scholar]
Figure 1.
Severe tungiasis in the feet of a 10-year-old girl. Adapted from Barbosa and Barbosa [9]. License Number: 4832790723180.
Figure 1.
Severe tungiasis in the feet of a 10-year-old girl. Adapted from Barbosa and Barbosa [9]. License Number: 4832790723180.

Figure 2.
Model calibration region and study area defined by the WHO Global Burden of Disease Regions (GBD). Green dots correspond to occurrence locations (n = 86). The accepted historic arrival in Africa of Tunga penetrans in Ambriz, Angola (1872), and the probable presence at Oualata (1324) are highlighted.

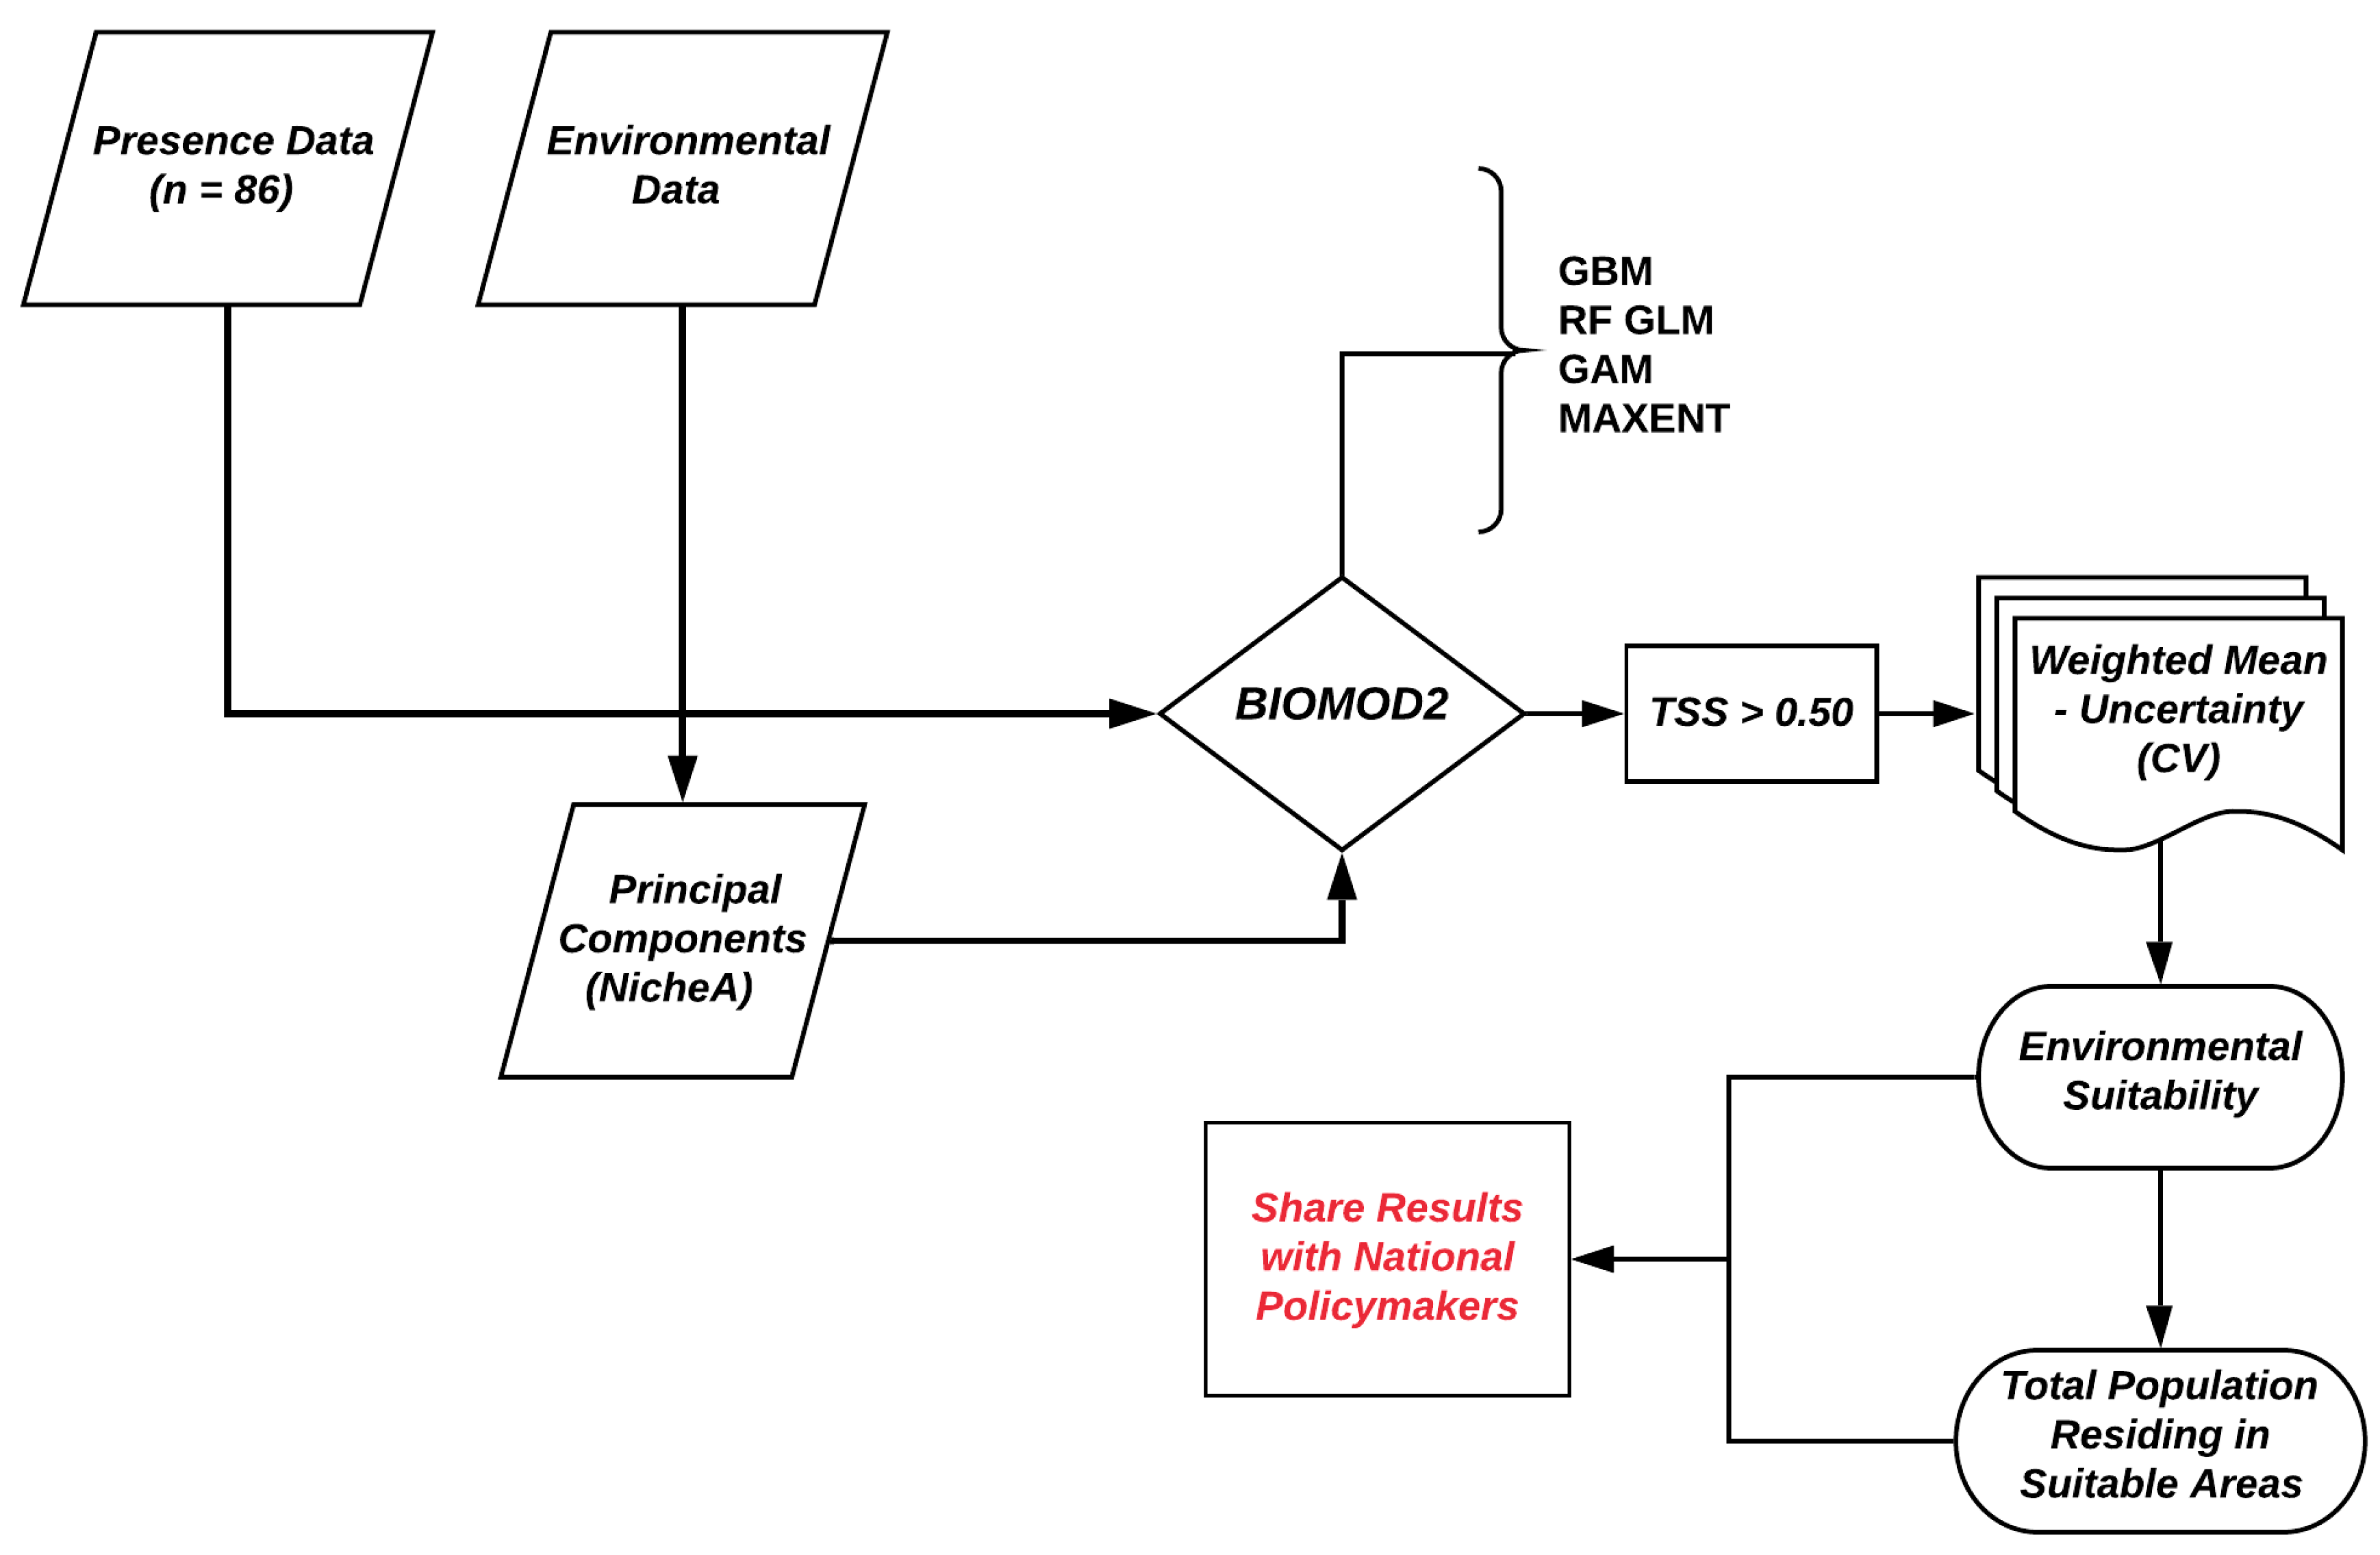
Figure 3.
Workflow for tungiasis environmental suitability mapping.

Figure 4.
(A) Predicted distribution across sub-Saharan Africa (SSA). Probability of occurrence is provided on a scale from 0 (low probability) to 1 (high probability). Green dots correspond to occurrence locations (n = 86). (B) Status of occurrence reporting by country in SSA based on the weighted mean suitability model. Insets correspond to São Tomé and Príncipe and Comoros.

Figure 5.
Variable contributions (top) and predictive algorithm performances (bottom). A. PC: principal component contribution. B. ROC: receiver operating characteristic, KAPPA: Cohen’s Kappa, and TSS: true skill statistic.
Figure 5.
Variable contributions (top) and predictive algorithm performances (bottom). A. PC: principal component contribution. B. ROC: receiver operating characteristic, KAPPA: Cohen’s Kappa, and TSS: true skill statistic.

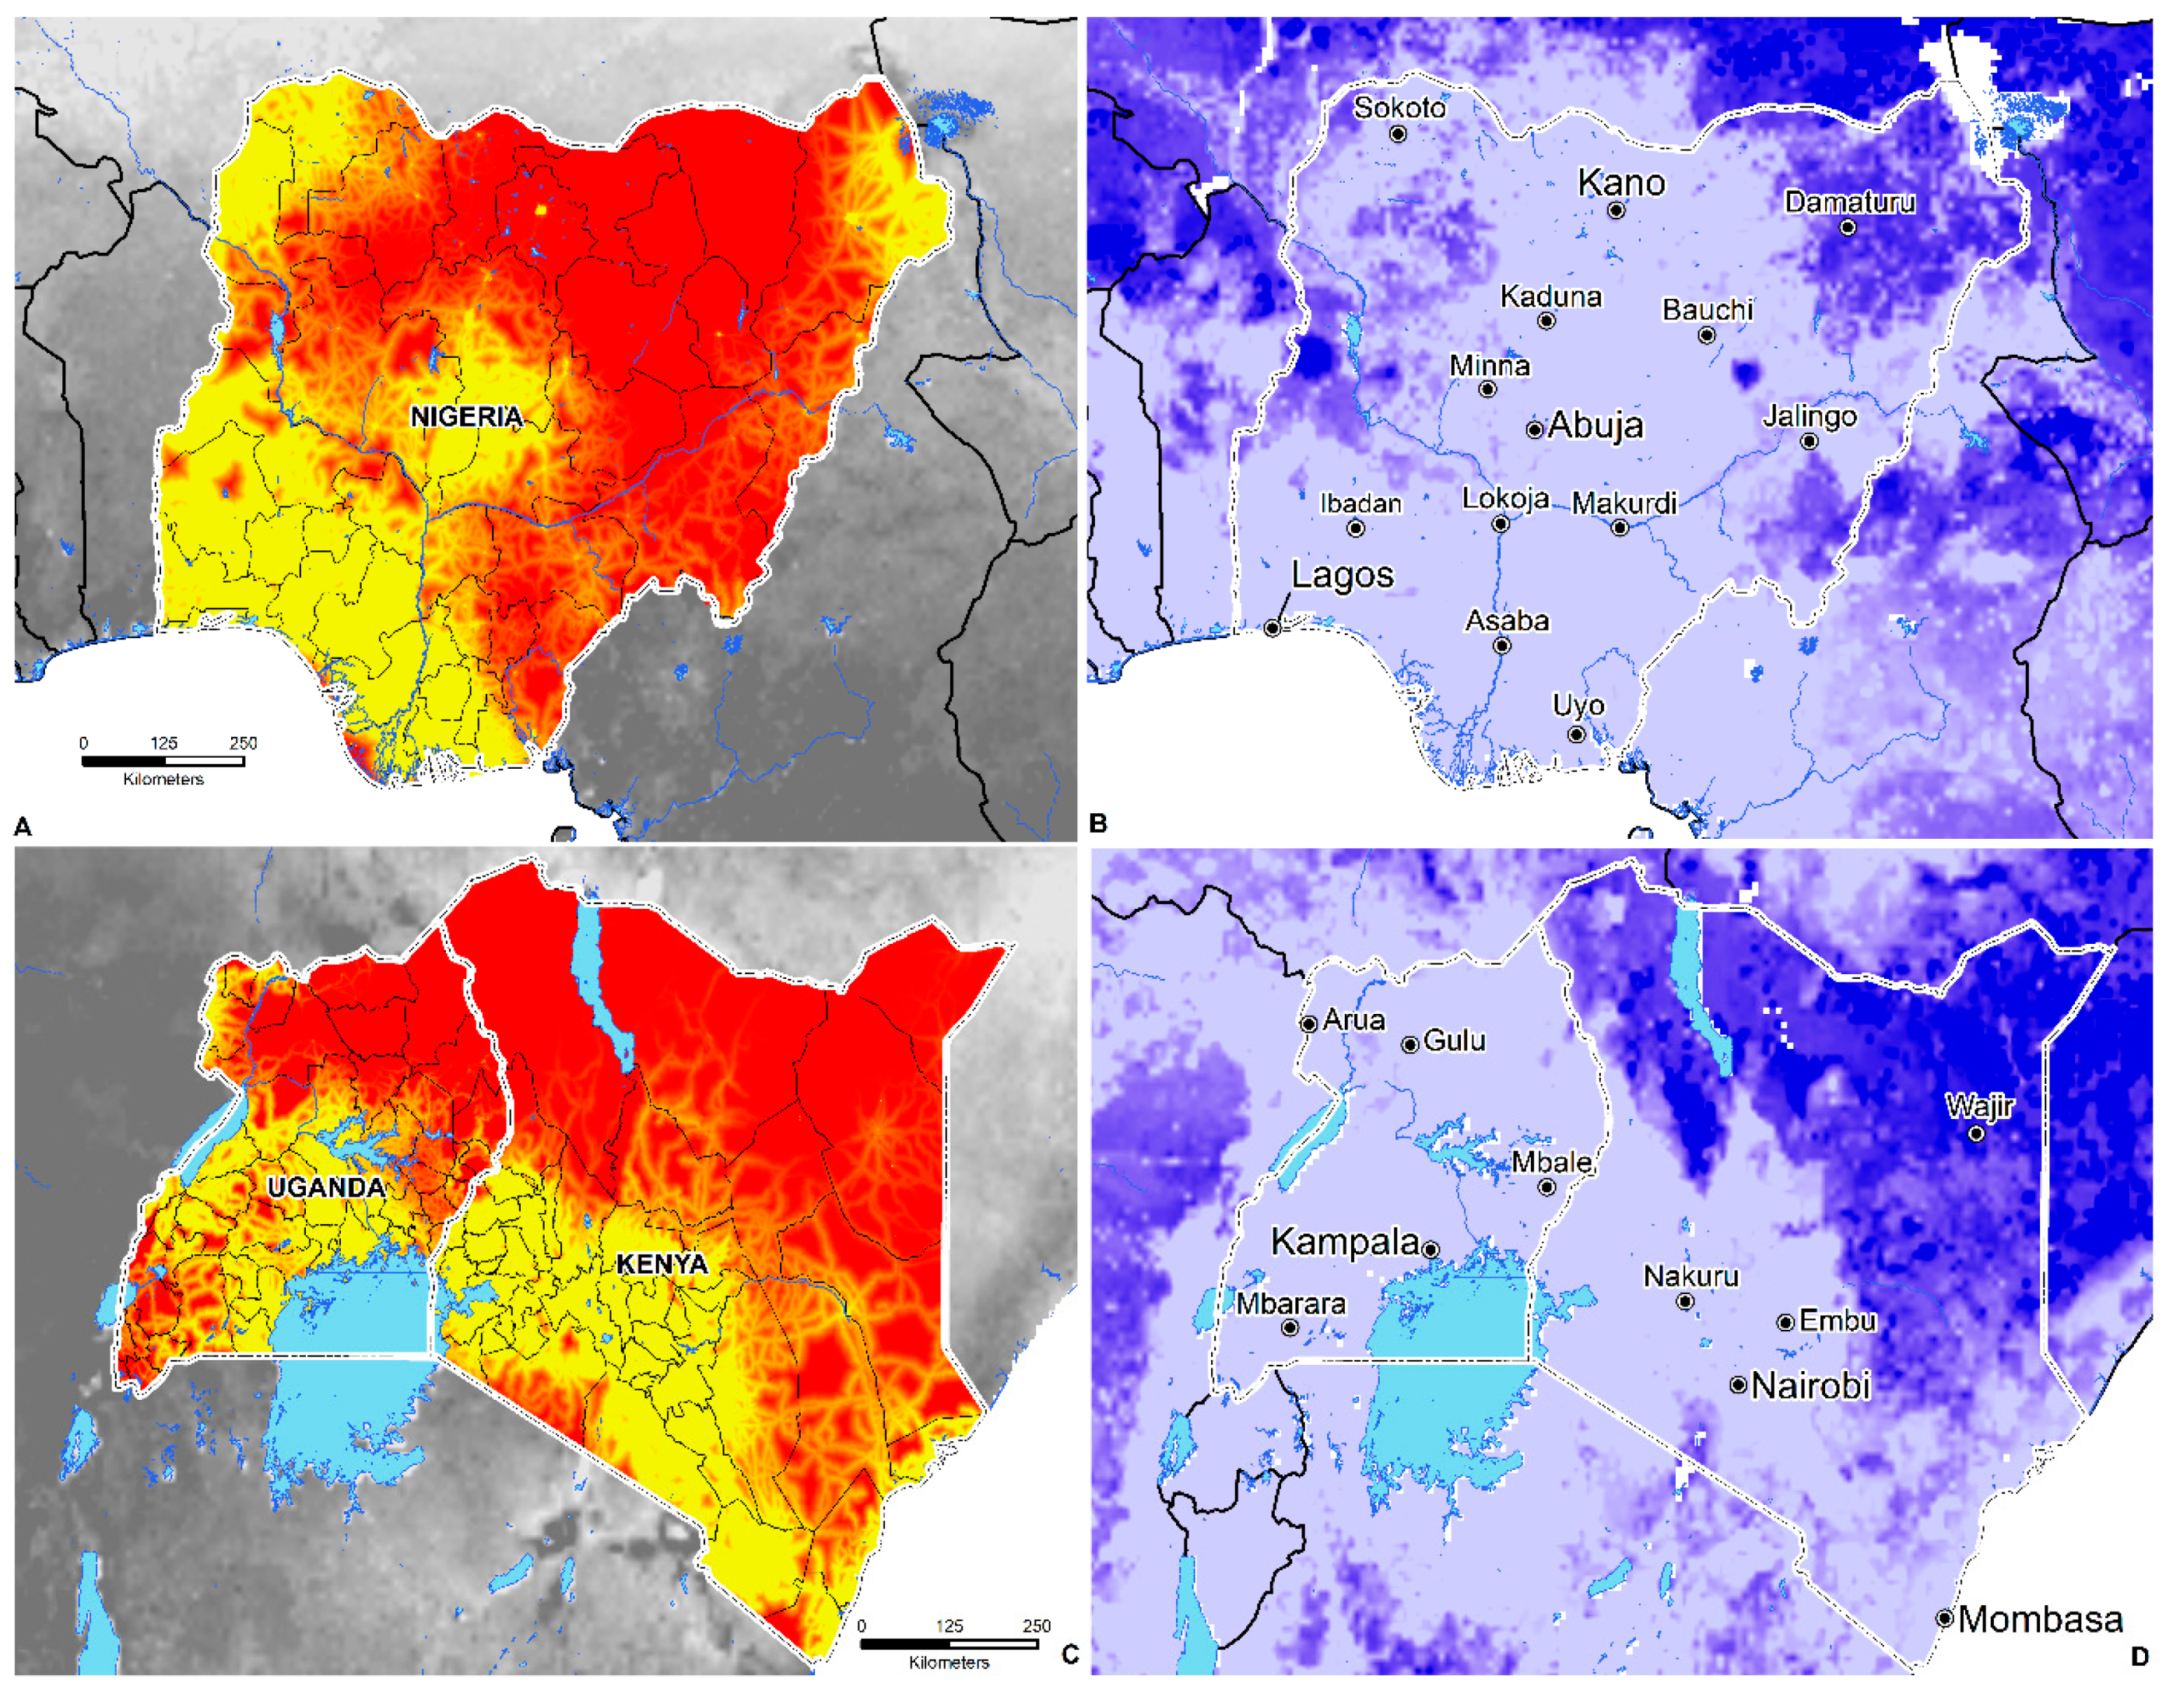
Figure 6.
(A,C) The proportion of people living on $1.25 a day in Nigeria, Uganda, and Kenya. Red corresponds to a higher proportion of the population living on $1.25 a day; yellow represents a lower proportion of the population living on $1.25 a day. (B,D) The coefficient of variation (CV) or measure of model uncertainty. Lighter colors = less uncertainty; darker colors = increased uncertainty.

Figure 7.
(A) The proportion of people living on $1.25 a day in Tanzania and Malawi. Red corresponds to a higher proportion of the population living on $1.25 a day; yellow represents a lower proportion of the population living on $1.25 a day. (B) The coefficient of variation (CV) or measure of model uncertainty. Lighter colors = less uncertainty; darker colors = increased uncertainty.


Table 1.
Environmental covariates. SSA: sub-Saharan Africa, ENVIREM: ENVIronmental Rasters for Ecological Modeling, ISRIC: International Soil Reference and Information Centre, GLC-Share: Global Landcover Network Share database, FAO: Food and Agricultural Organization of the United Nations, ESRI: Environmental Systems Research Institute, and CIESIN: Center for International Earth Science Information Network.
| Covariates | Spatial Resolution | Data Source | Units | Average |
|---|---|---|---|---|
| Set1 | ||||
| Annual Potential Evapotranspiration (PET) | ~5 km | ENVIREM | mm/year | 1625.14 |
| Thornthwaite Aridity Index | ~5 km | ENVIREM | 55.19 | |
| Climatic Moisture Index | ~5 km | ENVIREM | –0.13 | |
| Continentality | ~5 km | ENVIREM | °C | 3.55 |
| Emberger’s Q | ~5 km | ENVIREM | 352.04 | |
| Growing Degree Days Greater than 0 °C | ~5 km | ENVIREM | 97,927.53 | |
| Growing Degree Days Greater than 5 °C | ~5 km | ENVIREM | 98,456.92 | |
| Max Temp Coldest Month | ~5 km | ENVIREM | °C × 10 | 26.4 |
| Min Temp Warmest Month | ~5 km | ENVIREM | °C × 10 | 18.3 |
| Month Count with Temp Greater than 10 °C | ~5 km | ENVIREM | months | 12 |
| PET Coldest Quarter | ~5 km | ENVIREM | mm/month | 120.57 |
| PET Driest Quarter | ~5 km | ENVIREM | mm/month | 133.28 |
| PET Seasonality | ~5 km | ENVIREM | mm/month | 1428.88 |
| PET Warmest Quarter | ~5 km | ENVIREM | mm/month | 150.87 |
| PET Wettest Quarter | ~5 km | ENVIREM | mm/month | 133.78 |
| Thermicity Index | ~5 km | ENVIREM | °C | 584.62 |
| Set2 | ||||
| Sand (0–5 cm) | ~1 km | ISRIC | g/100 (w%) | 49.13 |
| Silt (0–5 cm) | ~1 km | ISRIC | g/100 (w%) | 18.27 |
| Clay (0–5 cm) | ~1 km | ISRIC | g/100 (w%) | 33.20 |
| Soil pH (0–5 cm) | ~1 km | ISRIC | g/100 (w%) | 5.7 |
| Set 3 | ||||
| Enhanced Vegetation Index (EVI) 16-day composites (2001–2012) | ~1 km | NASA | 0. 36 | |
| Cropland (2013) | ~1 km | GLC-Share | % | 29.76 |
| Herbaceous (2013) | ~1 km | GLC-Share | % | 1.95 |
| Grassland (2013) | ~1 km | GLC-Share | % | 12.66 |
| Shrubland (2013) | ~1 km | GLC-Share | % | 13.3 |
| Tree Covered Area (2013) | ~1 km | GLC-Share | % | 22 |
| Set 4 | ||||
| Goats Density (2014) | ~1 km | FAO | head/km2 | 32.05 |
| Pig Density (2014) | ~1 km | FAO | head/km2 | 8.48 |
| Chicken Density (2014) | ~1 km | FAO | head/km2 | 585.49 |
| Set 5 | ||||
| Distance to Water (2014) | 250 meters | ESRI | km | 64.25 |
| Rural Poverty in SSA (2010) | ~5 km | CIESIN | person/km2 | 65.26 |
Table 2.
The total population living in environmentally suitable areas in SSA (2020). WHO GBD: WHO Global Burden of Disease Regions.
Table 2.
The total population living in environmentally suitable areas in SSA (2020). WHO GBD: WHO Global Burden of Disease Regions.
| WHO GBD Region | Total Population | % of Total | Urban (>1000) | Nonurban (<1000) |
|---|---|---|---|---|
| West | 263,954,435 | 40% | 148,452,658 | 115,475,777 |
| East | 304,529,659 | 46% | 86,753,145 | 217,725,514 |
| Central | 61,693,453 | 9% | 22,428,932 | 39,261,521 |
| South | 37,945,399 | 6% | 17,213,237 | 20,728,162 |
| Total | 668,122,946 | 274,847,972 | 393,190,974 |
© 2020 by the author. Licensee MDPI, Basel, Switzerland. This article is an open access article distributed under the terms and conditions of the Creative Commons Attribution (CC BY) license (http://creativecommons.org/licenses/by/4.0/).
Share and Cite
MDPI and ACS Style
Deka, M.A. Mapping the Geographic Distribution of Tungiasis in Sub-Saharan Africa. Trop. Med. Infect. Dis. 2020, 5, 122. https://doi.org/10.3390/tropicalmed5030122
AMA Style
Deka MA. Mapping the Geographic Distribution of Tungiasis in Sub-Saharan Africa. Tropical Medicine and Infectious Disease. 2020; 5(3):122. https://doi.org/10.3390/tropicalmed5030122
Chicago/Turabian StyleDeka, Mark A. 2020. "Mapping the Geographic Distribution of Tungiasis in Sub-Saharan Africa" Tropical Medicine and Infectious Disease 5, no. 3: 122. https://doi.org/10.3390/tropicalmed5030122