Article

Does Augmented Reality Help to Understand Chemical Phenomena during Hands-On Experiments?–Implications for Cognitive Load and Learning

1
Chemistry Education, Paderborn University, 33098 Paderborn, Germany
2
Chemistry Education, Friedrich-Alexander-Universität Erlangen-Nürnberg, 90478 Nürnberg, Germany
*
Author to whom correspondence should be addressed.
Multimodal Technol. Interact. 2023, 7(2), 9; https://doi.org/10.3390/mti7020009
Submission received: 20 December 2022 / Revised: 15 January 2023 / Accepted: 16 January 2023 / Published: 19 January 2023
(This article belongs to the Special Issue Virtual Reality and Augmented Reality)

Abstract

:
Chemical phenomena are only observable on a macroscopic level, whereas they are explained by entities on a non-visible level. Students often demonstrate limited ability to link these different levels. Augmented reality (AR) offers the possibility to increase contiguity by embedding virtual models into hands-on experiments. Therefore, this paper presents a pre- and post-test study investigating how learning and cognitive load are influenced by AR during hands-on experiments. Three comparison groups (AR, animation and filmstrip), with a total of N = 104 German secondary school students, conducted and explained two hands-on experiments. Whereas the AR group was allowed to use an AR app showing virtual models of the processes on the submicroscopic level during the experiments, the two other groups were provided with the same dynamic or static models after experimenting. Results indicate no significant learning gain for the AR group in contrast to the two other groups. The perceived intrinsic cognitive load was higher for the AR group in both experiments as well as the extraneous load in the second experiment. It can be concluded that AR could not unleash its theoretically derived potential in the present study.

1. Introduction

The technology of augmented reality (AR) has reached a high level of popularity in the recent past, especially due to the great technological advances achieved during the last few years [1,2]. While complex and expensive equipment was required at the beginning of its development, nowadays nearly every mobile device supports AR [3,4]. As AR offers the opportunity to enhance the real environment with digital information in real time [5], various domains such as the gaming industry [1], medicine [6] or industry [7] already make use of this potential. Likewise, educational research has also appreciated the possibilities of its use for educational purposes. How AR can be used in education has been explored with ever-growing interest for over 20 years, but there is still ambivalent evidence concerning its impact on learning [1,8]. Several systematic reviews and meta-analyses [2,9,10] have pointed out that science seems to be one of the most important domains for the implementation of AR in class, as this technology makes it possible to approach a huge range of science learning difficulties.
Focusing on chemistry, students are particularly challenged by the fact that phenomena can only be observed on the visible macroscopic level. The underlying submicroscopic entities and their interactions, however, are beyond direct human perception [11]. Concerning chemistry learning, Johnstone [12] has postulated three different levels of representation that have to be taken into account when a chemical phenomenon is explained. The macroscopic level includes the substances and their properties perceptible to the human senses or detected by measurements. The submicroscopic level covers non-visible entities such as molecules, atoms and ions to explain the phenomenon, while the symbolic level comprises abstract symbols or equations. Linking all these levels is a key competence for correctly explaining an observed chemical process [12,13]. Empirical studies in the past have repeatedly shown that students often do not apply this competence: they tend to remain on the macroscopic level and end up reporting what they have observed [14,15,16]. Therefore, it might be a promising approach to use AR to bring observation on the macroscopic level closer to interpretation on the submicroscopic level. However, it is still unclear whether such an approach would be perceived as cognitively relieving by learners and would thus support learning. For this reason, the study presented in this paper aims at investigating the influence of using AR during chemical hands-on experiments for presenting representations of the submicroscopic level on domain-specific knowledge and cognitive load.

1.1. Theoretical and Empirical Background

As already pointed out, translating between the macroscopic and the submicroscopic level is an essential activity in chemistry which has to be acquired and applied in the chemistry classroom. Bridging between these levels, models are a fundamental tool in determining the way of thinking in chemistry [17,18]. Models are used by agents to represent a part of the world to fulfill a specific purpose such as testing hypotheses, explaining phenomena or generating predictions [19]. Following Gilbert [17], these representations can be expressed by different modes:
  • Concrete: The model is expressed by real materials and is often three-dimensional.
  • Verbal: The model is expressed by using language, for example, by describing the structure of molecules or their reaction with each other.
  • Symbolic: The model is expressed by symbols such as mathematical equations or chemical formulas.
  • Visual: The model is expressed by visualizations such as images or animations. This also includes virtual models.
  • Gestural: The model is expressed by body actions such as gestures or body movements.
With regard to our study, students (agents) make use of visualizations of molecules (visual representation of reality) to explain experiments they have conducted (purpose). According to traditional science education, students are not asked to use models of the submicroscopic level during an experiment. In this phase, the main emphasis is mostly placed on conducting and observing the experiment itself. Models are usually used when observations are evaluated and conclusions are drawn [20].
In traditional instruction, observation and interpretation are separated to prevent learners from mixing the different levels of representations. Considering the evidence from cognitive psychology about learning processes, the question arises whether the separation of observation and interpretation should be maintained if supportive technology such as AR is available. Following the cognitive load theory, the working memory only has a limited capacity [21,22]. Since it acts as the place where information is processed, this is highly important for learning. These cognitive resources can be occupied by three different types of cognitive load. Germane cognitive load is defined by the resources that are invested in building cognitive schemata which are highly relevant to learning processes [22]. It is assumed that the capacity of the working memory is limited, and all types of cognitive load are additive to each other. In consequence, only the remaining capacity that is not occupied by the other two types can really be invested. Intrinsic cognitive load is defined as the complexity of information that must be processed by a learner to achieve a learning goal. It is largely determined by the interactivity of different pieces of information with each other [23]. Information that can be learned and processed separately, such as the meaning of single symbols of chemical elements, provides lower interactivity than a complete chemical equation with different element symbols. Extraneous cognitive load results from the presentation of the learning material and the interactivity of information in the material [23,24]. If the learning material has a high degree of irrelevant information or decorative elements, the learners’ extrinsic cognitive load increases without entailing an added value for learning success [22]. In the context of multimedia learning, research has identified several design principles for reducing this type of cognitive load. The most relevant to our research are briefly presented as follows [25]:
Signaling Principle: Multimedia content contains a wealth of information. Therefore, it can be a challenge for learners to focus their attention on the relevant elements. According to the signaling principle, it is important to highlight those pieces of information that are particularly significant for learning. In the case of texts, this highlighting is usually done by formatting the respective text passages differently, while in images or videos, symbols such as circles or arrows are usually used to attract the attention of the learners [25].
Animation Principle: Since processes (such as chemical reactions) imply a certain dynamic, it may be useful to use animations to match these dynamics. On the one hand, learners do not need to discover differences between several static images when using animations. On the other hand, dynamic visualizations can cause a higher extraneous cognitive load since every single image is only presented for parts of a second. Meta-analyses suggest that animations can only foster learning in some domains and under certain circumstances [26,27]. In their meta-analysis, Berney and Bétrancourt [27] found a significant positive impact on learning by using animations in chemistry. The quality of abstraction and the mode of additional information were also found to be moderator variables.
Spatial and temporal contiguity principle: If related information is presented separately in terms of time and/or space, a split-attention effect might occur. Here, learners have to invest more working memory capacity to combine and integrate the information. While one piece of information has to be kept ready in the working memory, the related information may still have to be searched for and processed. To avoid this effect, the temporal and spatial contiguity principle is implemented, requiring that related information be closely connected in time and space [25].
Especially the last principle seems to be a crucial point with respect to models in chemistry since the observation and the usage of models for the generation of an explanation often happen in different phases. Consequently, a lack of spatial and temporal contiguity can be postulated. AR seems to offer the opportunity of approximating observation and modeling by allowing the integration of virtual objects into real environments. Thus, AR is part of the mixed-reality continuum postulated by Milgram and colleagues [28]. According to Azuma [5], an AR environment has to fulfill three main characteristics:
  • Combination of virtual and real objects partly overlaying each other;
  • Real-time interaction;
  • Three-dimensional objects.
The potential of AR has been recognized for different purposes. Several meta-analyses and systematic reviews have already evaluated the effects of AR on (science) learning and showed positive effects of using AR [10,29,30,31]. In their meta-analysis, Garzón and Acevedo [30] found a positive medium effect of using AR on learning gains in comparison to other multimedia tools or traditional approaches. They pointed out a large number of studies already existing in the natural sciences and found a medium positive effect in this field on learning. Similarly, a recent meta-analysis showed the effectiveness of using AR for learning in science education with a medium effect [10]. Although this study did not provide evidence for chemistry education, it highlighted the potential of AR to provide support in tasks with high demands in three-dimensional thinking, as well as the possibility to integrate non-visible entities into the learning process. Both aspects are highly relevant to learning chemistry. Nevertheless, there are recent studies from physics education reporting interesting and partly contradictory effects in using AR during a hands-on experiment [32,33,34]. All three studies have in common that an experimental group was either confronted with virtual visualizations of non-visible entities or with measurement results presented by different AR techniques (head-mounted displays or tablets) to increase spatial contiguity. Whereas two studies [33,34] found evidence for a significant reduction of (extraneous) cognitive load when using AR during an experiment, Altmeyer and colleagues [32] did not discover this effect. In contrast to this result, only two studies [32,34] reported a significant learning gain concerning conceptual knowledge of the AR group in comparison to the control group(s), while Thees and colleagues [33] did not find this effect. Hence, results from studies in physics education regarding the integration of AR in the experimental phase suggest that it is worthwhile investigating our approach in chemistry.
In general, a recent systematic review of the usage of AR in chemistry education showed the exploding interest in AR in the last three years [31]. Furthermore, it discovered that AR in chemistry education is mostly used for the representation of molecular structures or chemical reactions in chemistry education. The included studies mainly focused on affective variables such as motivation, and only a small number of reported effects were concerned with learning gains. Regarding the usage of AR to represent molecular structures, Habig [35] studied the effects of using AR as a supportive technique for university students with a special focus on gender differences. Students had to determine the absolute configuration of chiral molecules in organic chemistry. Contrary to expectation, the results showed that male students benefited more from using AR than females, as men already possess higher mental rotation abilities. In the same domain, Keller and colleagues [36] showed that students learning organic chemistry with AR could systematically benefit with regard to their cognitive load: extraneous and intrinsic load levels were significantly lower each time they were measured against a control group. In the context of another study, an interactive AR environment, which shows simple atom models of different chemical elements, was developed [37]. By combining several AR markers, the authors created the illusion of conducting an experiment. Simple chemical compounds such as water can be created, and a macroscopic representation of the reaction products can be activated. The authors reported a significant learning gain for learners working with the AR environment; however, there was no control group in this study. Nevertheless, a first approach of connecting the macroscopic and submicroscopic levels can be reported here, although there was no connection to a real experiment. In contrast to this, Domínguez Alfaro et al. [38] constructed an application for conducting a titration. While a real hands-on experiment is replaced by AR, the submicroscopic level was not taken into account. A comparison of pre- and post-test results showed no significant learning gain in this context. Similarly, Zhang et al. [39] developed an AR author tool allowing teachers to create AR experiments for their students, also without taking the submicroscopic level into account. Besides a positive evaluation of system usability, no further variables were examined.

1.2. Research Questions

A review of the literature shows that AR has the potential to support learning in chemical contexts and/or reduce cognitive load by increasing spatial contiguity. However, there is a lack of evidence concerning the integration of AR during real experiments in chemistry education. As far as we know, there are no studies that use AR to combine the submicroscopic level with the macroscopic level to explain a chemical phenomenon. With regard to learning gains and cognitive load, there are inconsistent findings. Therefore, the study presented in this paper aims to answer the following research questions:
RQ1: What are the effects of using augmented reality to model the submicroscopic level during experimentation on students’ learning gains?
RQ2: What are the effects of using augmented reality to model the submicroscopic level during experimentation on learners’ perceived cognitive load?

2. Materials and Methods
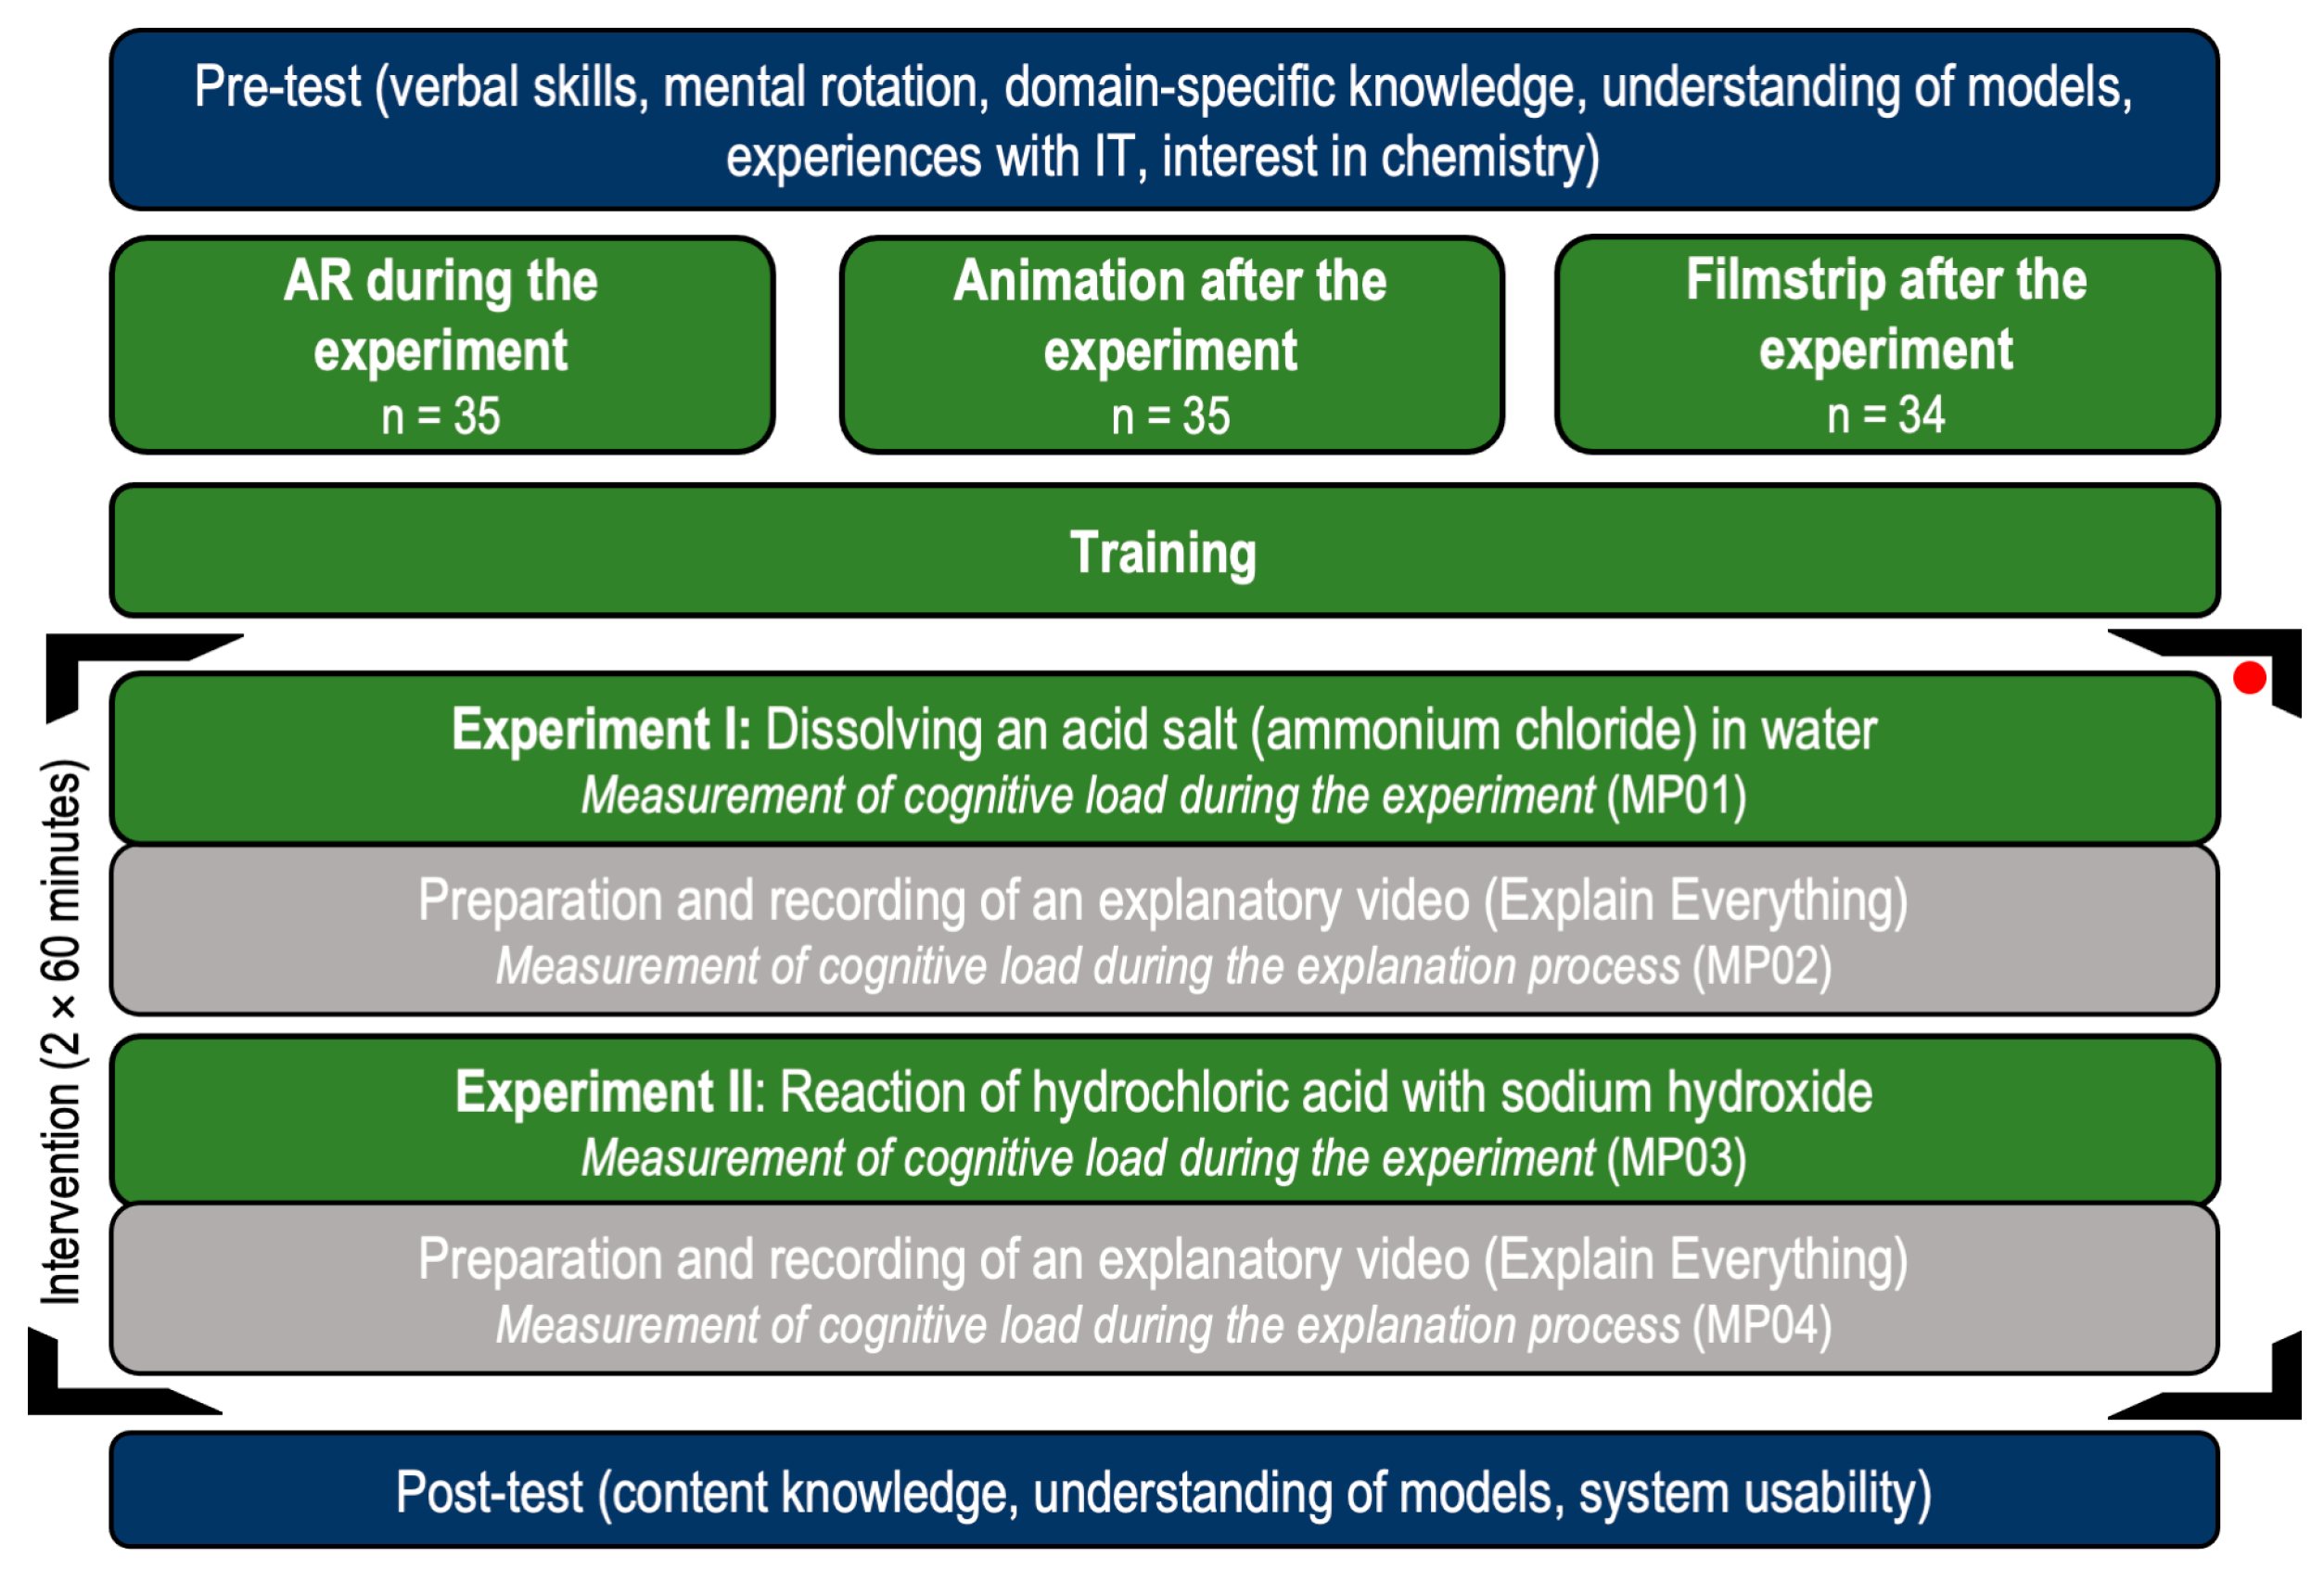
2.1. Study Design

To answer the research questions, an interventional pre-post-test study with three comparison groups was conducted with German high school students. During the study, all subjects had to conduct and explain two hands-on experiments. Each experimental group received a different technological mode of visualization on iPads. The groups were designed as follows:
AR group: The AR group conducted the experiments supported by an AR app which showed corresponding dynamic models of the submicroscopic level. Due to the approach of the submicroscopic and macroscopic levels, an increased spatial and temporal contiguity is assumed, which might lead to a lower extraneous cognitive load than in the other groups. As more pieces of information have to be processed simultaneously, it can be postulated that intrinsic cognitive load might be higher in the AR group.
Animation group: The animation group conducted the experiments without the support of any digital device. After the experiment, the group was supported by an animation (the same as in the AR group) to explain the phenomenon. This approach followed the animation principle, but it could cause a split-attention effect since the corresponding pieces of information concerning the macroscopic and submicroscopic levels were not presented in temporal and spatial contiguity.
Filmstrip group: The filmstrip group conducted the experiment without the support of any digital device. After the experiment, the group obtained static visualizations of the processes on the submicroscopic level to explain the phenomenon. This group represents traditional instruction based on textbooks. In order to guarantee a fair comparison among the groups, the static visualizations were also presented on a digital device. Neither the animation nor the contiguity principle was accounted for in this group.
Based on the students’ results in a pre-test, they were assigned to one of the three intervention groups. To balance the sample between the three groups, a triplet of students with (nearly) similar verbal skills, mental rotation skills and domain-specific knowledge were assigned each to a different group. Figure 1 illustrates the procedure of the whole intervention. The sample was recruited from six classes in four schools in North Rhine-Westphalia, Germany. The intervention was implemented during five to six regular chemistry lessons. Aiming to minimize the influence of the different teachers, data collection was accompanied by the first author. To fulfill ethical standards, the responsible school administrators, the participating pupils and especially their parents were informed about the procedure of the study and the data collected. Their consent was obtained according to EU data protection regulations.
The first two lessons were used to conduct a pre-test with the students. Based on the pre-test results in verbal skills, mental rotation ability and domain-specific knowledge, each student was assigned to one intervention group. In the next lesson, the students were asked to build pairs within their intervention groups. The students were free to pick a partner of their choice to avoid motivational problems. A team of three was only built exceptionally if there was an odd number of students in the intervention group. Each pair was given a pre-installed iPad for the intervention. In the first training session, all the students were introduced to the app “Explain Everything”, which they used to prepare and record their explanatory videos for the two experiments. Afterwards, every intervention group received special training for their mode of visualization This training included specific tasks that provided students with an overview of the possibilities of their medium. For the hands-on experiments, the topic of acids and bases was chosen. As the underlying donor–acceptor principle is a basic concept of chemistry anchored in national standards, it is crucial for students to learn about and apply this concept. In the first experiment, the test persons dissolved the salt ammonium chloride (NH4Cl) in water, which had previously been mixed with Tashiro pH-indicator. This indicator turns from green to violet when the pH of a solution decreases below 5.2, which can be observed during the experiment. When dissolving the salt in water, ammonium chloride dissociates into chloride and ammonium ions. The latter react partly with the water molecules to form ammonia molecules and oxonium ions (H3O+). As the pH is the negative logarithm of the oxonium ion concentration, the observed decrease of pH indicates an increasing concentration of oxonium ions. While experimenting, the AR group was allowed to use the AR app on the iPad. To represent the traditional separation of observation and interpretation, the other two groups were not allowed to use their iPads during the experiment but only in the subsequent explanation phase. All students were instructed to record their activity when working with the iPad by recording a screencast with audio. Thus, the activities and the discussion of each pair could be collected. After the experiment, the cognitive load of every student was measured using a questionnaire (MP01). In the following explanation phase, the students prepared an explanatory video in the app Explain Everything for an imaginary friend who could not be present at the lesson due to illness. The explanation needed to include a description of the observation on the macroscopic level and to point out the connection to the submicroscopic level and the entities involved. After having finished the explanation, the students filled out another questionnaire about their cognitive load during the explanation (MP02). In the next lesson, the same procedure (experiment and explanation) was repeated with another experiment that dealt with the neutralization of hydrochloric acid with a sodium hydroxide solution illustrated by a color change in the universal pH-indicator. In this case, the oxonium ions react with hydroxide ions to form two water molecules. So, the observed increase in pH indicates a decrease in the oxonium ion concentration. Regarding the measurement of the cognitive load, the same procedure was followed as in the first lesson. The cognitive load was measured after the experiment (MP03) and the explanatory video (MP04). Directly after the last explanation video, the students participated in a post-test.

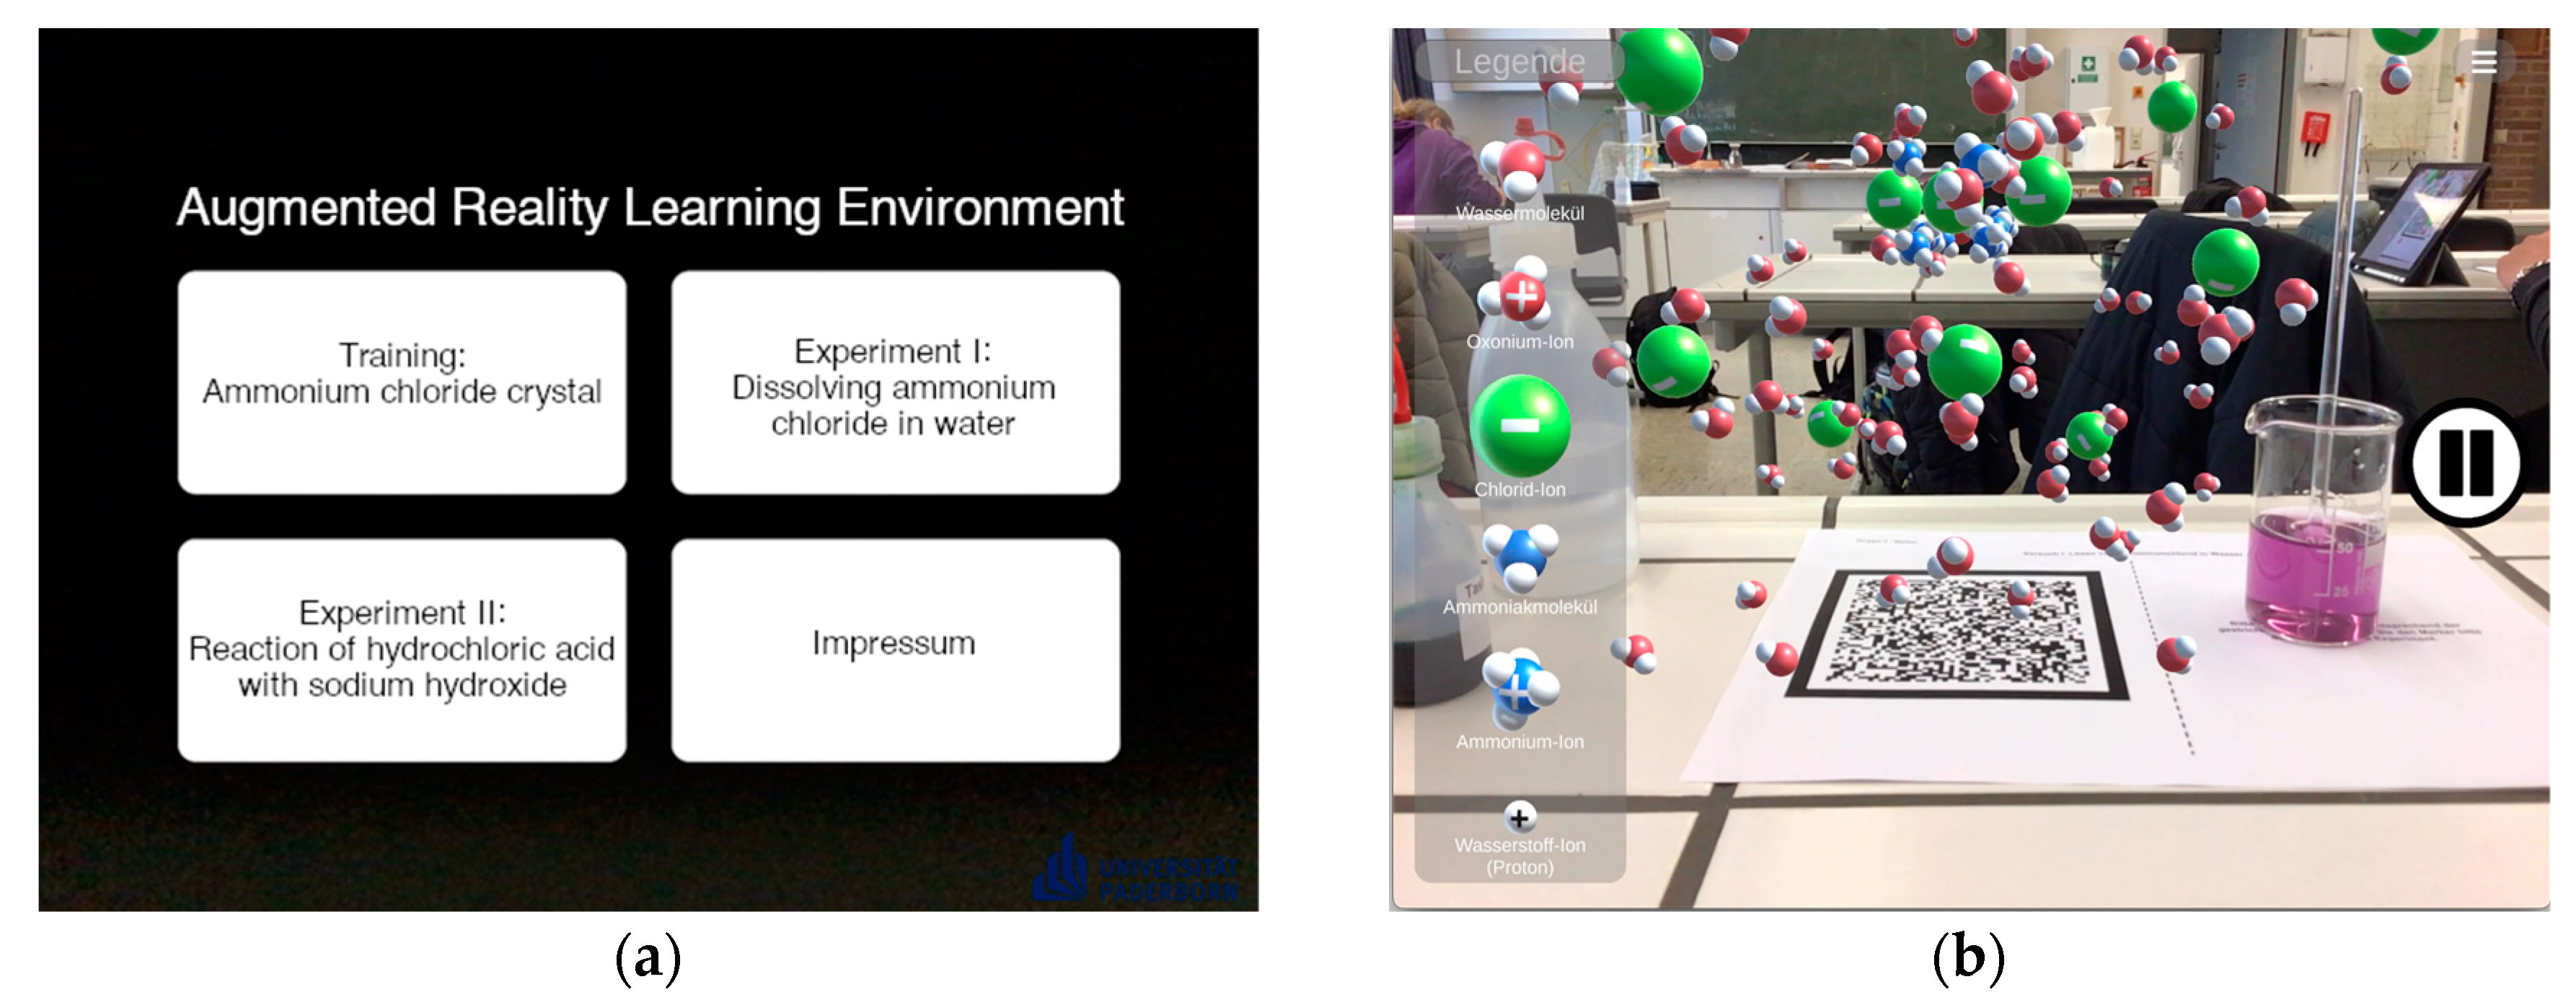
2.2. Learning Materials

Each intervention group was provided with its own materials based on the similar content and visualizations. Following Azuma [5], AR should be implemented in a three-dimensional way, so the space-filling model was chosen. This model visualizes atoms as spheres of different colors, taking into account the relations of atomic sizes, bond angles and bond lengths [40]. This model seemed appropriate, as it presents atoms as simple spheres. In contrast to the ball-and-stick model, the space-filling model does not represent bonds as sticks between the spheres. Ions can simply be illustrated by adding a charge symbol to the corresponding sphere. Additionally, this model can easily be adapted to every interventional mode. The models were created with the software Blender and visualized the processes mentioned in the previous section. Considering the rather complex animations and the signaling principle [25], arrows were added to the process at different times so that important areas of animations were highlighted to reduce extraneous cognitive load. Finally, the animations were exported as videos. By using the video-editing software Magix, a legend was added to the video, as was a disclaimer concerning the nature of the models. The latter indicates, for example, that models represent only parts of reality and that processes that occur simultaneously in reality are partially shown one after the other for better clarity. During the intervention, the students were able to work at their own pace since they had the possibility to stop, rewind or fast-forward the animation at any time. Zooming in and out was also possible. To create the filmstrip, several single key frames from the animation were imported into PowerPoint. The final filmstrips were exported as pdf documents. Figure 2 shows an example of the filmstrip of the first experiment. During the intervention, the students could work at their own pace in that they were free to look at every single image as long as they wanted. They could also scroll up and down to examine the previous or next image at any moment. Zooming in and out was also possible. Learning materials can be requested from the corresponding author (see Supplementary Materials).
To generate the AR environment, an iPadOS application was created by using the models and animation from Blender. Those models were imported into the software Unity 3D. In addition, the Vuforia SDK was used to implement AR functionalities. In the main menu (see Figure 3), students had to select the right environment and scan the corresponding marker to prevent them from looking at other content before it was relevant. Marker-based AR was chosen, as this is the most common type of AR. Furthermore, the marker can easily be placed next to the experiment (see Figure 3), and visualizations are presented in a stable way even if the camera cannot track every single moment. One marker was created for the training and one for each experiment. To give the students more control over the AR animations, a pause button was integrated in the same way as in the animation group, so the students could stop at any time. Due to technical issues, a rewind or fast-forward button could not be added. Rotation and zoom were possible by moving the device or the marker. The whole program was exported to XCode for compilation and final deployment on the iPads. Since the app is still in beta, it is not yet publicly available through the Apple App Store (see Supplementary Materials).
For the creation of the explanatory video, the app Explain Everything was used. A template containing tasks and representations could be used to enrich the explanation. Below the task, students had an almost infinite amount of space to draw their own representations or write texts as components of the explanation. The laser pointer integrated into the app could be used to point out particularly relevant illustrations during the explanation.

2.3. Instruments

In order to answer the research questions, several instruments were used. All tests and questionnaires were carried out in paper-pencil format since internet access could not be provided for this study at every school. In the next section, the relevant control variables will be introduced first, and then the dependent variables will be presented. Although there were additional instruments used in the study, only selected ones will be presented to answer the research questions posed in this article.
In the first questionnaire, basic socio-demographic data such as age and gender, as well as the last grade in chemistry, were collected. Furthermore, every student generated an individual code to pseudonymize all data collected and to match them for the later analysis. Verbal skills were measured by using the verbal analogies scale (V3) of a German cognitive abilities test (KFT) for grade 11 [41]. In each item of this test, an analogy of two words was presented and had to be applied to a new example. In total, 20 items in a multiple-choice-single-select format with one correct response and four distractors had to be answered. For assessing mental rotation skills, the Revisited Purdue Spatial Visualization Test: Rotation [42] was used. However, for time and test economy reasons, only a short scale proposed by Bodner & Guay [43] was used. In total, there were 20 items in a multiple-choice-single-select format with one correct answer and four distractors. Following Bacca et al. [9], the usability of an AR application should be measured in learning settings to ensure that the application does not inhibit learning. Therefore, the widely accepted System Usability Scale by Brooke [44] was chosen and applied during the post-test. In total, the questionnaire consisted of ten items, of which five were positively phrased and five are negatively phrased. Based on the results, a score from zero (poor usability) to 100 (perfect usability) could be calculated. Additionally, Bangor et al. [45] proposed an adjective scale ranging from “worst imaginable” to “best imaginable” for a better interpretation of the system usability score.
To measure learning gains in domain-specific knowledge, a domain-specific knowledge test was developed by taking validated items from already existing tests concerning acids and bases [46,47,48]. They mainly focused on the concept of acids and bases following Brønsted, the pH value and neutralization. Additionally, two new items were created to meet the focus on proton transmission in the learning environment. In total, the original test consisted of 19 items in a multiple-choice-single-select format with one correct answer and three distractors.
Since the perceived cognitive load during the intervention is highly relevant to the second research question, a questionnaire by Klepsch et al. [49] was chosen. It differentiates between the three types of cognitive load in a time-efficient way, as the questionnaire consists of eight items in total. For each type of cognitive load, the students were provided with two or three statements with which they had to agree or disagree on a seven-point Likert scale. Despite the small number of items, each scale showed sufficient internal consistency in previous studies [36,49].
Before analyzing the results obtained by the presented instruments, a reliability analysis was conducted to check the internal consistency of the used scales. Since this article focuses on the influence of AR during the experiments, the measuring points after the experiments (MP01 and MP03) were considered for cognitive load. The measuring points after the creation of the explanatory videos (MP02 and MP04) were not taken into account. Regarding the domain-specific knowledge test, three items revealed an insufficient item scale correlation (nearly zero or below), so they were excluded from further analysis. Table 1 gives an overview of all of Cronbach’s alpha values for the relevant scales.
All in all, most of the scales show acceptable internal consistency except the verbal cognitive abilities test and the germane load scales. Since the verbal cognitive abilities test is an instrument that has already been tested for reliability in large-scale studies and provided sufficient internal consistency, the scale was retained. Since the germane cognitive load is a component of the overall cognitive load, this scale was also retained; however, the results should be interpreted with caution.

2.4. Sample

The presented study was conducted from August to October 2022 in six different chemistry high school courses from four different schools in the eastern part of the federal state of North Rhine-Westphalia in Germany. A total of 126 students participated in the study. Twenty students had to be excluded from the analysis because they were not present at one or more intervention times. This corresponds to a dropout rate of 15.87%. Of the remaining 106 subjects, two additional students were excluded because their residual learning gains were −2 or lower. It is assumed that they did not take the intervention seriously [50]. Finally, N = 104 students were included in the analysis. Their mean age was M = 15.96 (SD = 0.56), and the average chemistry grade (1 = best grade and 6 = worst grade) on their most recent report card was M = 2.23 (SD = 1.15). Regarding gender, 48 students (46.2%) identified themselves as female, 54 as male (51.9%), and two students stated that they see themselves in the “diverse” category (1.9%). Ninety-one students (87.5%) had attended a basic level chemistry course, while thirteen (12.5%) had chosen the advanced level. Students from the different course levels were evenly distributed among the experimental groups to guarantee similar prior knowledge. Out of 104 participants, 34 were assigned to the filmstrip group, 35 to the animation group, and 35 to the AR group.

2.5. Balancing of Groups

Aiming to assure the comparability of the different groups, the balancing of the intervention groups was verified after their formation. There were no statistical differences between the groups in terms of domain-specific knowledge, mental rotation and verbal skills after the pre-test because the groups were evenly distributed according to these criteria after the pre-test. As can be seen in Table 2, this could be confirmed by a one-way analysis of variance. All other variables also showed no group differences.

3. Results

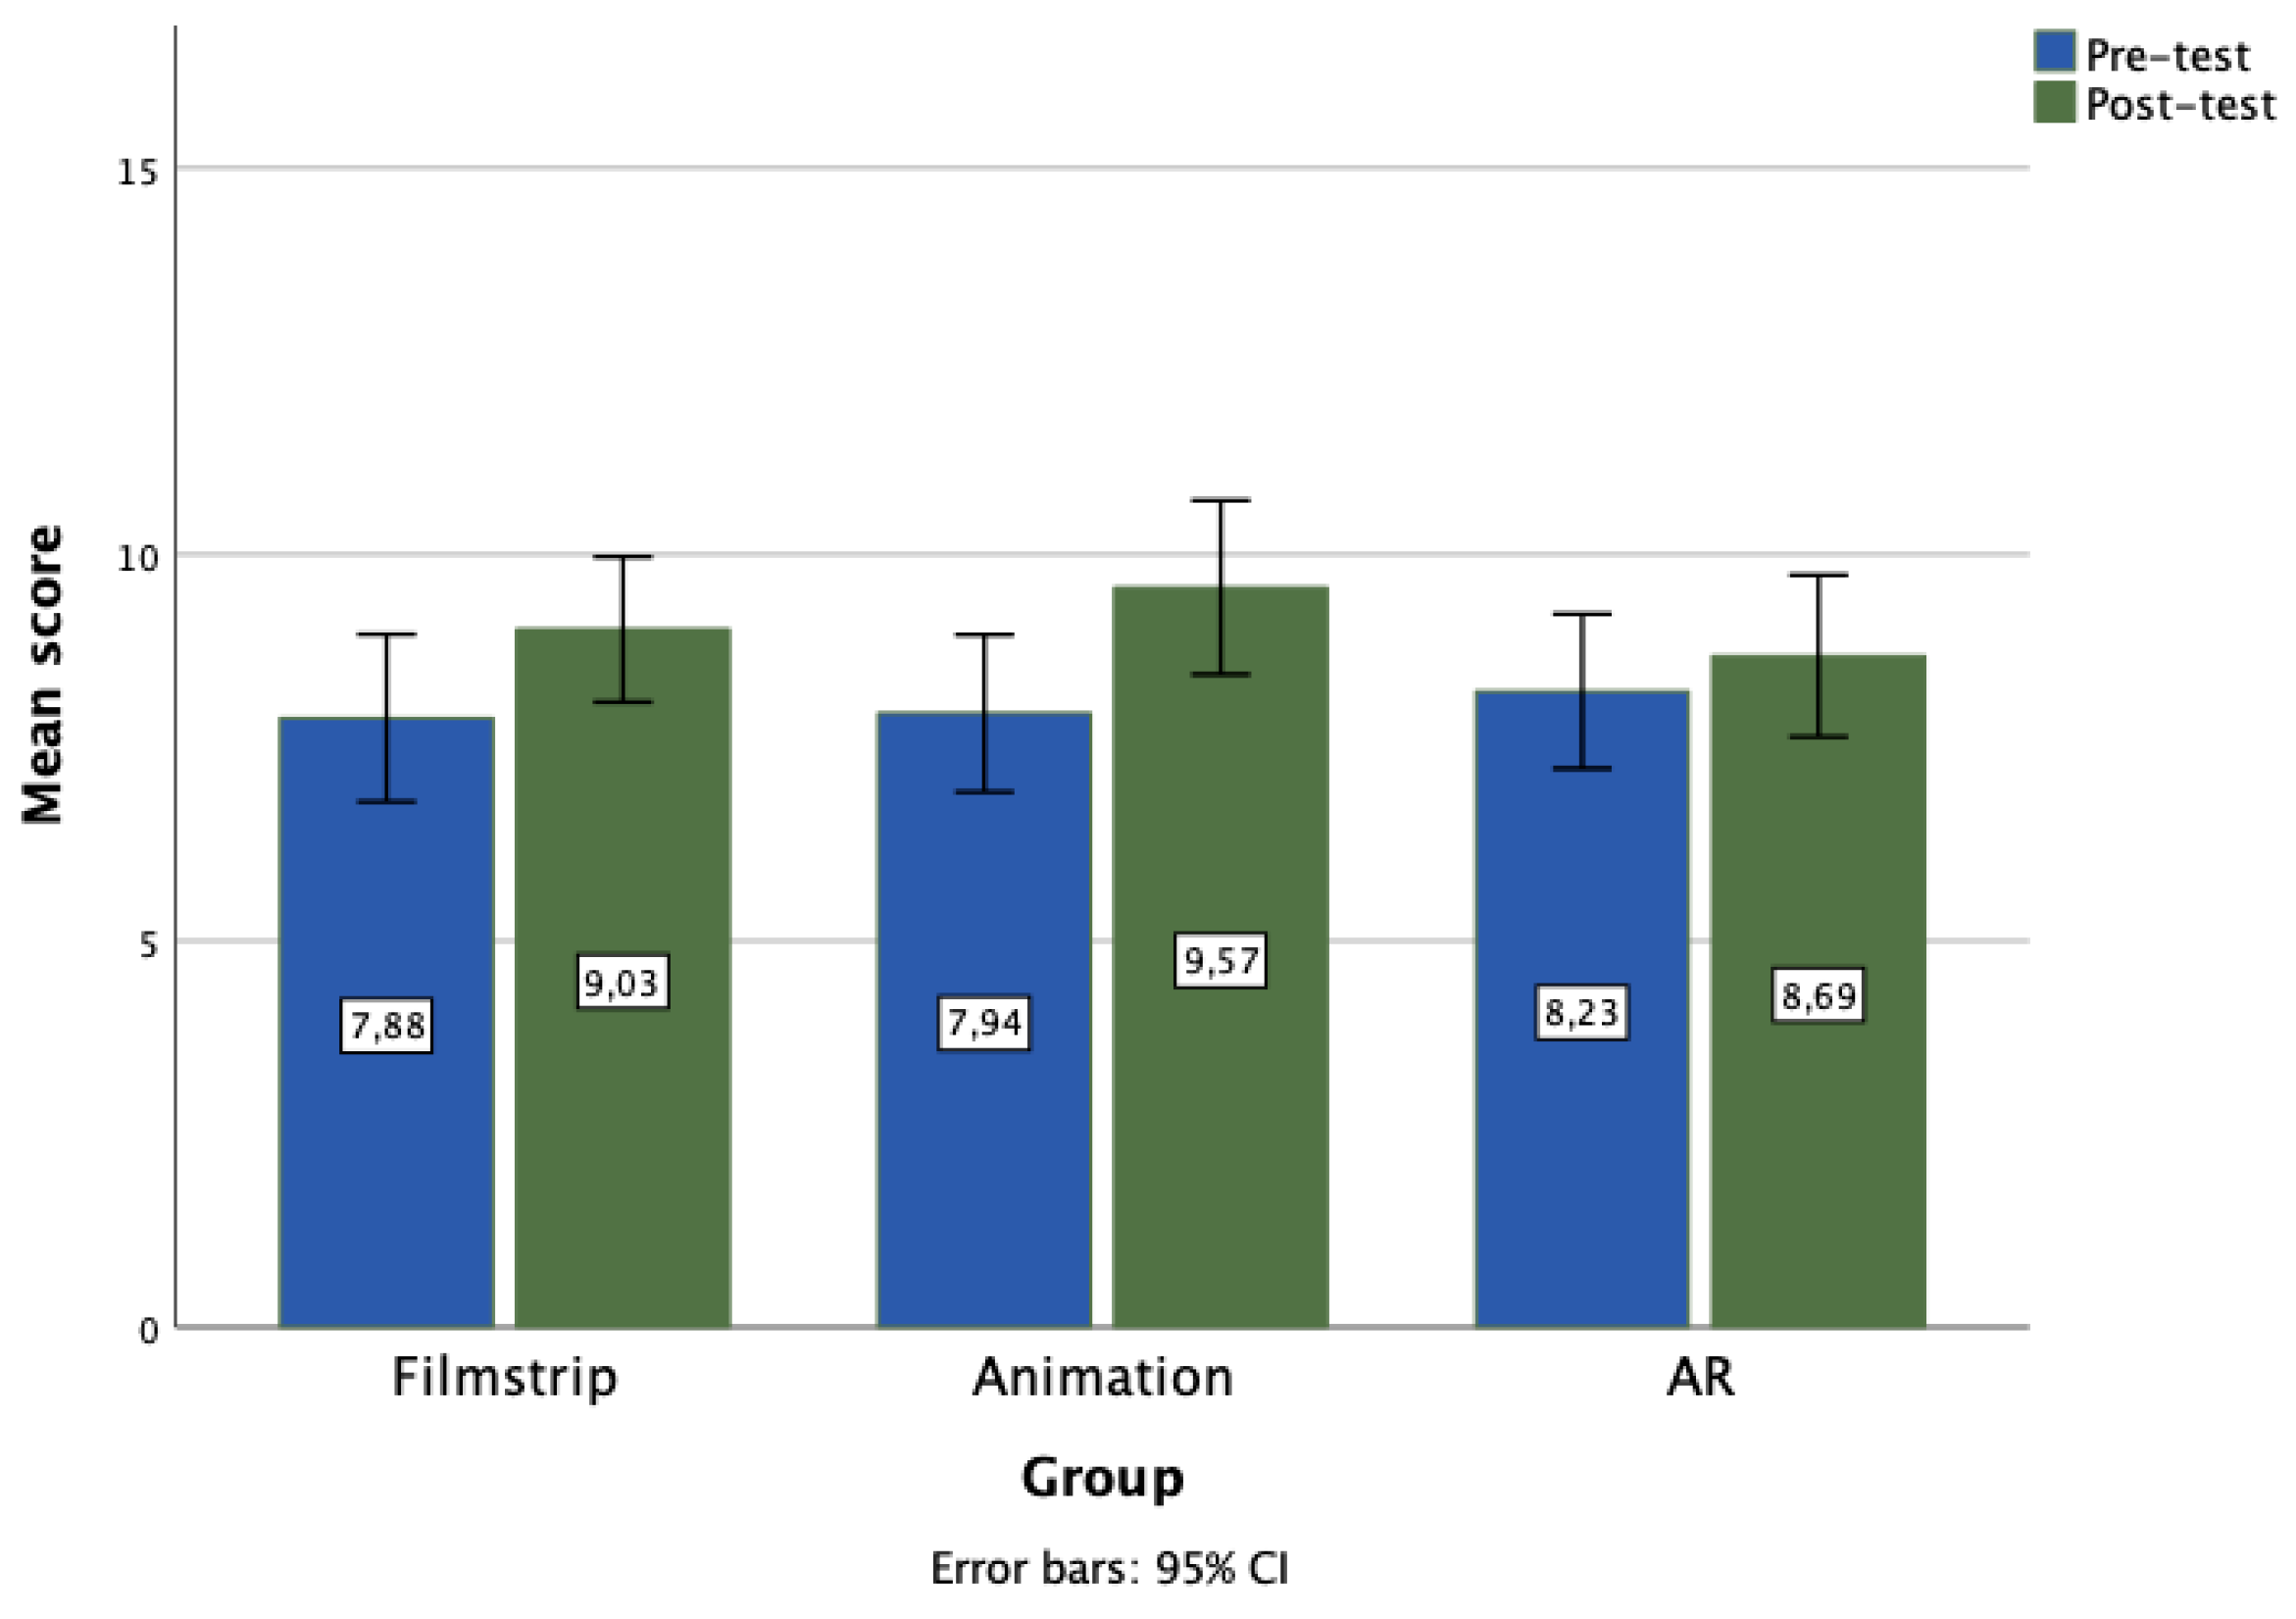
3.1. Domain-Specific Knowledge

With respect to the first research question, the effectiveness of the intervention regarding students’ domain-specific knowledge was evaluated. For this purpose, the usability of the AR app was analyzed first. The results reveal an average score of M = 81.54 (SD = 15.49). If this score is applied to the adjective rating scale of Bangor et al. [45], the overall rating can be described as good. Thus, the AR group was not prevented from learning due to the usability of the AR app.
Regarding domain-specific knowledge, Figure 4 illustrates the development of means for each group. In order to find differences between the intervention groups, a repeated measures ANOVA for domain-specific knowledge as the dependent variable and the group as a between-subjects factor was conducted.
Results from the ANOVA determined the measurement point (pre- and post-test) as one significant main factor, F(1, 101) = 17.43, p < 0.001, η2 = 0.147. Following Cohen [51], this can be interpreted as a large effect. Additionally, a post-hoc analysis of simple mean effects of the measurement point using Bonferroni confidence interval adjustment revealed a difference between the groups (see Table 3).
Whereas the filmstrip and the animation group show a significant increase in domain-specific knowledge, this is not the case for the AR group. No significant effect was found either for the group or for the interaction between the measurement time point and the group.

3.2. Cognitive Load

The second research question aims to find out how cognitive load is influenced by the learning environment. Here, the filmstrip group and the animation group worked under the same conditions, as they were not supported by visualizations during the hands-on experiments. Therefore, both groups were merged into the no-AR group (n = 69) for the analysis of cognitive load. In order to find differences between the AR and the no-AR groups, t-tests for independent samples were conducted for each measurement-point by including the different types of cognitive load as the dependent variable. Table 4 provides an overview of the results of the first experiment.
Results from the t-test show highly significant differences in intrinsic cognitive load. Cohen’s d indicates a large effect [52]. In contrast, the germane cognitive load does not show significant differences. Extraneous cognitive load is just short of being significant, but a tendency emerges from the differences in mean values. Therefore, it can be stated that extraneous load is slightly higher in the AR group than in the other group.
For the second experiment, the same method of analysis was applied to discover potential differences between the groups. Table 5 provides an overview of the results.
First, it can be stated that significant differences were found for every type of cognitive load. The results reveal that each type of cognitive load is significantly higher in the AR group than in the no-AR group. Cohen’s d indicates medium to large effects [52].
Cognitive load, especially intrinsic, can be influenced by prior knowledge and may influence further knowledge acquisition. Therefore, bivariate Pearson correlations were conducted between variables of both measuring points of domain-specific knowledge and cognitive load for each group. Table A1 and Table A2 in the Appendix A show the results for each group. Considering these results, several differences can be observed. While the extraneous cognitive load at the second measurement point was negatively related to prior knowledge and the post-test score for the AR group, this was not the case for the no-AR group. In contrast, the domain-specific knowledge of the pre- and post-test correlated negatively with the intrinsic load of the second experiment for the no-AR group.
Based on the correlations found, regression models for each type of cognitive load were calculated to find linear relations between domain-specific knowledge and cognitive load. Prior knowledge was a significant predictor of the perceived intrinsic cognitive load in the second experiment for the no-AR group (β = −0.09, t(64) = −2.41, p = 0.019). A significant percentage of the variance in perceived intrinsic cognitive load during the second experiment could thus be explained for the no-AR group (R2 = 0.29, F(1, 64) = 5.83, p = 0.019). This is a large effect according to Cohen [51]. In addition, prior knowledge was a significant predictor of the perceived extraneous cognitive load in the second experiment for the AR group (β = −0.15, t(33) = −2.22, p = 0.034). A significant percentage of the variance in perceived extraneous cognitive load during the second experiment could thus be explained for the AR group (R2 = 0.10, F(1, 33) = 4.91, p = 0.034). This effect can be interpreted as a medium effect according to Cohen [51].
Regarding the influence of cognitive load on the post-test results in domain-specific knowledge, the regression analyses showed the following results. Perceived intrinsic cognitive load during the second experiment influenced significantly how well students performed in the post-test in the no-AR group (β = −0.91, t(64) = −2.12, p = 0.038). A significant percentage of the variance in the post-test score could likewise be explained by perceived intrinsic cognitive load during the second experiment for the no-AR group (R2 = 0.26, F(1, 64) = 4.50, p = 0.017). This is a large effect according to Cohen [51]. In contrast, perceived extraneous cognitive load during the second experiment influenced significantly how well students performed in the post-test in the AR group (β = −1.02, t(33) = −2.52, p = 0.017). A significant percentage of the variance in the post-test score could likewise be explained by perceived extraneous cognitive load during the second experiment for the AR group (R2 = 0.14, F(1, 33) = 6.39, p = 0.017), corresponding to a large effect according to Cohen [51].

4. Discussion

4.1. Domain-Specific Knowledge

In our study, two research questions were raised concerning the influence of using AR to visualize virtual models of the submicroscopic level while experimenting in chemistry on learning gains and cognitive load. It was assumed that AR could increase temporal and spatial contiguity and therefore could decrease extraneous cognitive load. In consequence, students’ learning progress might benefit. Regarding domain-specific knowledge, the results reveal that the groups not using AR were able to significantly improve their score, whereas the AR group did not show a significant progress in knowledge. This finding is not in line with previous findings on the use of AR in chemistry education indicating positive impacts on learning [31,35,37]. It is important to note that while previous studies used AR for visualization only, the implementation of AR during experimentation in chemistry has rarely been studied so far. In physics education, however, an approach such as the one used in the present study has already been investigated, but inconsistent results for learning success were shown here. While Thees et al. [33], who investigated the implementation of AR during physics experiments, could not find a positive impact of AR during experimentation, other studies were able to do so [32,34]. However, there is a lack of systematically comparing criteria of implementation such as interactivity. Regarding the previous studies, it should be noted that most of them were conducted at universities with undergraduate students rather than with secondary school students. This makes the results slightly less comparable since they focused on different target groups. It can be assumed that the comprehension and usage of an AR environment might require more prior knowledge than expected or other resources that can be better provided by students at the tertiary level.

4.2. Cognitive Load

In order to explain the differences in learning gains between the intervention groups, the results concerning cognitive load should be taken into account. The analysis revealed that the AR group experienced a significantly higher intrinsic cognitive load for both experiments. This result is in line with the underlying theory, as intrinsic cognitive load is decisively influenced by the interactivity of the single elements to be processed at the same time. While the AR group was expected to connect their observations to the processes on the submicroscopic level, the two other groups were merely confronted with the visualizations after experimentation. So, the AR group had more elements to deal with at the same time. Concerning the groups not working with AR, perceived intrinsic cognitive load during the second experiment was predicted by prior domain-specific knowledge and predicted learning gains. This result is in line with cognitive load theory since the students did not receive any visualization during the hands-on experiment. Hence, extraneous cognitive load caused by the presentation of learning materials was not expected to have a significant influence on the no-AR group. In consequence, the complexity of the task to conduct the experiment can be seen as the main source of cognitive load for this group.
Moreover, the mean score of extraneous cognitive load was significantly higher in the second experiment for the AR group and predicted the post-test score. In the first experiment, extraneous cognitive load also slightly exceeded the other group without being significant. This finding contradicts expectations and the results of previous studies [33,36]. The implementation of models of the submicroscopic level in the experimentation phase was expected to increase temporal and spatial contiguity and to reduce extraneous cognitive load. Either this aim could not be achieved, or other effects were caused by the AR environment stimulating an increased extraneous cognitive load. The complexity of the representations on the atomic level could be one reason for increased extraneous cognitive load, or the complexity of observation and visualization together. The visualizations on their own were already complex since many molecules were displayed, and most of them were moving at the same time. In contrast, the visualizations in the context of physics education rather showed, for example, graphs of measurement results or magnetic field lines. Reducing the complexity of AR visualizations during hands-on experiments in comparison to subsequently used animations might be one suggestion here.
As the usability of the app developed for this study was judged as “good” by the students of the AR group, problems in handling the app seem to be improbable. Nevertheless, holding the tablet and using the app while experimenting could have overstrained the students cognitively. The second experiment was manually more demanding than the first one because more operations had to be carried out more precisely. This could possibly explain the influence of extraneous cognitive load in the second experiment on the post-test score for the AR group. Using a head-mounted AR technology such as AR glasses could perhaps reduce extraneous cognitive load since the students would not have to handle an additional device and could concentrate more intensively on the visualizations. Evidence from physics education does not provide a clear answer on the potential of head-mounted displays, so further research is needed in this domain [32,33]. Additionally, it seems to be possible that the real environment distracted the students of the AR group. Consequently, they focused too much on the macroscopic observations of the experiments rather than paying enough attention to the visualizations.
Regarding the germane cognitive load, the AR group perceived higher load than the no-AR group in the second experiment, although the results of the post-test suggest the opposite. Taking the other types of cognitive load into account, this contradicts the underlying theory since only the remaining resources can be invested for learning processes. It might be possible that the AR group was more engaged during hands-on experiments, so they believed to perceive a high germane load although the invested cognitive resources belonged to another domain such as the extraneous load. Considering the poor reliability of the germane load scale, this is only a cautious interpretation.

4.3. Limitations and Outlook

Although the presented study could provide a first insight into the implementation of AR while experimenting in chemistry, some limitations should be mentioned. First, the small sample size of each intervention group can be seen as a limiting factor since this could possibly have caused a lack of power. Additionally, further analysis such as the influence of prior knowledge or cognitive load within extreme groups was not possible. Thus, there is the potential to discover more parameters that influence learning while using AR during hands-on experiments in chemistry. Following Buchner and Kerres [53], further studies should aim to investigate when and how learning with AR during hands-on experiments might be conducive. Including more prompts concerning the connection of the different representational levels could be one aspect to be addressed. Further analyses will concentrate on the process data in the form of the student-generated explanatory videos. In this context, the connection of observation and interpretation or the different representational levels will be a main focus of the analysis to discover potential differences between the intervention groups. This will show whether and to what extent one of the comparison groups succeeded in better linking the representation levels in their explanations.

5. Conclusions

In summary, the theoretically derived and expected potential of AR in helping to connect the macroscopic and submicroscopic levels during experimentation did not unleash its potential in the present study. There was no significant learning gain in the AR group as opposed to the other intervention groups. The presumed reduction of extraneous cognitive load due to the contiguity of observation and interpretation could not be shown. This leads to the need for further studies investigating other settings in which AR is used to incorporate the submicroscopic level to find out whether this technology can be used in a more beneficial way during hands-on experiments. Reviewing the use of other AR technologies, such as head-mounted devices, also seems worthwhile. In any case, it seems necessary to identify parameters in further studies that moderate a beneficial use of AR in experimentation in chemistry education.

Supplementary Materials

The following supporting information can be downloaded at: https://uni-paderborn.sciebo.de/s/8UuDO3a6GIkxyZG.

Author Contributions

Conceptualization, H.P.; methodology, H.P.; software, H.P.; validation, H.P., S.H. and S.F.; formal analysis, H.P. and S.F.; investigation, H.P.; resources, H.P.; data curation, H.P.; writing—original draft preparation, H.P.; writing—review and editing, S.H. and S.F.; visualization, H.P.; supervision, S.H. and S.F. All authors have read and agreed to the published version of the manuscript.

Funding

This research received no external funding.

Institutional Review Board Statement

Ethical review and approval were waived for this study because all the subjects participated in the study voluntarily and without further constraints. To avoid disadvantages, all participants received the learning materials of the other groups.

Informed Consent Statement

Informed consent was obtained from all subjects involved in the study.

Data Availability Statement

The data are not publicly available due to EU data protection regulations. For further questions, please contact the corresponding author.

Acknowledgments

The authors want to thank all the teachers and students who participated in the study. The authors want to thank Marvin Lee Fox for his considerable support in developing the augmented reality app.

Conflicts of Interest

The authors declare no conflict of interest.

Appendix A

Table A1. Pearson correlations of domain-specific knowledge and cognitive load for the no-AR group.
Score Pre-testScore Post-TestICL_MP01GCL_MP01ECL_MP01ICL_MP03GCL_MP03ECL_MP03
Score Pre-test
Score Post-Test0.604 **
ICL_MP01−0.1650.033
GCL_MP01−0.127−0.066−0.040
ECL_MP010.1270.100−0.027−0.281 *
ICL_MP03−0.289 *−0.256 *0.250 *0.0010.045
GCL_MP03−0.157−0.0440.0010.334 **−0.2020.287 *
ECL_MP03−0.214−0.1610.109−0.283 *0.318 **0.475 **0.047
ICL: Intrinsic cognitive load; GCL: Germane cognitive load; ECL: Extraneous cognitive load. MP01: Measurement point after the first experiment; MP03: Measurement point after the second experiment. * p < 0.05 ** p < 0.01.
Table A2. Pearson correlations of domain-specific knowledge and cognitive load for the AR group.
Pre-Test scorePost-Test scoreICL_MP01GCL_MP01ECL_MP01ICL_MP03GCL_MP03ECL_MP03
Pre-test score
Post-test score0.638 **
ICL_MP010.132−0.106
GCL_MP010.2580.1760.370 *
ECL_MP01−0.152−0.1440.182−0.447 *
ICL_MP03−0.146−0.2920.328−0.0990.446 **
GCL_MP030.1070.0460.1450.1290.0120.161
ECL_MP03−0.360 *−0.402 *0.141−0.346 *0.529 **0.544 **−0.081
ICL: Intrinsic cognitive load; GCL: Germane cognitive load; ECL: Extraneous cognitive load. MP01: Measurement point after the first experiment; MP03: Measurement point after the second experiment. * p < 0.05 ** p < 0.01.

References

  1. Scavarelli, A.; Arya, A.; Teather, R.J. Virtual reality and augmented reality in social learning spaces: A literature review. Virtual Real. 2021, 25, 257–277. [Google Scholar] [CrossRef]
  2. Garzón, J.; Pavón, J.; Baldiris, S. Systematic review and meta-analysis of augmented reality in educational settings. Virtual Real. 2019, 23, 447–459. [Google Scholar] [CrossRef]
  3. Carmigniani, J.; Furht, B.; Anisetti, M.; Ceravolo, P.; Damiani, E.; Ivkovic, M. Augmented reality technologies, systems and applications. Multimed. Tools Appl. 2011, 51, 341–377. [Google Scholar] [CrossRef]
  4. Maas, M.J.; Hughes, J.M. Virtual, augmented and mixed reality in K–12 education: A review of the literature. Technol. Pegagogy Educ. 2020, 29, 231–249. [Google Scholar] [CrossRef]
  5. Azuma, R.T. A survey of augmented reality. Presence Teleoperators Virtual Environ. 1997, 6, 355–385. [Google Scholar] [CrossRef]
  6. Eckert, M.; Volmerg, J.S.; Friedrich, C.M. Augmented reality in medicine: Systematic and bibliographic review. JMIR MHealth UHealth 2019, 7, e10967. [Google Scholar] [CrossRef]
  7. Gattullo, M.; Scurati, G.W.; Fiorentino, M.; Uva, A.E.; Ferrise, F.; Bordegoni, M. Towards augmented reality manuals for industry 4.0: A methodology. Robot. Comput.-Integr. Manuf. 2019, 56, 276–286. [Google Scholar] [CrossRef]
  8. Garzón, J. An overview of twenty-five years of augmented reality in education. MTI 2021, 5, 37. [Google Scholar] [CrossRef]
  9. Bacca Acosta, J.L.; Baldiris Navarro, S.M.; Fabregat Gesa, R.; Graf, S. Augmented reality trends in education: A systematic review of research and applications. J. Educ. Technol. Soc. 2014, 17, 133–149. [Google Scholar]
  10. Xu, W.-W.; Su, C.-Y.; Hu, Y.; Chen, C.-H. Exploring the effectiveness and moderators of augmented reality on science learning: A meta-analysis. J. Sci. Educ. Technol. 2022, 31, 621–637. [Google Scholar] [CrossRef]
  11. Gkitzia, V.; Salta, K.; Tzougraki, C. Students’ competence in translating between different types of chemical representations. Chem. Educ. Res. Pract. 2020, 21, 307–330. [Google Scholar] [CrossRef]
  12. Johnstone, A.H. The development of chemistry teaching: A changing response to a changing demand. J. Chem. Educ. 1993, 70, 701–705. [Google Scholar] [CrossRef]
  13. Taber, K.S. Three levels of chemistry educational research. Chem. Educ. Res. Pract. 2013, 14, 151–155. [Google Scholar] [CrossRef]
  14. Kozma, R.B.; Russell, J. Multimedia and understanding: Expert and novice responses to different representations of chemical phenomena. J. Res. Sci. Teach. 1997, 34, 949–968. [Google Scholar] [CrossRef]
  15. Davidowitz, B.; Chittleborough, G.D.; Murray, E. Student-generated submicro diagrams: A useful tool for teaching and learning chemical equations and stoichiometry. Chem. Educ. Res. Pract. 2010, 11, 154–164. [Google Scholar] [CrossRef] [Green Version]
  16. de Andrade, V.; Freire, S.; Baptista, M. Constructing scientific explanations: A system of analysis for students’ explanations. Res. Sci. Educ. 2019, 49, 787–807. [Google Scholar] [CrossRef]
  17. Gilbert, J.K. Models and modelling: Routes to more authentic science education. Int. J. Sci. Math. Educ. 2004, 2, 115–130. [Google Scholar] [CrossRef]
  18. Luisi, P.-L.; Thomas, R.M. The pictographic molecular paradigm. Naturwissenschaften 1990, 77, 67–74. [Google Scholar] [CrossRef]
  19. Giere, R.N. An agent-based conception of models and scientific representation. Synthese 2010, 172, 269–281. [Google Scholar] [CrossRef]
  20. Pedaste, M.; Mäeots, M.; Siiman, L.A.; De Jong, T.; Van Riesen, S.A.; Kamp, E.T.; Manoli, C.C.; Zacharia, Z.C.; Tsourlidaki, E. Phases of inquiry-based learning: Definitions and the inquiry cycle. Educ. Res. Rev. 2015, 14, 47–61. [Google Scholar] [CrossRef] [Green Version]
  21. Chandler, P.; Sweller, J. Cognitive Load Theory and the Format of Instruction. Cogn. Instr. 1991, 8, 293–332. [Google Scholar] [CrossRef]
  22. Sweller, J.; Ayres, P.; Kalyuga, S. Cognitive Load Theory, 1st ed.; Springer Science+Business Media LLC: New York, NY, USA, 2011; ISBN 978-1-4419-8125-7. [Google Scholar]
  23. Sweller, J. Element interactivity and intrinsic, extraneous, and germane cognitive load. Educ. Psychol. Rev. 2010, 22, 123–138. [Google Scholar] [CrossRef]
  24. Paas, F.G.W.C.; Sweller, J. Implication of cognitive load theory for multimedia learning. In Cambridge Handbook of Multimedia Learning, 2nd ed.; Mayer, R.E., Ed.; Cambridge University Press: Cambridge, UK, 2014; pp. 27–42. [Google Scholar]
  25. Mayer, R.E.; Fiorella, L. Principles for reducing extraneous processing in multimedia learning: Coherence, signaling, redundancy, spatial contiguity, and temporal contiguity principle. In Cambridge Handbook of Multimedia Learning, 2nd ed.; Mayer, R.E., Ed.; Cambridge University Press: Cambridge, UK, 2014; pp. 279–315. [Google Scholar]
  26. Höffler, T.N.; Leutner, D. Instructional animation versus static pictures: A meta-analysis. Learn. Instr. 2007, 17, 722–738. [Google Scholar] [CrossRef]
  27. Berney, S.; Bétrancourt, M. Does animation enhance learning? A meta-analysis. Comput. Educ. 2016, 101, 150–167. [Google Scholar] [CrossRef] [Green Version]
  28. Milgram, P.; Takemura, H.; Utsumi, A.; Kishino, F. Augmented reality: A class of displays on the reality-virtuality continuum. Proc. SPIE-Int. Soc. Opt. Eng. 1994, 2351, 282–292. [Google Scholar] [CrossRef]
  29. Akçayır, M.; Akçayır, G. Advantages and challenges associated with augmented reality for education: A systematic review of the literature. Educ. Res. Rev. 2017, 20, 1–11. [Google Scholar] [CrossRef]
  30. Garzón, J.; Acevedo, J. Meta-analysis of the impact of augmented reality on students’ learning gains. Educ. Res. Rev. 2019, 27, 244–260. [Google Scholar] [CrossRef]
  31. Mazzuco, A.; Krassmann, A.L.; Reategui, E.; Gomes, R.S. A systematic review of augmented reality in chemistry education. Rev. Educ. 2022, 10, e3325. [Google Scholar] [CrossRef]
  32. Altmeyer, K.; Kapp, S.; Thees, M.; Malone, S.; Kuhn, J.; Brünken, R. The use of augmented reality to foster conceptual knowledge acquisition in STEM laboratory courses—Theoretical background and empirical results. Br. J. Educ. Technol. 2020, 51, 611–628. [Google Scholar] [CrossRef]
  33. Thees, M.; Kapp, S.; Strzys, M.P.; Beil, F.; Lukowicz, P.; Kuhn, J. Effects of augmented reality on learning and cognitive load in university physics laboratory courses. Comput. Hum. Behav. 2020, 108, 106316. [Google Scholar] [CrossRef]
  34. Liu, Q.; Yu, S.; Chen, W.; Wang, Q.; Xu, S. The effects of an augmented reality based magnetic experimental tool on students’ knowledge improvement and cognitive load. J. Comput. Assist. Learn. 2021, 37, 645–656. [Google Scholar] [CrossRef]
  35. Habig, S. Who can benefit from augmented reality in chemistry? Sex differences in solving stereochemistry problems using augmented reality. Br. J. Educ. Technol. 2020, 51, 629–644. [Google Scholar] [CrossRef] [Green Version]
  36. Keller, S.; Rumann, S.; Habig, S. Cognitive load implications for Augmented Reality supported chemistry learning. Information 2021, 12, 96. [Google Scholar] [CrossRef]
  37. Cai, S.; Wang, X.; Chiang, F.-K. A case study of augmented reality simulation system application in a chemistry course. Comput. Hum. Behav. 2014, 37, 31–40. [Google Scholar] [CrossRef] [Green Version]
  38. Domínguez Alfaro, J.L.; Gantois, S.; Blattgerste, J.; de Croon, R.; Verbert, K.; Pfeiffer, T.; van Puyvelde, P. Mobile augmented reality laboratory for learning acid–base titration. J. Chem. Educ. 2022, 99, 531–537. [Google Scholar] [CrossRef]
  39. Zhang, Z.; Li, Z.; Han, M.; Su, Z.; Li, W.; Pan, Z. An augmented reality-based multimedia environment for experimental education. Multimed. Tools Appl. 2021, 80, 575–590. [Google Scholar] [CrossRef]
  40. Koltun, W.L. Precision space-filling atomic models. Biopolymers 1965, 3, 665–679. [Google Scholar] [CrossRef]
  41. Heller, K.A.; Perleth, C. Kognitiver Fähigkeitstest für 4. bis 12. Klassen (Cognitive Abilities Test for Year 4 to 12); Beltz Testgesellschaft: Göttingen, Germany, 2000. [Google Scholar]
  42. Yoon, S.Y. Psychometric Properties of the Revised Purdue Spatial Visualization Tests: Visualization of Rotations (the Revised PSVT:R). Ph.D. Thesis, Purdue University, West Lafayette, IN, USA, 2011. [Google Scholar]
  43. Bodner, G.M.; Guay, R.B. The purdue visualization of rotations test. Chem. Educ. 1997, 2, 1–17. [Google Scholar] [CrossRef]
  44. Brooke, J. SUS: A ‘quick and dirty’ usability scale. In Usability Evaluation in Industry, 1st ed.; Jordan, P.W., Thomas, B., Weerdmeester, B.A., Eds.; Taylor & Francis: London, UK, 1996; pp. 189–194. [Google Scholar]
  45. Bangor, A.; Kortum, P.; Miller, J. Determining what individual SUS scores mean: Adding an adjective rating scale. J. Usability Stud. 2009, 4, 114–123. [Google Scholar]
  46. Ropohl, M. Modellierung von Schülerkompetenzen im Basiskonzept Chemische Reaktion. Entwicklung und Analyse von Testaufgaben (Modeling Student Competencies in the Basic Concept of Chemical Reaction. Development and Analysis of Test Items); Logos: Berlin, Germany, 2010. [Google Scholar]
  47. Kehne, F. Analyse des Transfers von Kontextualisiert Erworbenem Wissen im Fach Chemie (Analysis of the Transfer of Contextualized Acquired Knowledge in Chemistry); Logos: Berlin, Germany, 2019. [Google Scholar]
  48. Akman, P. Konkret Oder Abstrakt?: Externe Repräsentationen bei der Informationsentnahme und im Modellierprozess aus Lernerperspektive (Concrete or Abstract?: External Representations in Information Retrieval and in the Modeling Process from the Learner’s Perspective). Ph.D. Thesis, Paderborn University, Paderborn, Germany, 2020. [Google Scholar]
  49. Klepsch, M.; Schmitz, F.; Seufert, T. Development and validation of two instruments measuring intrinsic, extraneous, and germane cognitive load. Front. Psychol. 2017, 8, 1997. [Google Scholar] [CrossRef] [Green Version]
  50. Field, A.P. Discovering Statistics Using IBM SPSS Statistics, 5th ed.; SAGE Publications: London, UK, 2018; ISBN 9781526419514. [Google Scholar]
  51. Cohen, J. A power primer. Psychol. Bull. 1992, 112, 155–159. [Google Scholar] [CrossRef] [PubMed]
  52. Cohen, J. Statistical Power Analysis for the Behavioral Sciences; Lawrence Erlbaum Associates: Hillsdale, NJ, USA, 1988. [Google Scholar]
  53. Buchner, J.; Kerres, M. Media comparison studies dominate comparative research on augmented reality in education. Comput. Educ. 2023, 195, 104711. [Google Scholar] [CrossRef]
Figure 1. Study design. The instruments used are explained in the Instruments section.
Mti 07 00009 g001
Figure 2. Example from the filmstrip of the first experiment (translated into English).
Mti 07 00009 g002
Figure 3. (a) Main menu of the AR app with the different environments to select (translated into English); (b) AR app during the experiment.
Mti 07 00009 g003
Figure 4. Mean scores in domain-specific knowledge for the different groups.
Mti 07 00009 g004
Table 1. Internal consistency of the relevant variables.
Scale𝛂
Domain-specific knowledge
-
Pre-test
-
Post-test

0.705
0.708
Verbal skills 0.498
Mental rotation 0.788
Cognitive load (MP01) 1
-
Intrinsic
-
Germane
-
Extraneous

0.728
0.521
0.675
Cognitive load (MP03) 1
-
Intrinsic
-
Germane
-
Extraneous

0.776
0.590
0.690
System Usability (n = 34) 20.863
1 MP01: measuring point after the first experiment; MP03: measuring point after the second experiment. 2 Only the participants of the AR group had to fill out the corresponding questionnaire.
Table 2. Means, standard deviations and results of the one-way analysis of variance of relevant variables for grouping.
MeasureFilmstripAnimationARF(2, 101)
MSDMSDMSD
Domain-specific knowledge 17.883.107.942.968.222.910.04 (n.s.)
Verbal skills 27.212.567.142.667.032.640.00 (n.s.)
Mental rotation 213.123.3013.174.0013.113.810.13 (n.s.)
1 Maximum score = 16; 2 Maximum score = 20. n.s.: non-significant.
Table 3. Group comparison of mean scores for domain-specific knowledge in pre- and post-test.
GroupMean DifferenceSEp
Filmstrip1.150.450.013
Animation1.630.45<0.001
AR0.460.450.306
Table 4. Results of the t-tests for the different types of cognitive load in the first experiment (MP01).
MeasureNo-ARARt(102)pCohen’s d
MSDMSD
Intrinsic 11.330.482.000.953.94<0.0011.00
Germane4.161.184.451.481.080.2850.22
Extraneous2.181.162.661.321.900.0610.39
1 The t-test was calculated with correction of unequal variances.
Table 5. Results of the t-tests for the different types of cognitive load in the second experiment (MP03).
MeasureNo-ARARt(99)pCohen’s d
MSDMSD
Intrinsic 11.610.852.361.133.450.0010.79
Germane 14.071.434.711.092.530.0130.49
Extraneous1.971.032.641.202.900.0070.61
1 The t-test was calculated with a correction of unequal variances.
Disclaimer/Publisher’s Note: The statements, opinions and data contained in all publications are solely those of the individual author(s) and contributor(s) and not of MDPI and/or the editor(s). MDPI and/or the editor(s) disclaim responsibility for any injury to people or property resulting from any ideas, methods, instructions or products referred to in the content.

