
Relationship between Lightning and Aerosol Optical Depth over the Uttarakhand Region in India: Thermodynamic Perspective


 ,
,
Abstract
:1. Introduction
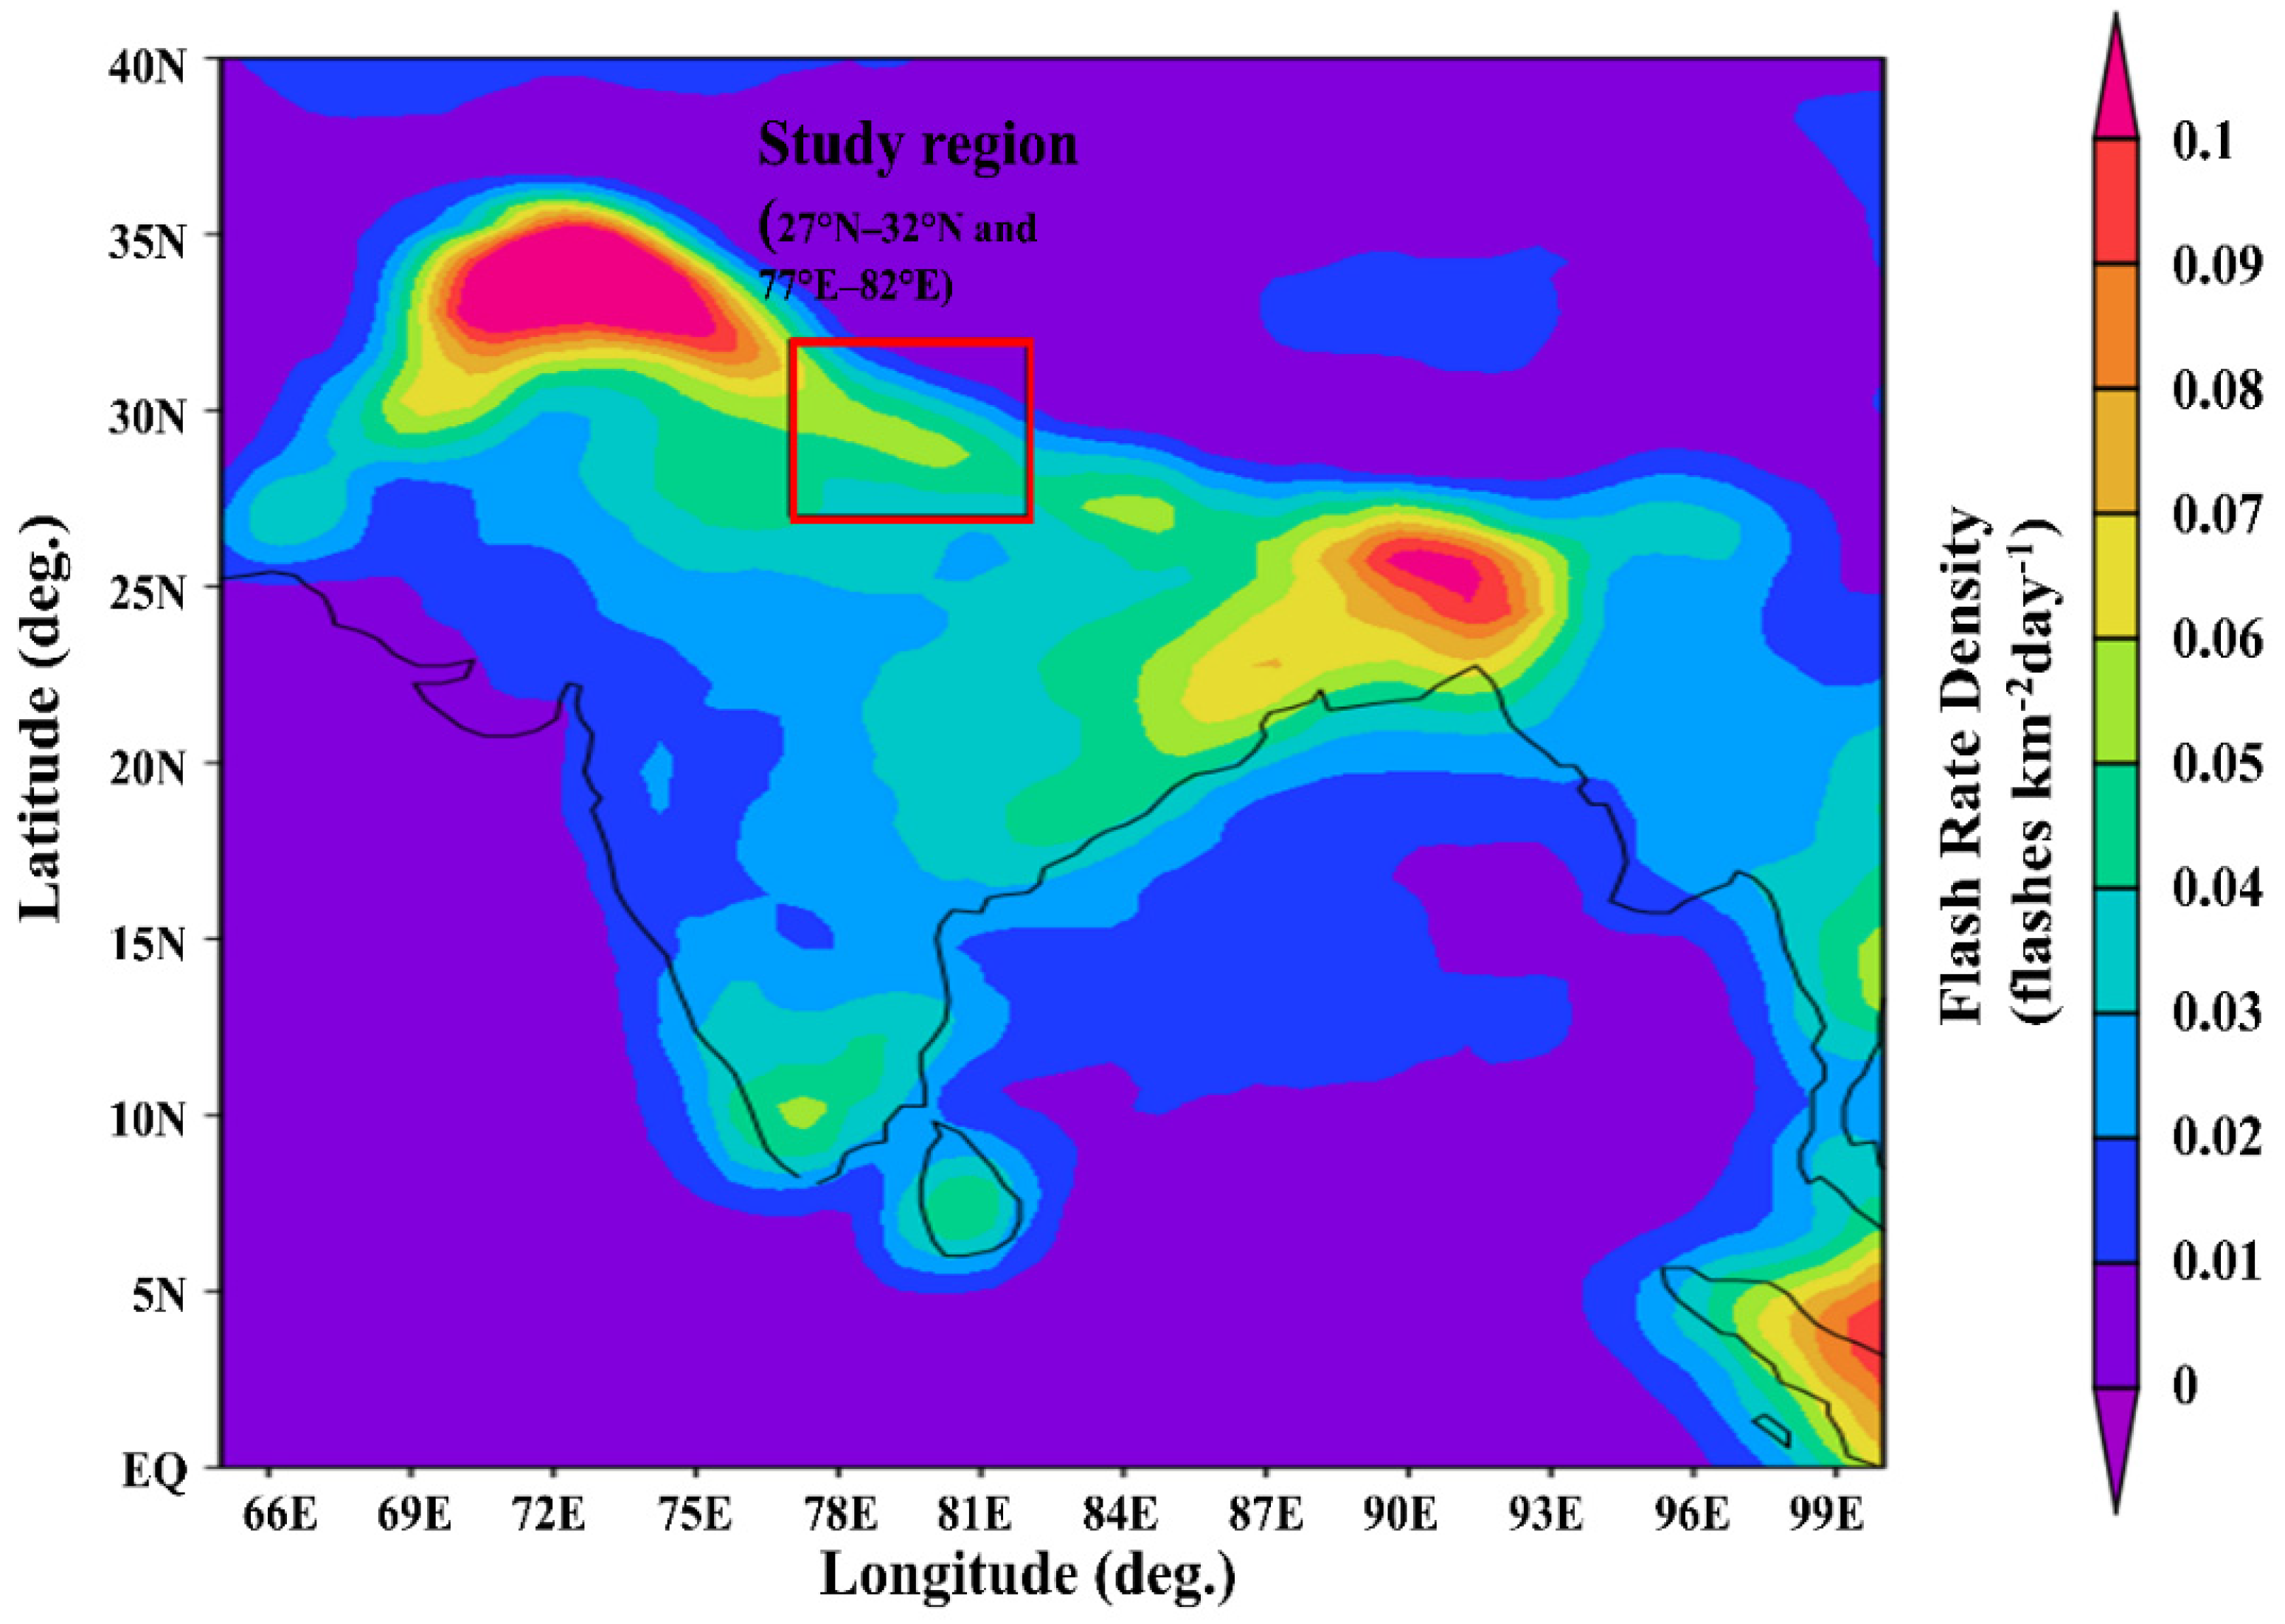
2. Area of Study
3. Data and Methodology
4. Results and Discussion
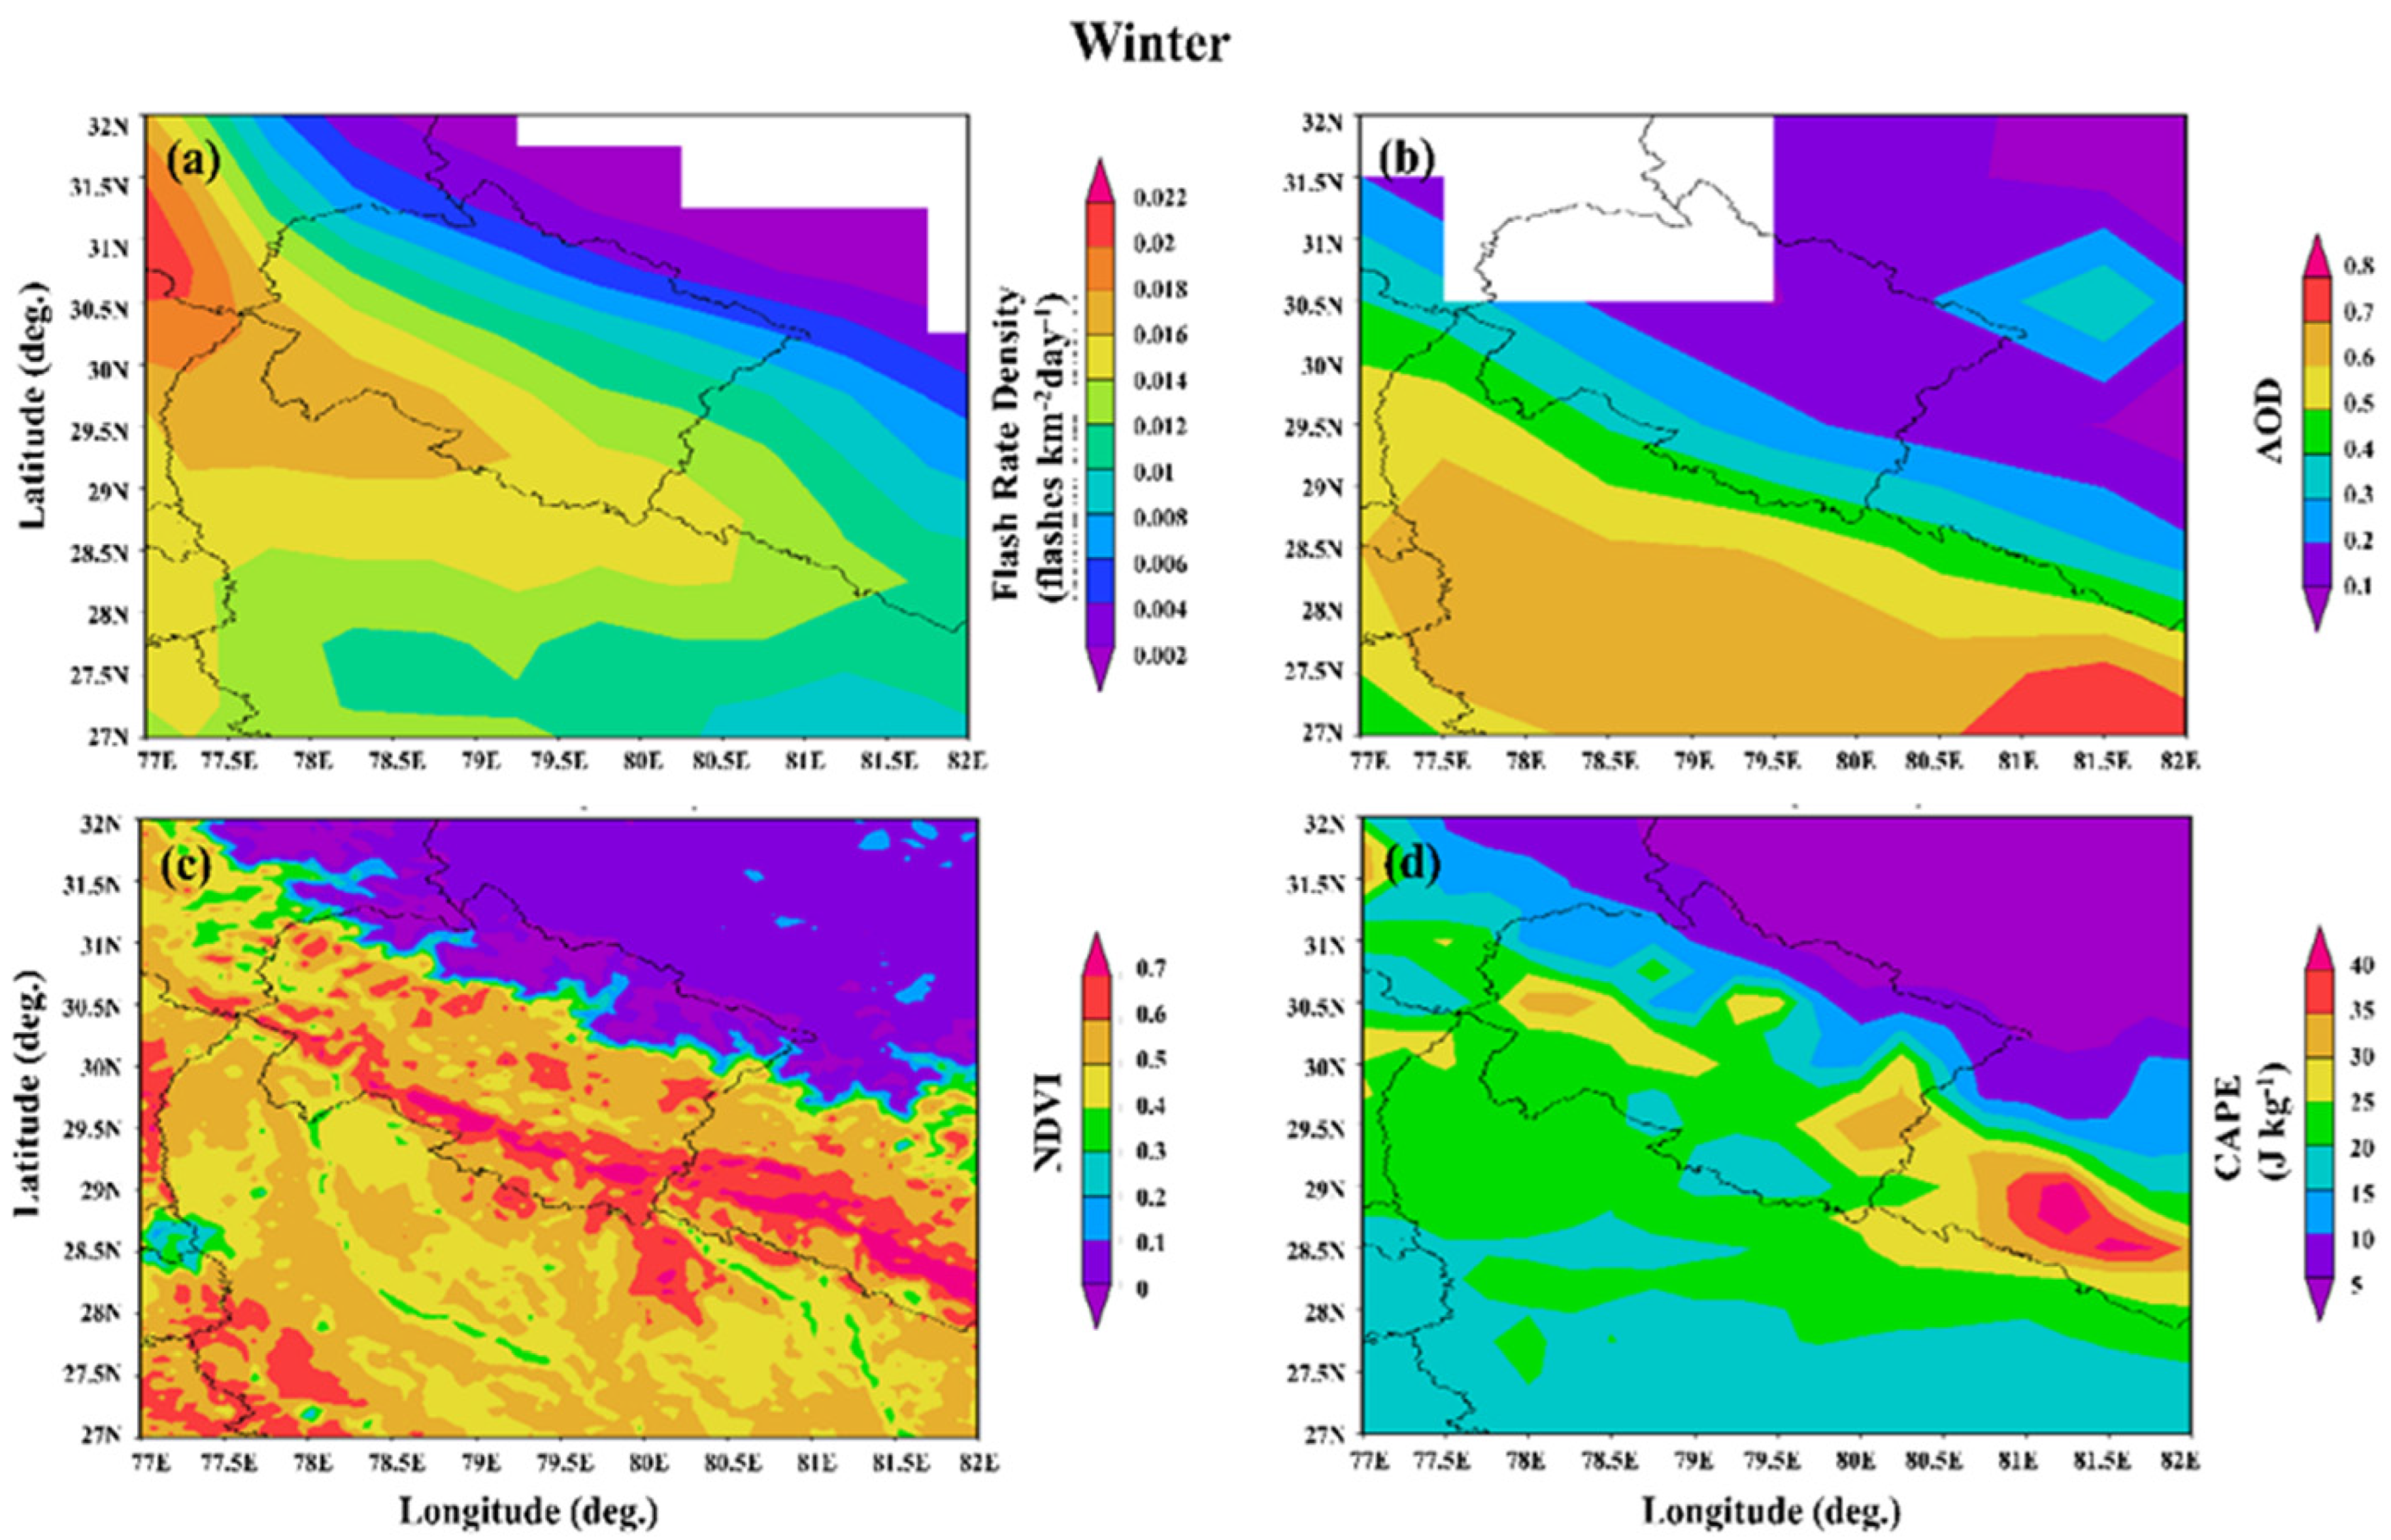
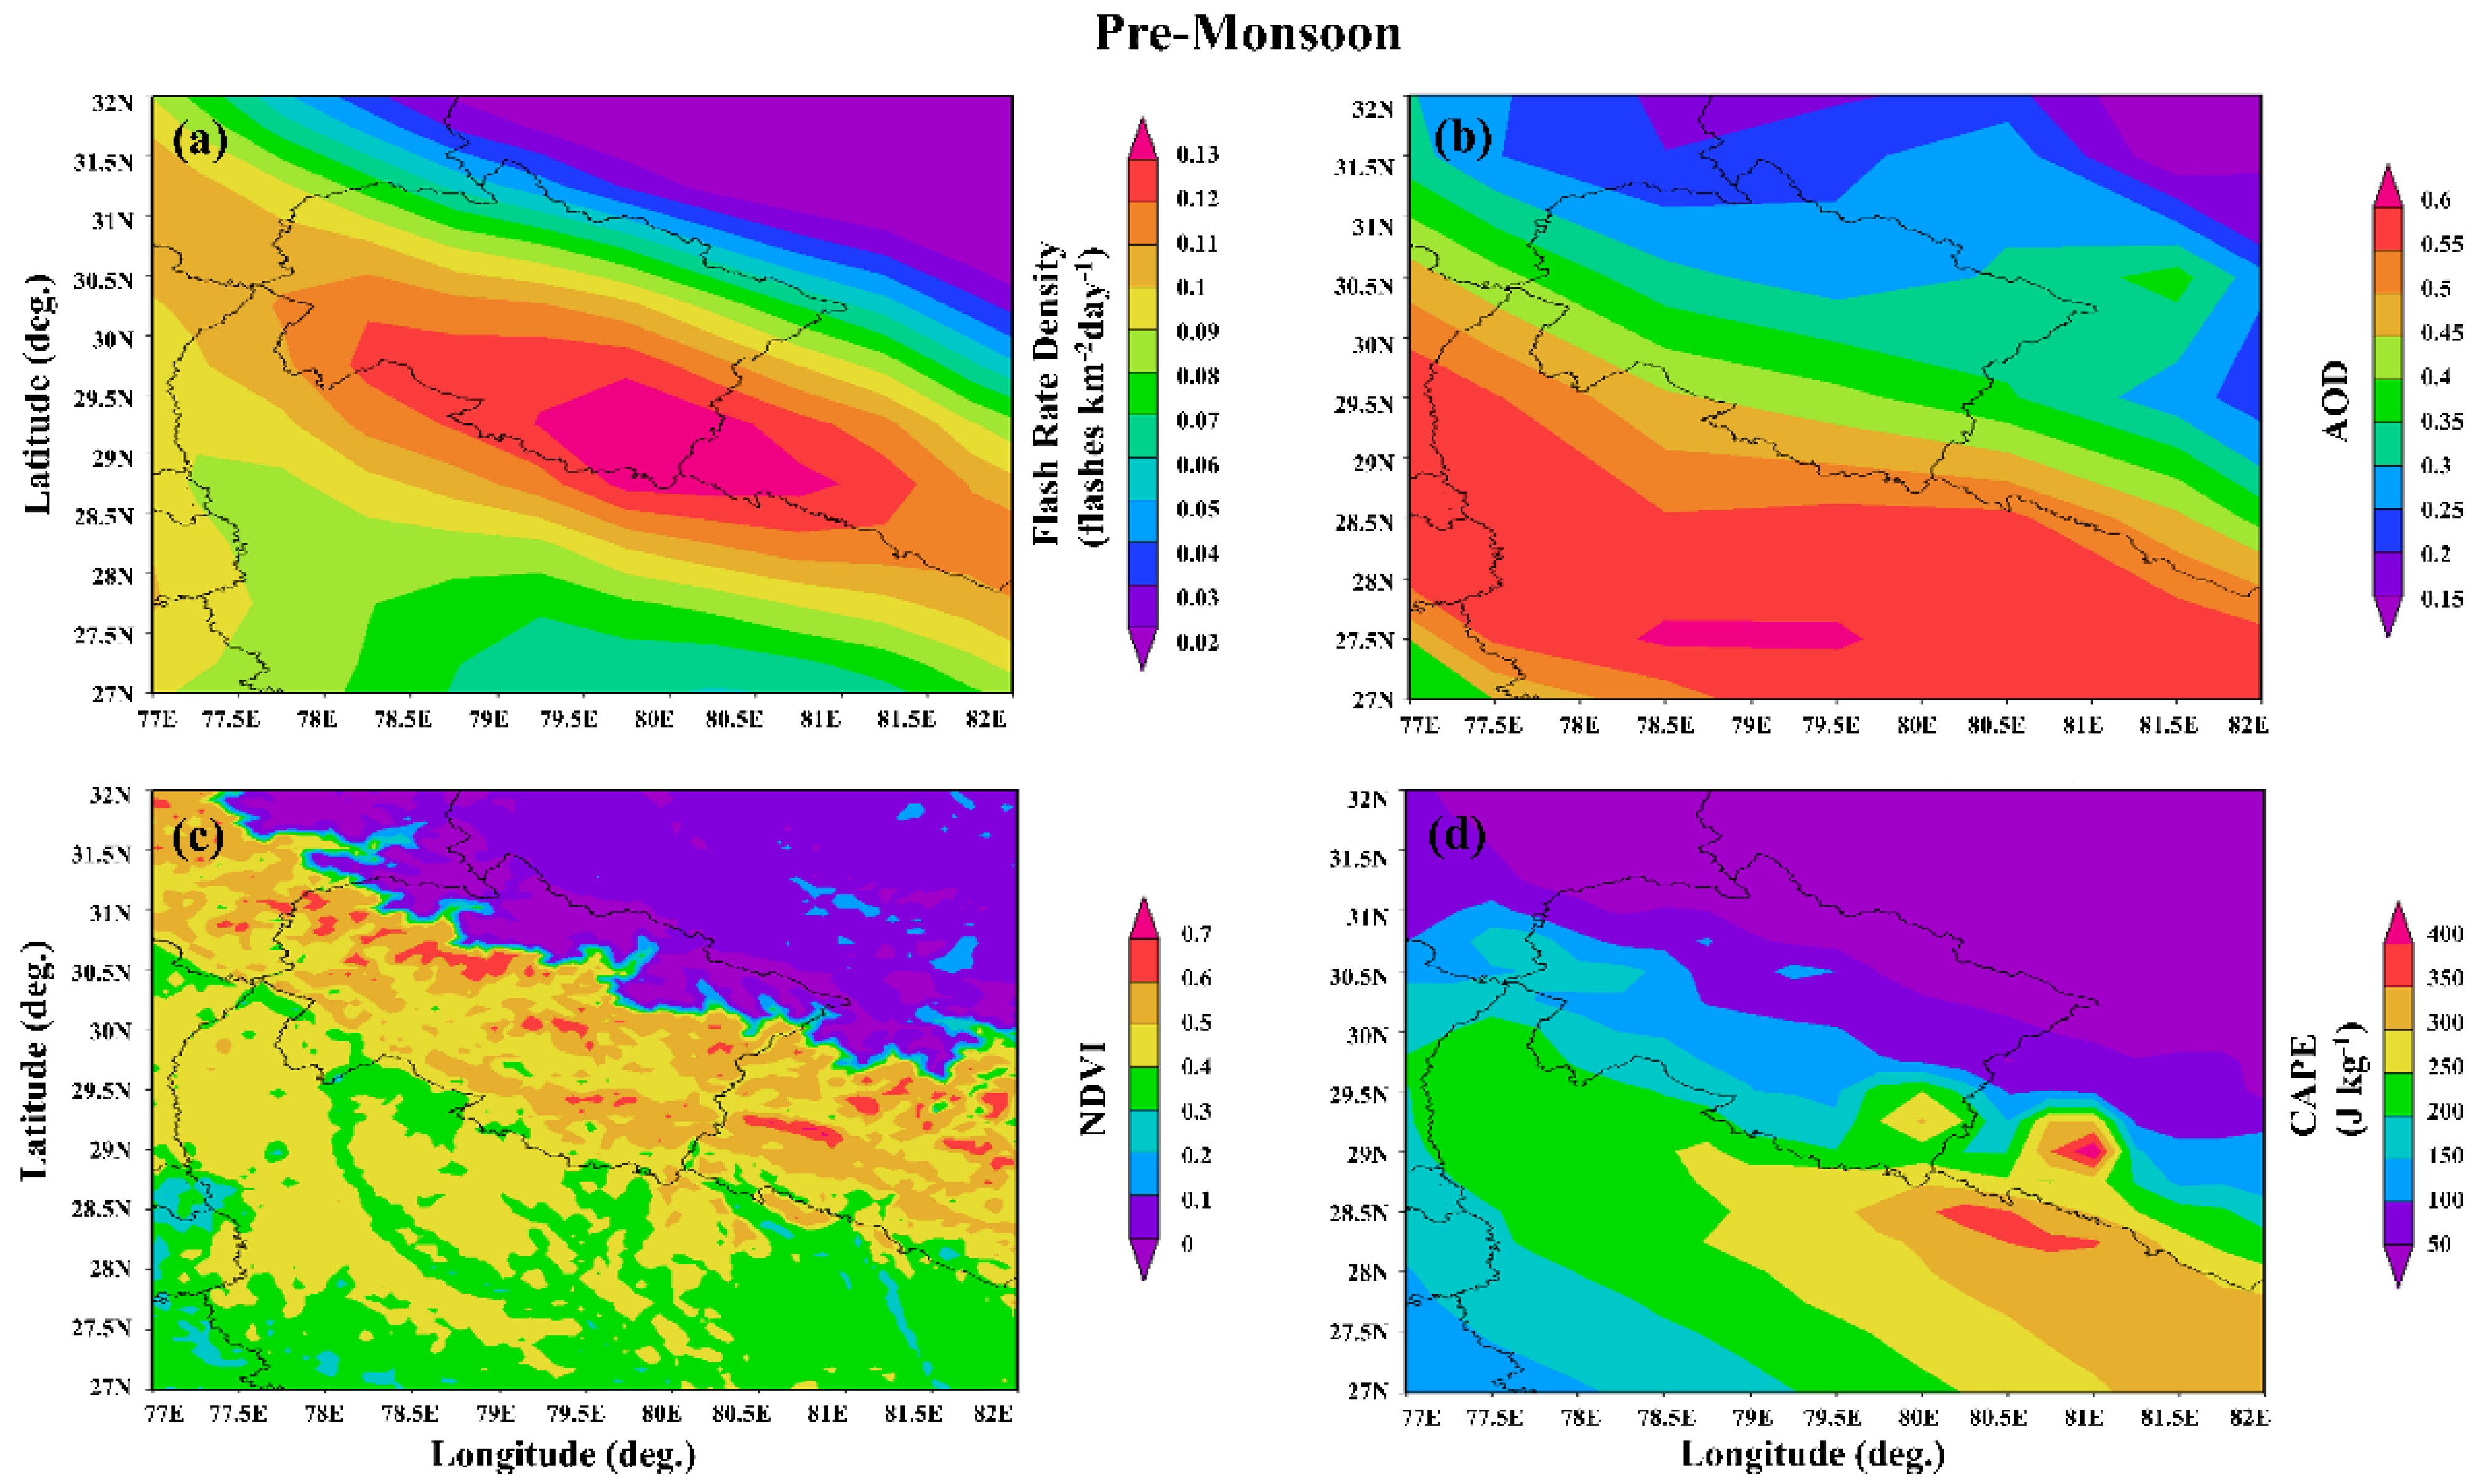
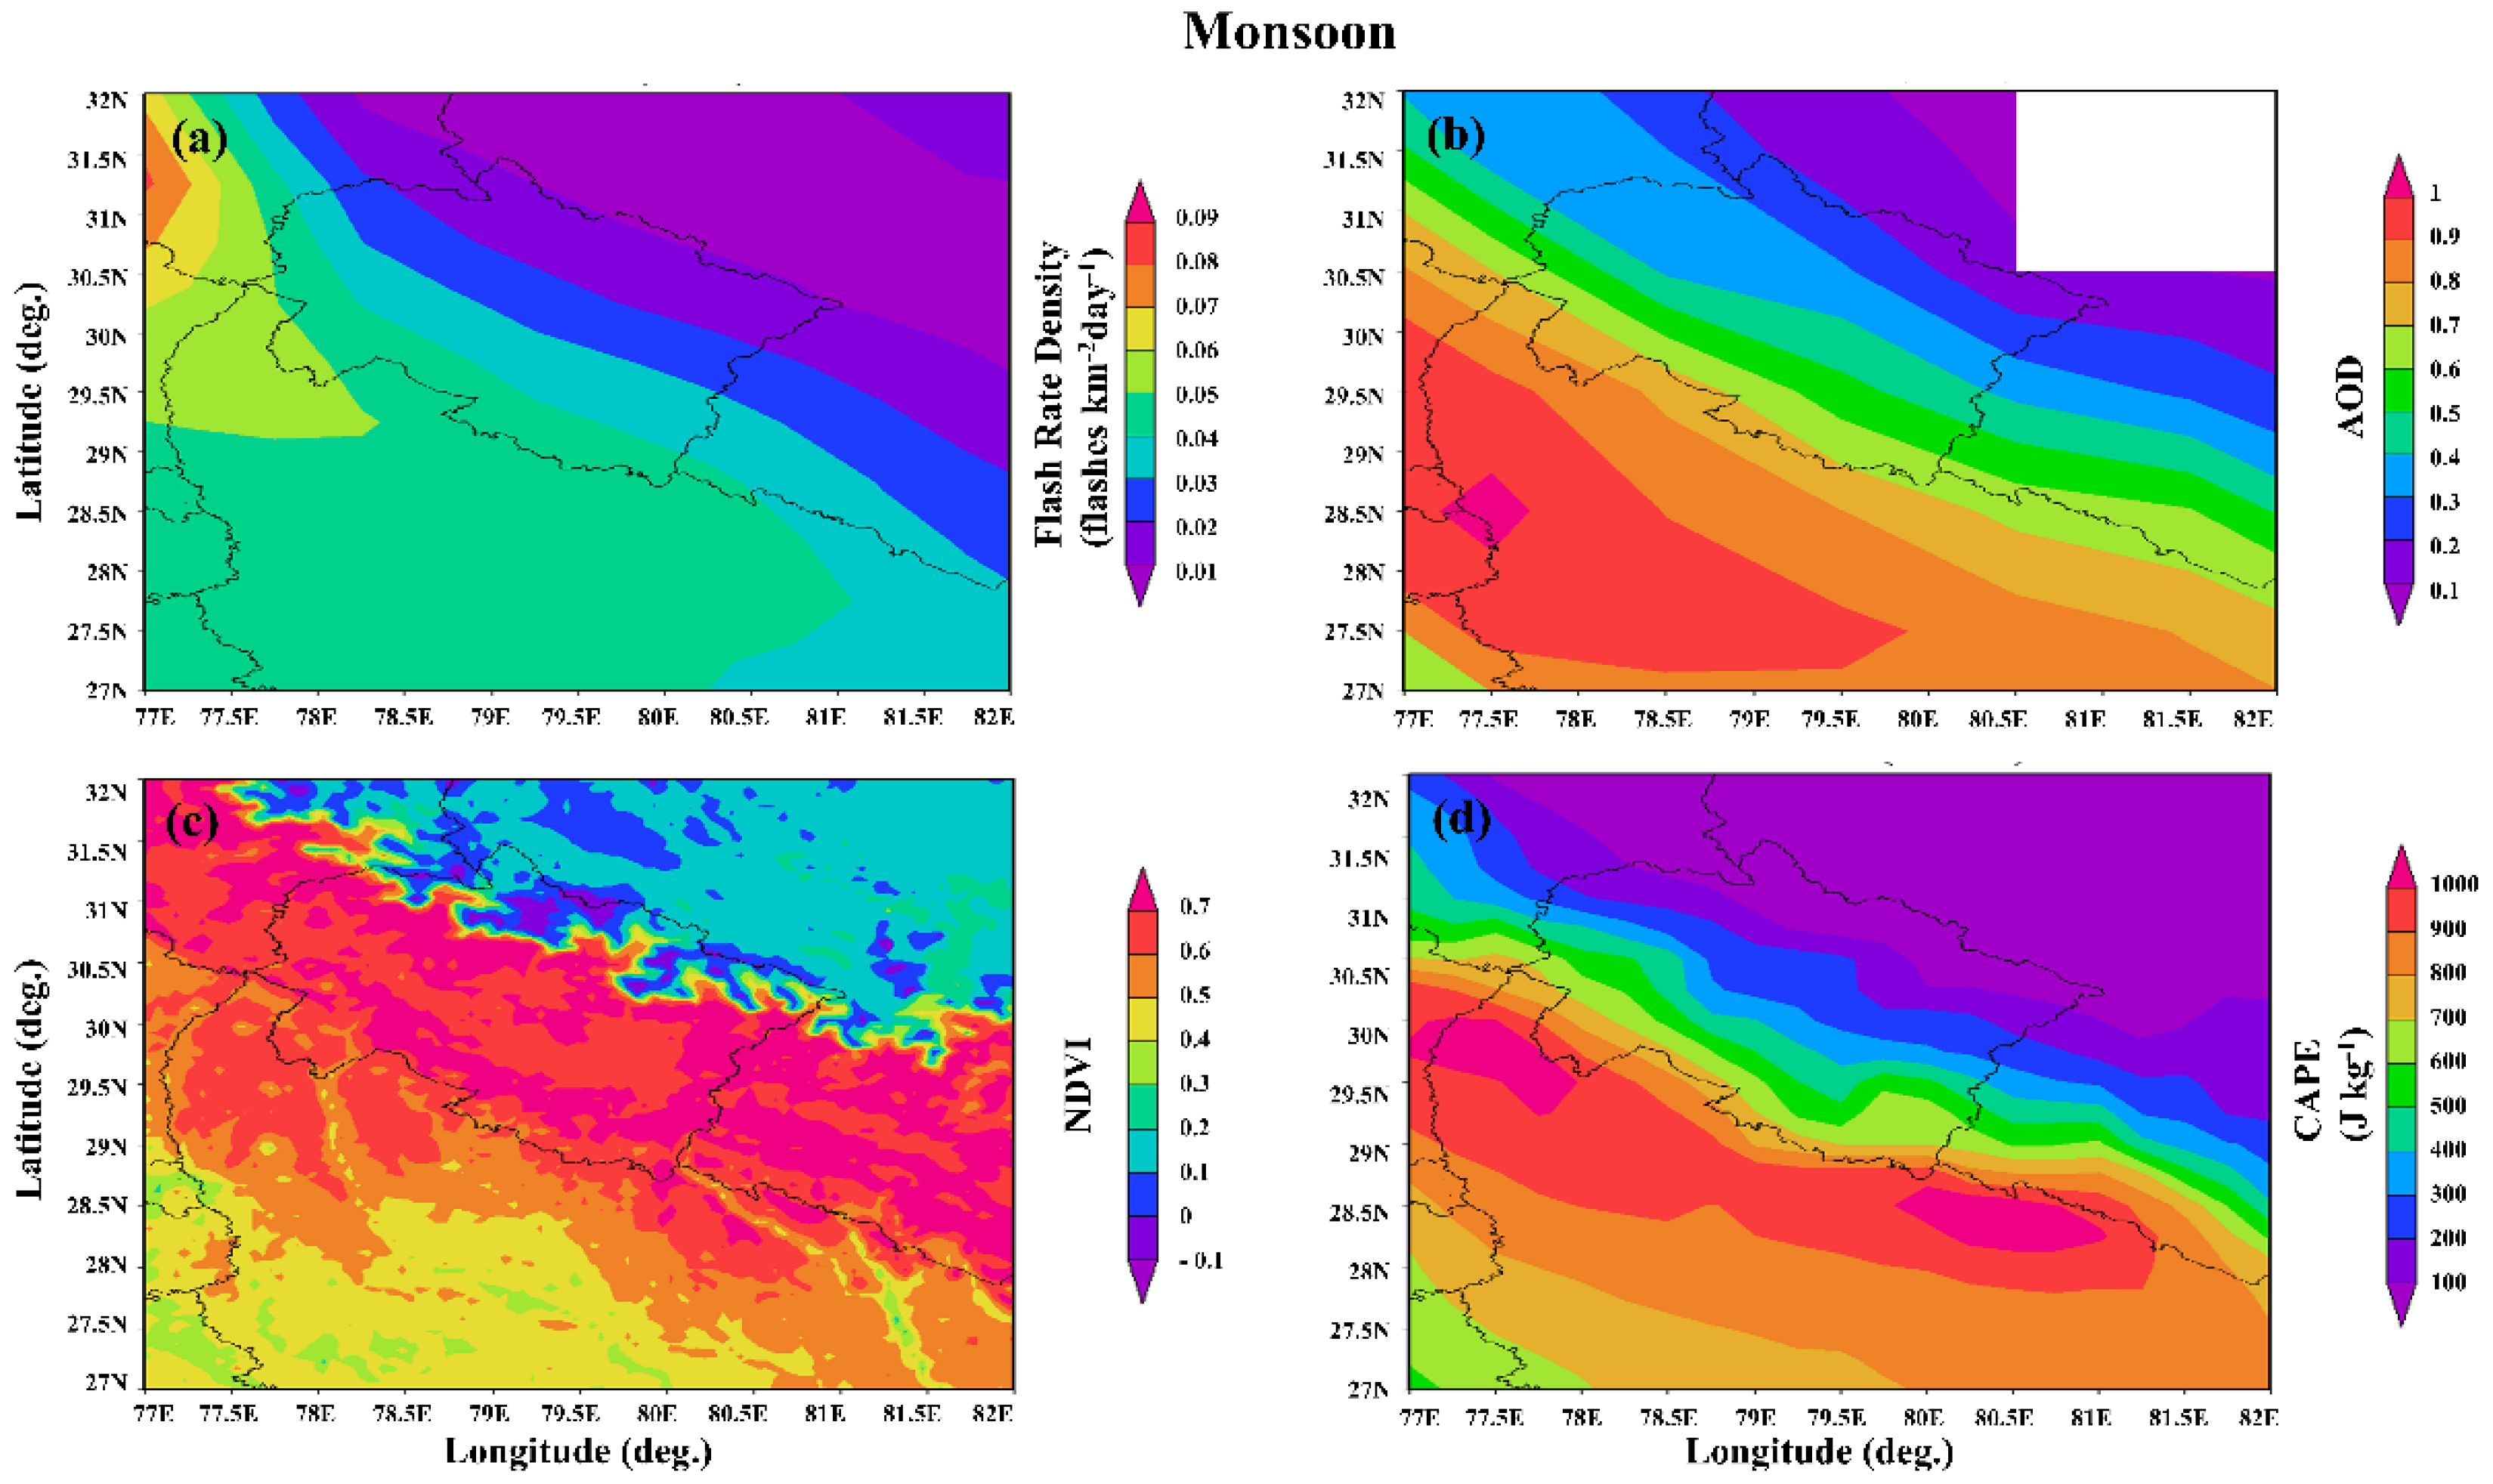
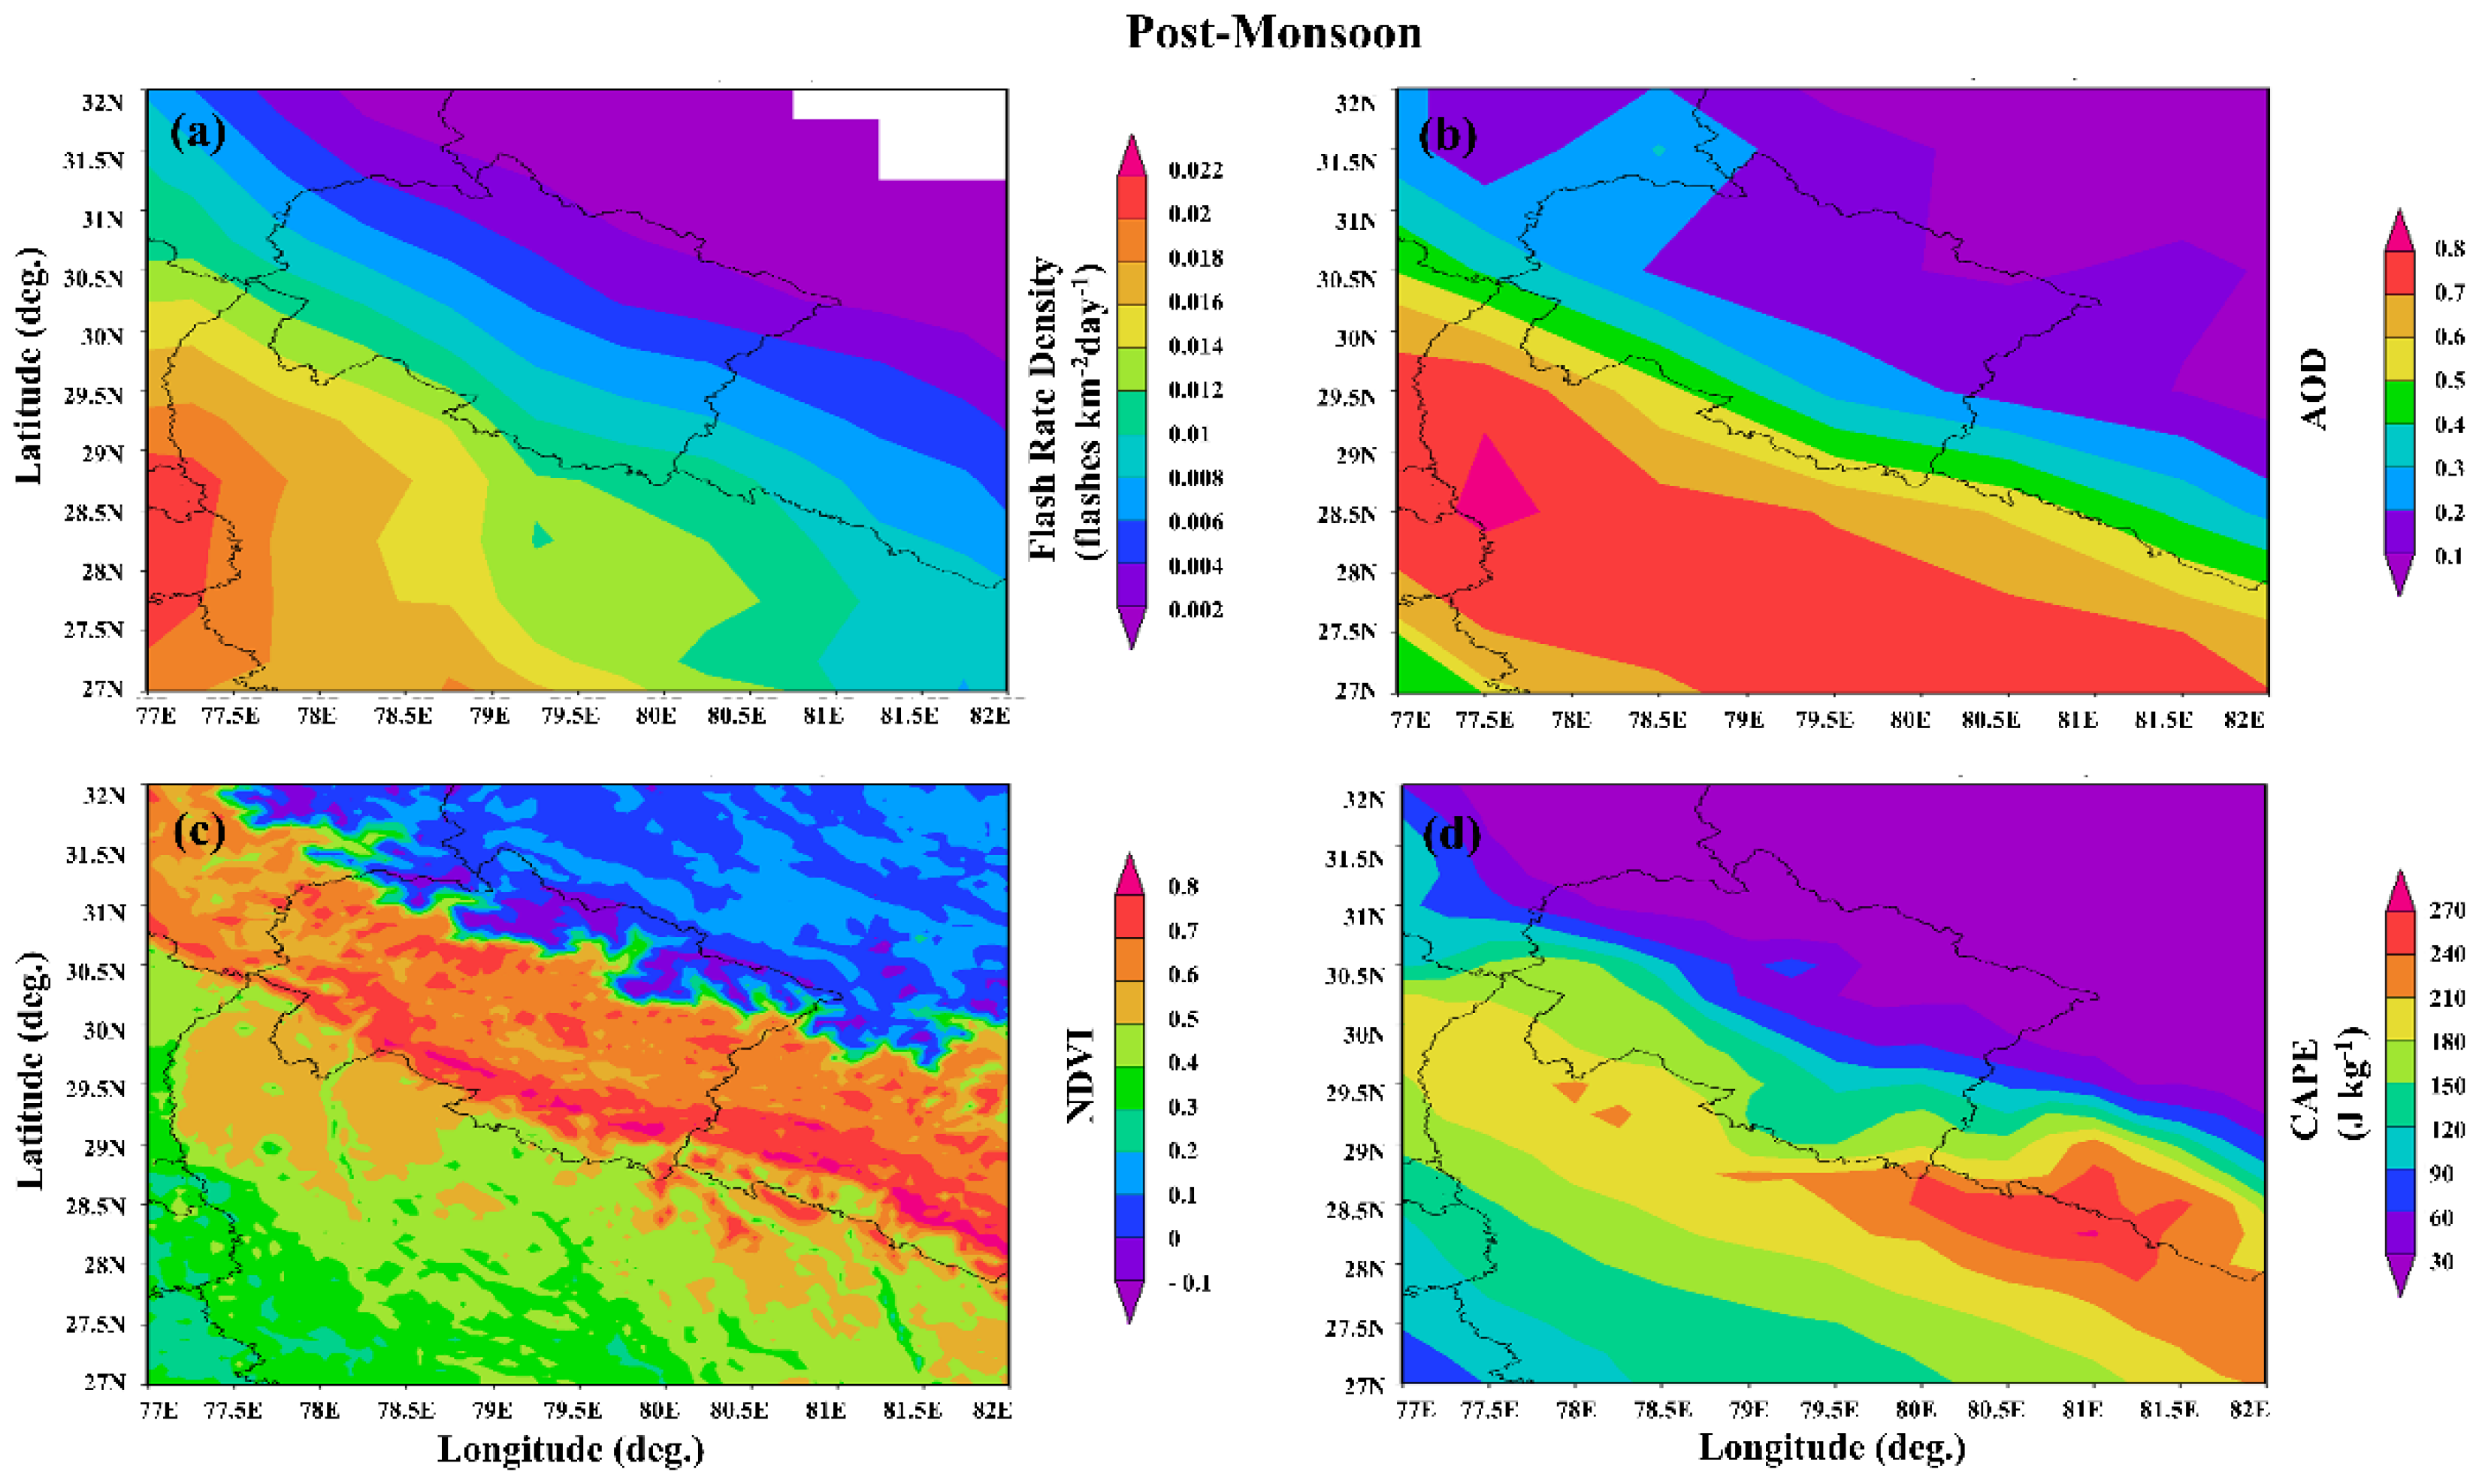
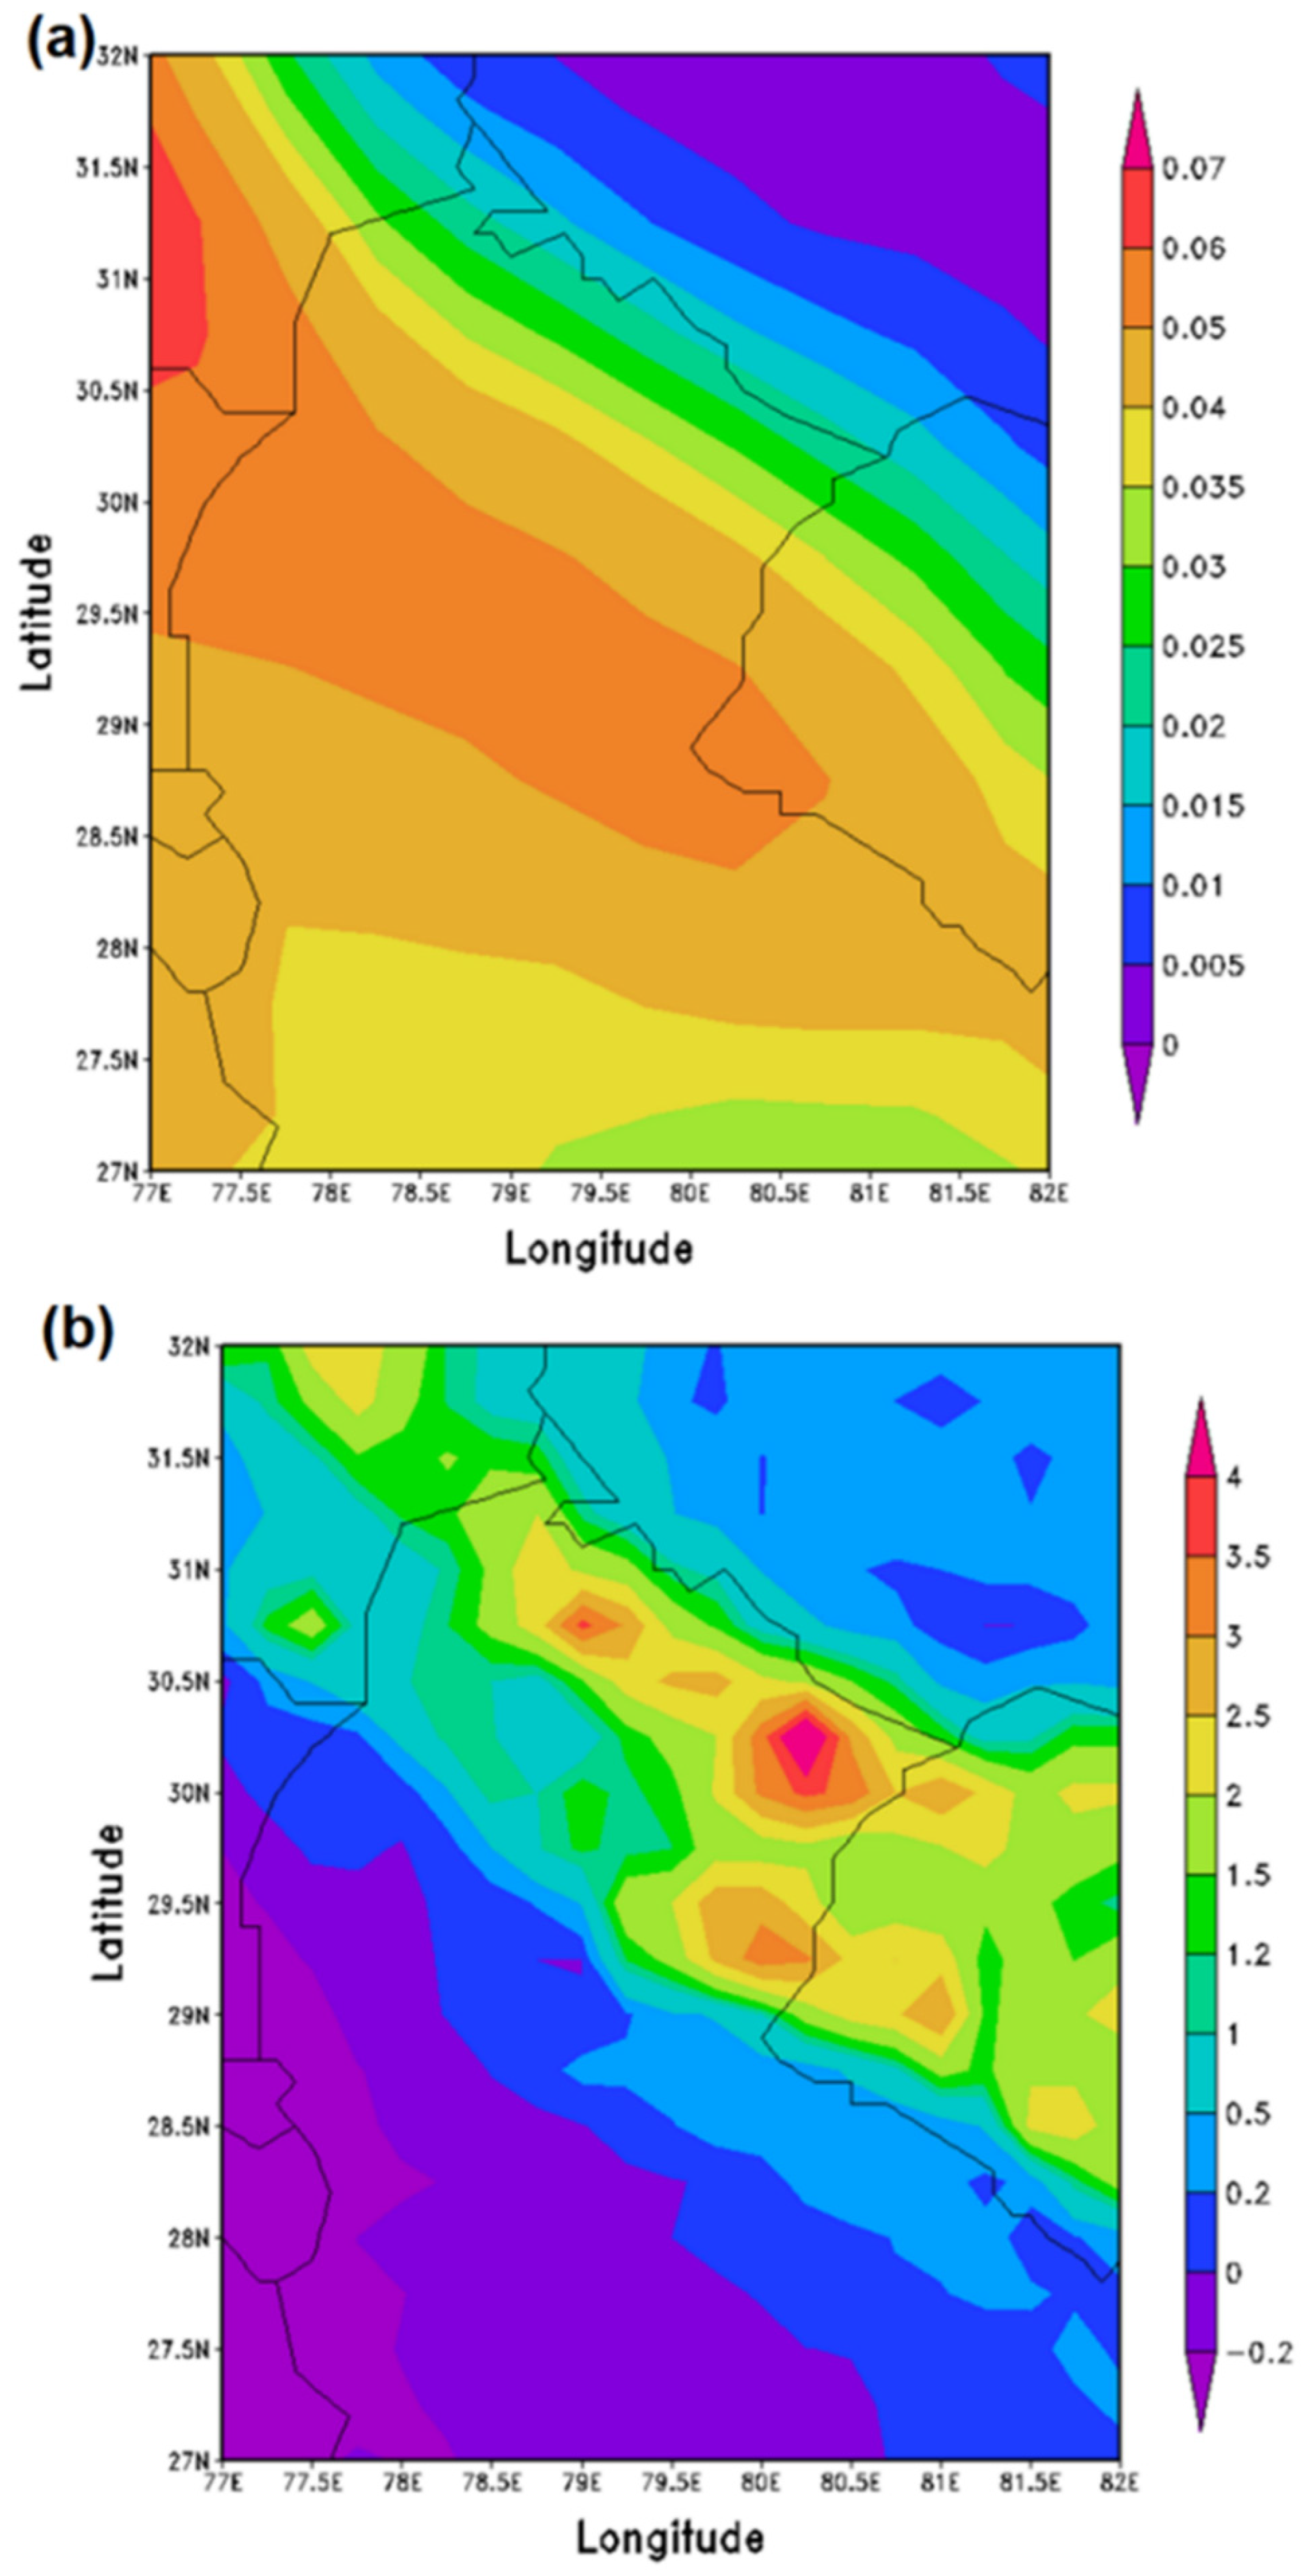
4.1. Spatial Distribution of Lightning
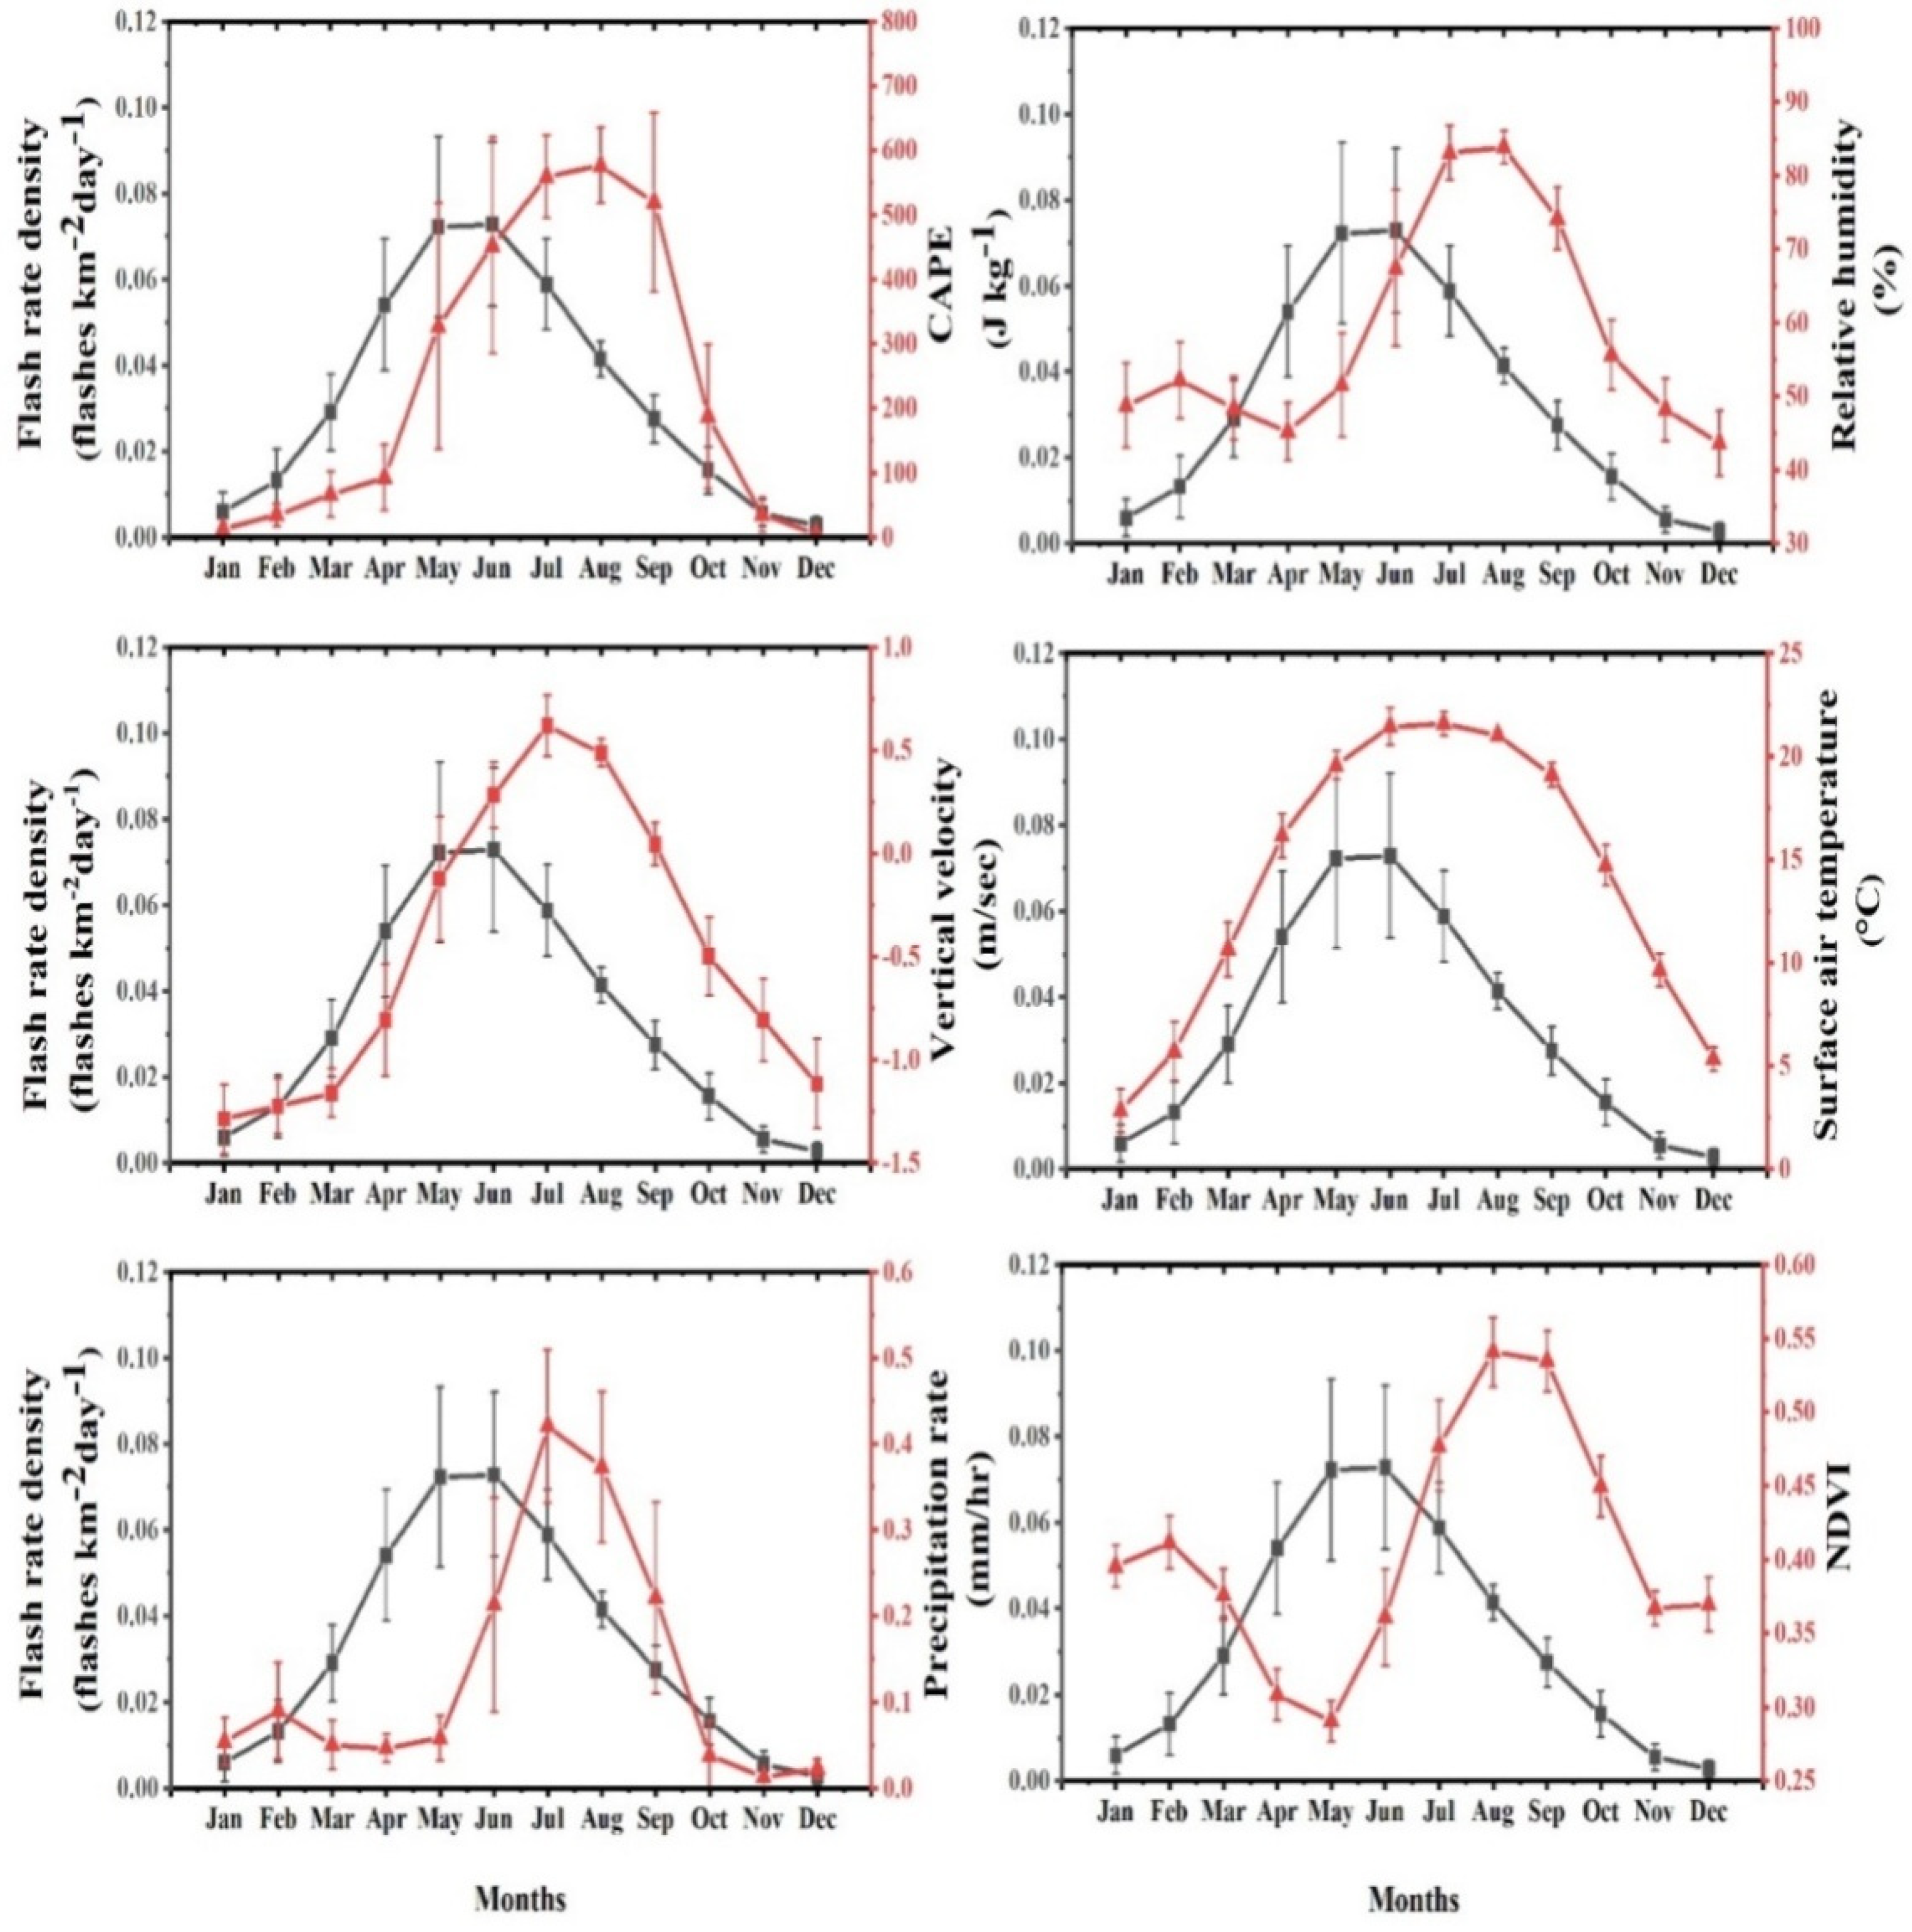
4.2. Dependency of Lightning on Thermodynamic Parameters
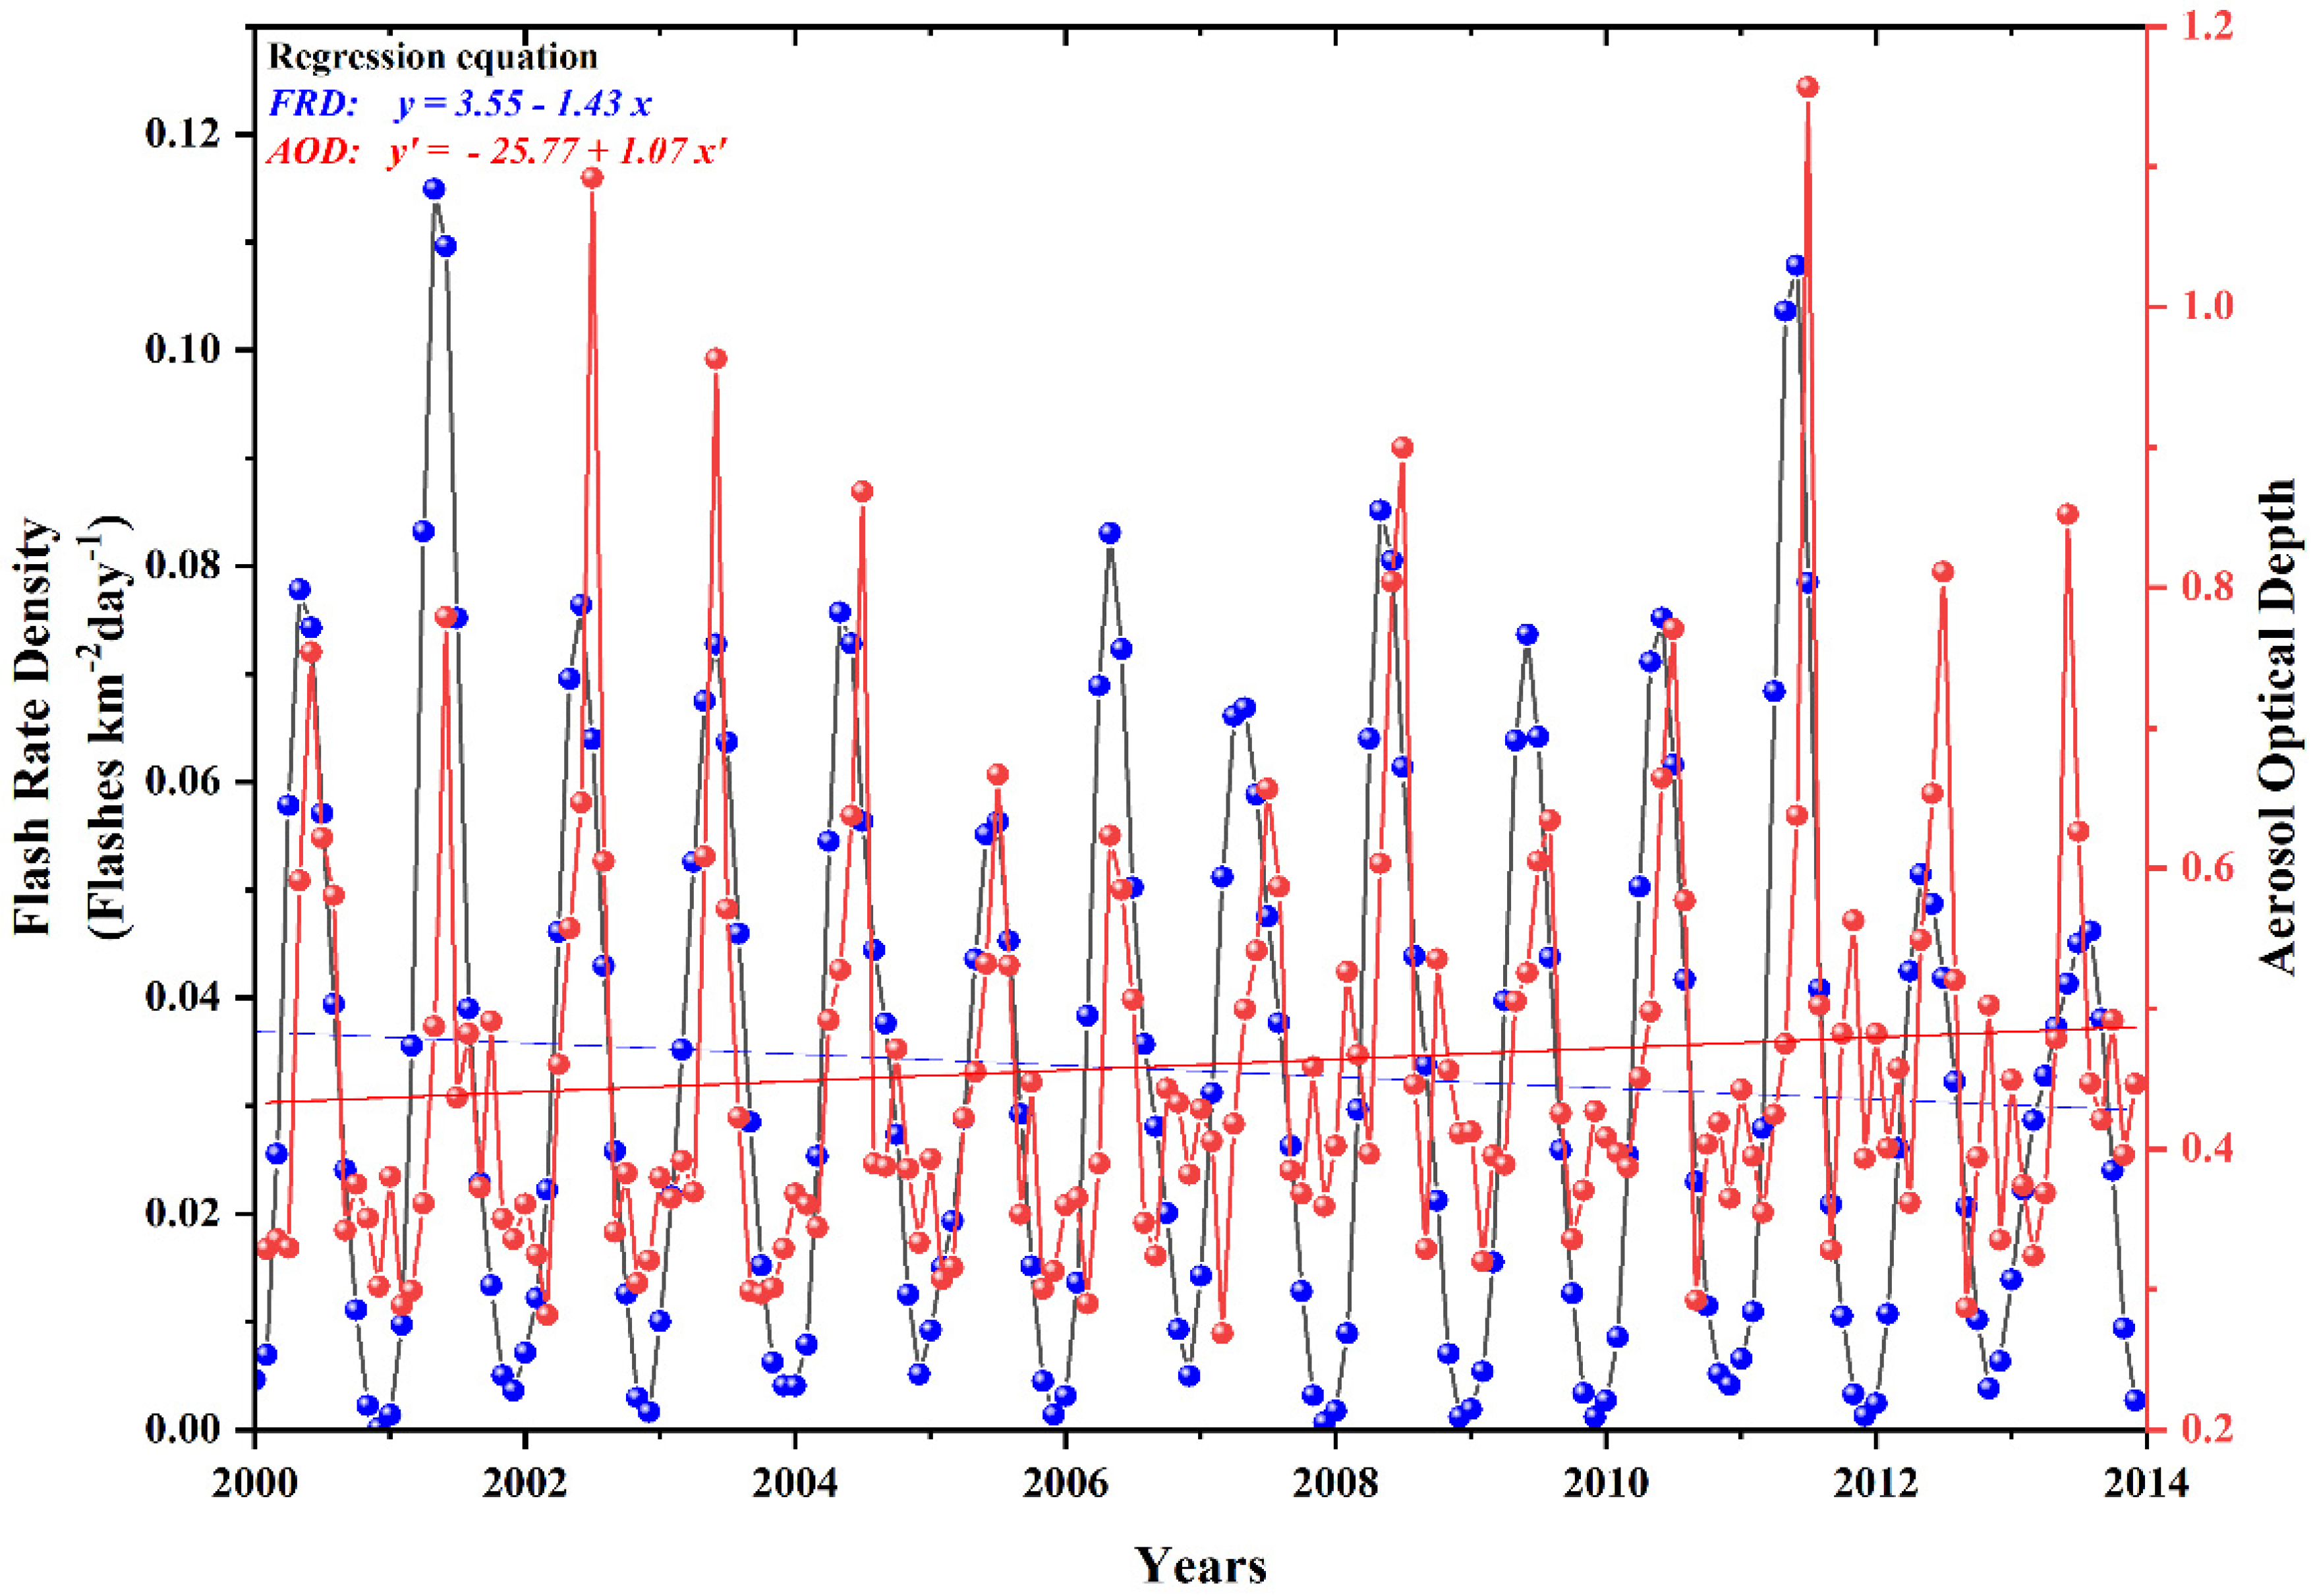
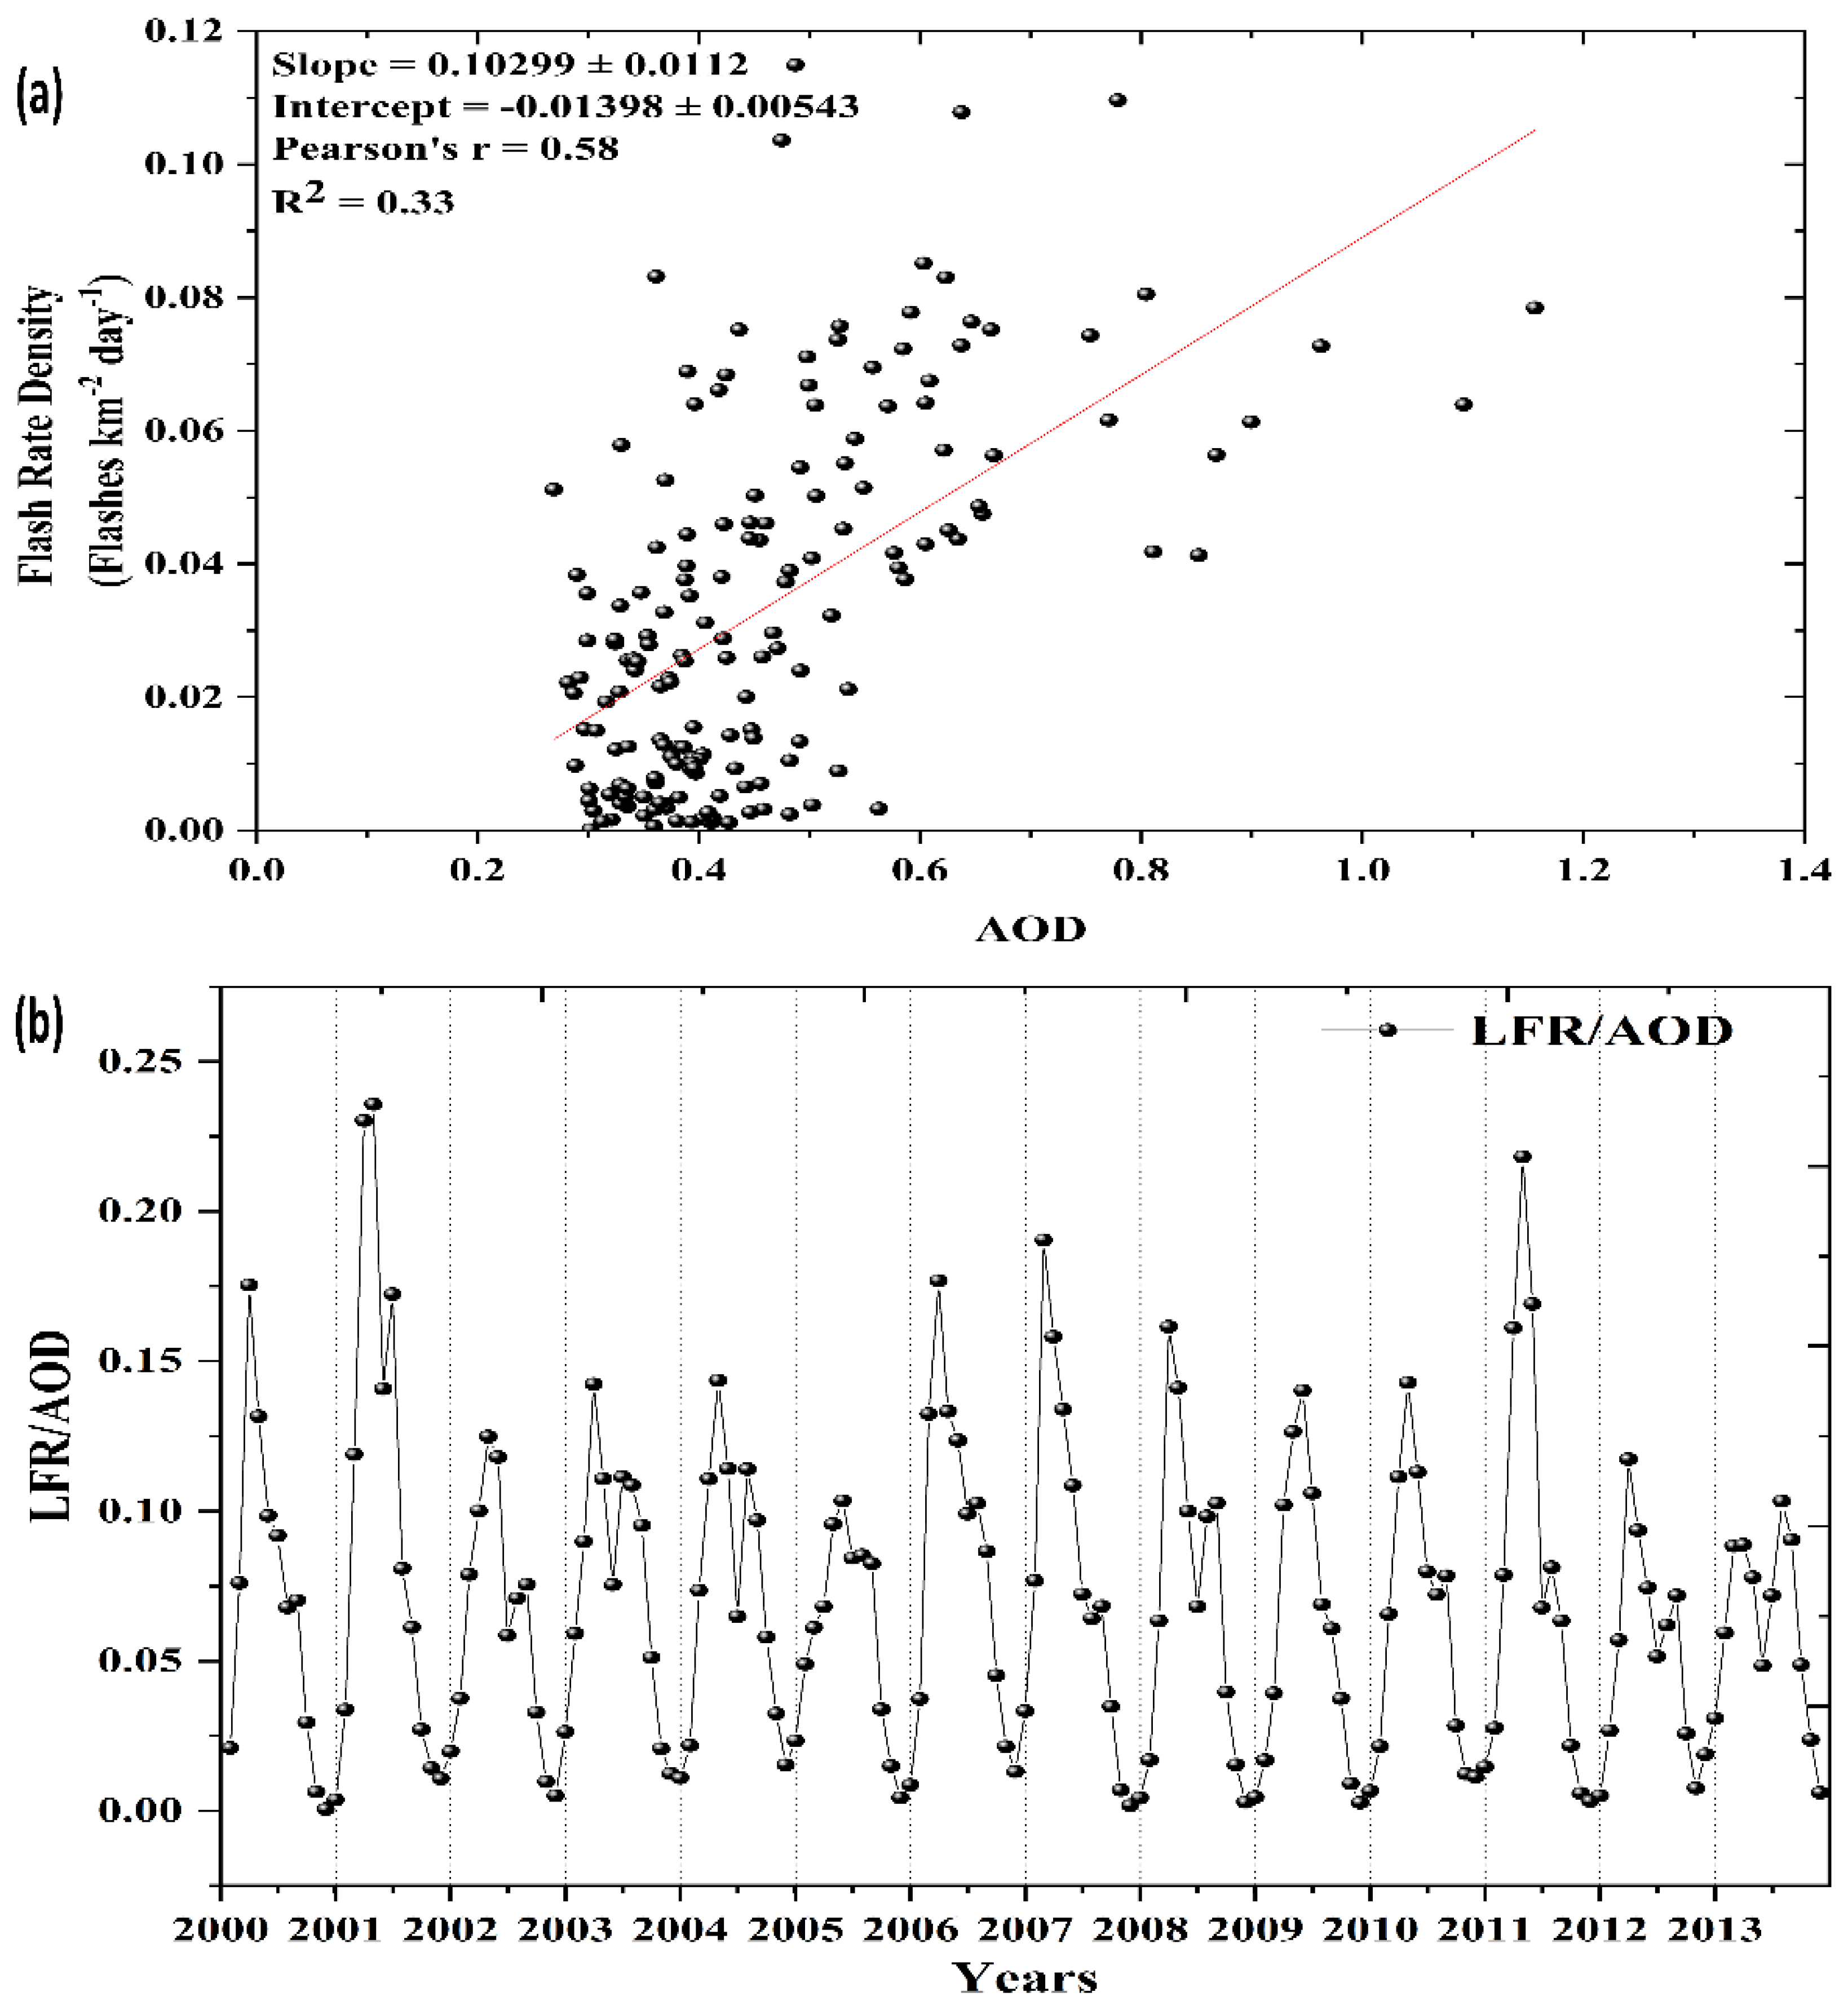
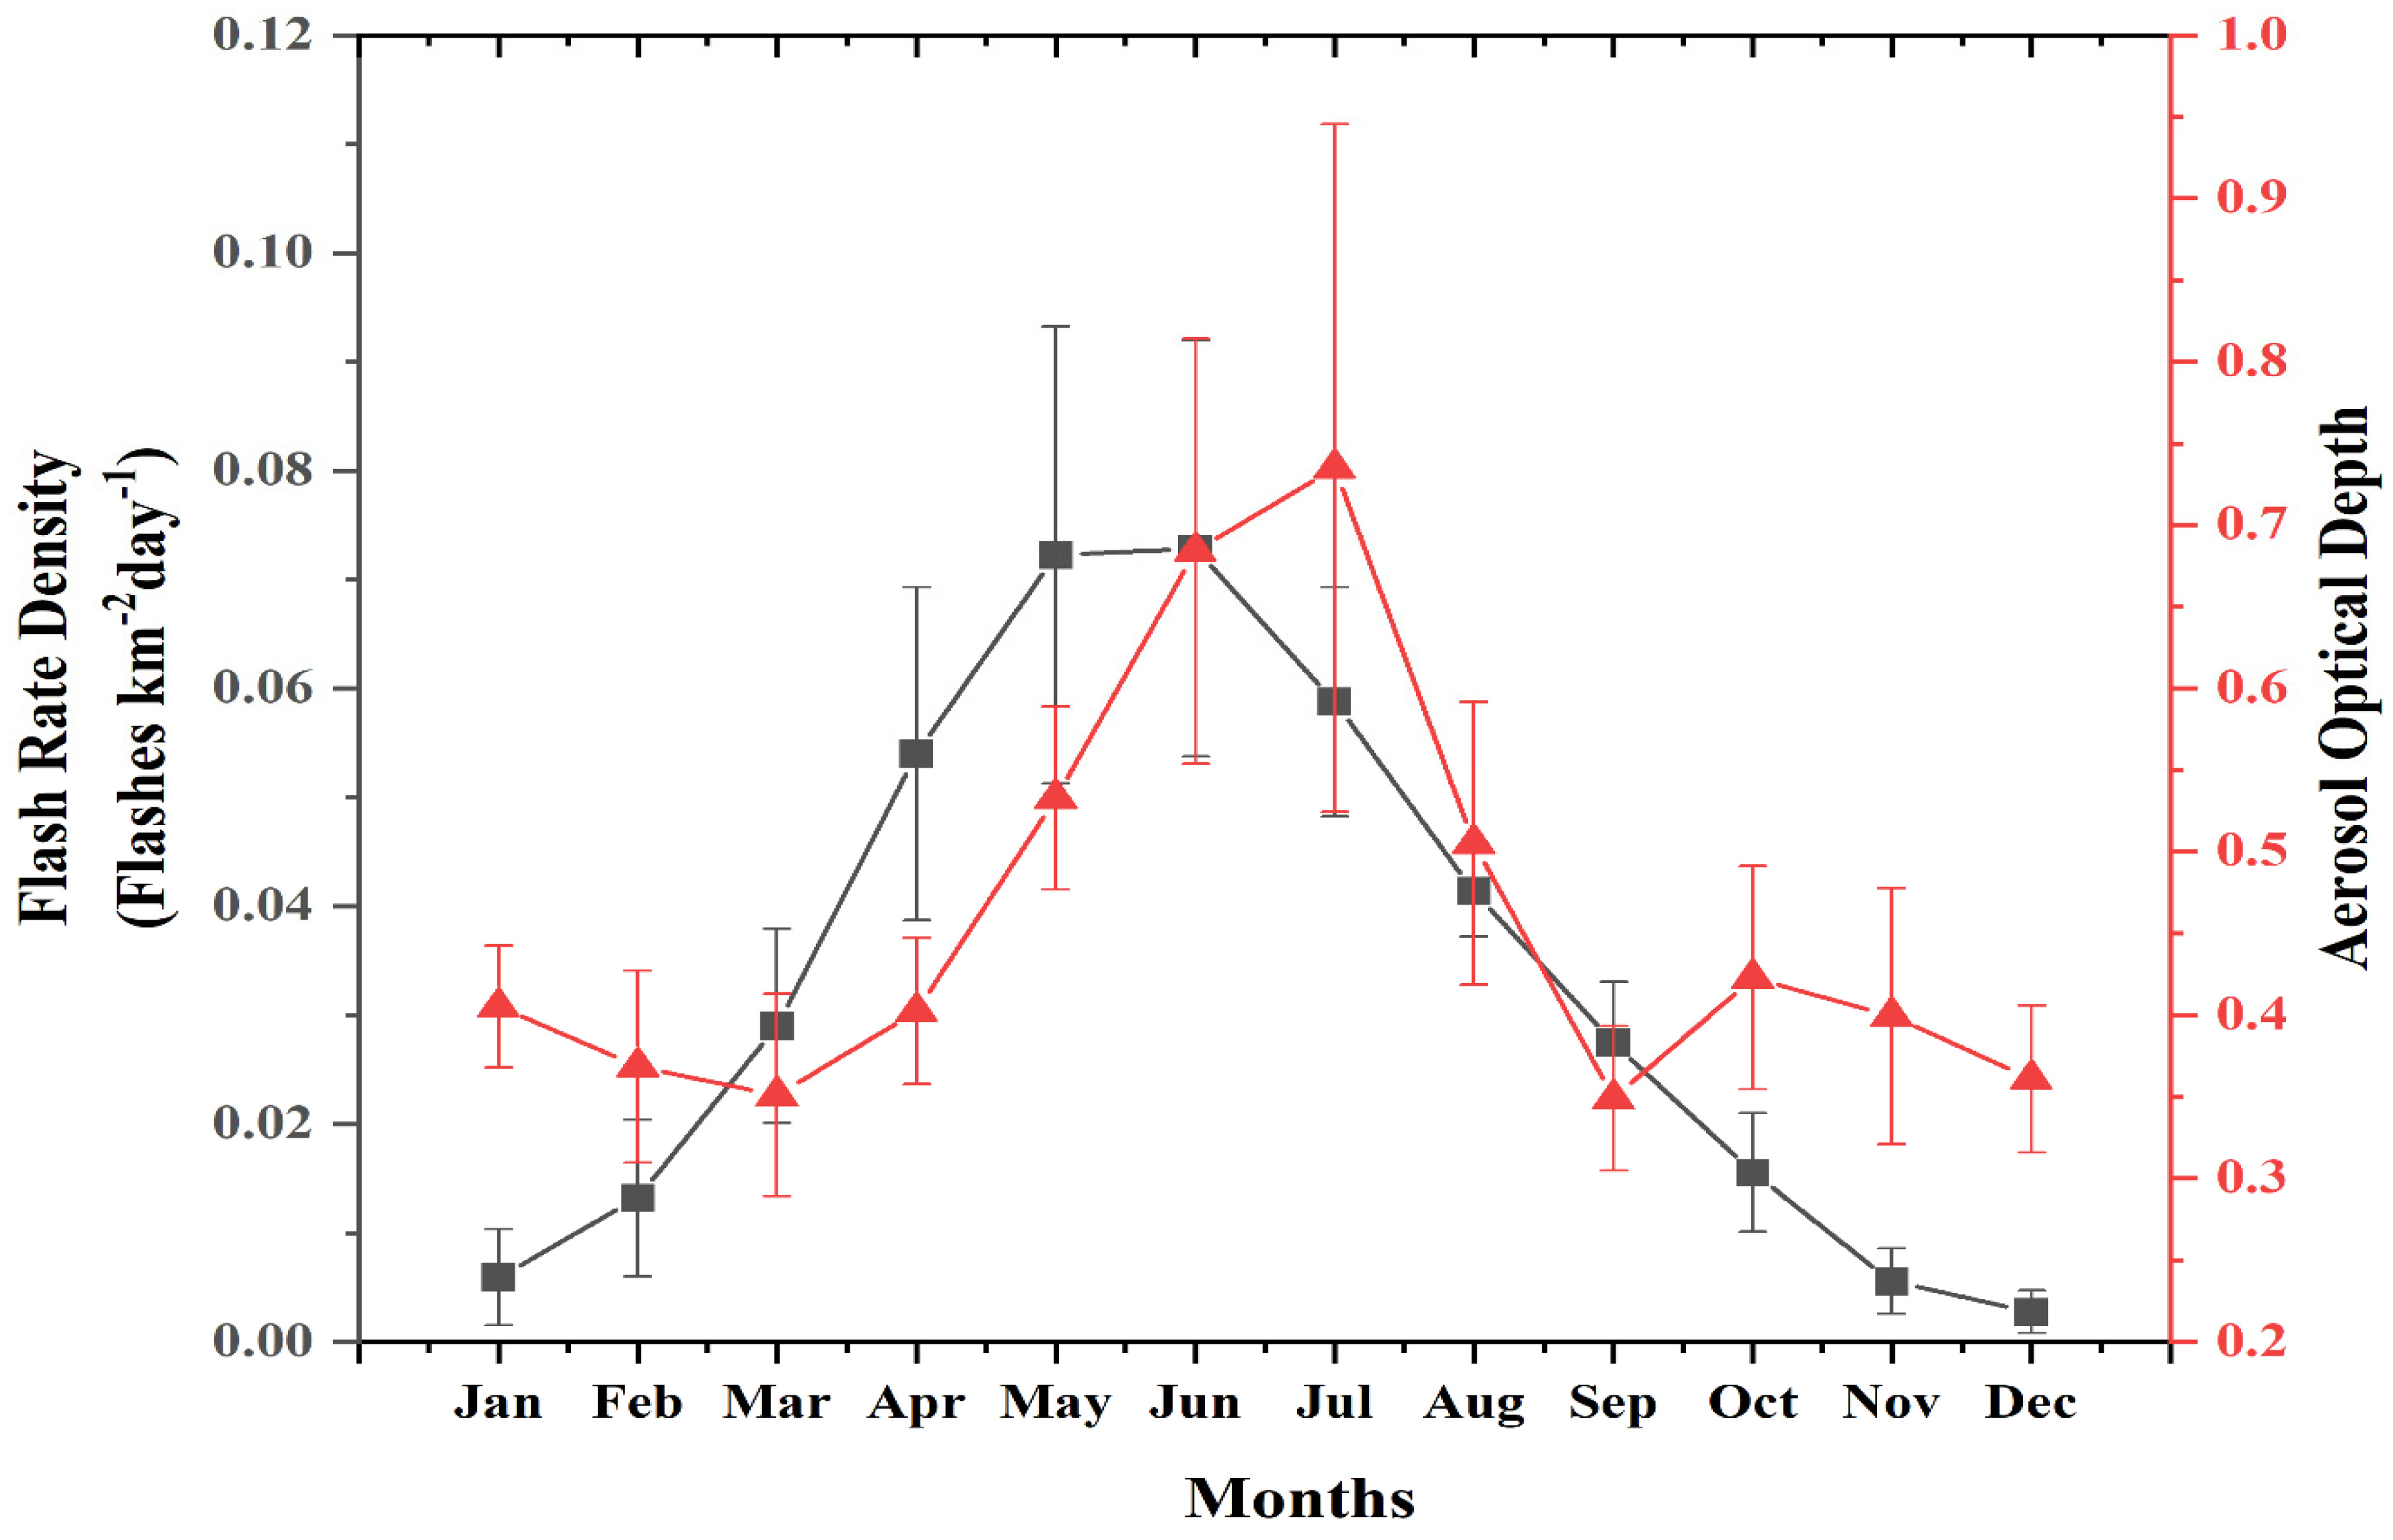
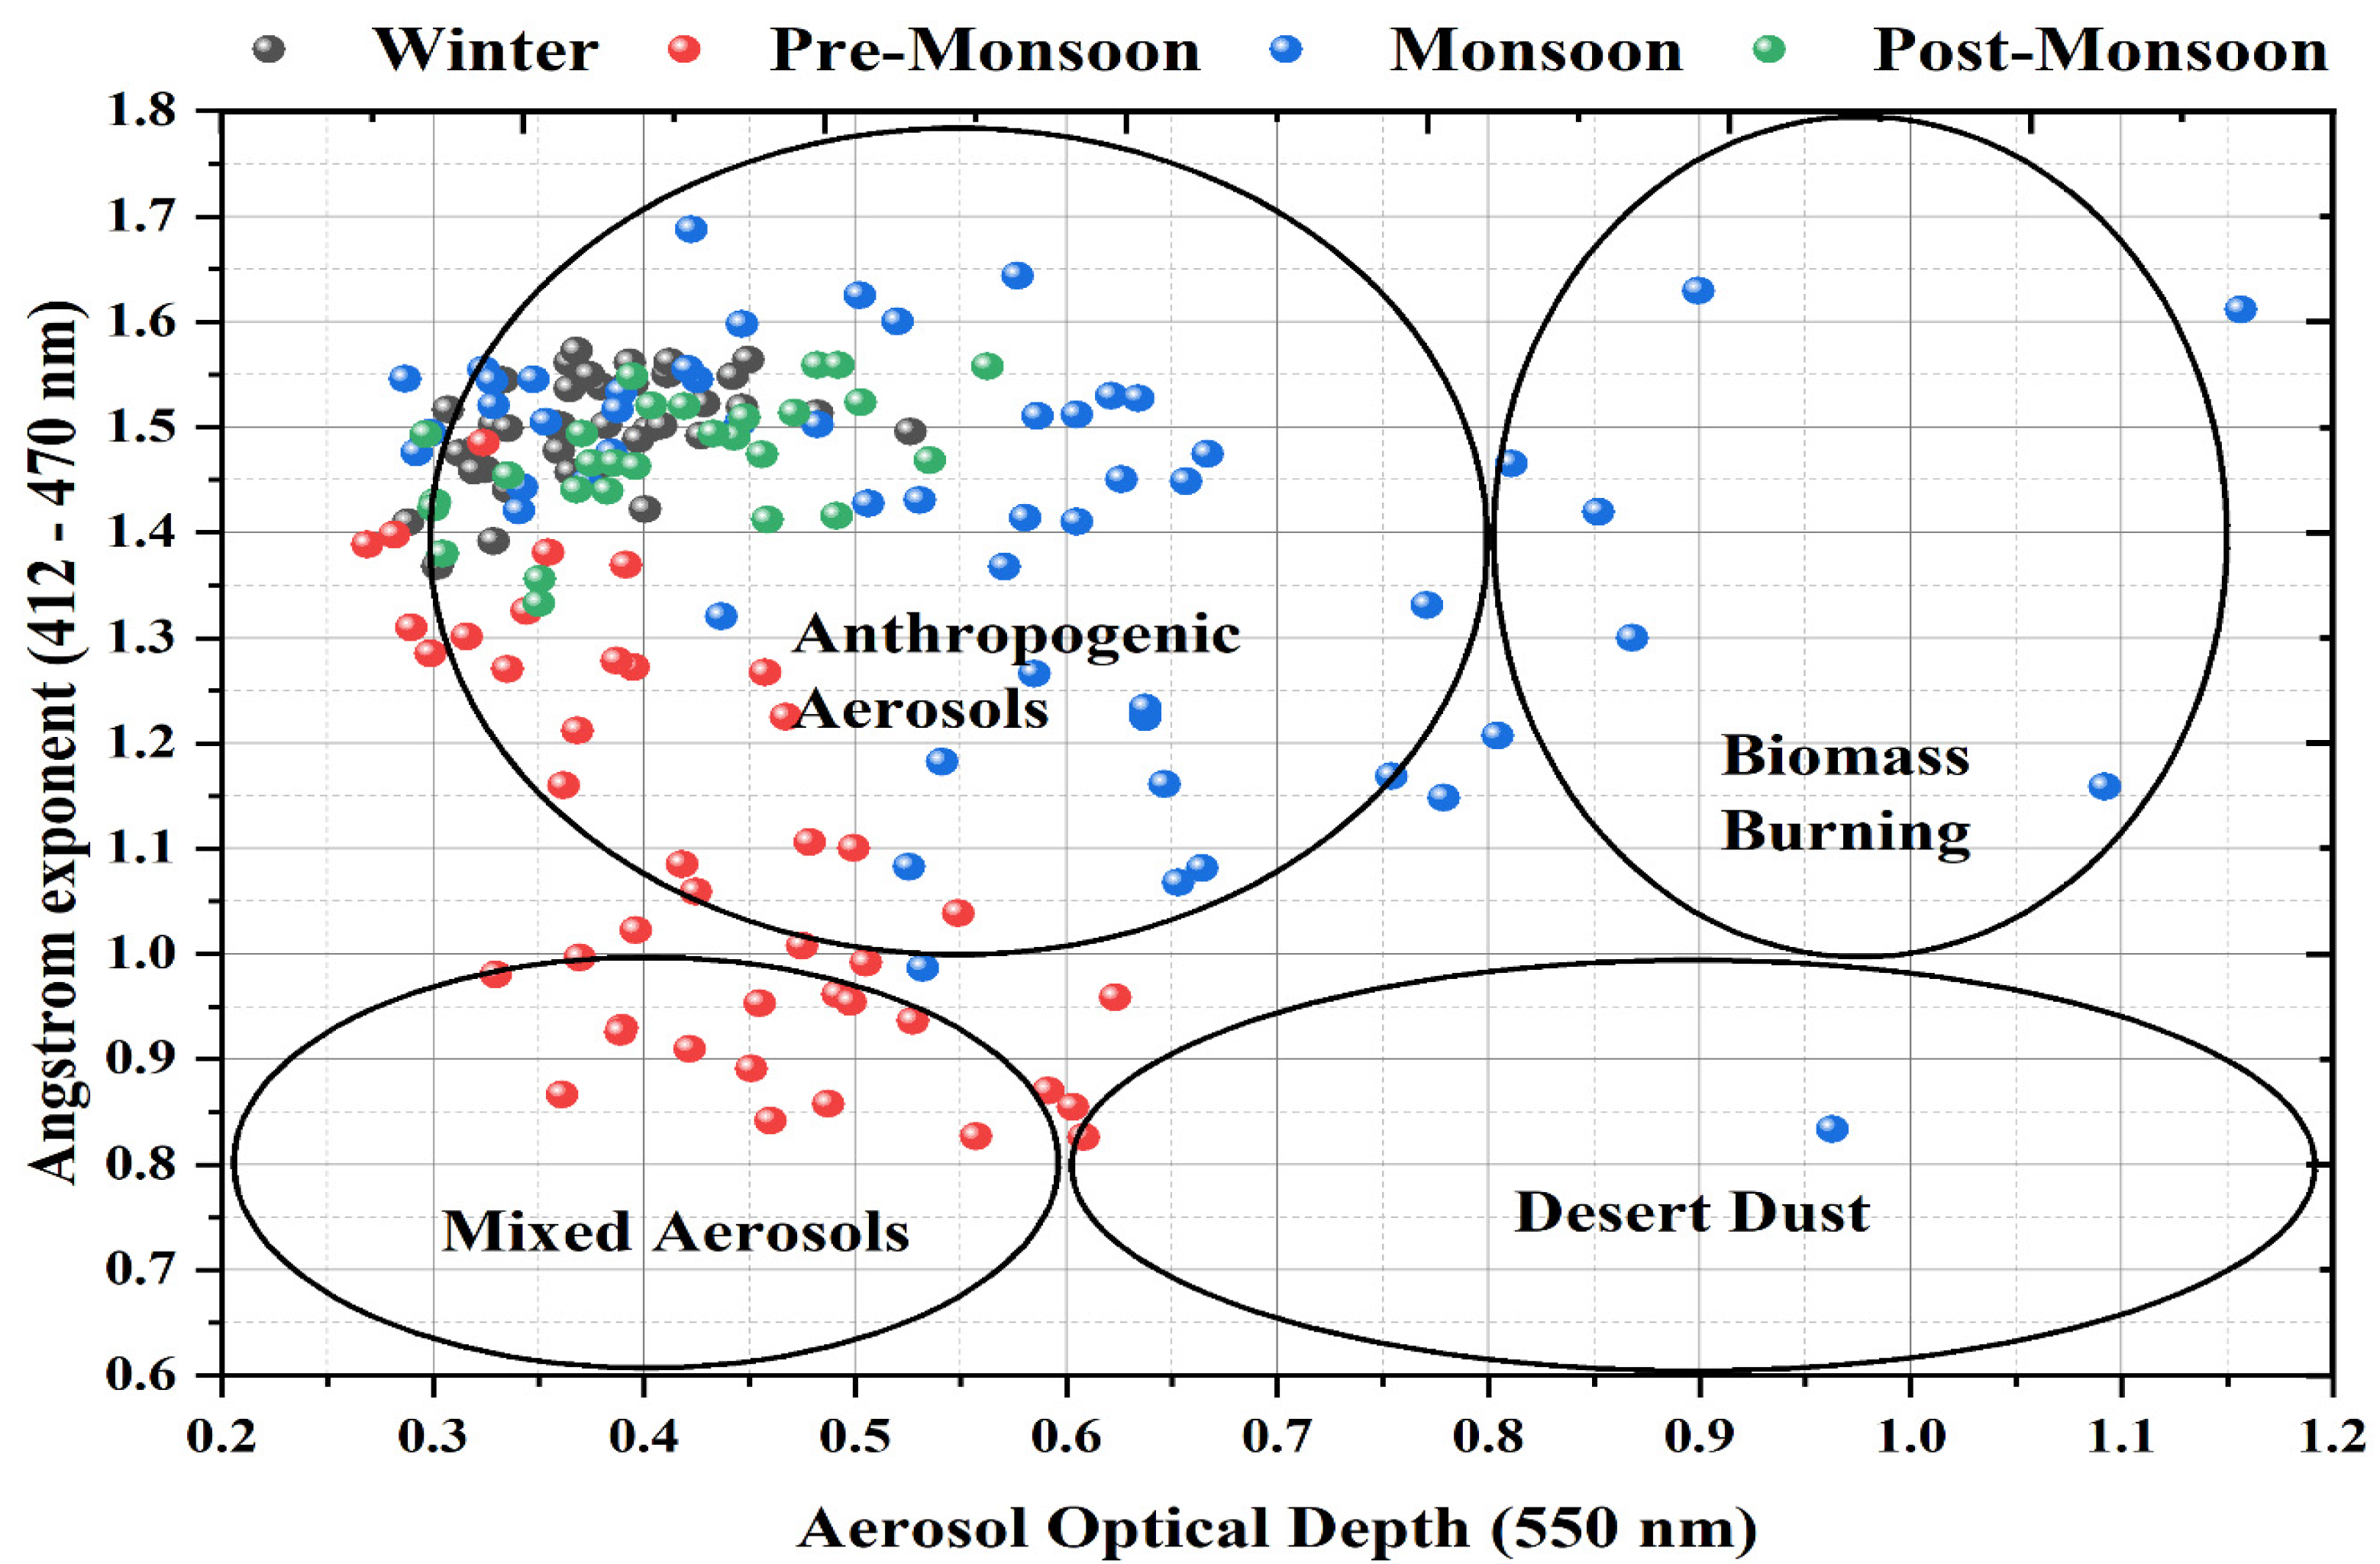
4.3. Lightning and Aerosols
4.4. Spatial Variation of Proxy and the Future Projection of LFR
5. Summary and Conclusions
Author Contributions
Funding
Institutional Review Board Statement
Informed Consent Statement
Data Availability Statement
Acknowledgments
Conflicts of Interest
References
- Michalon, N.; Nassif, A.; Saouri, T.; Royer, J.F.; Pontikis, C.A. Contribution to the climatological study of lightning. Geophys. Res. Lett. 1999, 26, 3097–3100. [Google Scholar] [CrossRef]
- Boccippio, D.J.; Goodman, S.J.; Heckman, S. Regional differences in tropical lightning distributions. J. Appl. Meteorol. 2000, 39, 2231–2248. [Google Scholar] [CrossRef]
- Orville, R.E.; Huffines, G.; Nielsen-Gammon, J.; Zhang, R.; Ely, B.; Steiger, S.; Phillips, S.; Allen, S.; Read, W. Enhancement of cloud-to-ground lightning over Houston, Texas. Geophys. Res. Lett. 2001, 28, 2597–2600. [Google Scholar] [CrossRef]
- Williams, E.; Stanfill, S. The physical origin of the land-ocean contrast in lightning activity. Comptes Rendus Phys. 2002, 3, 1277–1292. [Google Scholar] [CrossRef]
- Christian, H.J.; Blakeslee, R.J.; Boccippio, D.J.; Boeck, W.L.; Buechler, D.E.; Driscoll, K.T.; Goodman, S.J.; Hall, J.M.; Koshak, W.J.; Mach, D.M.; et al. Global frequency and distribution of lightning as observed from space by the Optical Transient Detector. J. Geophys. Res. Atmos. 2003, 108, ACL 4-1. [Google Scholar] [CrossRef]
- Williams, E.; Mushtak, V.; Rosenfeld, D.; Goodman, S.; Boccippio, D. Thermodynamic conditions favorable to superlative thunderstorm updraft, mixed phase microphysics and lightning flash rate. Atmos. Res. 2005, 76, 288–306. [Google Scholar] [CrossRef]
- Bell, T.L.; Rosenfeld, D.; Kim, K.M. Weekly cycle of lightning: Evidence of storm invigoration by pollution. Geophys. Res. Lett. 2009, 36. [Google Scholar] [CrossRef]
- Bell, T.L.; Rosenfeld, D.; Kim, K.M.; Yoo, J.M.; Lee, M.I.; Hahnenberger, M. Midweek increase in U.S. summer rain and storm heights suggests air pollution invigorates rainstorms. J. Geophys. Res. Atmos. 2008, 113, 1–22. [Google Scholar] [CrossRef]
- Guo, J.; Deng, M.; Lee, S.S.; Wang, F.; Li, Z.; Zhai, P.; Liu, H.; Lv, W.; Yao, W.; Li, X. Delaying precipitation and lightning by air pollution over the Pearl River Delta. Part I: Observational analyses. J. Geophys. Res. Atmos. 2016, 121, 6472–6488. [Google Scholar] [CrossRef]
- Tao, W.K.; Chen, J.P.; Li, Z.; Wang, C.; Zhang, C. Impact of aerosols on convective clouds and precipitation. Rev. Geophys. 2012, 50, 1–62. [Google Scholar] [CrossRef]
- Fan, J.; Wang, Y.; Rosenfeld, D.; Liu, X. Review of aerosol-cloud interactions: Mechanisms, significance, and challenges. J. Atmos. Sci. 2016, 73, 4221–4252. [Google Scholar] [CrossRef]
- Li, Z.; Lau, W.K.M.; Ramanathan, V.; Wu, G.; Ding, Y.; Manoj, M.G.; Liu, J.; Qian, Y.; Li, J.; Zhou, T.; et al. Aerosol and monsoon climate interactions over Asia. Rev. Geophys. 2016, 54, 866–929. [Google Scholar] [CrossRef]
- Li, Z.; Guo, J.; Ding, A.; Liao, H.; Liu, J.; Sun, Y.; Wang, T.; Xue, H.; Zhang, H.; Zhu, B. Aerosol and boundary-layer interactions and impact on air quality. Natl. Sci. Rev. 2017, 4, 810–833. [Google Scholar] [CrossRef]
- Wang, Q.; Li, Z.; Guo, J.; Zhao, C.; Cribb, M. The climate impact of aerosols on the lightning flash rate: Is it detectable from long-term measurements? Atmos. Chem. Phys. 2018, 18, 12797–12816. [Google Scholar] [CrossRef] [Green Version]
- Zhao, P.; Zhou, Y.; Xiao, H.; Liu, J.; Gao, J.; Ge, F. Total lightning flash activity response to aerosol over China area. Atmosphere 2017, 8, 26. [Google Scholar] [CrossRef] [Green Version]
- Zhang, R.; Li, G.; Fan, J.; Wu, D.L.; Molina, M.J. Intensification of Pacific storm track linked to Asian pollution. Proc. Natl. Acad. Sci. USA 2007, 104, 5295–5299. [Google Scholar] [CrossRef] [Green Version]
- Siingh, D.; Singh, R.P.; Kumar, S.; Dharmaraj, T.; Singh, A.K.; Singh, A.K.; Patil, M.N.; Singh, S. Lightning and middle atmospheric discharges in the atmosphere. J. Atmos. Sol. Terr. Phys. 2015, 134, 78–101. [Google Scholar] [CrossRef]
- Williams, E.R. Lightning and climate: A review. Atmos. Res. 2005, 76, 272–287. [Google Scholar] [CrossRef]
- Finney, D.L.; Doherty, R.M.; Wild, O.; Stevenson, D.S.; MacKenzie, I.A.; Blyth, A.M. A projected decrease in lightning under climate change. Nat. Clim. Chang. 2018, 8, 210–213. [Google Scholar] [CrossRef] [Green Version]
- Rosenfeld, D. TRMM observed first direct evidence of smoke from forest fires inhibiting rainfall. Geophys. Res. Lett. 1999, 26, 3105–3108. [Google Scholar] [CrossRef]
- Andreae, M.O.; Rosenfeld, D.; Artaxo, P.; Costa, A.A.; Frank, G.P.; Longo, K.M.; Silva-Dias, M.A.F. Smoking Rain Clouds over the Amazon. Science 2004, 303, 1337–1342. [Google Scholar] [CrossRef] [Green Version]
- Koren, I.; Kaufman, Y.J.; Rosenfeld, D.; Remer, L.A.; Rudich, Y. Aerosol invigoration and restructuring of Atlantic convective clouds. Geophys. Res. Lett. 2005, 32, 1–4. [Google Scholar] [CrossRef] [Green Version]
- Siingh, D.; Singh, A.K.; Patel, R.P.; Singh, R.; Singh, R.P.; Veenadhari, B.; Mukherjee, M.; Siingh, D.; Singh, A.K.; Patel, R.P.; et al. Thunderstorms, Lightning, Sprites and Magnetospheric Whistler-Mode Radio Waves. SGeo 2008, 29, 499–551. [Google Scholar] [CrossRef] [Green Version]
- Siingh, D.; Kumar, P.R.; Kulkarni, M.N.; Singh, R.P.; Singh, A.K. Lightning, convective rain and solar activity—Over the South/Southeast Asia. Atmos. Res. 2013, 120–121, 99–111. [Google Scholar] [CrossRef]
- Sekiguchi, M.; Hayakawa, M.; Nickolaenko, A.P.; Hobara, Y. Evidence on a Link between the Intensity of Schumann Resonance and Global Surface Temperature. Copernic. GmbH: Göttingen. 2006, 24, 1809–1817. [Google Scholar] [CrossRef] [Green Version]
- Kumar, P.R.; Kamra, A.K. The spatiotemporal variability of lightning activity in the Himalayan foothills. J. Geophys. Res. Atmos. 2012, 117, 24201. [Google Scholar] [CrossRef]
- Ramesh Kumar, P.; Kamra, A.K. Land-sea contrast in lightning activity over the sea and peninsular regions of South/Southeast Asia. Atmos. Res. 2012, 118, 52–67. [Google Scholar] [CrossRef]
- Penki, R.K.; Kamra, A.K. The lightning activity associated with the dry and moist convections in the Himalayan Regions. J. Geophys. Res. Atmos. 2013, 118, 6246–6258. [Google Scholar] [CrossRef]
- Yuan, T.; Qie, X. Study on lightning activity and precipitation characteristics before and after the onset of the South China Sea summer monsoon. J. Geophys. Res. Atmos. 2008, 113, 14101. [Google Scholar] [CrossRef]
- Dey, S.; Girolamo, L. Di A climatology of aerosol optical and microphysical properties over the Indian subcontinent from 9 years (2000–2008) of Multiangle Imaging Spectroradiometer (MISR) data. J. Geophys. Res. Atmos. 2010, 115, 15204. [Google Scholar] [CrossRef]
- Kilinc, M.; Beringer, J. The spatial and temporal distribution of lightning strikes and their relationship with vegetation type, elevation, and fire scars in the northern Territory. J. Clim. 2007, 20, 1161–1173. [Google Scholar] [CrossRef] [Green Version]
- Emanuel, K.A. Atmospheric Convection; Oxford University Press on Demand: Oxford, UK, 1994. [Google Scholar]
- Handbook of Atmospheric Electrodynamics. Available online: https://www.taylorfrancis.com/books/edit/10.1201/9780203719503/handbook-atmospheric-electrodynamics-hans-volland (accessed on 3 March 2022).
- Williams, E.; Renno, N. An Analysis of the Conditional Instability of the Tropical Atmosphere. Mon. Weather Rev. 1993, 121, 21–36. [Google Scholar] [CrossRef]
- Clark, S.K.; Ward, D.S.; Mahowald, N.M. Parameterization-based uncertainty in future lightning flash density. Geophys. Res. Lett. 2017, 44, 2893–2901. [Google Scholar] [CrossRef]
- Siingh, D.; Buchunde, P.S.; Singh, R.P.; Nath, A.; Kumar, S.; Ghodpage, R.N. Lightning and convective rain study in different parts of India. Atmos. Res. 2014, 137, 35–48. [Google Scholar] [CrossRef]
- Lal, D.M.; Ghude, S.D.; Mahakur, M.; Waghmare, R.T.; Tiwari, S.; Srivastava, M.K.; Meena, G.S.; Chate, D.M. Relationship between aerosol and lightning over Indo-Gangetic Plain (IGP), India. Clim. Dyn. 2018, 50, 3865–3884. [Google Scholar] [CrossRef]
- Chandra, S.; Siingh, D.; Jeni Victor, N.; Kamra, A.K. Lightning activity over South/Southeast Asia: Modulation by thermodynamics of lower atmosphere. Atmos. Res. 2021, 250, 105378. [Google Scholar] [CrossRef]
- Qie, X.; Toumi, R.; Yuan, T. Lightning activities on the Tibetan Plateau as observed by the lightning imaging sensor. J. Geophys. Res. Atmos. 2003, 108. [Google Scholar] [CrossRef]
- Price, C. Global Thunderstorm activity. In Sprites, Elves and Intense Lightning Discharges; Kluwer Academic Publishers: Amsterdan, The Netherlands, 2006; pp. 85–99. [Google Scholar]
- Guo, J.; Yan, Y.; Chen, D.; Lv, Y.; Han, Y.; Guo, X.; Liu, L.; Miao, Y.; Chen, T.; Nie, J.; et al. The response of warm-season precipitation extremes in China to global warming: An observational perspective from radiosonde measurements. Clim. Dyn. 2020, 54, 3977–3989. [Google Scholar] [CrossRef]
- Oulkar, S.; Siingh, D.; Saha, U.; Kamra, A.K. Distribution of lightning in relation to topography and vegetation cover over the dry and moist regions in the Himalayas. J. Earth Syst. Sci. 2019, 128, 180. [Google Scholar] [CrossRef] [Green Version]
- Medina, S.; Houze, R.A.; Kumar, A.; Niyogi, D. Summer monsoon convection in the Himalayan region: Terrain and land cover effects. Q. J. R. Meteorol. Soc. 2010, 136, 593–616. [Google Scholar] [CrossRef]
- Albrecht, R.I.; Goodman, S.J.; Buechler, D.E.; Blakeslee, R.J.; Christian, H.J. Where are the lightning hotspots on earth? Bull. Am. Meteorol. Soc. 2016, 97, 2051–2068. [Google Scholar] [CrossRef]
- Chaudhari, H.S.; Ranalkar, M.; Chaudhari, H.S.; Ranalkar, M.R.; Kumkar, Y.V.; Oh, J.H.; Singh, G.P. Study of Lightning Activity Over Indian Subcontinent. In Advances in Geosciences; World Scientific: Singapore, 2008; Volume 16, Available online: https://www.worldscientific.com/doi/10.1142/9789812838100_0011 (accessed on 24 August 2022).
- Cecil, D.J.; Buechler, D.E.; Blakeslee, R.J. Gridded lightning climatology from TRMM-LIS and OTD: Dataset description. Atmos. Res. 2014, 135–136, 404–414. [Google Scholar] [CrossRef] [Green Version]
- Acker, J.G.; Leptoukh, G. Online analysis enhances use of NASA Earth Science Data. Eos 2007, 88, 14–17. [Google Scholar] [CrossRef]
- Hersbach, H.; Bell, B.; Berrisford, P.; Hirahara, S.; Horányi, A.; Muñoz-Sabater, J.; Nicolas, J.; Peubey, C.; Radu, R.; Schepers, D.; et al. The ERA5 global reanalysis. Q. J. R. Meteorol. Soc. 2020, 146, 1999–2049. [Google Scholar] [CrossRef]
- Roy, I.; Tedeschi, R.G. Influence of ENSO on regional Indian summer monsoon precipitation-local atmospheric influences or remote influence from Pacific. Atmosphere 2016, 7, 25. [Google Scholar] [CrossRef] [Green Version]
- Roy, I.; Tedeschi, R.G.; Collins, M. ENSO teleconnections to the Indian summer monsoon in observations and models. Int. J. Climatol. 2017, 1813, 1794–1813. [Google Scholar] [CrossRef] [Green Version]
- Roy, I.; Gagnon, A.S.; Siingh, D. Evaluating ENSO teleconnections using observations and CMIP5 models. Theor. Appl. Climatol. 2019, 136, 1085–1098. [Google Scholar] [CrossRef] [Green Version]
- Roy, I. Indian Summer Monsoon and El Niño Southern Oscillation in CMIP5 models: A few areas of agreement and disagreement. Atmosphere 2017, 8, 154. [Google Scholar] [CrossRef] [Green Version]
- Bonan, G.B. Forests and climate change: Forcings, feedbacks, and the climate benefits of forests. Science 2008, 320, 1444–1449. [Google Scholar] [CrossRef] [Green Version]
- Kumar, S.; Siingh, D.; Singh, R.P.; Singh, A.K. The influence of meteorological parameters and atmospheric pollutants on lightning, rainfall, and normalized difference vegetation index in the Indo-Gangetic Plain. Int. J. Remote Sens. 2016, 37, 53–77. [Google Scholar] [CrossRef]
- Pielke, R.A. Influence of the spatial distribution of vegetation and soils on the prediction of cumulus Convective rainfall. Rev. Geophys. 2001, 39, 151–177. [Google Scholar] [CrossRef] [Green Version]
- Kar, J.; Deeter, M.N.; Fishman, J.; Liu, Z.; Omar, A.; Creilson, J.K.; Trepte, C.R.; Vaughan, M.A.; Winker, D.M. Wintertime pollution over the Eastern Indo-Gangetic Plains as observed from MOPITT, CALIPSO and tropospheric ozone residual data. Atmos. Chem. Phys. 2010, 10, 12273–12283. [Google Scholar] [CrossRef] [Green Version]
- Di Girolamo, L.; Bond, T.C.; Bramer, D.; Diner, D.J.; Fettinger, F.; Kahn, R.A.; Martonchik, J.V.; Ramana, M.V.; Ramanathan, V.; Rasch, P.J. Analysis of multi-angle Imaging SpectroRadiometer (MISR) aerosol optical depths over greater India during winter 2001–2004. Geophys. Res. Lett. 2004, 31, 1–5. [Google Scholar] [CrossRef] [Green Version]
- Jethva, H.; Satheesh, S.K.; Srinivasan, J. Seasonal variability of aerosols over the Indo-Gangetic basin. J. Geophys. Res. Atmos. 2005, 110, 1–15. [Google Scholar] [CrossRef]
- Singh, D.K.; Singh, R.P.; Kamra, A.K. The electrical environment of the Earth’s atmosphere: A review. Space Sci. Rev. 2004, 113, 375–408. [Google Scholar] [CrossRef]
- Yadava, P.K.; Soni, M.; Verma, S.; Kumaret, H.; Sharma, A.; Payra, S. The major lightning regions and associated casualties over India. Nat. Hazards. 2020, 101, 217–229. [Google Scholar] [CrossRef]
- Srivastava, A.K.; Ram, K.; Pant, P.; Hegde, P.; Joshi, H. Black carbon aerosols over Manora Peak in the Indian Himalayan foothills: Implications for climate forcing. Environ. Res. Lett. 2012, 7, 014002. [Google Scholar] [CrossRef]
- Pal, J.; Chaudhuri, S.; Chowdhury, A.R.; Bandyopadhyay, T. Cloud—Aerosol interaction during lightning activity over land and ocean: Precipitation pattern assessment. Asia-Pac. J. Atmos. Sci. 2016, 52, 251–261. [Google Scholar] [CrossRef]
- Kaskaoutis, D.G.; Kambezidis, H.D.; Hatzianastassiou, N.; Kosmopoulos, P.G.; Badarinath, K.V.S. Aerosol climatology: On the discrimination of aerosol types over four AERONET sites. Atmos. Chem. Phys. Discuss. 2007, 7, 6357–6411. [Google Scholar]
- Kaskaoutis, D.G.; Badarinath, K.V.S.; Kharol, S.K.; Sharma, A.R.; Kambezidis, H.D. Variations in the aerosol optical properties and types over the tropical urban site of Hyderabad, India. J. Geophys. Res. Atmos. 2009, 114, 22204. [Google Scholar] [CrossRef]
- Patel, P.N.; Kumar, R. Estimation of Aerosol Characteristics and Radiative Forcing during Dust Events over Dehradun. Aerosol Air Qual. Res. 2015, 15, 2082–2093. [Google Scholar] [CrossRef]
- Kedia, S.; Ramachandran, S.; Holben, B.N.; Tripathi, S.N. Quantification of aerosol type, and sources of aerosols over the Indo-Gangetic Plain. Atmos. Environ. 2014, 98, 607–619. [Google Scholar] [CrossRef]
- Romps, D.M.; Seeley, J.T.; Vollaro, D.; Molinari, J. Projected increase in lightning strikes in the united states due to global warming. Science 2014, 346, 851–854. [Google Scholar] [CrossRef] [PubMed]


| Parameters | Winter (DJF) | Pre-Monsoon (MAM) | Monsoon (JJAS) | Post-Monsoon (ON) | |
|---|---|---|---|---|---|
| CAPE | cc (r) | 0.73 | 0.74 | 0.03 | 0.70 |
| R2 (p-value) | 0.54 (3.23 × 10⁻⁸) | 0.54 (2.54 × 10⁻⁸) | 0.0007 (0.84) | 0.49 (3.37 × 10⁻⁵) | |
| AOD | cc (r) | 0.05 | 0.58 | 0.64 | 0.31 |
| R2 (p-value) | 0.003 (0.74) | 0.33 (6.53 × 10⁻⁵) | 0.41 (1.15 × 10⁻⁷) | 0.09 (0.12) | |
| Precipitation Rate | cc (r) | 0.75 | 0.41 | 0.03 | 0.46 |
| R2 (p-value) | 0.56 (1.52 × 10⁻⁸) | 0.16 (0.008) | 0.0007 (0.85) | 0.21 (0.01) | |
| NDVI | cc (r) | 0.58 | −0.65 | −0.73 | 0.73 |
| R2 (p-value) | 0.34 (6.25 × 10⁻⁵) | 0.42 (3 × 10⁻⁶) | 0.53 (2.1 × 10⁻¹⁰) | 0.53 (1.2 × 10⁻⁵) | |
| Vertical velocity | cc (r) | 0.05 | 0.76 | 0.32 | 0.41 |
| R2 (p-value) | 0.003 (0.74) | 0.57 (7.85 × 10⁻⁹) | 0.11 (0.01) | 0.17 (0.03) | |
| Temperature | cc (r) | 0.15 | 0.71 | 0.52 | 0.66 |
| R2 (p-value) | 0.024 (0.33) | 0.50 (1.86 × 10⁻⁷) | 0.27 (3.63 × 10⁻⁵) | 0.44 (1.2 × 10⁻⁴) | |
| Relative Humidity | cc (r) | 0.55 | 0.42 | −0.13 | 0.70 |
| R2 (p-value) | 0.30 (1.8 × 10⁻⁴) | 0.17 (0.006) | 0.02 (0.35) | 0.48 (3.81 × 10⁻⁵) | |
Publisher’s Note: MDPI stays neutral with regard to jurisdictional claims in published maps and institutional affiliations. |
© 2022 by the authors. Licensee MDPI, Basel, Switzerland. This article is an open access article distributed under the terms and conditions of the Creative Commons Attribution (CC BY) license (https://creativecommons.org/licenses/by/4.0/).
Share and Cite
Gautam, A.S.; Joshi, A.; Chandra, S.; Dumka, U.C.; Siingh, D.; Singh, R.P. Relationship between Lightning and Aerosol Optical Depth over the Uttarakhand Region in India: Thermodynamic Perspective. Urban Sci. 2022, 6, 70. https://doi.org/10.3390/urbansci6040070
Gautam AS, Joshi A, Chandra S, Dumka UC, Siingh D, Singh RP. Relationship between Lightning and Aerosol Optical Depth over the Uttarakhand Region in India: Thermodynamic Perspective. Urban Science. 2022; 6(4):70. https://doi.org/10.3390/urbansci6040070
Chicago/Turabian StyleGautam, Alok Sagar, Abhishek Joshi, Sagarika Chandra, Umesh Chandra Dumka, Devendraa Siingh, and Ram Pal Singh. 2022. "Relationship between Lightning and Aerosol Optical Depth over the Uttarakhand Region in India: Thermodynamic Perspective" Urban Science 6, no. 4: 70. https://doi.org/10.3390/urbansci6040070