Article

Impact of the COVID-19 Pandemic on Walkability in the Main Urban Area of Xi’an

1
Graduate School of Engineering, Osaka University, Osaka 565-0871, Japan
2
Cybermedia Center, Osaka University, Osaka 567-0047, Japan
3
ILS—Research Institute for Regional and Urban Development, D-44135 Dortmund, Germany
*
Author to whom correspondence should be addressed.
Urban Sci. 2022, 6(3), 44; https://doi.org/10.3390/urbansci6030044
Submission received: 7 June 2022 / Revised: 23 June 2022 / Accepted: 24 June 2022 / Published: 28 June 2022

Abstract

:
The COVID-19 pandemic has greatly affected the mobility of individuals everywhere. This has been especially true in China, where many restrictions, including lockdowns, have been widely applied. This paper discusses the impact of the pandemic on walkability, an important factor in promoting urban neighborhoods, in the main urban area of Xi’an, China, one of China’s four great ancient capitals. Based on the street view data obtained before and after the pandemic, the paper quantitatively compares changes in specific components of selected streetscapes through a deep learning (DL) street view analysis. The aim is to identify the impact of the pandemic on walkability and determine the elements that influence increased walkability in Xi’an’s historical area, using a walkability evaluation model based on a regression analysis involving three factors (streetscape components, walkability check scores, and street connectivity of space syntax for every image). Although Xi’an’s urban structure did not change significantly, the pandemic has clearly impacted street vitality, especially in terms of reducing pedestrian flow and commercial value. Based on study results, the street environment has great room for improvement, especially in the city’s historical blocks, by reconsidering safety measures to pedestrians and the important role of atmospheric aspects on the streets.

1. Introduction

Since its emergence in 2020, the COVID-19 pandemic has had a huge impact on the health and well-being of people worldwide; regrettably, many countries have experienced a two-wave (or even a three-wave) pattern in reported cases. Globally, there have been more than 508 million COVID-19 cases, with the total number of deaths exceeding 6.2 million [1]. Furthermore, it seems clear that the pandemic will have a long-term impact on our individual behaviors, lifestyles, mobility, and travel patterns such as commuting [2,3,4,5,6], all of which will profoundly affect urban transport systems [5].
While strict containment measures have reduced the spread of the virus in China, the activity and mobility of the people have been severely limited, resulting in a sharp reduction in walking.
In today’s low-carbon development of cities, strengthening walking can contribute to alleviating environmental pressures, relieving urban traffic congestion, maintaining the ecological environment and improving air quality, as well as increasing urban safety by reducing traffic accidents [6,7,8,9,10]. At the same time, walking has been recognized as beneficial for disease prevention and having a positive influence on human health [11,12]. Notably, neighborhood walkability seems to even provide a kind of protection against the spread of COVID-19; Oishi (2021) found that walkable neighborhoods had fewer COVID-19 cases, ostensibly because it allows people to perform their daily chores in close proximity to their homes [13].
Due to the dramatic changes it has induced in pedestrian flow, vehicular traffic, and the operating hours of commercial enterprises, shops and stores, the pandemic has unquestionably affected the urban walking environment. Thus, exploring the relationship between the pandemic and an area’s walkability would seem a worthy effort.
A walkability index reflects the ability of individuals to perform errands on foot from a given location to a destination. It is an important indicator for evaluating sustainable urban mobility. Extensive prior research has developed various walkability assessment indicators that can be measured quantitatively. The quantitative evaluation of walkability is mainly based on GIS measurements ranging from macro-scale to neighborhood scale. Indicators related to urban form characteristics (e.g., intersection density, street connectivity, proximity to transit stops and urban amenities, and diversity of land use) are often used for walkability assessment [14,15]. In a recent paper, Wang et al. (2022) discussed the relationship between city-level walkability and COVID-19 infection in Massachusetts, USA, and used commercially available walkability and transportation indices (regarding biking and public transportation) to suggest that the communities in which we live can have a profound effect on our health [5].
On a micro-scale, the measurement of street-level walkability has attracted increasing attention; however, such measurement typically requires an extensive time for observations and heavy onsite manual work [16,17,18]. Virtual audits using street view images provide a new perspective for evaluating the micro-scale environment. In recent years, the effectiveness and feasibility of a virtual method based on street view images has been confirmed in a number of studies [19,20,21].
Virtual audits offer an alternative to field observation based on remote audits, as they are more cost-efficient due to the elimination of travel time and provide greater safety for roadside auditors. In a period such as the pandemic, application of this approach would seem especially suitable due to the severally restricted mobility imposed by lockdowns and the attendant social-distancing rules. Streetscape structure can also be well probed using the functions of various virtual tools, such as building height-to-road ratio, road width, and the proportion of various streetscape structures.
Quantifying the different street scene characteristics of walking routes within selected urban areas is particularly challenging for any study. To address this issue, Yin and Wang (2016) introduced a deep learning (DL) approach based on street view images (DeepLab models) in order to detect the various segments (elements) that make up a streetscape [22]. Nguyen (2020) utilized the largest collection of Google Street View images used for public health research to characterize neighborhood environments and found built environment characteristics can help establish the community-level COVID-19 risk [23]. In addition to such studies that are focused on the influence of landscape elements on health outcomes, Nagata et al. (2019) examined the relationship between the complex elements of street views and walkability [24].
As regards the subjective evaluation of walkability (the target variable) in the model, which specifically refers to the complex elements of street landscape in a subjective walkability evaluation, previous audit tools such as WASABE [25], PEDS [26], NEWS [27], and MAPSmini [28] have incorporated the various aspects of micro-scale streetscape and the perceptions of people. Hanibuchi (2019) created a walkability checklist with a special focus on Asian contexts (e.g., fence/stall as an additional assessment indicator) [29]. For our study, we selected a limited number of items used often in the development of previous audit tools, covering various aspects of micro-scale streetscape and characteristic contents related to Xi’an and considered suitable to examining elements corresponding to image segmentation analysis.
Xi’an, China, is an ancient cultural center whose main urban areas have developed around a grid, with a chess-board-like network of roads. The Ming City (Old City/Main urban area) District is the center of Xi’an, especially the historic and cultural blocks of Beiyuan Gate and Sanxue Street, which have inherited and preserved the best historical characteristics of the region and streets. COVID-19 brought significant changes to both the ordinary areas (the northeast and southwest areas of the main urban area) and the historical areas of the old city (the northeast and southwest areas of the main urban area where predominantly local people are living) and the historical areas of the old city where many tourists visit. Because of China’s zero COVID-19 strategy, the impact of the pandemic has been particularly prominent on walkability. Prior to the outbreak of COVID-19, the streets of Xi’an’s historic centers were alive with bustling crowds of people and stores on both sides of the street. However, during the pandemic, due to the restrictions on individual mobility and the preference of people for staying at home, the walking environment has changed substantially, making pandemic-related factors a very important element in evaluating walkability in future research.
The research mainly focuses on the impact of the COVID-19 pandemic on walkability, specifically in a built environment consisting of street scene elements, in order to identify the impact of the pandemic on walking patterns in Xi’an’s historic centers. It provides the basis for considering the pandemic situation as another significant measurement index for walkability evaluation. This paper fills the research gap of the impact of the COVID-19 pandemic on the walking environment by comparing the walkability before and after the pandemic based on a multi-method approach. Furthermore, we aim to overcome the current limitations of measuring street-level walkability which have heavily replied on observations and onsite manual work, through virtual remote auditing. Based on the street view data before and after the pandemic, we quantitatively compare changes in specific components through DL street view analysis and conduct a walkability assessment by applying our checklist to the two periods. We then construct a walkability model using regression analysis and analyze the main influencing factors in order to put forward constructive suggestions for the creation of a pedestrian city in the post-pandemic era of Xi’an.

2. Materials and Methods

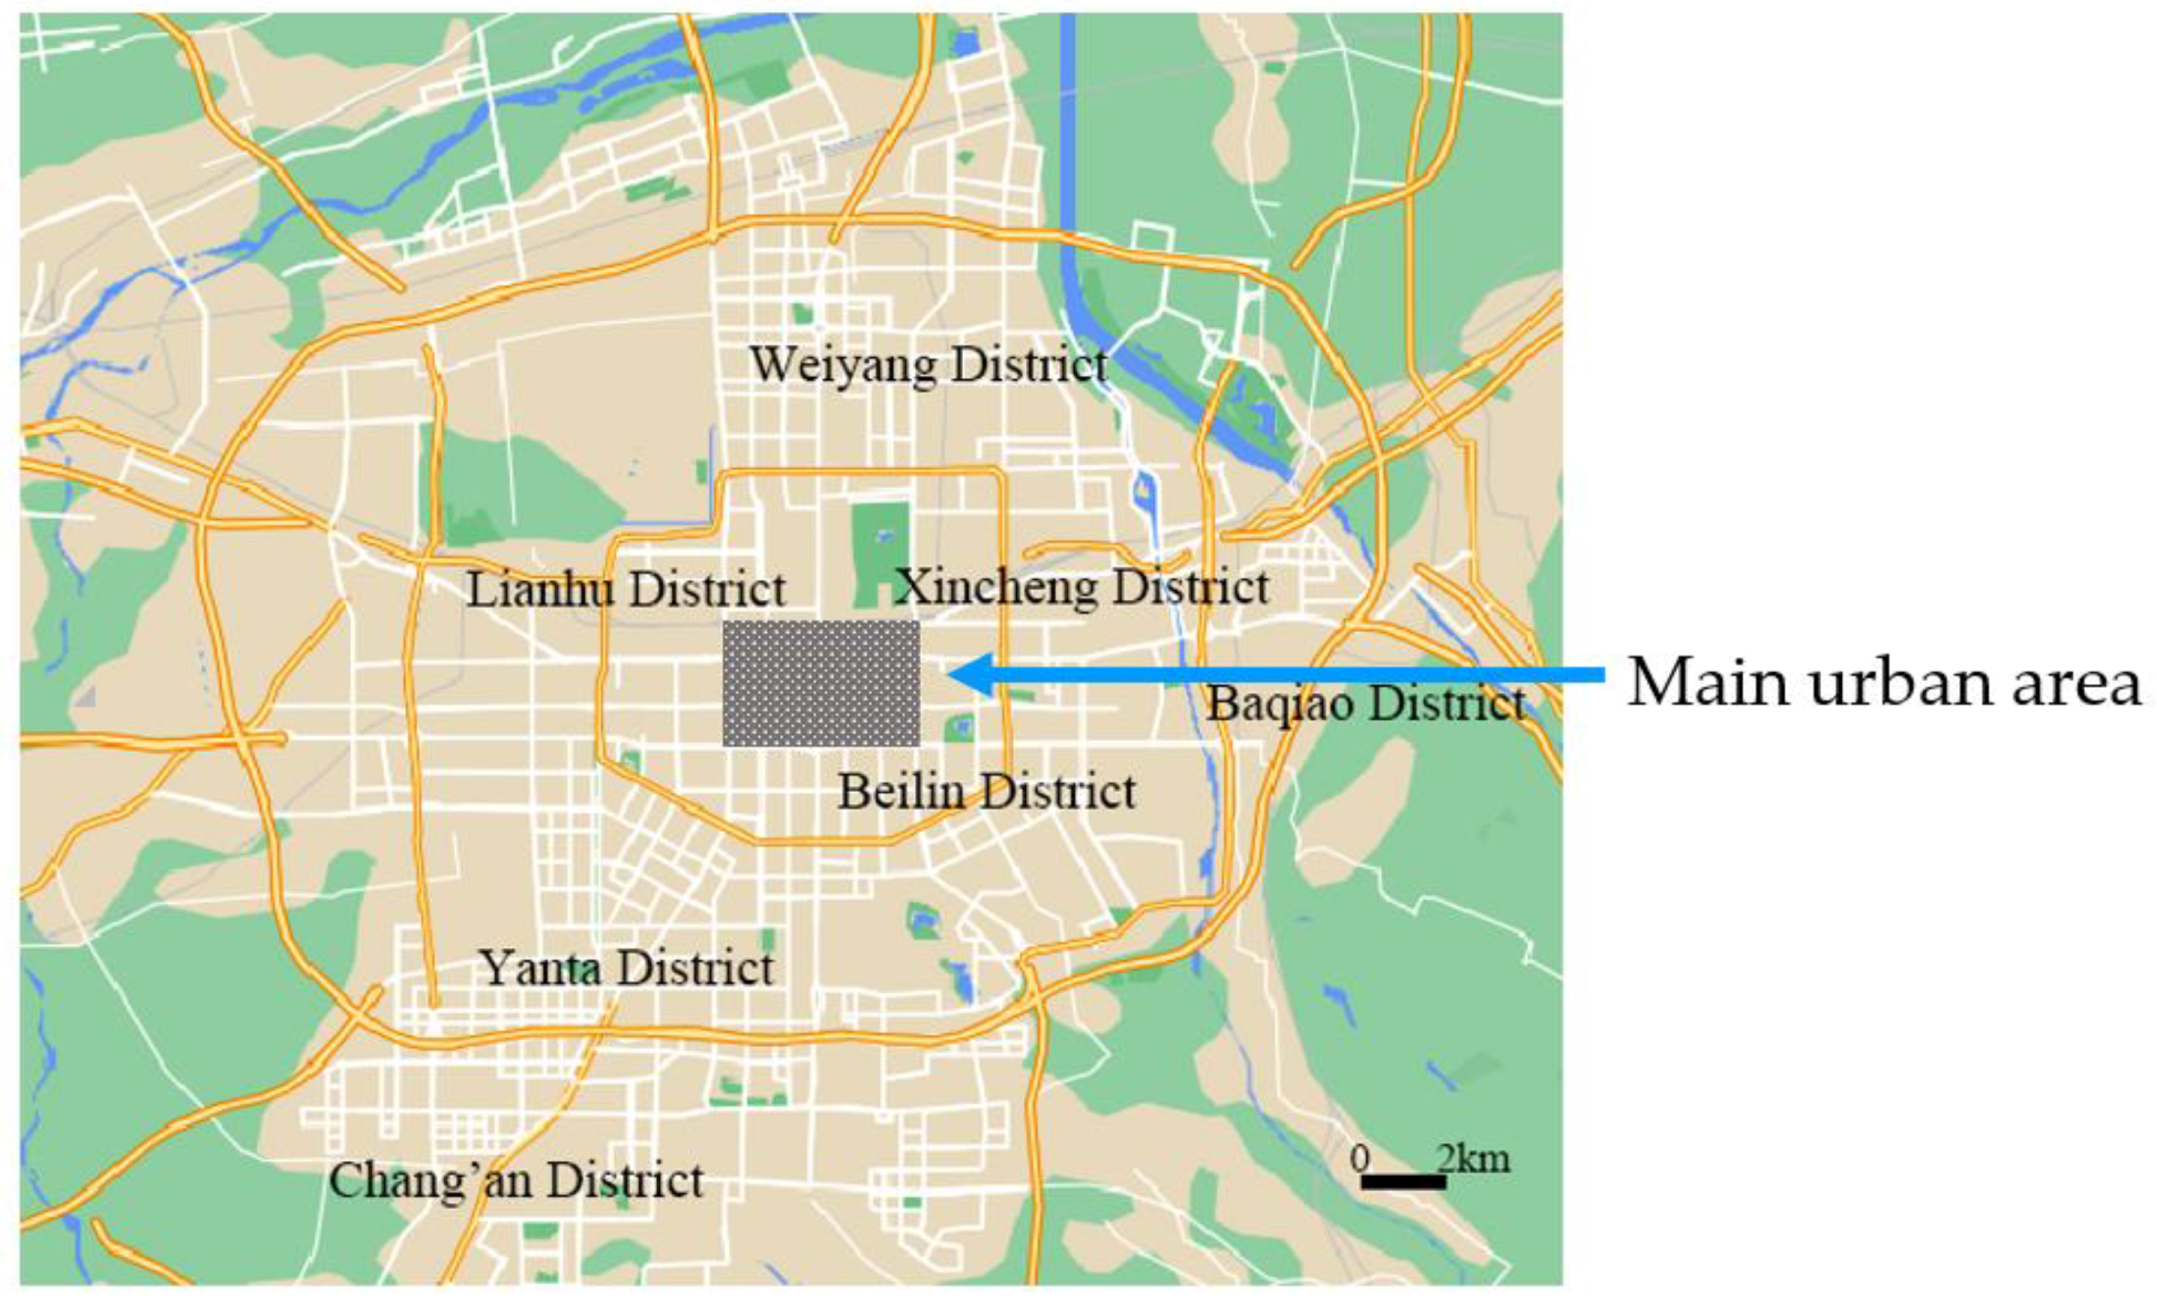
2.1. Street View Selection and Download

The main urban area of Xi’an was selected as the research object of the study. It is the older part of the urban area within the city wall. The selected area of 1.5 × 2.5 square kilometers, which includes the Beiyuan Gate and Sanxue Street historical blocks, is shown in Figure 1. The three-step selection procedure is described below:
  • Use street intersections as the selection points: All the intersections of the research area according to longitude and latitude were confirmed in ArcGIS, with some streets having several intersections. In our street view dataset, each intersection captured street view images from four directions (0, 90, 180, and 270 degrees).
  • Select the same two to three street views with the same angle for each street before and after the pandemic (The outbreak in Xi’an began in January 2020. The two selected periods are 2019, before the outbreak, and 2022, after.) In order to ensure the consistency of the street visual angle of the downloaded pictures, according to the selection consistency principle, the horizontal direction of the street was determined by longitude and latitude, and the vertical focus was placed in the middle, composed of the end (vanishing point) of the road.
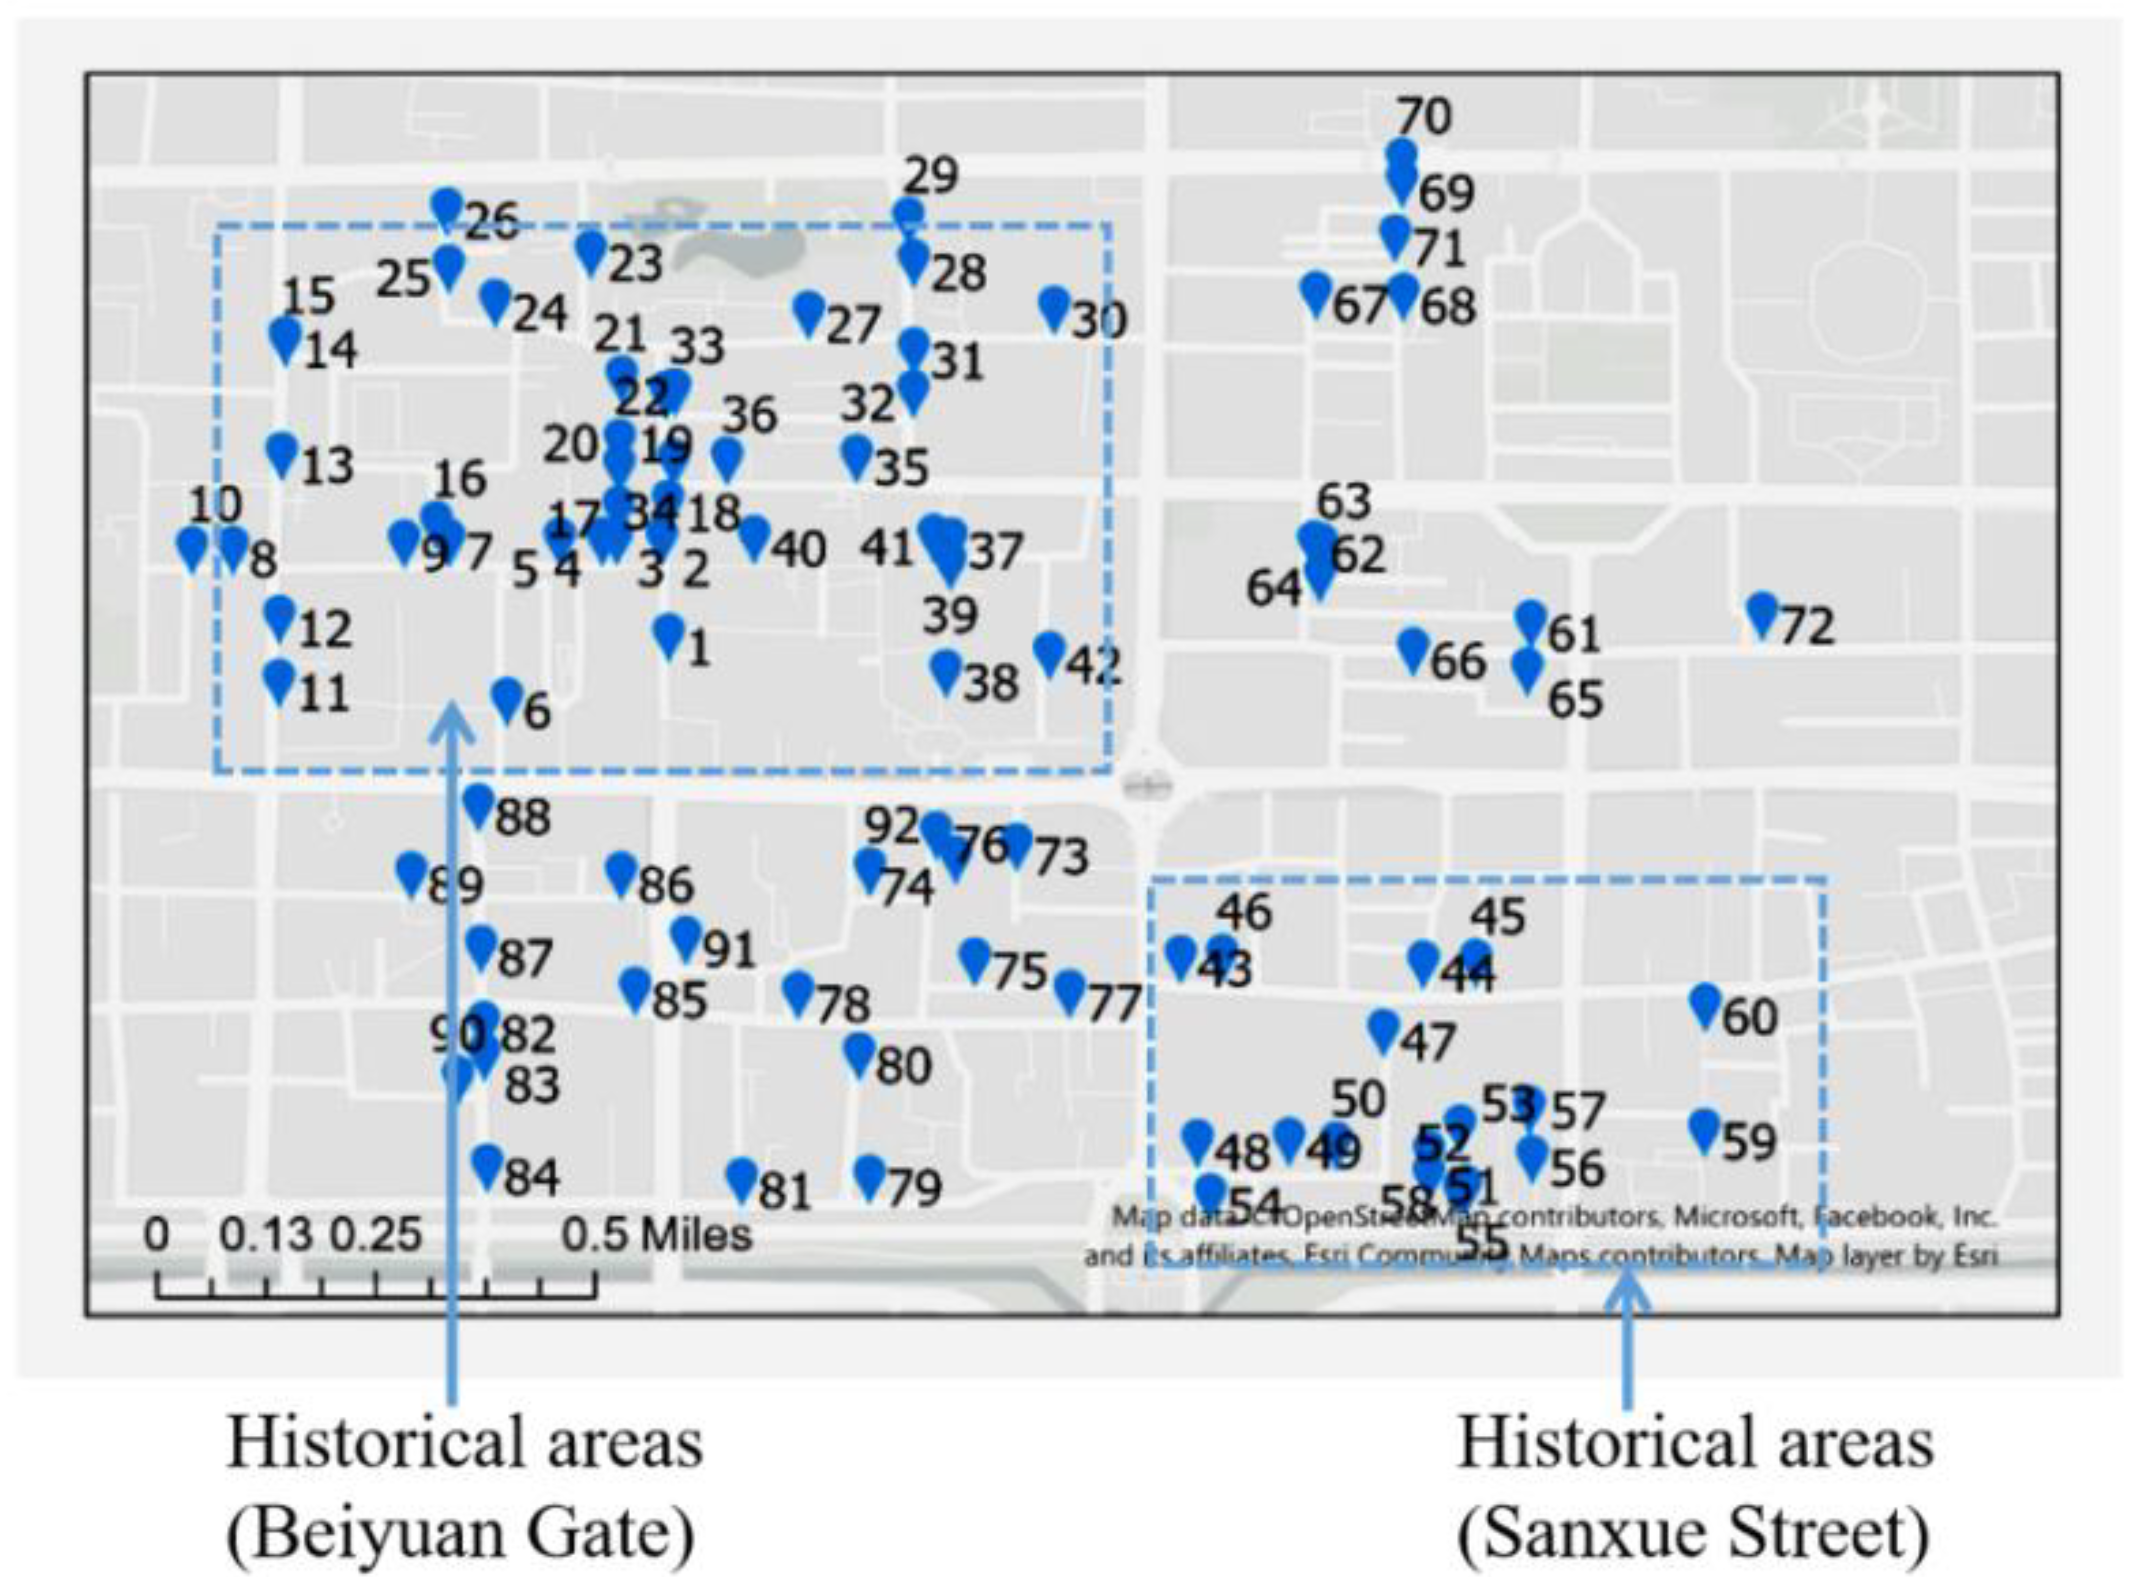
  • Download the street view image using API (Application Programming Interface) data from Baidu (photo taken in February 2019) and field survey by co-researchers (photo taken in March 2022). The same street views of the two periods (before and after the pandemic) were selected for preparation. In total, the same 92 street views were used for each of the two periods in the historical blocks and the ordinary blocks of the main urban area, and for each selected point, every two street view images with the same angle of view and size for comparison (Figure 2). It should be noted that our study is based on the examination of those photos which were taken in one season of each period (before and after the pandemic). Both are in the winter and early spring time when the pedestrian flow on the studied streets is relatively less compared to that in the summer and autumn seasons. To overcome this limitation, longitudinal studies at different time periods should be considered for future investigation.

2.2. Local Integration of Street and Walkability Evaluation Score of Selected Points

The selected target points and street views were examined using accessibility indictors based on space syntax and a walkability audit tool for establishing subjective walkability. Firstly, based on the macro indicators of space syntax, we selected two street physical attribute values related to walkability, integration (local) and connectivity, based on axial analysis from Hillier’s space syntax theory. Axial analysis is a way of analyzing spatial layouts represented by an axial map. In order to analyze the configuration layout of each city, we translated the actual spatial structure into an axial map, which is the least set of longest lines drawn tangent to vertices that can see each other [30].
The integration value essentially describes the “accessibility” of an element in the research area network. Integration values of the axial lines at radius 3 (root plus two topological steps from the root) can be used to represent a localized picture of integration (hereafter, Int-R3), which has been related to walkability in several previous studies [31,32,33].
Secondly, for our subjective walkability evaluation, through a comprehensive review of existing audit tools, we selected a limited number of items that: (1) have often been used in previous audit tools such as WASABE, PEDS, and MAPSmini [25,26,28,29,34], (2) cover various aspects of micro-scale streetscape and the characteristic contents related to Asian elements [35], and (3) were considered suitable for elements corresponding to image segmentation analysis.
The basic indicators for evaluating micro-scale walkability, which include aspects of physical conditions, safety, and the aesthetics of the streets and are basically consistent with the themes of the 91-item Environment in Asia Scan Tool—Hong Kong (EAST-HK), such as the presence of wide sidewalks, heavy traffic, crosswalks, commercial stores, street trees, attractive streetscape, and abandoned buildings, were included in our checklist [34]. East-Asian-specific elements associated with the ultra-dense cities of East Asia, such as crowdedness and the presence of man-made obstacles to walking, such as cars or motorbikes parked on sidewalks [34], were also included. To these, we added characteristics related to historic cities such as tourist shops and picturesque spots. Finally, we developed a simple checklist and identified 11 micro-scale indices to measure neighborhood walkability. These were divided into three main categories: walking environment (Q1–4), safety (Q5–7), and aesthetic and commercial value (Q8–11).
Taking the street view pictures in the DL as the evaluation object, the scores of all selected points before and after the pandemic were counted and evaluated. The walkability evaluation score (hereafter, WES) used in the study is based on the walkability checklist (Table 1), and ranged from 11 to 22.
The WES assessments in Xi’an were performed by five evaluation auditors: 3 males and 2 females in their twenties and thirties who were students or members of the staff at Osaka University or the Xi’an University of Architecture and Technology. Each auditor made a complete evaluation following standard instructions given by researchers. The image evaluations and field investigations were conducted on all selected points (Figure 2) to determine the score of each item of each street view. Ultimately, the average values for all the auditors were determined. The auditors were professionals with a related knowledge background in the subject area concerned. During the assessment, the five selected auditors independently conducted virtual audits of all the street view pictures, using the checklist (Table 1). The research team provided the auditors with clear instructions for the scoring system of the walkability checklist, and addressed issues the auditors raised (for example, determination of obstacles and crowding degree of people and vehicles). The assessment was completed in 25–30 March, and 5–10 April of 2022, and it required in total 10 days. However, it should be acknowledged that the selection of the auditor team was rather based on convenience sampling since the availability of the auditors was limited to our colleagues when the study was conducted.

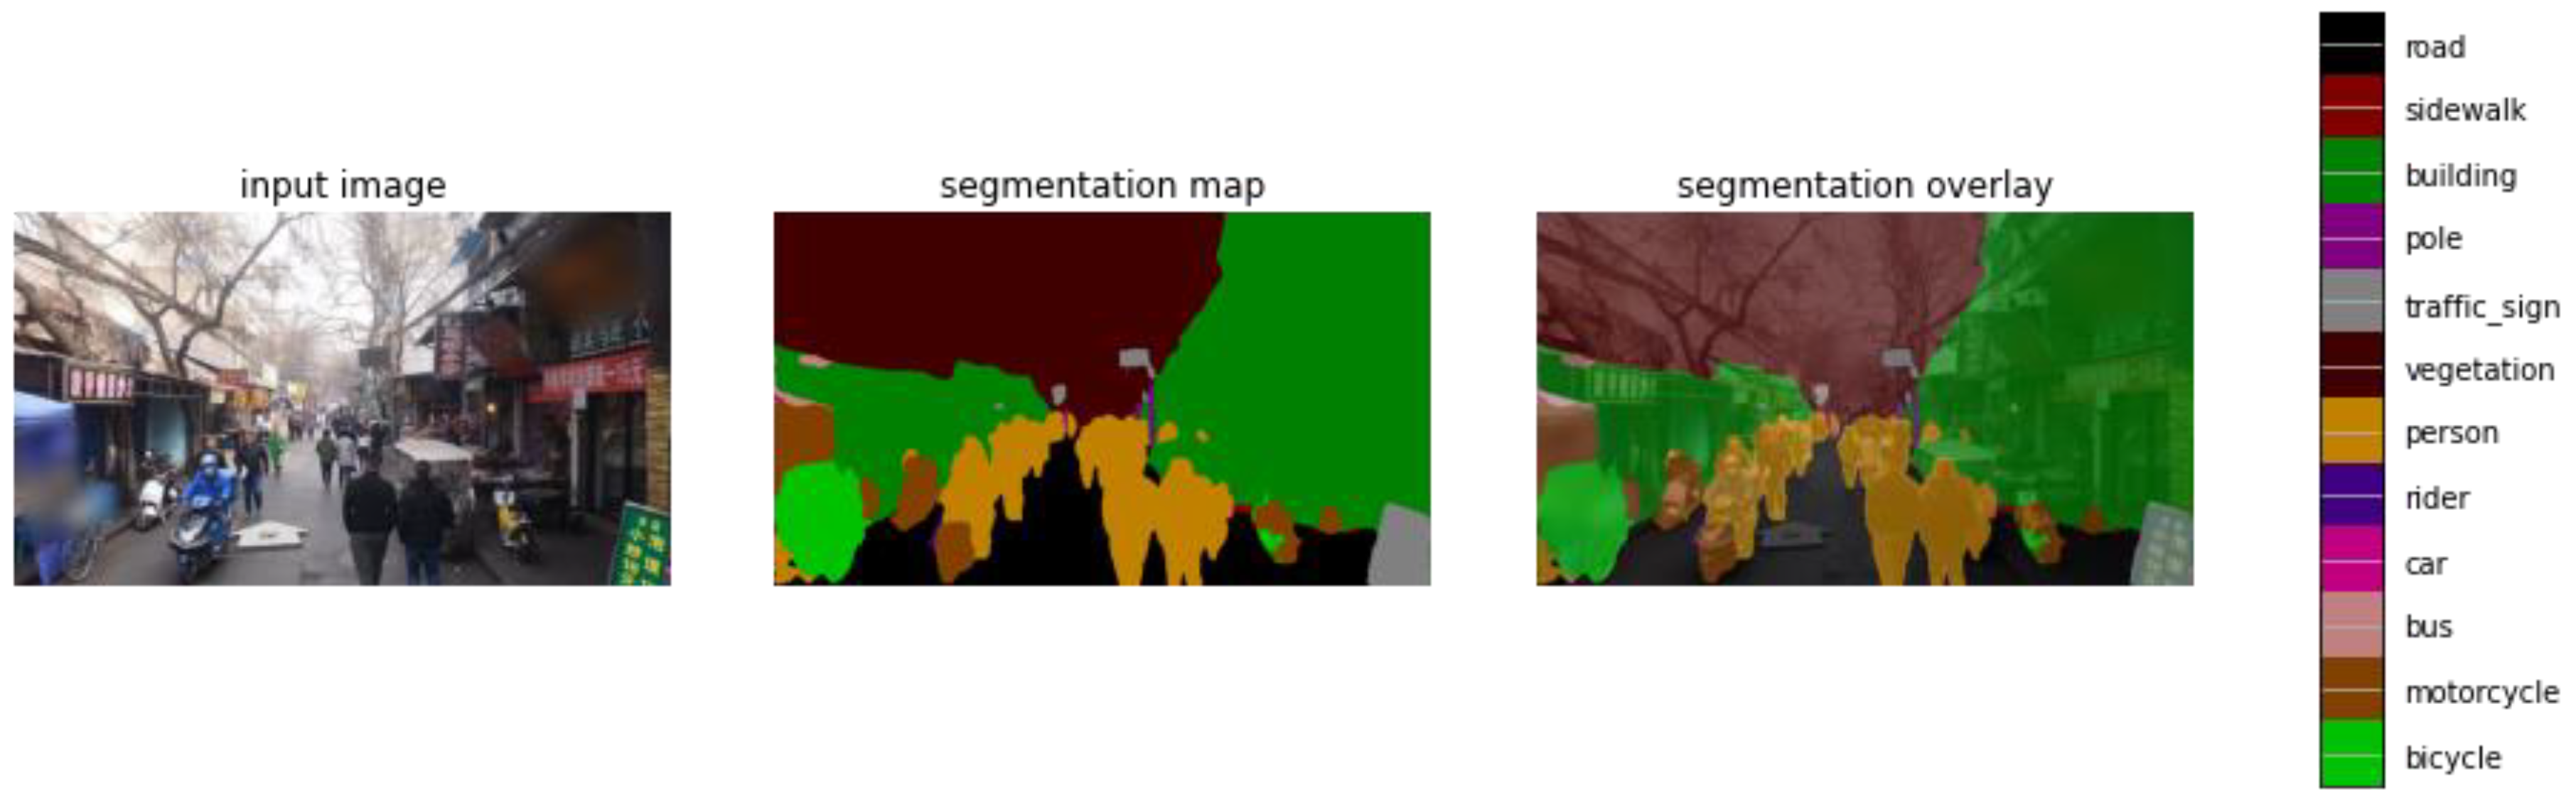
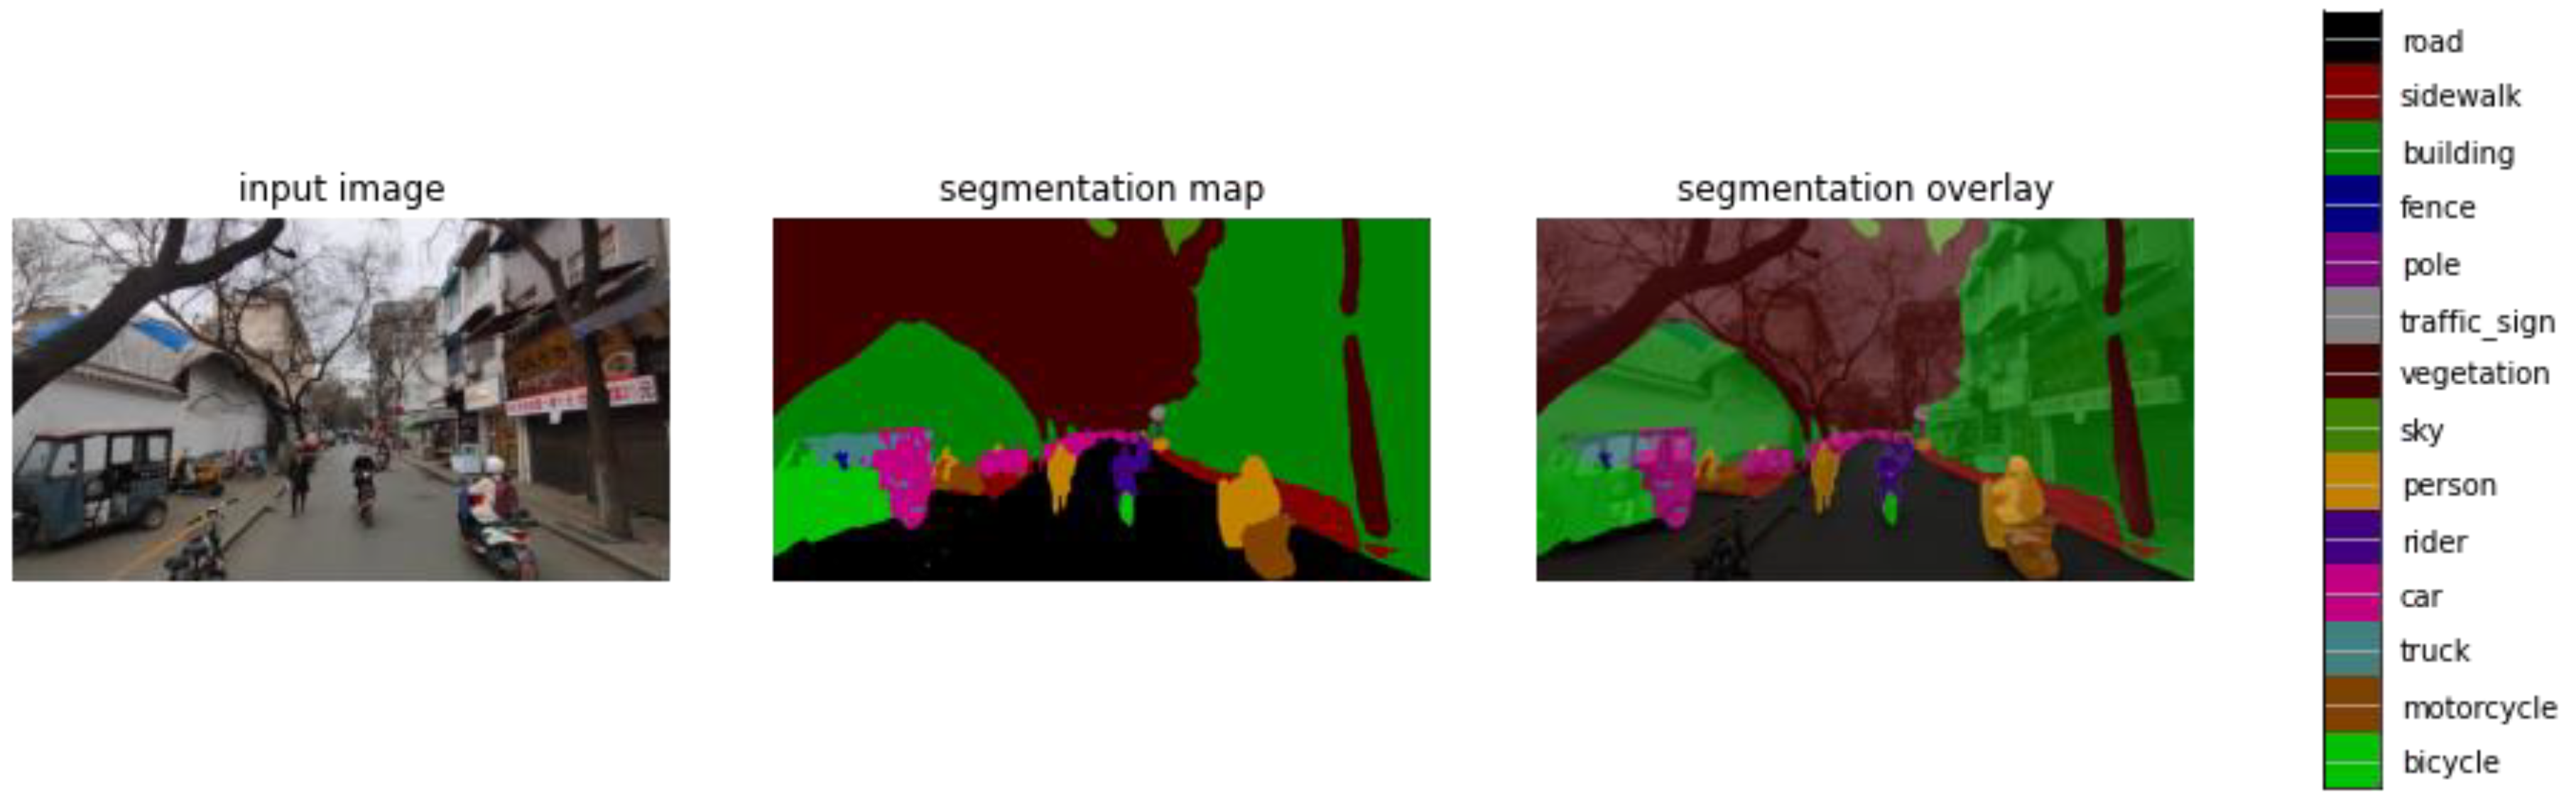
2.3. Street View Segments Recognition

To detect the component elements of each intersection’s streetscape, we used DeepLab v3+ [36], a deep learning model developed for semantic image segmentation. Many semantic pixel-width image segmentation methods based on convolutional networks have emerged recently, such as YOLO, ImageNet, SegNet, DeepLab, and so on. DeepLab is considered as highly accurate and easily accessible [37,38].
DeepLab v3+ architecture characteristically adopts atrous convolution in encoder–decoder networks [36]; in this encoder–decoder structure, the resolution of the extracted encoder features can be arbitrarily controlled by atrous convolution to compromise between accuracy and running time.
In this study, we used the top-performing DeepLab V3+ model called xception71_dpc_cityscapes_trainval, with a Cityscapes mIOU (Model evaluation index: Mean Intersection over Union) of 82.66%. The DeepLab v3+ model was trained on streetscapes using the Cityscapes Dataset [39,40], which is an image dataset with an annotation of streetscape segments. The annotations are defined for 30 classes based on 7 groups and are recognized as streetscape components, such as human, vehicle, ground, building, infrastructure, nature, and sky. The dataset provides 19 classes for training (road, sidewalk, building, wall, fence, pole, traffic light, traffic sign, vegetation, terrain, sky, person, rider, car, truck, bus, train, motorcycle, and bicycle); the other 11 classes were excluded from the dataset due to rare segments appearing in the streetscapes [39]. Finally, by identifying the pixels in each street view element classified into one of the 19 segments, the percentages of segments (hereafter, PSG) for each street view images can be calculated. The average value of the overall extraction percentage for every image also reached 91.6% and 90.9% in 2019 and 2022. When a single image had large deviations, we can improve it by adjusting the color tolerance of extracted elements.
The specific steps and methods for using the models were as follows: firstly, load the latest version of the pretrained DeepLab model for feature extraction; then, load the colormap from the Cityscapes dataset. Next, add colors to the various labels, such as “orange” for person, “green” for bicycle, etc. Finally, visualize the image and add a color overlay to the different regions.
Based on the above steps, we completed the image segmentation of all the street scenes with the same virtual angle at 92 selected points in Xi’an before and after the COVID-19 pandemic. An example of the street view pictures before and after the COVID-19 outbreak is shown in Figure 3 and Figure 4.

2.4. Multiple Linear Regression Analysis

2.4.1. Create Model

We used a multiple regressive model in SPSS to find correlation between the subjective walkability evaluation scores, street view segments, and street physical attribute values of space syntax. The results of the walkability evaluation score of the selected points (Table 1) were taken as the object variable. The other two types of indicators were used as explanatory variables—in particular, the percentage of each street view-segmented element and the two street attribute values (Int-R3 and connectivity) obtained by the axial analysis of space syntax. In order to select influential variables to build our regression model, we used the step-wise regression method to screen variables from the list of many possible independent variables so as to obtain the optimal regression equation.

2.4.2. Exclude Collinearity

For each explanatory variable, we checked for multicollinearity, since there may be multicollinearity among the explanatory variables that could adversely affect the estimation accuracy of the model. Using the Variance Inflation Factor (VIF) to assess multicollinearity, if we found that the value of the VIF for a variable was greater than 10, then the presence or absence of the effect of that variable was re-examined.

3. Results and Discussion

3.1. Walkability Evaluation Score and Street Physical Attribute Values of the Selected Points

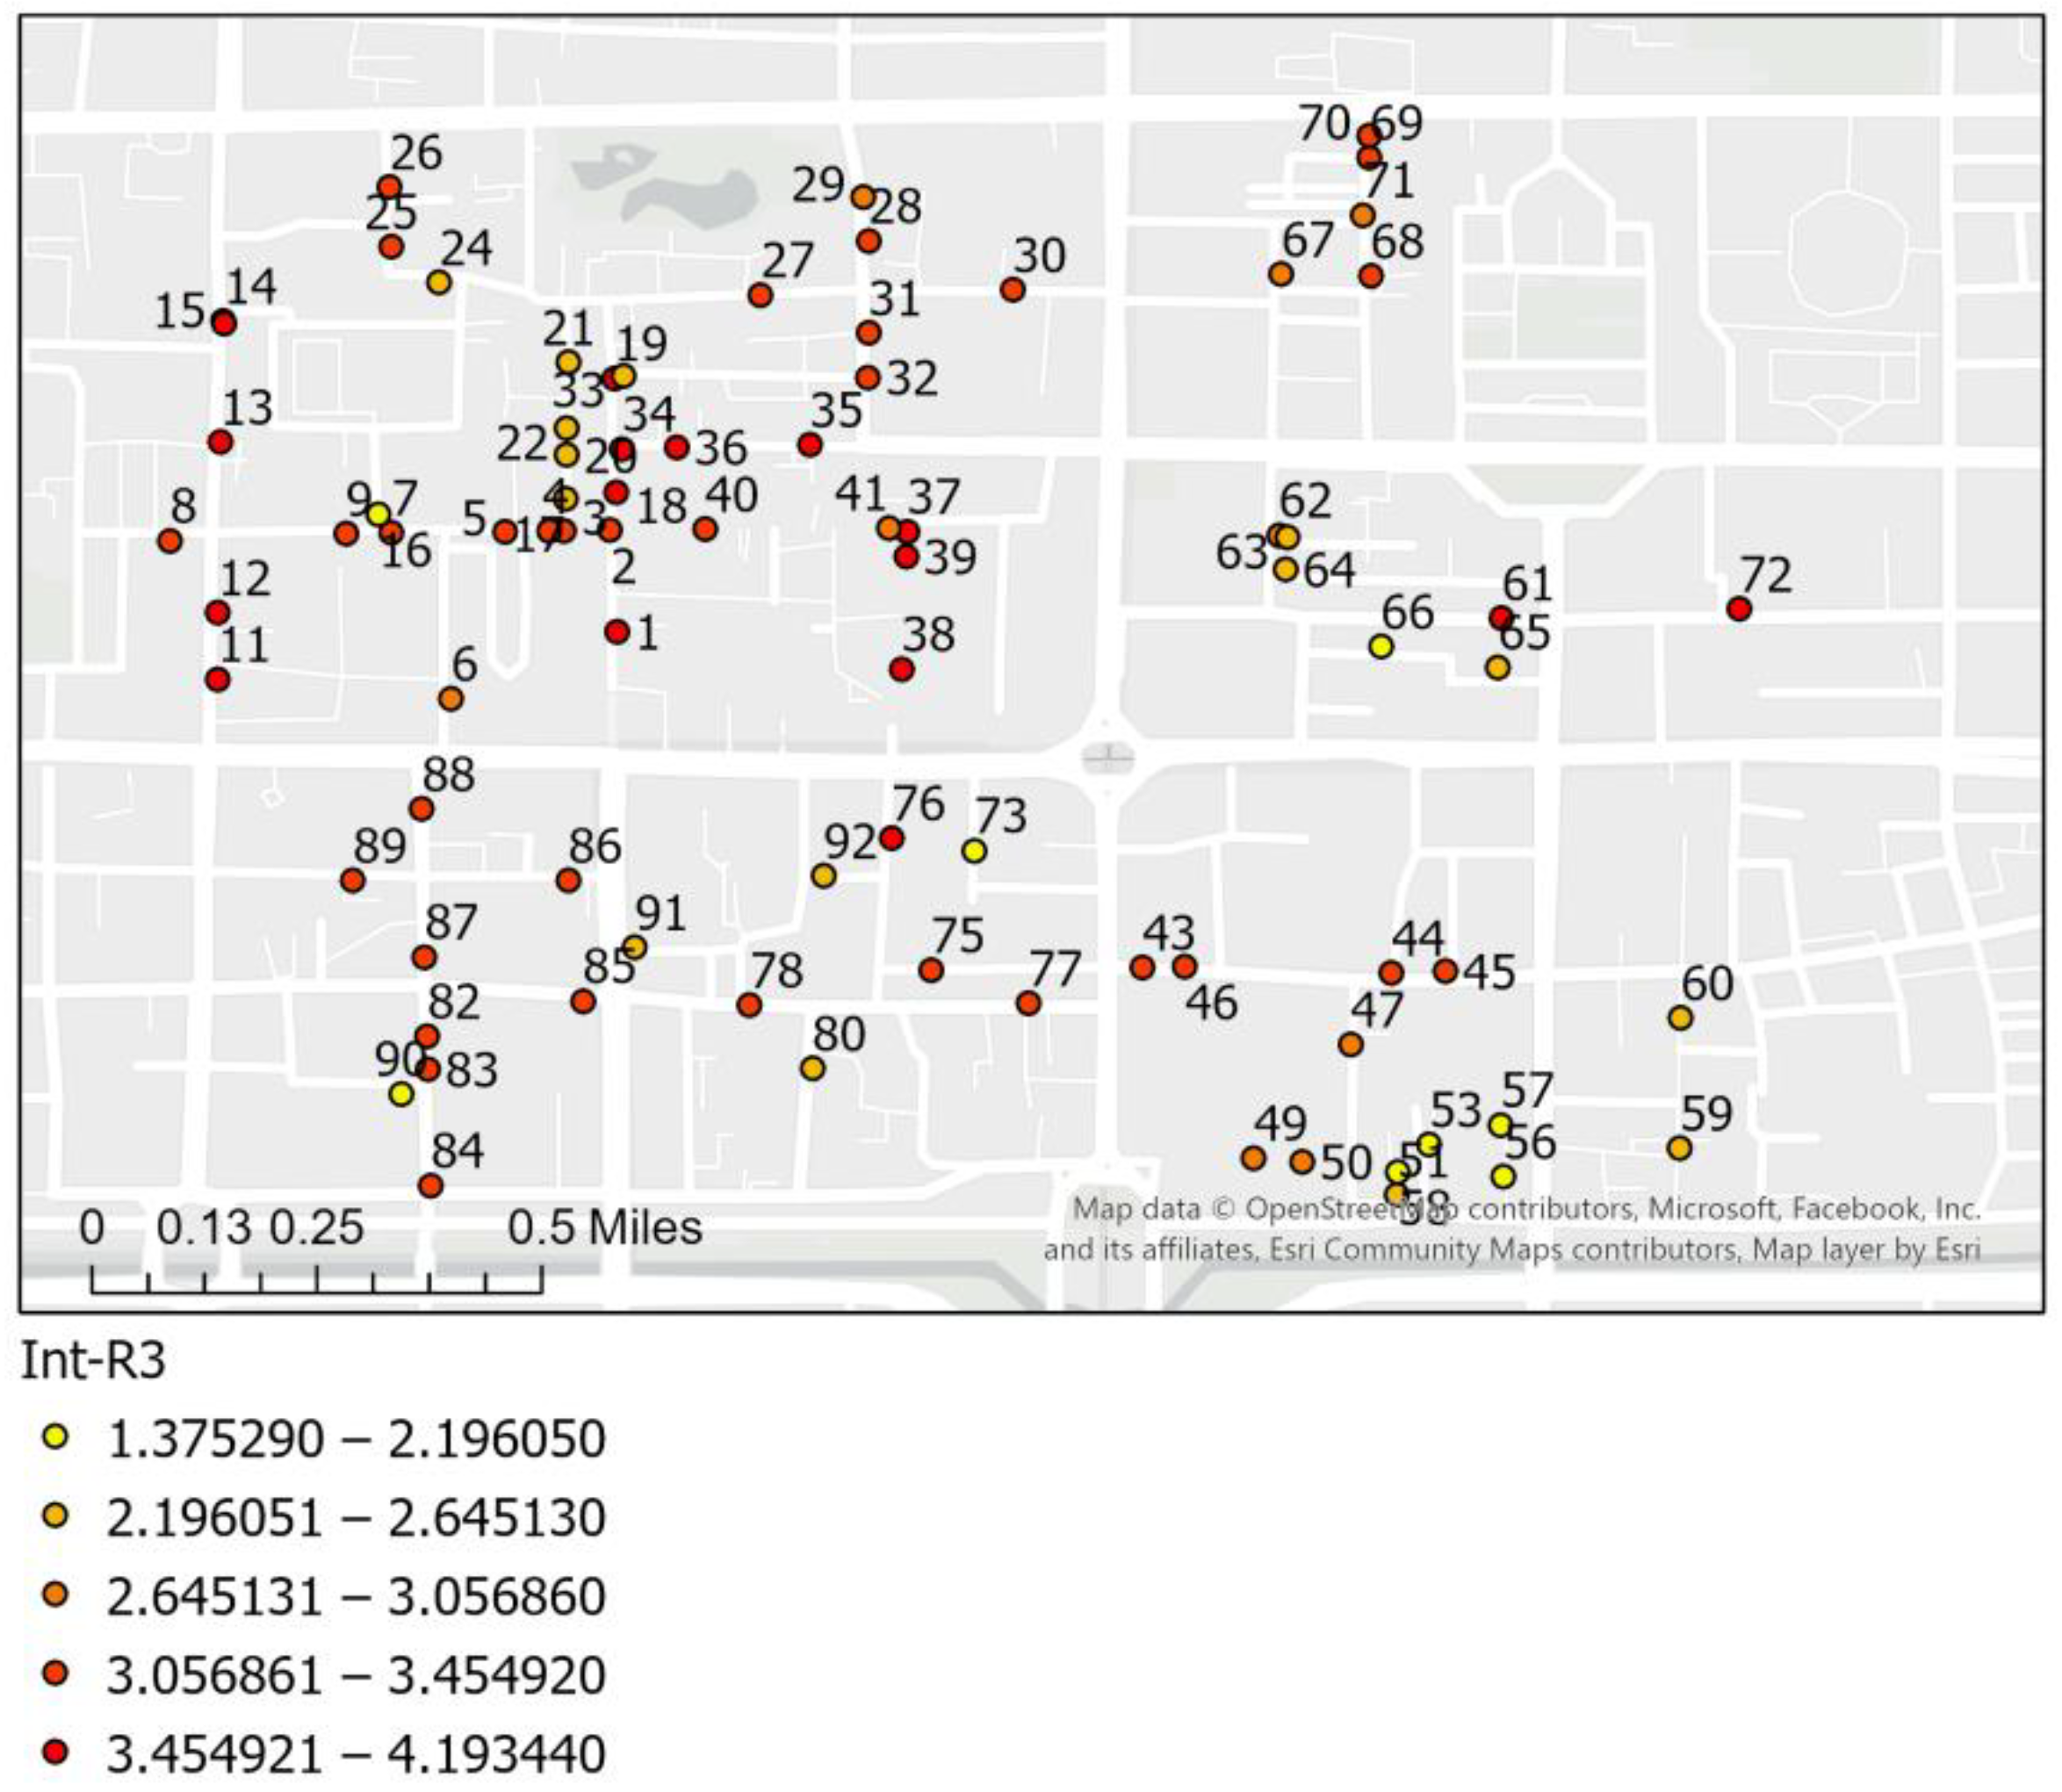
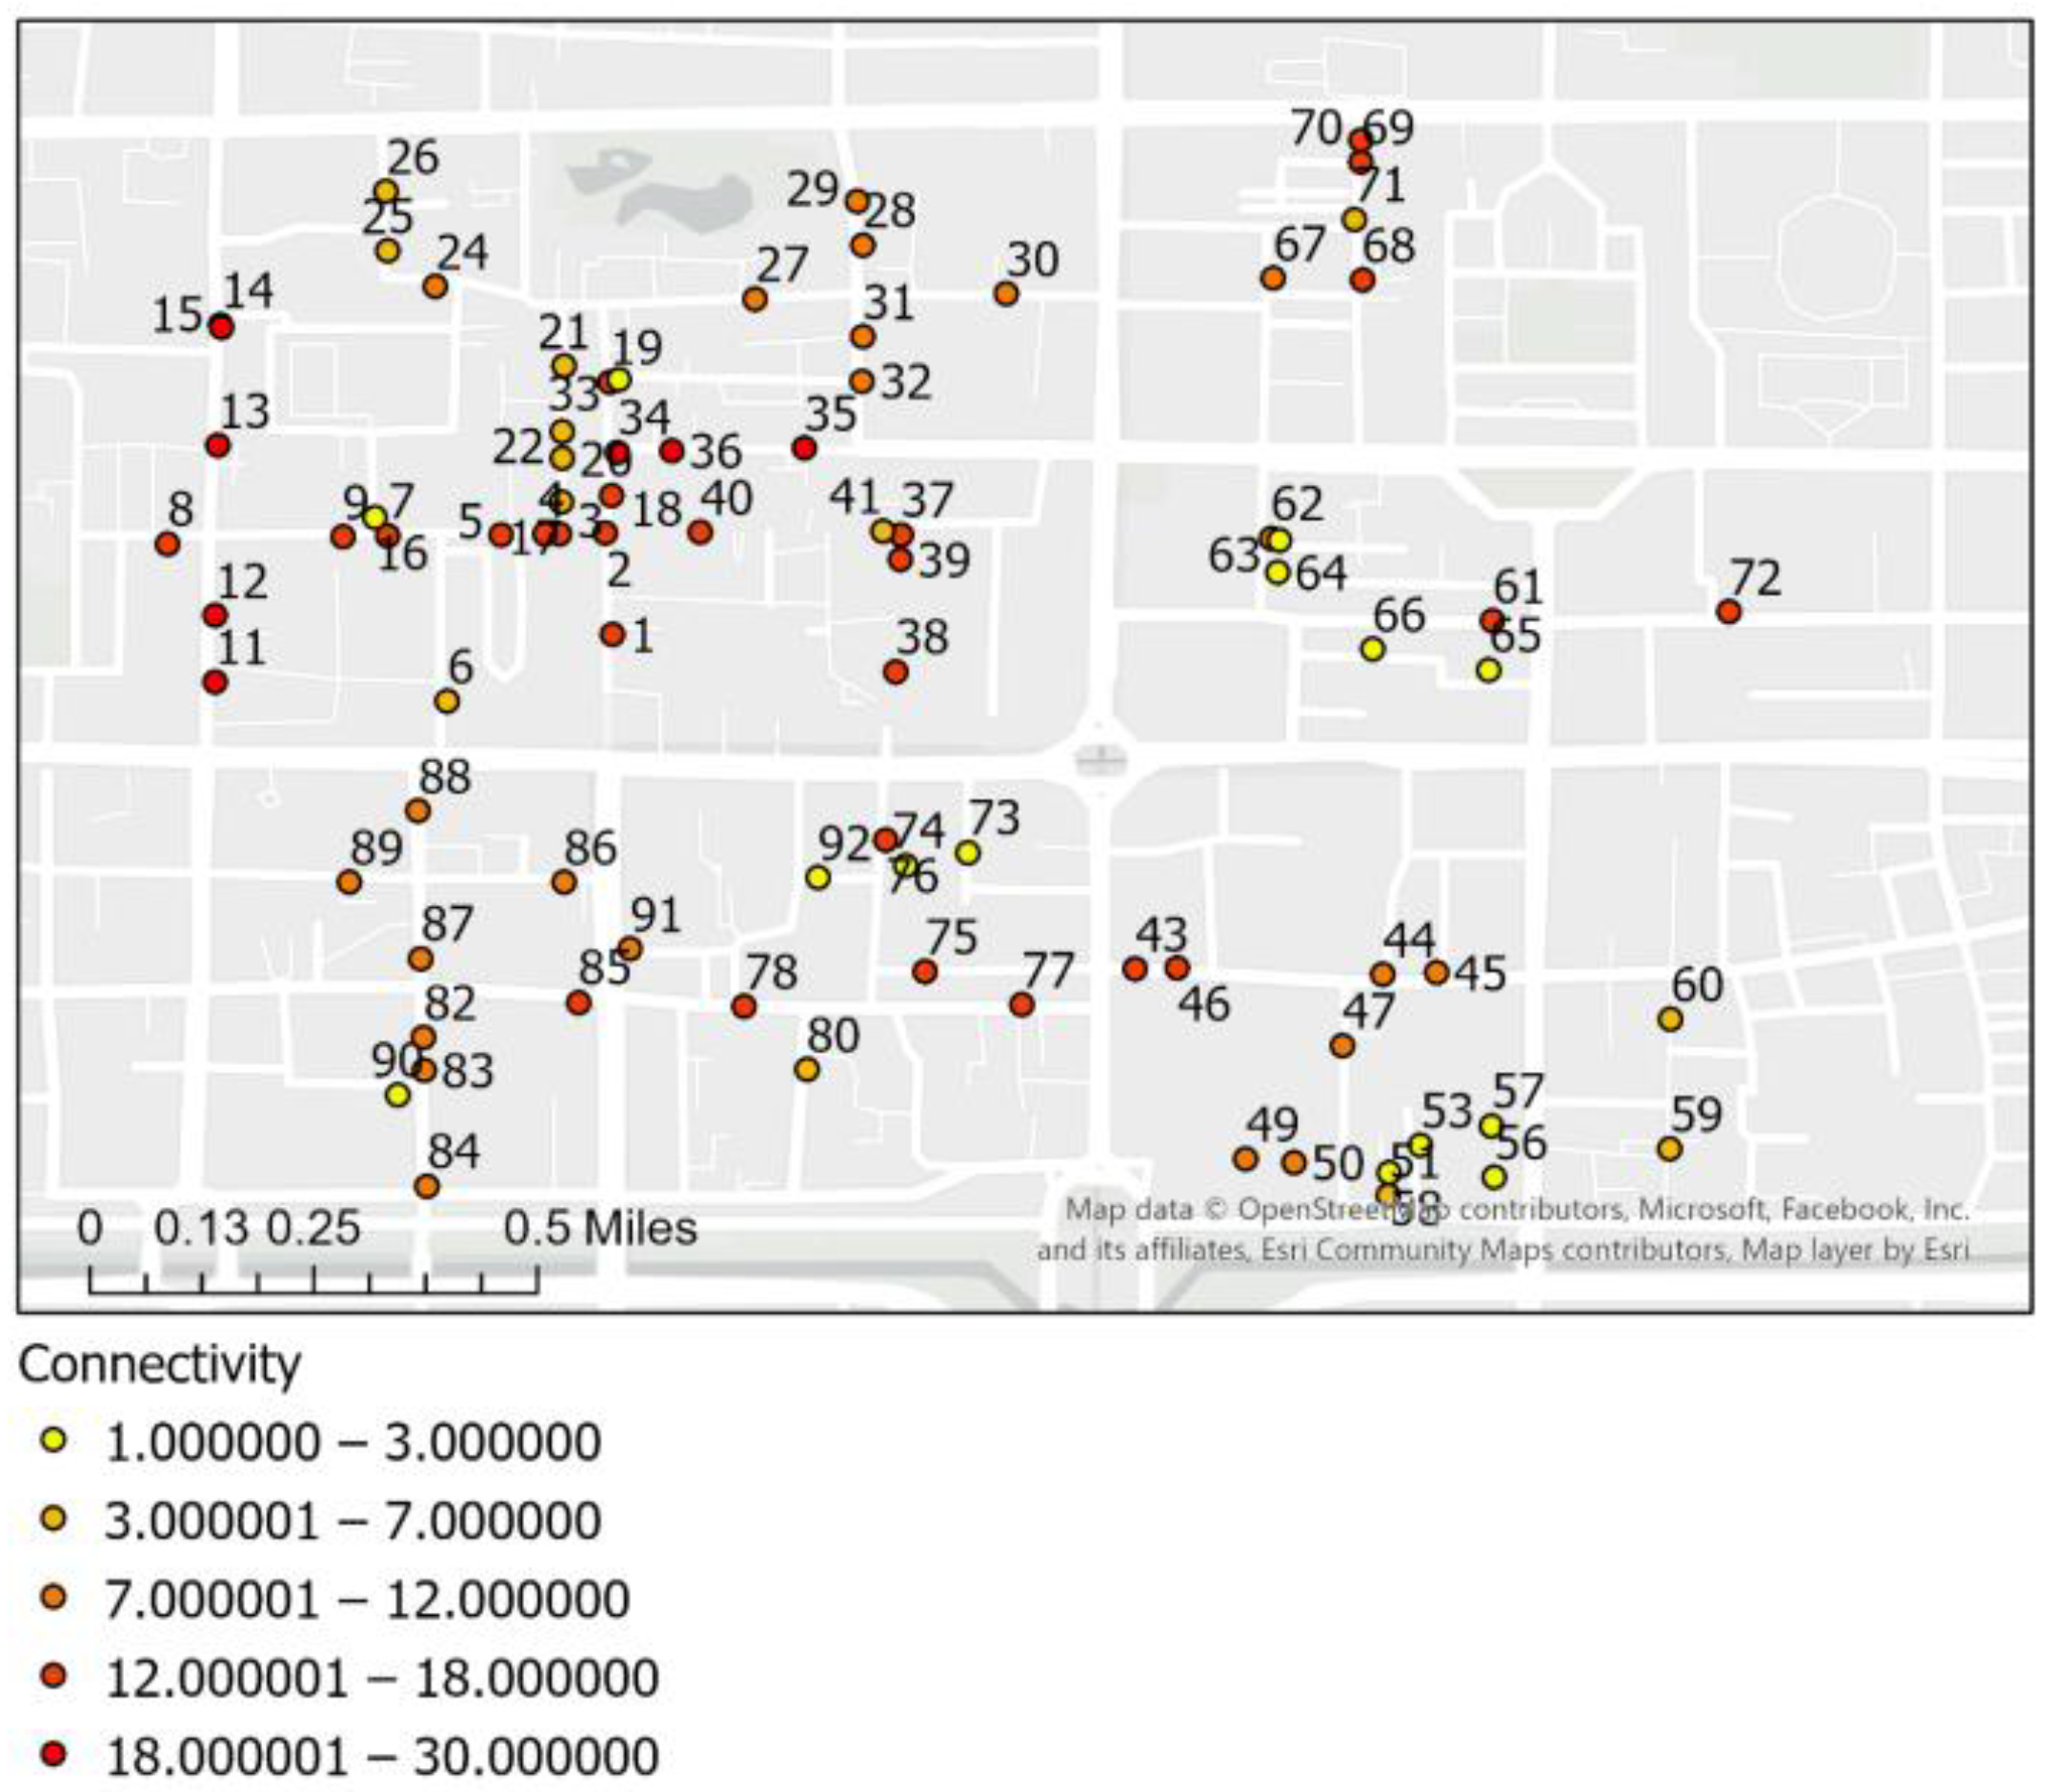
3.1.1. Two Macro Street Physical Attribute Values by Space Syntax

As can be seen from the axis diagram, the points of Beiyuanmen historical block in the northwest corner has a relatively high degree of Int-R3 (3.37); however, the average value of Int-R3 (2.66) in the historical block of Sanxue Street in the southeast corner is lower than that in the ordinary (residential) areas (3.02). Thus, it can be said that the distribution of Int-R3 within the old city is not uniform (Figure 5). Notably, the connectivity and Int-R3 for the two periods show the same characteristics. In Xi’an, the average connectivity of the two historical blocks (Beiyuan Gate and Sanxue Street) was 14.59 and 8.12, respectively, and the average value for the southwestern and northeastern ordinary areas was 9.71 (Figure 6).
On the whole, the overall integration consistency of Xi’an’s streets is not strong. In particular, Xi’an’s Int-R3 is not uniform inside the old city wall.

3.1.2. Walkability Evaluation Score (WES) of Selected Points before and after COVID-19

Based on the subjective walkability scores (WES) submitted by the auditors (Table 2), the total average score of subjective walkability in 2019 (17.81) was higher than that in 2022 (17.42), especially in the historical areas. There were large changes in obstructions and motor vehicle parking (as related to the walking environment aspect), vehicle and pedestrian traffic (the safety aspect), and attractive sites and commercial stores (the aesthetic and commercial value aspect). Among these, the obstacles and vehicular traffic scores improved (from 1.45 to 1.64, and from 1.78 to 2.00, respectively); however, the scores for pedestrian traffic, attractive sites, and, especially, commercial stores decreased significantly (1.24 to 1.07; 1.35 to 1.20; 1.80 to 1.47).
In addition, the evaluation scores for the two studied periods showed their own characteristics in these three categories (walking environment, safety, aesthetic and commercial value). In 2019, the WES for sidewalk width (walking environment) in the historical areas (1.85) was similar to that in the ordinary residential areas (1.83), with more obstructions (1.26 to 1.66), but fewer cars parked (1.81 to 1.40) in the latter. In terms of safety, the vehicular traffic situation in the ordinary area was better than that in the historical area (1.82 vs. 1.74), but the score for pedestrian traffic was much worse. As regards the aesthetic and commercial aspects, owing to a large number of tourists, the average score for commerce and attraction in the historical blocks is much higher than that for the ordinary areas (1.96 to 1.63); both areas had few construction sites and a similar vegetation situation.
In 2022, the walking environment scores in the historical blocks, except for vehicles/bicycles parked, were worse than those in the ordinary areas (1.76 to 1.52). While in terms of safety, the three indicators of vehicular traffic flow, pedestrian flow, and crossroad were better in the historical area than in the ordinary residential areas (2.0 to 1.98, 1.13 to 1.0, and 1.2 to 1.0). Moreover, in terms of the attraction and commercial store indicators, the historical blocks continued to be evaluated better than the ordinary blocks after COVID-19 (1.28 to 1.1, and 1.65 to 1.25).
Generally speaking, our results showed that the walkability scores assessed in 2022 were superior to those in 2019 in terms of walking environment (with fewer obstacles and parked motor vehicles) and safety (as related to vehicle and pedestrian flow). However, the total WES in 2022 is lower than that in 2019 due to the impact of the pandemic on street vitality, both in terms of street aesthetic and commercial values. The effect of COVID-19 on the vitality and livability of streets, especially in the historical blocks, is apparent.

3.2. Overall Evaluation of Street View Segments Recognition in Xi’an before and after COVID-19

As can be seen in Table 3, which shows the average PSG of all the selected points in Xi’an before and after COVID-19, the urban structure has not changed much over the past three years. The top three segments composing the street scenes in Xi’an in 2019 are “building”, “road”, and “vegetation”. The segment of “building” has the largest proportion, accounting for 40.00% of the studied street views. The second largest is “vegetation”, at 22.08%, followed by “road”, at 12.68%. In 2022, “building” still appeared to be the largest proportion (40.56%). The next largest is “vegetation” (18.34%), followed by “road” (16.47%). The proportion of “building” in 2022 is similar to that in 2019.
The proportion of the presence of a “person” in Xi’an is 4.3% before the pandemic, much higher than the corresponding 1.87% in 2022. Considering the reduction in the pedestrian proportion from 2019 to 2022, the proportion of Xi’an’s “road” and “sidewalk” does not change much, and the street layout remains dominated by street trees on both sides of the street, which still accounts for a large proportion. As the road network has not changed, the proportion of “road” and “building” has not changed noticeably.
In Xi’an, because the historical blocks are a tourist destination, there are many snack bars and signboards on both sides of the street, attracting large numbers of tourists. Mobile stalls are also found continuously in the historical blocks. However, due to the impact of COVID-19, the number of tourists has fallen markedly, and some shops have been temporarily closed, resulting in a reduction of store signs and a decrease in the continuity of shops, especially in the historical blocks (Figure 7 and Figure 8).
The roads in the historical blocks are relatively narrow, and most of the merged roads (roads often have been designated for pedestrians) in Xi’an are pedestrianized. This is regarded as a tourist attraction, attracting both persons and motorcycles. Because many locals and tourists come into the historic center, the main travel mode is walking. There are also large numbers of motorcycles used both for sightseeing and goods transport. Ordinary cars are inconvenient here and are generally restricted from entering the historic center. Notably, after the pandemic, although there are fewer people, the proportion of motorcycles has not decreased, and local residents still use the more convenient motorcycles rather than bicycles in their daily life (Figure 9 and Figure 10). In Xi’an, there are only a few zebra crossings in the historical blocks, and the proportion of electric poles and light boards is small due to the blockage caused by trees.

3.3. Regression Analysis for Model Construction and Evaluation of Influencing Factors

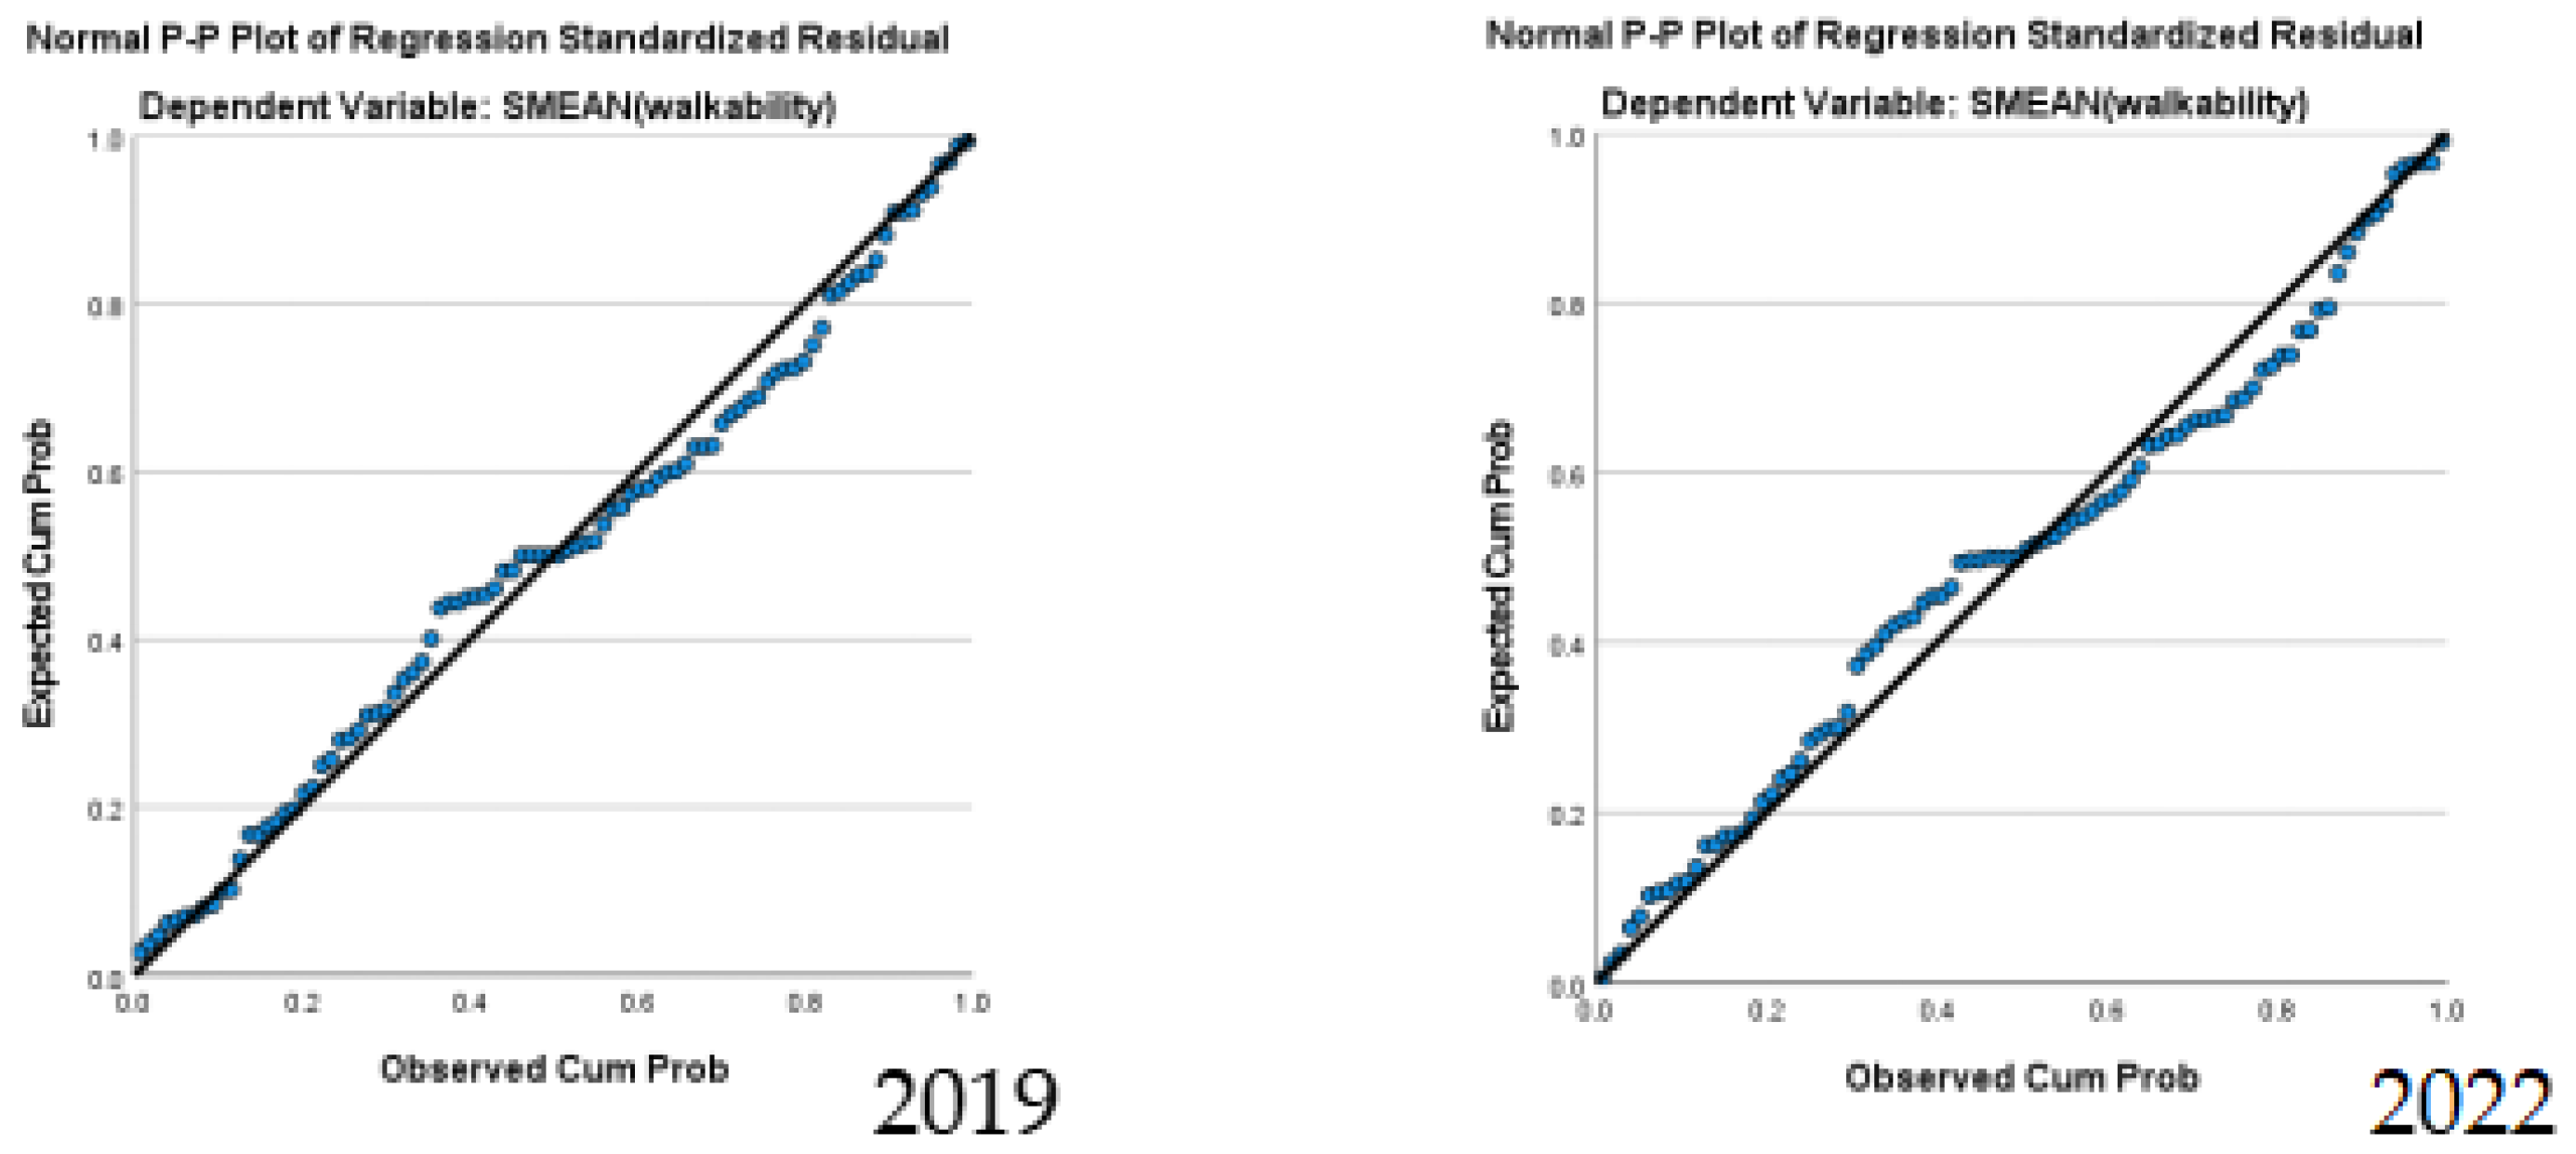
3.3.1. Evaluation of the Model

Based on the results from image segmentation by DL, the walkability evaluation score (WES) on every picture, and the street attribute values calculated by Space Syntax, we created a walkability evaluation system using regression analysis. The model we developed was used to evaluate the respective explanatory variables of the system and to ultimately compare the changes in walkability in Xi’an before and after the COVID-19 pandemic. In the following, an evaluation of the model and its significant explanatory variables is discussed.
Table 4 shows the coefficients of determination of the model for Xi’an. As can be seen in the table, the R squares of the two regression models before and after the COVID-19 pandemic are 0.622 and 0.510, respectively. The F values (Table 5) were 7.41 for the 2019 model (significant at the 1% level) and 4.686 for the 2022 model (significant at the 5% level). The suitability test of the model is mainly based on residual analysis and from the residual normal probability plots, it can be seen that the residual conforms to the normal distribution (Figure 11).
A diagnosis of multivariable multicollinearity based on VIF (Variance Inflation Factor) values was conducted to ensure that the variables are independent of one another and that there is no obvious error in the final results. As can be seen in Table 6 and Table 7, the VIF for each of the independent variables is below 10, which essentially meets the condition of noncollinearity of variables.

3.3.2. Comparative Analysis of Influencing Factors (Significant Explanatory Variables)

The significant (5%) factors (explanatory variables) affecting walkability score before the pandemic in 2019 are “Connectivity (positive)”, “Person (positive)”, “Fence/stall (negative)”, and “Motorcycle (negative)”. The significant (5%) factors after the pandemic are mainly “Connectivity (positive)” and “Road (positive)”; noticeably, the factors of “Person”, “Motorcycle”, and “Fence/stall” seem to have disappeared in 2022 (Table 6 and Table 7).
It would appear that from 2019 to 2022, the positive correlation between the presence of person and walkability (WES) has weakened and the proportion of pedestrians has decreased significantly, as people prefer to stay at home following the lockdown policies in Xi’an.
The positive correlation of street connectivity and walkability (WES) appears not to have been greatly affected by COVID-19. However, before COVID-19, the street vitality indicators had a substantial impact on walkability. After the pandemic, with the decline of street vitality aspects, the walking environment indicators became more prominent, showing a stronger impact on walkability, with, for example, the proportion of roads in 2022 showing a positive correlation with walkability. This may be explained by the possibility that, after the pandemic, fewer people in the area produced more spacious roads.
In contrast, it is obvious that walkability (WES) in both areas is negatively correlated with the presence of motorcycles before the pandemic. This is possibly due to the large proportion of people using motorcycles and the traffic congestion associated with motorcycle use. After the pandemic, due to the improvement in the walking environment, factors such as heavy traffic that are negatively related to walkability were reduced.
The suggestion here is that while the street network and urban structure have not changed much over the past three years, the elements that make up the bustle and lively atmosphere of Xi’an’s urban area have changed dramatically, as is evidenced by the changes in the explanatory variables between the two periods.

4. Conclusions

This paper quantitatively compares the components of street scenes in the main urban areas of Xi’an before and after the COVID-19 pandemic. Factors that impact walkability were identified using a regression model of the two periods, and suggestions for creating a pedestrian city in the post pandemic era of Xi’an are offered. The main features of the study can be summarized as follows:
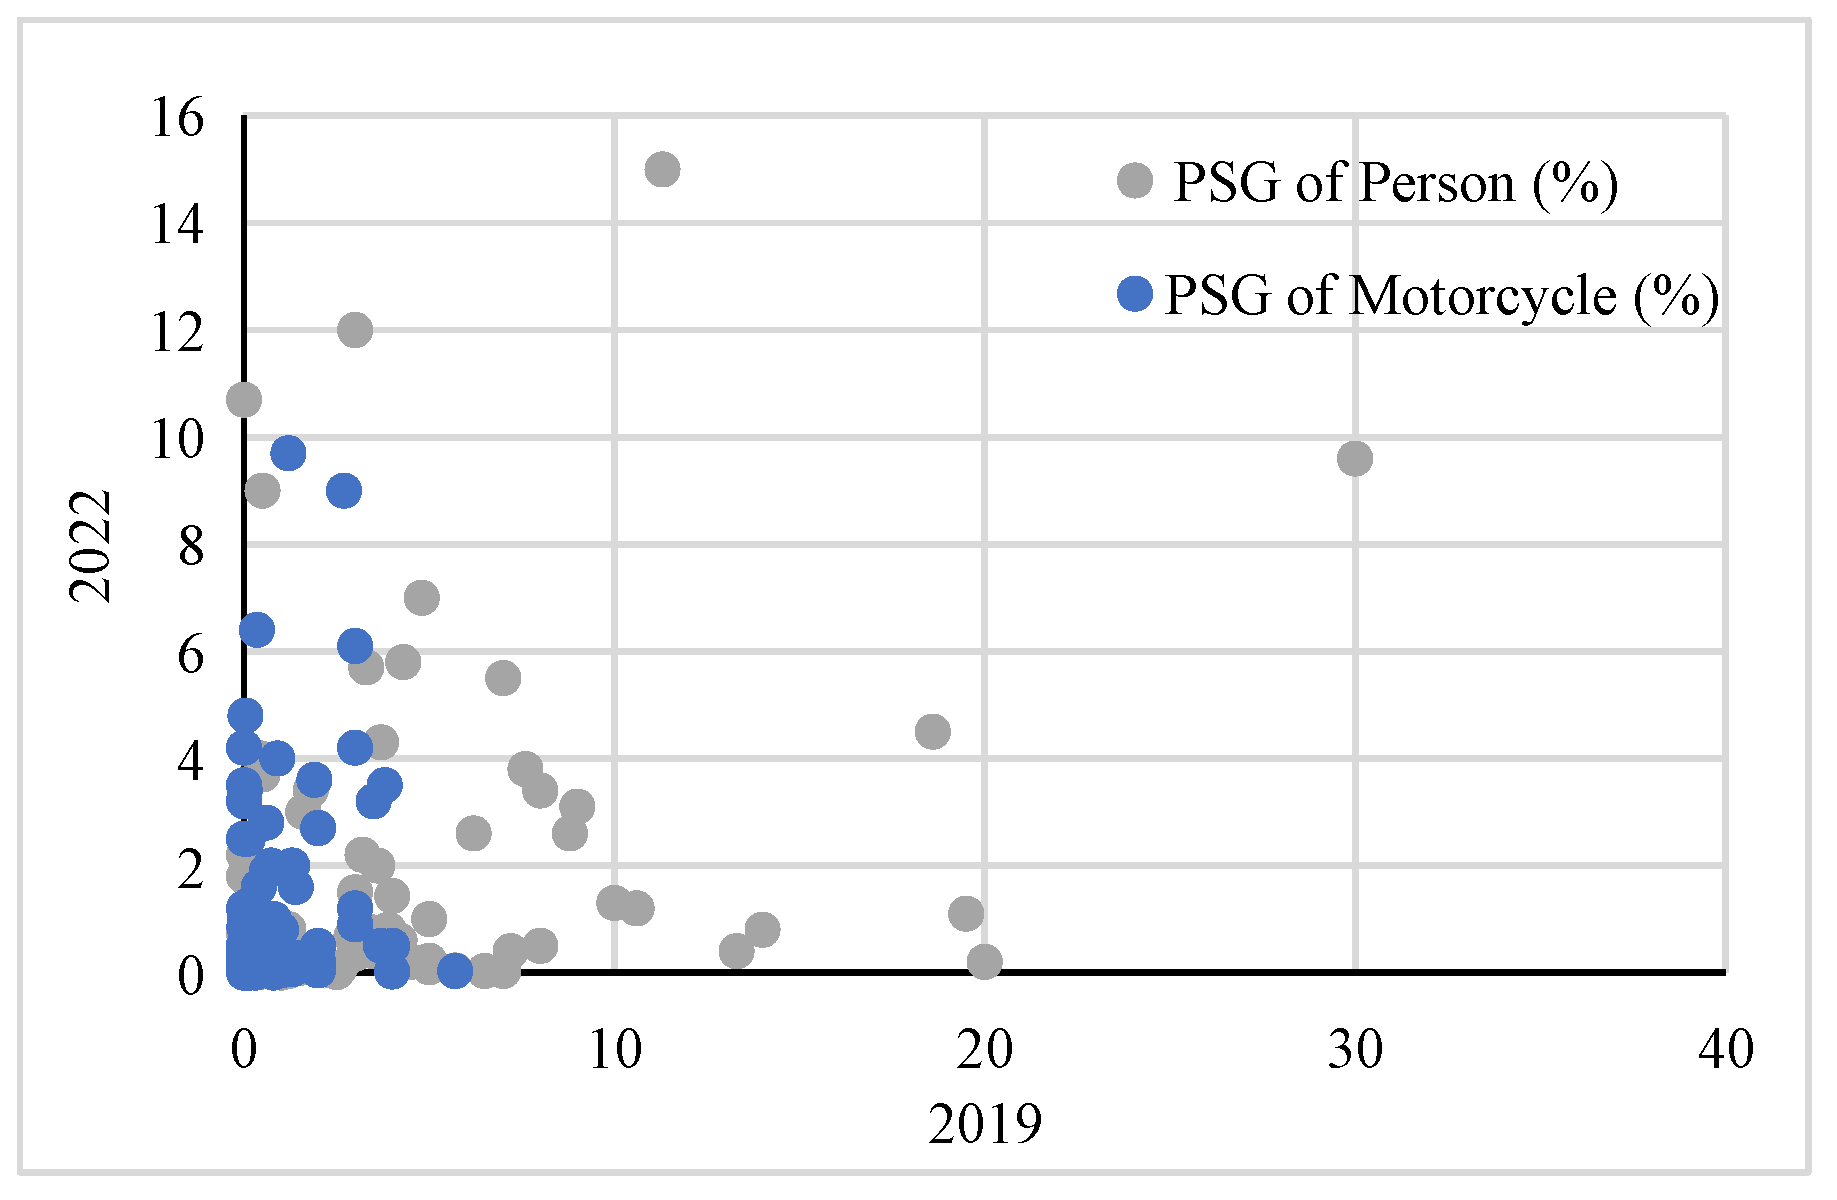
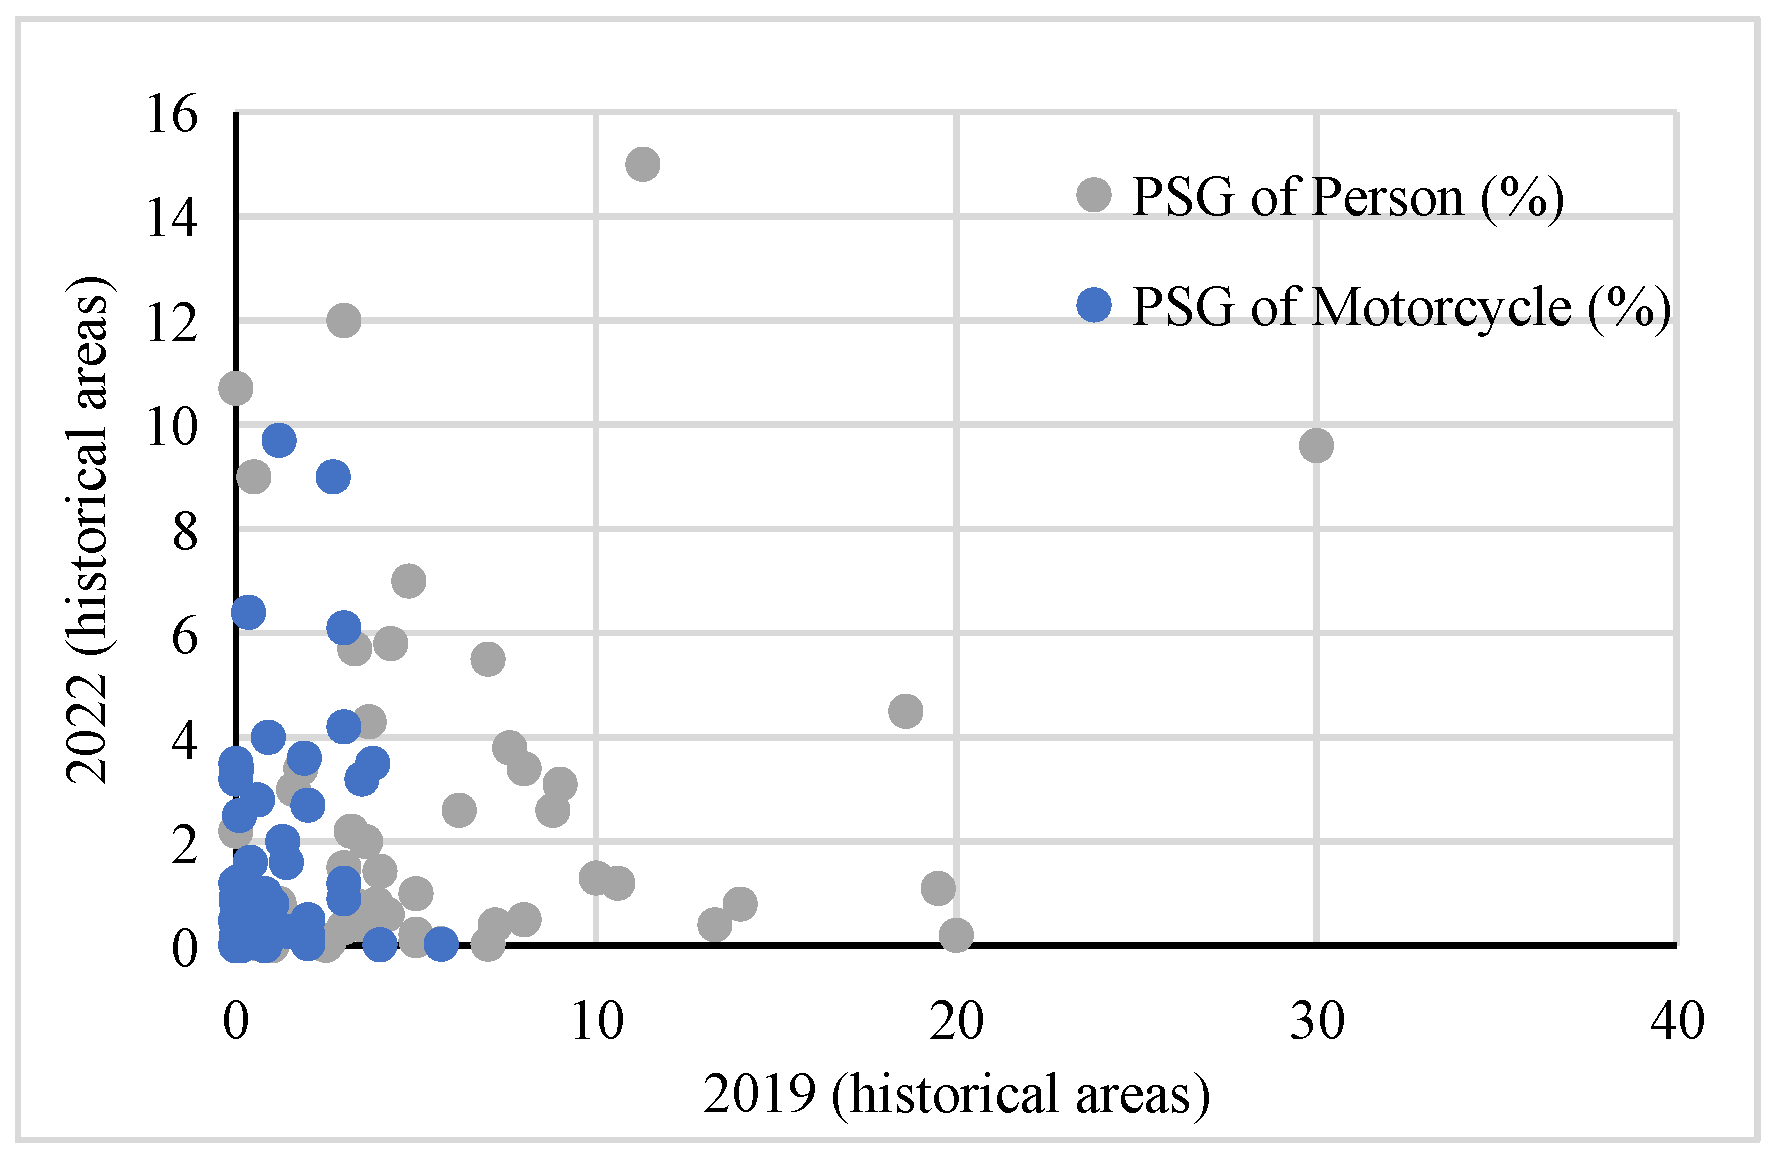
  • The composing elements of streets and roads were quantitatively described through image segmentation using street views of selected points, and the spatial characteristics of the pre- and post-pandemic periods were compared. The basic street network or structure has remained essentially the same, and the top three segment proportions of “building,” “road,” and “vegetation” did not change substantially between the two periods, while the proportion of the presence of “person” fell dramatically, from 4.3% (2019) to 1.87% (2022).
  • Based on the walkability checklist, the 2022 results were superior to those of 2019 in terms of the walking environment, with fewer obstacles and parked motorcycles, and better safety as it relates to vehicle and people flow. However, the total score in 2022 was lower than in 2019 due to the impact of the pandemic on street vitality, as reflected in street aesthetic and commercial values, in particular. The impact of the pandemic on the vitality of streets, especially in the historical blocks, is evident.
  • The significant positive factors (explanatory variables) affecting walkability in 2019 were “connectivity” and “person”, whereas the significant positive factors in 2022 mainly are “connectivity” and “bicycle”. On the other hand, it is obvious that walkability is negatively correlated with motorcycles before the pandemic. Although the street network and urban structure has not changed much during the three-year span of the study, the elements that make up the bustle and atmosphere of the urban area have changed dramatically. The main indicators affecting walkability have changed from street vitality before the pandemic to street environment after the pandemic.
As a factor having real influence on walkability, the pandemic situation needs to be taken into account when developing evaluation indicators for future research. Street vitality, particularly in terms of street aesthetic and commercial values, was shown to have a negative impact on the walkability of the studied area. Parking and traffic safety problems caused by the increased use of motorcycles also have an obvious negative effect. To create a walkable street, obstacles such as parked motorbikes should be removed, while improved safety measures to pedestrians and the role of atmospheric aspects in increasing the vitality of streets should be reconsidered. In sum, there is clearly room for improving the walking environment of historical blocks in the post COVID-19 era.
Future research areas are considered in conducting a longitudinal study based on this methodology for the post pandemic periods in the coming years, not just in one season that may not show the overall characteristics of different seasons of pedestrian flow. Furthermore, a comparative study of different locations in Asian and European countries would bring a worthwhile insight since those countries imposed different levels of restrictions on tackling the COVID-19 outbreaks.

Author Contributions

K.Y. (Kun Yuan): Conception, design, acquisition, analysis, and interpretation of data and drafting the article. H.A., N.O., K.Y. (Kensuke Yasufuku) and A.T.: Critical reviewing and final approval of the version to be submitted. All authors have read and agreed to the published version of the manuscript.

Funding

This research received no external funding.

Informed Consent Statement

Informed consent was obtained from all subjects involved in the study.

Conflicts of Interest

The authors declare no conflict of interest.

References

  1. WHO. Coronavirus Disease (COVID-19) Weekly Epidemiological Update and Weekly Operational Update; World Health Organization: Geneva, Switzerland, 2021. [Google Scholar]
  2. Shamshiripour, A.; Rahimi, E.; Shabanpour, R.; Mohammadian, A. How is COVID-19 reshaping activity-travel behavior? Evidence from a comprehensive survey in Chicago. Transp. Res. Interdiscip. Perspect. 2020, 7, 100216. [Google Scholar] [PubMed]
  3. Shaer, A.; Rezaei, M.; Rahimi, B.M.; Shaer, F. Examining the associations between perceived built environment and active travel, before and after the Covid-19 outbreak in Shiraz city, Iran. Cities 2021, 115, 103255. [Google Scholar] [CrossRef]
  4. Harrington, D.M.; Michelle, H. Changes in commuting behaviours in response to the COVID-19 pandemic in the UK. J. Transp. Health 2022, 24, 101313. [Google Scholar] [CrossRef] [PubMed]
  5. Wang, Y.; Tsai, T.C.; Duncan, D.; Ji, J. Association of city-level walkability, accessibility to biking and public transportation and socio-economic features with COVID-19 infection in Massachusetts, USA: An ecological study. Geospat Health 2022, 17, 1017. [Google Scholar] [CrossRef]
  6. D’Orso, G.; Migliore, M. A gis-based method for evaluating the walkability of a pedestrian environment and prioritised investments. J. Transp. Geogr. 2020, 82, 102555. [Google Scholar] [CrossRef]
  7. Yencha, C. Valuing walkability: New evidence from computer vision methods. Transp. Res. Part A Policy Pract. 2019, 130, 689–709. [Google Scholar] [CrossRef]
  8. Tinessa, F.; Pagliara, F.; Biggiero, L.; Veneri, G.D. Walkability, accessibility to metro stations and retail location choice: Some evidence from the case study of naples. Res. Transp. Bus. Manag. 2020, 40, 100549. [Google Scholar] [CrossRef]
  9. Masoumzadeh, S.; Pendar, H. Walking as a medium of comprehending contextual assets of historical urban fabrics. Urban Res. Pract. 2021, 14, 50–72. [Google Scholar] [CrossRef]
  10. Jamei, E.; Ahmadi, K.; Chau, H.W.; Seyedmahmoudian, M.; Stojcevski, A. Urban design and walkability: Lessons learnt from iranian traditional cities. Sustainability 2021, 13, 5731. [Google Scholar] [CrossRef]
  11. Frank, L.D.; Sallis, J.; Conway, T.L.; Chapman, J.E.; Saelens, B.E.; Bachman, W. Many pathways from land use to health. J. Am. Plan. Assoc. 2006, 72, 75–87. [Google Scholar] [CrossRef]
  12. Vanden, B.; Sharmeen, F.; Weijs-Perrée, M. On the subjective quality of social interactions: Influence of neighborhood walkability, social cohesion and mobility choices. Transp. Res. Part A Policy Pract. 2017, 106, 309–319. [Google Scholar] [CrossRef]
  13. Oishi, S.; Cha, Y.; Schi, M.A.U. The Social Ecology of Covid-19 Cases and Deaths in New York City: The Role of Walkability, Wealth, and Race. Soc. Psychol. Personal. Sci. 2021, 12, 1457–1466. [Google Scholar] [CrossRef]
  14. EPA (United States Environmental Protection Agency). The National Walkability Index. 2021. Available online: https://www.epa.gov/smartgrowth/national-walkability-index-user-guide-and-methodology (accessed on 20 March 2022).
  15. Stonor, T. How Technology Can Help Us Study and Design Mixed Use, Walkability Places, Prince’s Foundation. Walkability and Mixed-Use: Making Valuable and Healthy Communities. Walkability Report; 2020. Available online: http://princes-foundation.org/resources (accessed on 15 January 2022).
  16. Ewing, R.; Handy, S. Measuring the unmeasurable: Urban design qualities related to walkability. J. Urban Des. 2009, 14, 65–84. [Google Scholar] [CrossRef]
  17. Otsuka, N.; Wittowsky, D.; Damerau, M.; Gerten, C. Walkability Assessment for Urban Areas Around Railway Stations Along the Rhine-Alpine Corridor. J. Transp. Geogr. 2021, 93, 103081. [Google Scholar] [CrossRef]
  18. Zhu, W.; Sun, Y.; Kurka, J.; Geremia, C.; Engelberg, J.K.; Cain, K.; Conway, T.; Sallis, J.F.; Hooker, S.P.; Adams, M.A. Reliability between online raters with varying familiarities of a region: Microscale audit of pedestrian streetscapes (maps). Landsc. Urban Plan 2017, 167, 240–248. [Google Scholar] [CrossRef] [PubMed]
  19. Steinmetz-Wood, M.; Velauthapillai, K.; O’Brien, G.; Ross, N.A. Assessing the Micro-Scale Environment Using Google Street View: The Virtual Systematic Tool for Evaluating Pedestrian Streetscapes (Virtual-Steps). BMC Public Health 2019, 19, 1246. [Google Scholar] [CrossRef] [Green Version]
  20. Bethlehem, J.R.; MacKenbach, J.D.; Ben-Rebah, M.; Compernolle, S.; Glonti, K.; Bárdos, H.; Rutter, H.R.; Charreire, H.; Oppert, J.-M.; Brug, J.; et al. The spotlight virtual audit tool: A valid and reliable tool to assess obesogenic characteristics of the built environment. Int. J. Health Geogr. 2014, 13, 52. [Google Scholar] [CrossRef] [Green Version]
  21. Badland, H.M.; Opit, S.; Witten, K.; Kearns, R.A.; Mavoa, S. Can Virtual Streetscape Audits Reliably Replace Physical Streetscape Audits. J. Urban Health Bull. New York Acad. Med. 2010, 87, 1007–1016. [Google Scholar] [CrossRef] [Green Version]
  22. Yin, L.; Wang, Z. Measuring visual enclosure for street walkability: Using machine learning algorithms and Google Street View imagery. Appl. Geogr. 2016, 76, 147–153. [Google Scholar] [CrossRef]
  23. Nguyen, Q.C.; Huang, Y.; Kumar, A.; Duan, H.; Keralis, J.M.; Dwivedi, P.; Meng, H.-W.; Brunisholz, K.D.; Jay, J.; Javanmardi, M.; et al. Using 164 Million Google Street View Images to Derive Built Environment Predictors of Covid-19 Cases. Int. J. Environ. Res. Public Health 2020, 17, 6359. [Google Scholar] [CrossRef]
  24. Nagata, S.; Nakaya, T.; Hanibuchi, T.; Amagasa, S.; Kikuchi, H.; Inoue, S. Objective scoring of streetscape walkability related to leisure walking: Statistical modeling approach with semantic segmentation of google street view images. Health Place 2020, 66, 102428. [Google Scholar] [CrossRef] [PubMed]
  25. Malecki, K.C.; Engelman, C.D.; Peppard, P.E.; Nieto, F.J.; Grabow, M.L.; Bernardinello, M.; Bailey, E.; Bersch, A.J.; Walsh, M.C.; Lo, J.Y.; et al. The wisconsin assessment of the social and built environment (wasabe): A multi-dimensional objective audit instrument for examining neighborhood effects on health. BMC Public Health 2014, 14, 1165. [Google Scholar] [CrossRef] [PubMed] [Green Version]
  26. Clifton, K.J.; Livi Smith, A.D.; Rodriguez, D. The development and testing of an audit for the pedestrian environment-sciencedirect. Landsc. Urban Plan. 2007, 80, 95–110. [Google Scholar] [CrossRef]
  27. Saelens, B.E.; Sallis, J.F.; Black, J.B.; Chen, D. Neighborhood-Based Differences in Physical Activity. An Environment Scale Evaluation. Am. J. Public Health 2003, 93, 1552–1558. [Google Scholar]
  28. Sallis, J.F.; Cain, K.L.; Conway, T.L.; Gavand, K.A.; Millstein, R.A.; Geremia, C.M.; Frank, L.D.; Saelens, B.E.; Glanz, K.; King, A.C. Is your neighborhood designed to support physical activity? A brief streetscape audit tool. Prev. Chronic Dis. 2015, 12, E141. [Google Scholar]
  29. Hanibuchi, T.; Nakaya, T.; Inoue, S. Virtual audits of streetscapes by crowdworkers. Health Place 2019, 59, 102203. [Google Scholar] [CrossRef]
  30. Hillier, B.; Hanson, J. The Social Logic of Space; Cambridge University Press: Cambridge, UK, 1984. [Google Scholar]
  31. Hillier, B.; Penn, A. Natural movement: Or, configuration and attraction in urban pedestrian movement. Environ. Plan. B Plan. Des. 1993, 20, 29–66. [Google Scholar] [CrossRef] [Green Version]
  32. Kigawa, T.; Furuyama, M. Study on a Vector in Kyoto’s Modernization by means of Space Syntax. J. City Plan. Inst. Jpn. 2005, 40, 139–144. [Google Scholar] [CrossRef]
  33. Yuan, K.; Abe, H.; Yasufuku, K.; Takahashi, A. A Comparative Study of the Change in Townscape in Historical Blocks of Xi’an, China, and Kyoto, Japan. Int. J. Geomate 2022, 22, 47–54. [Google Scholar] [CrossRef]
  34. Cerin, E.; Chan, K.W.; Macfarlane, D.J.; Lee, K.Y.; Lai, P.C. Objective assessment of walking environments in ultra-dense cities: Development and reliability of the environment in asia scan tool-hong kong version (east-hk). Health Place 2011, 17, 937–945. [Google Scholar] [CrossRef]
  35. Su, M.; Du, Y.K.; Liu, Q.M.; Ren, Y.J.; Kawachi, I.; Lv, J.; Li, L.M. Objective assessment of urban built environment related to physical activity–development, reliability and validity of the China Urban Built Environment Scan Tool (CUBEST). BMC Public Health 2014, 14, 109. [Google Scholar] [CrossRef] [PubMed]
  36. Chen, L.C.; Zhu, Y.; Papandreou, G.; Schroff, F.; Adam, H. Encoder-Decoder with Atrous Separable Convolution for Semantic Image Segmentation; Springer: Cham, Switzerland, 2018. [Google Scholar]
  37. Ronneberger, O.; Fischer, P.; Brox, T. U-net: Convolutional networks for biomedical image segmentation. In International Conference on Medical Image Computing and Computer-Assisted Intervention; Springer: Cham, Switzerland, 2015; pp. 234–241. [Google Scholar]
  38. Badrinarayanan, V.; Kendall, A.; Cipolla, R.; Member, S. SegNet: A deep convolutional encoder-decoder architecture for image segmentation. IEEE Trans. Pattern Anal. Mach. Intell. 2017, 39, 2481–2495. [Google Scholar] [CrossRef] [PubMed]
  39. Cordts, M.; Omran, M.; Ramos, S.; Rehfeld, T.; Schiele, B. The Cityscapes Dataset for Semantic Urban Scene Understanding. In Proceedings of the 2016 IEEE Conference on Computer Vision and Pattern Recognition (CVPR), Las Vegas, NV, USA, 27–30 June 2016; IEEE: Las Vegas, NV, USA, 2016. [Google Scholar]
  40. Papandreou, G.; Chen, L.C.; Murphy, K.; Yuille, A.L. Weakly and semi-supervised learning of a DCNN for semantic image segmentation. In Proceedings of the ICCV, Santiago, Chile, 7–13 December 2015. [Google Scholar]
Figure 1. Research object Area of Xi’an’s main urban area (Google map, 2022).
Urbansci 06 00044 g001
Figure 2. Selecting points in Xi’an (92 points, including 65 historical areas points).
Urbansci 06 00044 g002
Figure 3. Sample of segmentation map before pandemic in 2019 (No. 38).
Urbansci 06 00044 g003
Figure 4. Sample of segmentation map after pandemic in 2022 (No. 38).
Urbansci 06 00044 g004
Figure 5. Local integration (Int—R3) of points based on axial map before and after the pandemic.
Urbansci 06 00044 g005
Figure 6. Connectivity of points based on axial map before and after the pandemic.
Urbansci 06 00044 g006
Figure 7. PSG of building-to-sign ratio for selected points before and after the pandemic.
Urbansci 06 00044 g007
Figure 8. PSG of building-to-sign ratio in the historical areas.
Urbansci 06 00044 g008
Figure 9. PSG of person and motorcycle.
Urbansci 06 00044 g009
Figure 10. PSG of person and motorcycle in historical areas.
Urbansci 06 00044 g010
Figure 11. Normal probability plots.
Urbansci 06 00044 g011
Table 1. Walkability checklist.
ITEMCHECK SCOREEXPLAIN
Walking environmentQ1Sidewalk widthPositive
factor
People could pass each other smoothly, or about 2 m or more
Q2ObstructionsNegative
factor
Surface irregularities, signboard, stall, dustbin, and so on
Q3Cars parked in the streetNegative
factor
A car without a driver on the street, regardless of traffic violation
Q4Motorcycle (or bicycles) parked in the streetNegative
factor
A vehicle without a driver on the street, parked casually
SafetyQ5Heavy vehicular trafficNegative
factor
Vehicles go by frequently or occasionally
Q6Heavy pedestrian trafficPositive
factor
Pedestrians go by frequently or occasionally
Q7Crosswalk/crossroadPositive
factor
Including those at the start or end points of what?
Aesthetic and commercial valueQ8Streetscape (attractive/well-known tourist places)Positive
factor
Subjective evaluation; beautiful/interesting/comfortable or not
Q9Many commercial storesPositive
factor
There are more than 50% commercial stores on both sides
Q10Trees along the streetPositive
factor
Only those planted on the street, excluding those planted in residential and commercial areas
Q11Abandoned/under construction buildingsNegative
factor
Buildings such as vacant, abandoned or under construction buildings
Walkability Score:
Positive factor is applicable: assign 2 points
Negative factor is applicable: assign 1 point
Table 2. Average Scores of Walkability checklist.
Walking Environment, Q1–4Safety, Q5–7Aesthetic and Commercial Value, Q8–11Total Score
Sidewalk WideObstructionsCars ParkedElectric Vehicles/Bicycles (Parked)Vehicular Traffic (Heavy)Pedestrian Traffic (Heavy)Crosswalk/CrossroadAttractive/well-KnownCommercial StoresVegetationAbandoned/Under-Construction Buildings
Xi’an (2019)1.83721.44831.61801.77911.77911.24421.06981.34881.80231.90701.976717.8105
Xi’an (2022)1.83721.64371.65521.63221.98841.06981.09301.19771.46511.88371.953517.4194
Ordinary block (2019)1.82501.65851.39531.80001.82501.00001.00001.17501.62501.90001.975017.1789
Ordinary block (2022)1.82501.60981.48781.75611.97501.00001.00001.10001.25001.87501.925016.8037
Historical block (2019)1.84781.26091.80851.76091.73911.45651.15001.50001.95651.91301.978318.3716
Historical block (2022)1.84781.67391.80431.52172.00001.13041.20001.28261.65221.89131.978317.9826
Table 3. Average value of PSG of each class for all points in Xi’an before and after COVID-19.
GroupClass (Segment)Xi’an 2019
before Pandemic (%)
Xi’an 2022
after Pandemic (%)
Groundroad12.67916.467
sidewalk3.3794.837
Buildingbuilding39.99840.563
wall2.3700.863
Infrastructurefence/stall1.6372.764
pole0.6230.674
traffic light0.2200.160
sign0.6370.432
Naturevegetation22.08118.346
Skysky2.5292.792
Humanperson4.3331.867
rider0.6710.622
Vehiclecar6.6293.569
motorcycle1.1571.504
bicycle0.4980.440
Table 4. Coefficients of Determination.
2019
Model Summary b
ModelRR SquareAdjusted R SquareStd. Error of the Estimate
10.789 a0.6220.5021.4276575
a. Predictors: (Constant), SMEAN(Bicycle), SMEAN(Sidewalk), SMEAN(Road), SMEAN(Vegetation), SMEAN(Sign), SMEAN(Car), SMEAN(Connectivity), SMEAN(Motorcycle), SMEAN(Sky), SMEAN(Fence_stand), SMEAN(Pole), SMEAN(Person), SMEAN(Rider), SMEAN(Int_R3), SMEAN(Building)
b. Dependent Variable: SMEAN(walkability)
2022
Model Summary b
ModelRR SquareAdjusted R SquareStd. Error of the Estimate
10.714 a0.5100.4011.2589683
a. Predictors: (Constant), SMEAN(Bicycle), SMEAN(Connectivity), SMEAN(Sidewalk), SMEAN(Fence_stand), SMEAN(Sky), SMEAN(Road), SMEAN(Rider), SMEAN(Pole), SMEAN(Sign), SMEAN(Car), SMEAN(Wall), SMEAN(Vegetation), SMEAN(Motorcycle), SMEAN(Person), SMEAN(Int_R3), SMEAN(Building)
b. Dependent Variable: SMEAN(walkability)
Table 5. Analysis of variance (F-analysis).
2019
ANOVA a
ModelSum of SquaresdfMean SquareFSig.
1Regression83.386155.5597.410<0.001 b
Residual133.963761.763
Total217.34991
a. Dependent Variable: SMEAN(walkability)
b. Predictors: (Constant), SMEAN(Bicycle), SMEAN(Sidewalk), SMEAN(Road), SMEAN(Vegetation), SMEAN(Sign), SMEAN(Car), SMEAN(Connectivity), SMEAN(Motorcycle), SMEAN(Sky), SMEAN(Fence_stand), SMEAN(Pole), SMEAN(Person), SMEAN(Rider), SMEAN(Int_R3), SMEAN(Building)
2022
ANOVA a
ModelSum of SquaresdfMean SquareFSig.
1Regression45.052162.8164.6860.017 b
Residual98.054731.343
Total143.10689
a. Dependent Variable: SMEAN(walkability)
b. Predictors: (Constant), SMEAN(Bicycle), SMEAN(Connectivity), SMEAN(Sidewalk), SMEAN(Fence_stand), SMEAN(Sky), SMEAN(Road), SMEAN(Rider), SMEAN(Pole), SMEAN(Sign), SMEAN(Car), SMEAN(Wall), SMEAN(Vegetation), SMEAN(Motorcycle), SMEAN(Person), SMEAN(Int_R3), SMEAN(Building)
Table 6. Standard Partial Regression Coefficients (2019, before pandemic).
Coefficients a
ModelUnstandardized CoefficientsStandardized CoefficientstSig.Collinearity Statistics
BStd. ErrorBetaToleranceVIF
1(Constant)17.8923.199 5.593<0.001
Int_R3−0.6540.612−0.213-1.0680.2890.2034.918
Connectivity0.1220.0510.4732.3840.0200.2064.848
Road0.0020.0440.0070.0370.9700.2573.888
Sidewalk−0.0280.026−0.108−1.0790.2840.8141.228
Building−0.0140.028−0.151−0.4930.6230.1869.571
Fence/stall−0.2960.138−0.237−2.1410.0350.6621.511
Pole0.1200.3150.0440.3810.7050.6071.647
Sign0.2100.1900.1131.1040.2730.7681.302
Vegetation−0.0020.031−0.023−0.0790.9370.1948.618
Sky−0.0020.059−0.004−0.0400.9680.6831.464
Person0.1410.0390.4553.591<0.0010.5061.977
Rider−0.4100.268−0.175−1.5310.1300.6201.614
Car0.0120.0450.0320.2710.7870.5761.736
Motorcycle−0.0570.150−0.139−1.3790.0500.7481.337
Bicycle0.3120.3360.1000.9280.3560.7011.427
a. Dependent Variable: Walkability
Table 7. Standard Partial Regression Coefficients (2022, after pandemic).
Coefficients a
ModelUnstandardized CoefficientsStandardized CoefficientstSig.Collinearity Statistics
BStd. ErrorBetaToleranceVIF
1(Constant)16.3133.338 4.887<0.001
Int_R30.1340.5710.0541.2360.0840.1795.596
Connectivity0.0660.0460.3142.4180.0400.1925.207
Road0.0010.0400.0070.9330.0480.2394.176
Sidewalk−0.0180.051−0.048−0.3440.7320.4862.059
Building−0.0170.026−0.197−0.6820.4970.1138.855
Wall−0.5140.374−0.149−1.3730.1740.7981.253
Fence/stall0.0300.0570.0590.5230.6020.7311.367
Pole0.0300.2100.0160.1440.8860.7391.352
Sign−0.0270.249−0.012−0.1090.9140.8051.242
Vegetation−0.0170.032−0.153−0.5190.6050.1089.286
Sky−0.0500.051−0.127−0.9650.3380.5461.832
Person0.0530.0640.1160.8230.4130.4712.123
Rider0.2280.1700.1521.3380.1850.7271.375
Car−0.0060.039−0.020−0.1630.8710.6311.584
Motorcycle0.0000.0830.0000.0020.9980.6611.513
Bicycle0.5880.3340.1801.7580.0560.8931.120
a. Dependent Variable: Walkability
Publisher’s Note: MDPI stays neutral with regard to jurisdictional claims in published maps and institutional affiliations.

