Article

Recognition and Evaluating the Indicators of Urban Resilient by Using the Network Analysis Process

1
Urban Development Department, Urmia University, Urmia 5756151818, Iran
2
Urban Planning Department, University of Kurdistan, Sanandaj 6617715175, Iran
*
Authors to whom correspondence should be addressed.
Urban Sci. 2022, 6(2), 31; https://doi.org/10.3390/urbansci6020031
Submission received: 1 April 2022 / Revised: 19 April 2022 / Accepted: 20 April 2022 / Published: 24 April 2022
(This article belongs to the Special Issue The Study of Urban Geography and City Planning)

Abstract

:
Today’s cities are increasing their space zones while becoming more vulnerable to natural disasters and man-made threats. The initial evaluation of the resilience of city systems is of great importance and helps develop policies and measures that would improve resilience. This paper, using a descriptive–analytic method, defines the characteristics of a resilient city, and natural disasters are addressed. At the same time, the process of reaching a resilient city is investigated. Then, the indicators of resilience have been defined in pillars of ecologic, physiological, social, economic, and managerial–institutional dimensions for the evaluation of a resilient city in Iran. As the sample of the study, the indicators of the study were evaluated in the city of Sanandaj and prioritized in the network analysis process (ANP). The results of this analysis showed that zones one and two, respectively, were the weakest parts regarding urban resilience. In order to move toward a resilient city, future investments should go beyond financial investment and technical solutions and consider human and community development, as well as institutional capacity and inter-organizational cooperation.

1. Introduction

The scientific evidence tells us that currently, the rise of seawater levels, storms, heatwaves, droughts, changes in precipitation patterns [1,2], river floods, changes in the speed, intensity, and frequency of winds, and other climate disorders are increasing [3,4]. A lack of enough trust, unpredictability, and change are the defining features of today’s world. The cities should be able to respond to the probable dangers before the occurrence of any crisis [5,6]. UN-Habitat estimates that 68% of the world’s population will live in urban areas by 2050, and approximately 60% of this growth is expected to take place in Asia [7,8].
Due to the location of Iran’s plateau on an area of the earth with lots of dangers, including the earthquake belt of Himalaya Alp, the orogeny zone, topographical diversity, and non-uniform natural conditions, as well as the climate changes that have occurred in recent years, the occurrence of different natural disasters is inevitable [9]. According to the accident report related to natural hazards in the UN/ESCAP, Iran is among the top 10 countries in the world in terms of disasters, and it is also third in the world in terms of losses caused by risk [10].
The future threats cannot be predicted based on the current evidence, and the state, size, and place of such threats cannot be easily forecasted either. Therefore, what matters in the occurrence of events is not only the destruction of buildings and houses, but rather it is the resilience of the economic and social structures that can ensure the sustainability of urban life and people can resume their activities in the least amount of time and city restore its dynamism and sustainability [11,12,13,14].
The evaluation of urban resilience is the first step toward resilience plans, such that it can show the vulnerability of societies and zones and their ability to adapt themselves [15,16]. This can also lead to the identification of factors contributing to resiliency, enhancement of the key capacities of communities for further adaptation, and finally, development of resilience strategies [17,18]. The main purpose of this research was to introduce a conceptual framework for understanding the relations between the components of urban resilience and defining the indicators of the resilient city in order to identify the more vulnerable zones in the face of natural disasters.
By the beginning of the 1990s, which is known as the International Decade of Natural Disasters Reduction (IDNDR), throughout the world, different attempts have been made to create a framework for the reduction of disasters. The meeting of municipal leaders, which was planned by ICLEI in 1993 in the United Nations, was the first and biggest gathering of local governments in regard to climate changes and natural disasters. The purpose of meetings has been to enhance the awareness and commitment to attain sustainable development so that the threats could be minimized and welfare would be improved [19,20].
United Nations Office for disaster risk reduction, which is known as ISDR, is, in fact, a world information bank that provides information regarding disaster reduction, as well as activities related to the enhancement of public awareness and books, papers, and reports published in the field of crisis management. In 2008, Rockefeller Fund, in order to respond to the need for city adaptation in Asian cities with a fast rate of growth, supported some plans titled ‘Asian Cities Climate Change Resilience Network’ (ACCCRN) [21]. Godschalk required features of social and structural systems to create resilience. These features are as follows: Surplus, diversity, efficiency, independence, internal unity, adaptation, and cooperation power [22]. In 2008, Cutter explained the relationship between vulnerability and resilience and suggested the Disaster Resilience of Place (DROP) model for evaluating resilience [23]. In 2012 Moench and Tyler defined a framework for city resilience planning by focusing on city systems, city factors, city institutes, and other social structures [19]. In 2013, Desouza and Flanery emphasized that economic, technological, human, and natural crises are causes of the decline and destruction of physical, social, and institutional actions, and cities that are adjustable and flexible in planning and agility management can help build resilience [24].

2. Materials and Methods

2.1. Analytic Network Process (ANP)

In the first phase, ANP is used to construct a network model in order to calculate the relative weights of indicators that we reached in the previous section.
ANP, introduced by Saaty (1996), is a comprehensive decision-making technique that provides a way to input judgments and measurements to derive ratio scale priorities for the distribution of influence among the factors and groups of factors in the decision. This technique is suitable for both quantitative and qualitative data types. ANP models have two parts; the first is a control hierarchy or network of objectives and criteria that control the interactions in the system under study; the second is a network of influences among the elements and clusters [25].
The process of ANP includes the following three major steps:
Construction of model and structuring the problems: The problem should be stated in clear and logical system as a network that is decomposed. The structure can be obtained by consultation with decision-makers through techniques such as brainstorming, questionnaire, or other appropriate methods.
In next step, pairs of decision elements at each cluster are compared with respect to their importance towards their control criteria. The clusters themselves are also compared pairwise with respect to their contribution to the objective. Decision-makers are asked to respond to a series of pairwise comparisons of two elements or two clusters to be evaluated in terms of their contribution to their particular upper-level criteria. In addition, interdependencies among elements of a cluster must also be examined pairwise; the influence of each element on other elements can be represented by an eigenvector. The relative importance values are determined with Saaty’s [25,26] 1–9 scale, where a score of 1 represents equal importance between the two elements and a score of 9 indicates the extreme importance of one element (row cluster in the matrix) compared to the other one (column cluster in the matrix). Pairwise comparison in ANP is performed in the framework of a matrix, and a local priority vector can be derived as an estimate of the relative importance associated with the elements (or clusters) being compared by solving the following equation:
A × w = λ max × w
where A is the matrix of pairwise comparison, w is the eigenvector, and λ max is the largest eigenvalue of A. Saaty proposes several algorithms to approximate w. In this paper, Super Decision software is used to compute the eigenvectors from the pairwise comparison matrices and to determine the consistency ratios.
Supermatrix formation: Concept of the supermatrix is similar to the process of Markov chain process. Supermatrix is capable of limiting relative weights to calculate all priorities and, as a result, cumulative effect of each element on other elements. In order to obtain global priorities in a system with interdependent influences, the local priority vectors are entered in the appropriate columns of a supermatrix, and it is transformed into a weighted supermatrix. The weighted supermatrix is raised to the power of an arbitrarily large number to achieve convergence on the important weights, and this new matrix is called the “limit supermatrix”. The final priorities of all the elements in the matrix can now be obtained by normalizing each block of this limit supermatrix [25].

2.2. Context Review

Sanandaj city, capital of Kurdistan province, is located in the geographical position of 35° and 20 min of the north latitude and 47 degrees and 18 min in the east of Greenwich (Figure 1). Sanandaj city is located on some fault in the western part and has a cold and mountainous climate, and there is also the possibility of heavy rainfalls, floods, and high winds. In 2021, the city of Sanandaj included 5 connected zones and 4 separate urban zones not studied in this research. According to the latest population and housing census in 2016, the population of this city was 412,767 people, without considering these latter zones [27].

2.3. Sampling

The information needed to evaluate the indicators were collected through questionnaires, interviews, field interpretations, and statistics obtained from the organizations and relevant departments. According to the population of the city of Sanandaj, the size of the sample was calculated by the Cochran formula, with the accuracy of 0.05 and 1.96 percent error, which was 384.
n = t 2 pq d 2 1 + 1 N ( t 2 pq d 2 1 )
In the above formula, N is the population, n is the sample size, t is the percentage of standard error (typically 1.96), p is the proportion of the population without a specific attribute (usually 0.5), q is the proportion of the population with certain characteristics, and d is the potential efficiency [28].
The information coming below represents the indicators in the city of Sanandaj. It should be noted that the data, such as climate conditions, regulations, governmental organizations, etc., were the same for all areas and investigated generally and throughout the city.

2.4. Climate Change and Natural Disasters

Among natural factors, climate plays an important role in human activities. In 1990, according to the Intergovernmental Panel on Climate change (IPCC), climate pressures were defined as the effects that were due to the interaction of climate changes with dangerous climate events that could occur in a specific period of time [29]. The average global economic cost of disasters increased approximately six-fold from 1970 to 2000 [30].

2.5. Resilience City

This term, from the Latin root ‘resilio’, entered into English in the early 17th century, with the meaning ‘jumping back’. There are some arguments regarding the scientific area to which this term belongs. Some have attributed it to the fields of physics and mechanics and material measurement in the recent century [31], and during 1960s, some believed that there were some roots of it in child’s psychology and environmental and ecological studies [32]. Resilience was also proposed by Holling in 1973 in the area of ecology. During 2000s, the concept of resiliency was widely used in disaster risk reduction (DRR). The use of resiliency concept entered the agenda of local governments during 2000s. Resilient city is a city whose goal is to develop a community that would not be vulnerable to climate changes, natural and artificial disasters, and economic shocks [1]. The resilient city should have qualities that help it remain resilient before, during, and after crisis.

2.6. Urban Resilient Planning

Policies and resilience knowledge create two key terms: “vulnerability reduction” and “adaptation enhancement”, with resilience being a combination of the two.
Vulnerability: Vulnerability is the extent to which a system can cope with the effects of climate crisis [33], and it is measured as a function of exposure and sensitivity of system to pressure factors and the measures that can be adopted before the incidence.
Adaptive Capacity: Adaptive capacity refers to the ability of the system to adapt itself to the changes and severe events and to reduce the damage in the face of consequences [34]; it also relates to measures after the incidence.
Figure 2 shows that with the increase in the urban population and the excessive use of natural resources, some climate changes occur that inflict some pressure on city systems. These systems, depending on their sensitivity and exposure to danger, may be damaged. In this regard, measures to increase adaptation can be the solution to reach a resilient city.

2.7. Resilience Indicators

The indicators are defined in ecologic, structural, social, economic, and managerial–institutional parameters. The importance of these parameters is explained below:
Ecologic: The most fundamental issues related to the access to drinking water, energy, and food resources. Diversification of energy sources makes it possible to meet the needs if one of the sources is damaged. Air pollution caused by dust and greenhouse gas emissions, in addition to negative effects on people’s health, can be harmful to agricultural crops, agricultural development, and food security.
Structural: Density and building quality, types of building, and the related standards can be effective in the intensity of damage. In the case of incidents, rapid exit, health care services, temporary housing, and minimal possibilities needed for residents should be provided.
Social: One of the most important elements at risk is the population of urban areas. The institutionalization of a culture of prevention in the face of events and improvement in the awareness of community and its skills can reduce the number of damages incurred. Social relationships and a sense of belonging to the neighborhood can help the residents assume responsibility in helping to improve the situation.
Economic: The most reliable source of construction and improvement in Iran is based on individual or household savings. Not relying on only one sector of city’s economy can prevent the paralysis of city in case a problem arises.
Managerial–institutional: If the participation and coordination of people and public institutions in crisis management can be enhanced, the progress of programs reducing the risk, management measures, and enforcement of rules can be eased and ensured. Each city, based on risks that threaten it, should have some regulations for the location of applications, construction principles, compactness, installations, and the services provided by government organizations. They also devote some funds to implementation of plans. Each of the organs involved in municipal affairs also must prepare for emergencies and natural disasters.
Table 1 shows the indicators in pillars of above-mentioned dimensions, as well as the data required for the evaluation of each index.

3. Results and Discussion

3.1. The Evaluation of Adaptation Indicators

Environment: In the architecture of new districts, unlike the old ones, the focus is more on energies that are not renewable, such that design is based on the use of heating and cooling tools. Based on recent studies performed by the World Health Organization in 1100 cities in the world, during the 2003–2010 time period, in terms of air-bore particles, Sanandaj city was the third most polluted city in the world. On average, annually, there were 119.1 days with air-born particles [38].
Geographic climate: The districts located in the western part of the city, which are in the catchment of Abidar Mountain, are more in danger of floods. Regarding earthquakes, Sanandaj city is within two earthquake zones of Sanandaj-Sirjan and Zagros, and there is the possibility of earthquakes as strong as six or seven Richter in this city. According to Table 2, constant temperature fluctuations, rainfall, and freezing do not follow a uniform trend and are increased and decreased in a sinus manner, thereby making weather forecasting quite difficult.
Food Security: The considerable reduction in the annual precipitation of Sanandaj city from 490 to 360 mm, and the excessive use of underground water resources in agriculture are the main reasons for the decrease in the water resources of the city. Ignoring the agricultural potential and its correct directions have led to the addition of 13 villages to the city from 2011 to 2021 [27]. More than 800 hectares of agricultural lands around the city have witnessed the change in their application (Table 3).
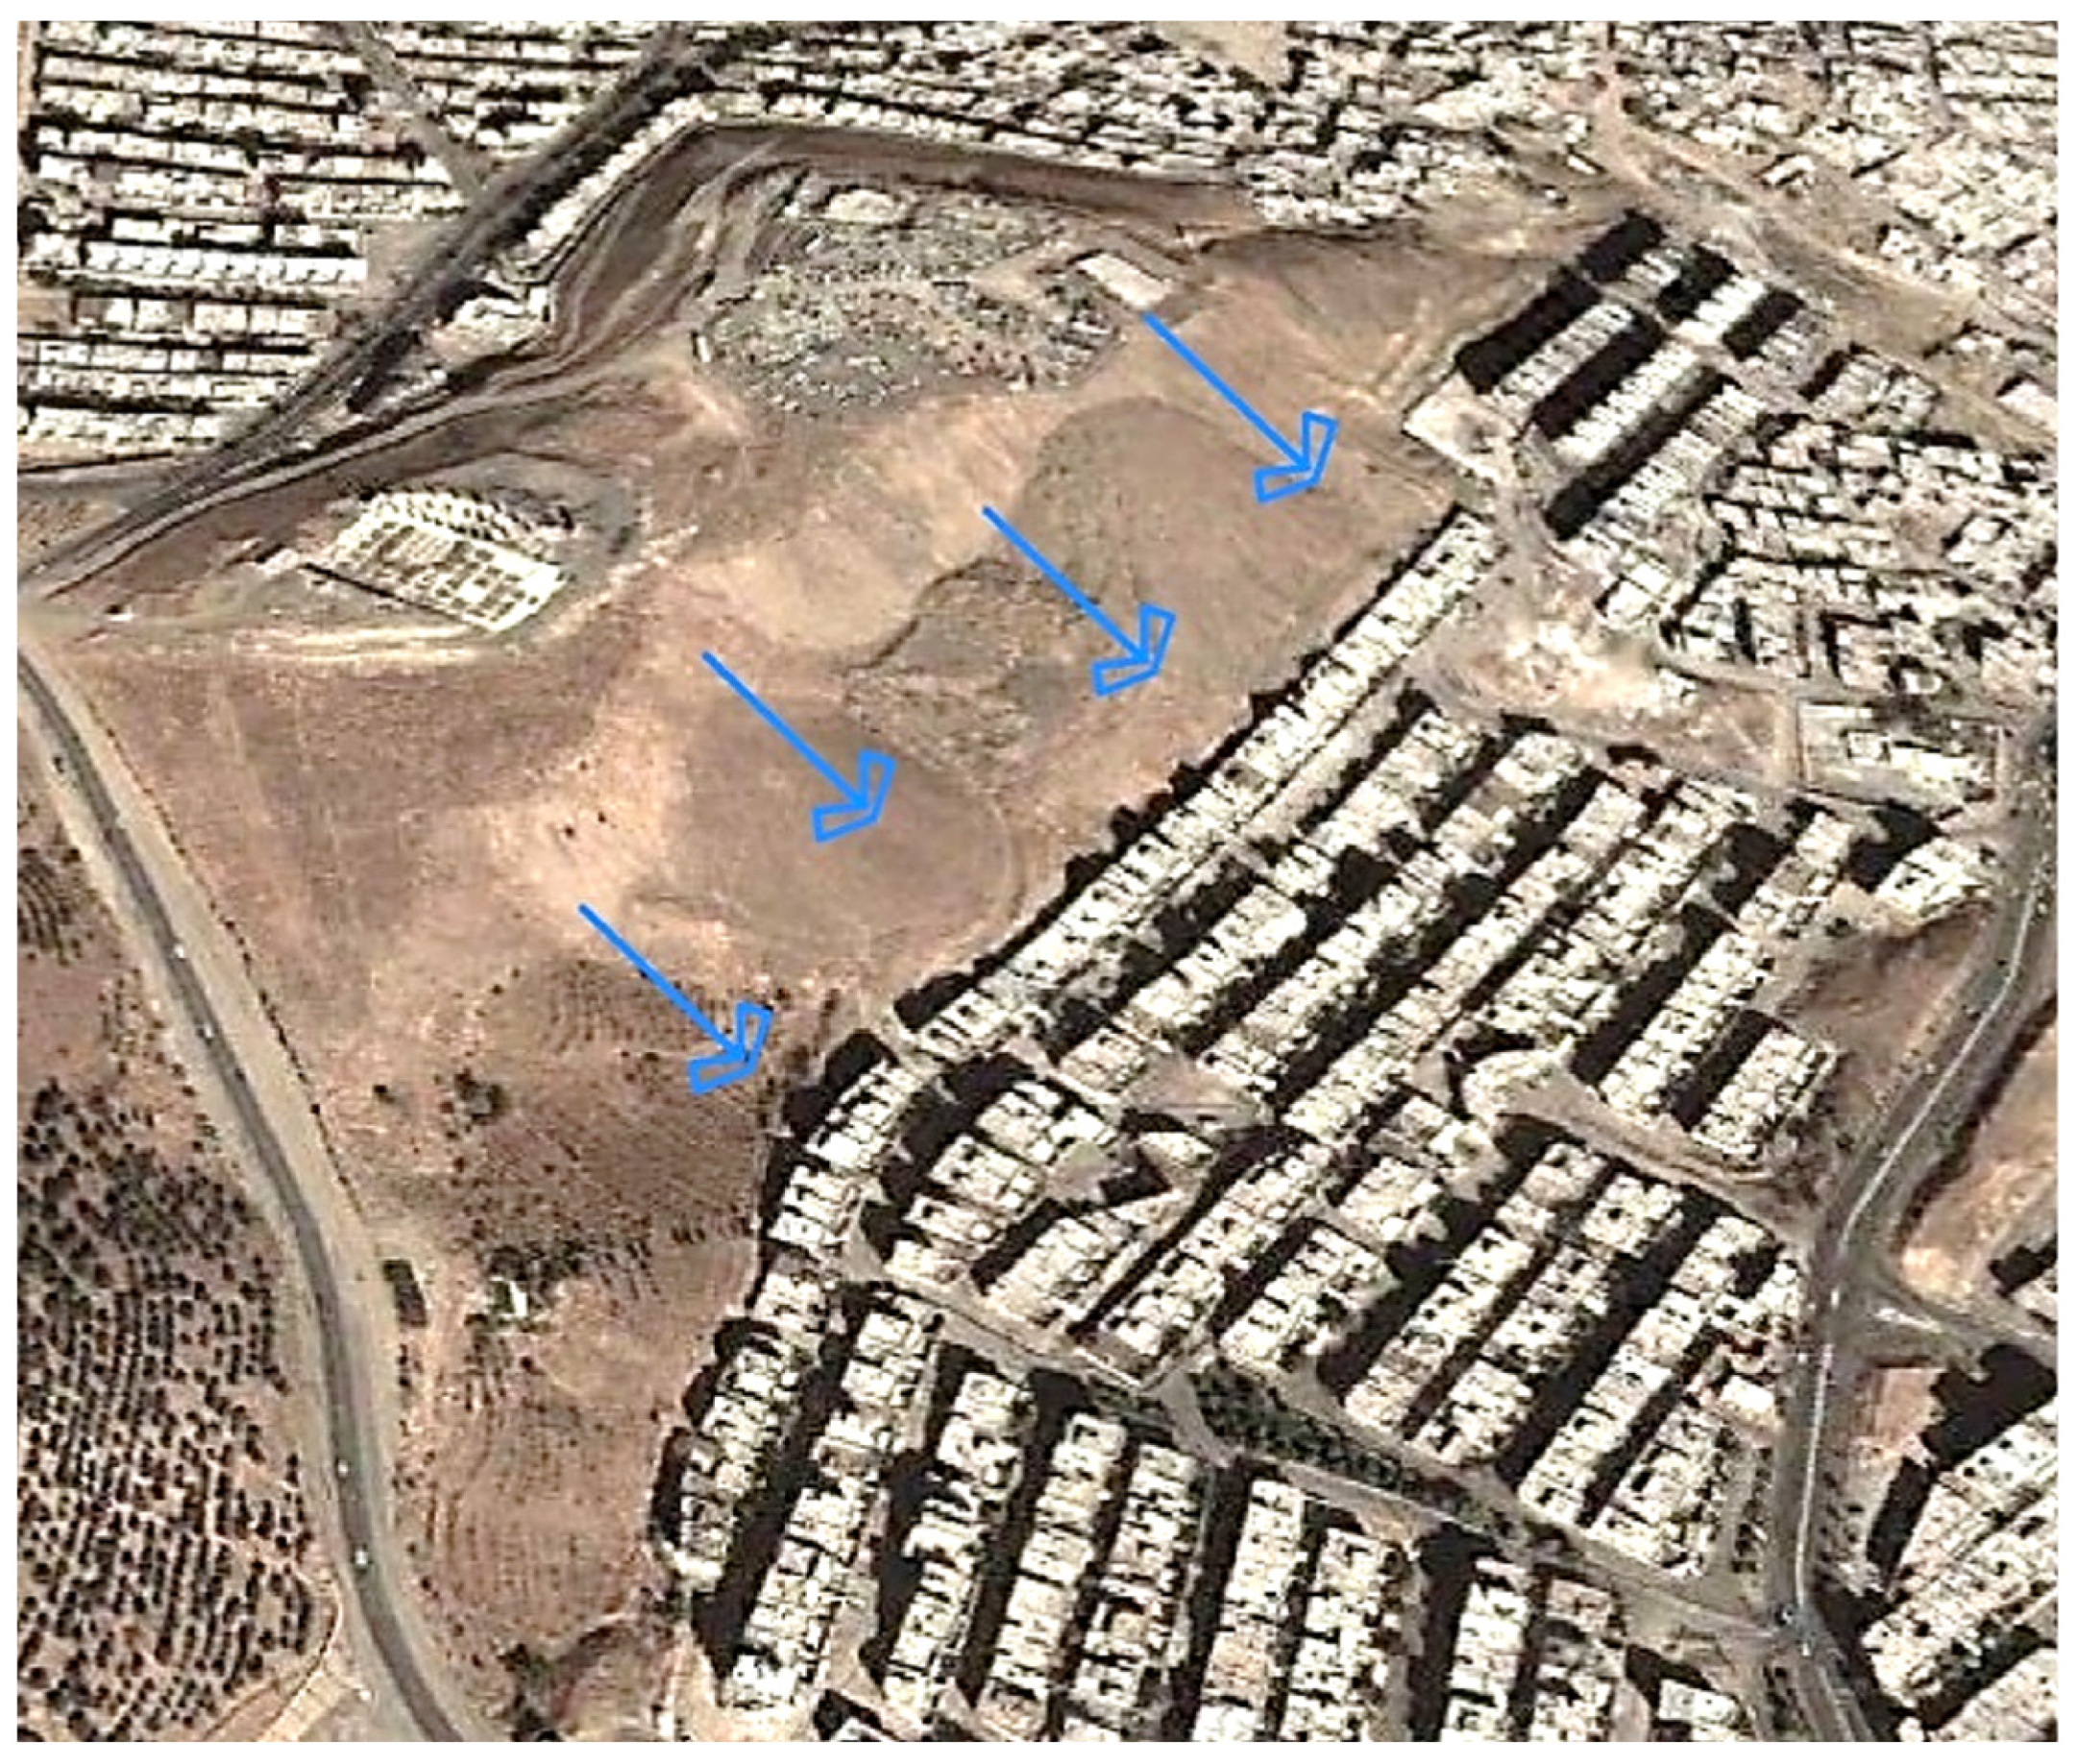
Infrastructures: Due to the topographical condition and the different slopes of the city, there is a network of labyrinthine streets. Many urban streets have been designed without considering the natural direction of drainage and are often perpendicular to the land slope (Figure 3). One of the problems in the energy distribution system is lagging behind technology.
More than 97% of the electricity distribution network is of air type in Sanandaj city [38]. The air network, due to more accessibility, is more subject to danger. In gas distribution lines, most part of the city is covered by steel pipes, while it is known that poly-ethylene pipes have such superior properties as no corrosion or rusting, flexibility in temperatures less than zero, no breakage, and thermal insulation [39].
Land use: Land use, known as the surfaces having open space, can be very effective in the adsorption of surface waters and controlling urban floods: The use of green space refers to gardens and farms. Most gardens of Sanandaj city are near the Gheshlag River in zone four, such that it could control the torrents of the river, but in recent years, with the development of the city around this river, a large part of these lands has been destroyed and replaced by urban land use, especially residential uses.
Zone four had the highest percentage of green space. This was due to the location of Deghayeran village and agricultural lands in this zone, which have been added to the city in the recent decade.
GIS specialized center of the University of Kurdistan has identified 37 places as the accommodation centers of people suffering from natural and artificial disasters in Sanandaj based on the analysis of the data related to land use, faults, water resources, roads accessible, and city topography. These identified zones are not yet ready for the people who may suffer.
Public services: According to the survey conducted among the local people, more than 46.6 met their needs outside their neighborhood. This was due to the inappropriate distribution of land uses in the neighborhoods. According to Iran Statistics Center, in Sanandaj city, there are 135 medical centers, 38 sanitary centers, and 6 medical institutes with 1287 hospital beds. Given the centrality of Sanandaj city, the capacity of these medical centers cannot adequately meet the needs of people. Sanandaj has 5 firefighting stations and 80 operational forces. The number of firefighters in this city is half of the rate of the country (for 2500, there is one firefighter). In order to attain the standard, 80 more operational forces are required.
Demographic features: More than one-third of the Sanandaj population consisted of people younger than 15 and older than 65. As the number of people in this age range rises, rescue operations can be more difficult in emergencies. In terms of population concentration, zones two and one had the highest concentration (Table 4). If the necessary predictions and measures are not adopted, the greatest damage is likely to occur in these zones.
Social relations: The social relations of the residents in different zones of Sanandaj city were evaluated by surveying and asking them about the three factors regarding their respect for neighbors’ rights, their tendency to cooperate with neighbors to resolve the problems, and their interest in asking for help in the case of emergencies. More than 80 percent of them reported strong relations.
Social security and welfare: The rate of crime in Sanandaj city was only available for addiction, thief, and suicide. This was increased from 0.56 in 2014 to 0.62% in 2016 (last census) [27]. Based on the information obtained from surveys, more than 11 percent of people had no medical insurance.
Education: The results of public surveys showed that 67.9% of people had weak skills in promptly reacting to the events. Given the motto of the Red Crescent, “each Iranian family is a saver”, there should be as many educated people as the number of families so that in the case of events, they can help themselves and their families. This was very low in Sanandaj city, and the number of trained people was less than 10% of the population.
Employment: According to the census of people and houses conducted in 2016, the rate of unemployment in people older than 10 years was 32.2% in the city of Sanandaj, which was high and influenced job security. For disasters, there should be strong financial support for compensating for the damage incurred by the buildings. Based on the data obtained from the questionnaires, more than 75% of the buildings did not have this kind of insurance.
Income: In 2016 (last census), the inflation rate was 1.3 percent more than that of the income level. This creates a problem for families in meeting their basic needs, and they cannot cater to other things.
Non-governmental organizations: The duties of such organizations are not clear in city management, and there is no definition for the services provided by them. At the same time, their participation has not been predicted in the urban planning process. These are the major reasons behind the lack of participation by these organizations. The survey showed that only 51% of the residents tended to participate in city affairs.
Governmental organizations: In 2016, credits as many as billions were devoted to Kurdistan Province by the government. These credits were divided between the municipalities for the development of urban infrastructures, and they were not used for coping with unexpected events.
Based on the interviews conducted with some experts in the concerned organizations (such as gas companies, water organizations, and electricity offices), all of these are expected to be supported by the crisis management, while each of these organizations should be responsible for all their services before and after the crisis.

3.2. Evaluation of Resiliency Using ANP Model

The analytic network process (ANP) approach derived from the idea of the Markov chain is employed to deal with this dynamic situation. With this approach, the priority of motivations and the relative importance of criteria are determined simultaneously. The ANP allows both interaction and feedback within clusters of elements (inner dependence) and between clusters (outer dependence). Such feedback can capture the complex effects of interplay in human society, and this is especially important when risk and uncertainty are involved. The analytical network process (ANP) has been used to develop the framework because of the dependency on measures and the antecedents. Yet another reason to use ANP is that it provides relatively more reliable results compared to the other similar methods [40]. The steps followed to attain the priorities for the indicators using the ANP model are as follows. At first, comparative matrices of dimensions and their internal dependence, indicators, and the dependence of them were formed, and the pair comparisons were made. The weight of each of the dimensions and indicators was considered relative to one another and determined by surveying among experts, and then the paired comparative matrix of dimensions and indicators was obtained from the geometrical average of opinions received. With the forming of a network model in the Super Decisions Software and entering the average of weights, an imbalanced supermatrix, balanced supermatrix, and limit matrix were obtained. The ultimate importance vector of indicators was obtained from normalizing the limit matrix (Table 5).

3.3. Prioritizing Zones

In the comparison of zones at this stage, first, they were prioritized relative to each other in each of the indicators, and then the priority of each indicator in every zone was determined. The scores obtained by the paired comparison of zones and indicators were entered into Super Decision Software so that the ultimate weight of each zone relative to one another and the weight of the indicators could be obtained in relation to the current situation in Sanandaj city. Table 6 shows the weight of the indicators in Sanandaj city. As can be seen, the indicators of insurance and public services had the least weight. In other words, these indicators, in comparison to others, had an inappropriate situation in this city.
Table 7 shows the ultimate weight of the zones resiliency. As shown, zones two and one, respectively, had the least weight in vulnerability (Figure 4).

3.4. Suggestions

Adapting to the changes and decreasing the dangers make it possible to continue development in the midst of all events, as the local governments assume responsibility for the disasters, and such disasters are not to disrupt the lives of people. Planning and developing strategies for resiliency cannot be limited to a particular framework. This should be performed according to the unique conditions of the cities and the developmental plans. The indicators that are weak or show some stagnation during a period are among those that can hinder urban resilience. Thus, it is necessary to find causes, weaknesses, or stagnation of these indicators that, with planning, can be improved to foster resiliency.
In order to move toward a resilient city, future investments should go beyond material investment and technical solutions and should consider the development of humans, society, institutional capacity, and inter-city cooperation. One of the ways to promote investment and social trust is the development of participatory management, such that the local stakeholders can be ready for the changes. The cooperation between governmental institutions, instead of bestowing all the responsibility of coping with and preparing for things to one part, seems to be necessary. It should be noted that while the costs and measures of resilience are at the present time, the benefits can be observed in the future; as the concentration of humans and their properties in the city are increased, the possibility of losing them is also increased.
In spite of the differences between the dimensions of the city, there are some general and common measures that can help resilience, some of which are mentioned here:
Ecologic: Protecting ecologies and natural buffers for the reduction of floods and storms; preventing construction in dangerous areas; agricultural development; and designing based on the use of renewable energies.
Structural: Improving the safety coefficient in the buildings; ensuring the accessibility of the fundamental services for all and providing supportive services following disasters; protecting city infrastructures; and using the technology in constructing city installations.
Social: Developing and strengthening scientific multi-dimensional studies that are coordinated and protecting research and science centers; paving the way for education and further understanding of the relations between climate issues and city problems; and planning for the balanced distribution of population.
Economic: Using a wide variety of local economic activities; planning for the sustainability of business; strengthening the economic abilities of the citizens; and empowering those living in less developed zones.
Managerial–institutional: Creating the institutional capacity; considering resilience in preparing city plans; and developing a participative management system.

4. Conclusions

The future threats cannot be predicted based on the current evidence, and the state, size, and place of such threats cannot be easily forecasted either. Therefore, what matters in the occurrence of events is not only the destruction of buildings and houses, but rather it is the resilience of the economic and social structures that can ensure the sustainability of urban life and people can resume their activities in the least amount of time and city restore its dynamism and sustainability.
The evaluation of urban resilience is the first step toward resilience plans, such that it can show the vulnerability of societies and zones and their ability to adapt themselves. This can also lead to the identification of factors contributing to resiliency, enhancement of the key capacities of communities for further adaptation, and finally, development of resilience strategies.
The results obtained by the surveys conducted among the experts and the analysis of them in the analysis network process showed that indicators of infrastructure were important in the structural pillar, the public institutions in the managerial–institutional pillar, and education in the social pillar had the highest scores. This showed that the presence of suitable infrastructures, the participation of public institutions, and awareness of people on more helping was among other factors that could help to return to the state before the incidents and adapt to crisis conditions.
Based on the results obtained by network analysis of resiliency indicators in Sanandaj city, zones one and two were in urgent need of resiliency measures. The indicators of education, income, public services, land use, social relations, governmental organization, infrastructures, ecosystem, and demographic features achieved a score less than the average of scores, which was 0.074. Therefore, due to the weaknesses and the unsuitable conditions, there is a need for maximum investment, and this should be seriously considered in city development planning.

Author Contributions

Conceptualization, A.A. and F.A.; methodology, A.A. and A.K.; software, E.M.; validation, A.A., F.A. and A.K.; formal analysis, A.K. and E.M.; investigation, A.K.; resources, A.A.; data curation, A.K.; writing—original draft preparation, A.A. and A.K.; writing—review and editing, F.A.; visualization, E.M.; supervision, A.A.; project administration, A.A. and A.K.; funding acquisition, F.A. All authors have read and agreed to the published version of the manuscript.

Funding

This research received no external funding.

Institutional Review Board Statement

Not applicable.

Informed Consent Statement

Not applicable.

Conflicts of Interest

The authors declare no conflict of interest.

References

  1. Otto-Zimmermann, K.; Balbo, A. The Global Adaptation Community Expands Its Scope. In Resilient Cities 2: Cities and Adaptation to Climate Change Proceedings of the Global Forum 2011; Part I; Otto-Zimmermann, K., Ed.; ICLEI: Bonn, Germany, 2012; pp. 3–9. [Google Scholar]
  2. Vaghefi, S.A.; Keykhai, M.; Jahanbakhshi, F.; Sheikholeslami, J.; Ahmadi, A.; Yang, H.; Abbaspour, K.C. The future of extreme climate in Iran. Sci. Rep. 2019, 9, 1464. [Google Scholar] [CrossRef] [PubMed] [Green Version]
  3. Fairhurst, L. Introduction: Describing Impacts at the Local Level. In Resilient Cities: Cities and Adaptation to Climate Change Proceedings of the Global Forum 2010 Volume 1 of Local Sustainability; Otto-Zimmermann, K., Ed.; ICLEI: Bonn, Germany, 2011; Chapter 2; pp. 213–215. [Google Scholar]
  4. Hulme, M. Intergovernmental Panel on Climate Change (IPCC). In International Encyclopedia of Geography; Wiley: Hoboken, NJ, USA, 2020; pp. 1–7. [Google Scholar] [CrossRef]
  5. Hordijk, M.; Baud, I. Inclusive Adaptation: Linking Participatory Learning and Knowledge Management to Urban Resilience. In Resilient Cities: Cities and Adaptation to Climate Change Proceedings of the Global Forum 2010; Otto-Zimmermann, K., Ed.; ICLEI: Bonn, Germany, 2011; Chapter 11; pp. 11111–11122. [Google Scholar]
  6. World Economic Forum. The Global Risks Report 2021, 16th ed.; World Economic Forum: Geneva, Switzerland, 2021; p. 96. Available online: http://www3.weforum.org/docs/WEF_The_Global_Risks_Report_2021.pdf (accessed on 19 December 2021).
  7. UN-Habitat. World Cities Report 2020 The Value of Sustainable Urbanization. Sereal Untuk; UN-Habitat: Nairobi, Kenya, 2020; Volume 51, p. 51. Available online: https://unhabitat.org/sites/default/files/2020/10/wcr_2020_report.pdf (accessed on 25 December 2021).
  8. Opitz-Stapleton, S.; Seraydarian, L.; MacClune, K.; Guibert, G.; Reed, S.; Uennatornwaranggoon, F.; Rumbaitis, D.C. Building Resilience to Climate Change in Asian Cities. In Resilient Cities: Cities and Adaptation to Climate Change Proceedings of the Global Forum 2010; Otto-Zimmermann, K., Ed.; ICLEI: Bonn, Germany, 2011; Chapter 41; pp. 41401–41411. [Google Scholar]
  9. Valerio, E.; Manzo, M.; Casu, F.; Convertito, V.; Luca, C.D.; Manunta, M.; Montereoso, F.; Lanari, R.; Novellis, V.D. Seismogenic source model of the 2019, mw 5.9, east-azerbaijan earthquake (nw Iran) through the inversion of sentinel-1 dinsar measurements. Remote Sens. 2020, 12, 1346. [Google Scholar] [CrossRef] [Green Version]
  10. United Nations Economic and Social Commission for Asia and the Pacific (UNESCAP). The Asia-Pacific Disaster Report 2021: Resilience in a Riskier World—Managing Systemic Risks from Biological and Other Natural Hazards; United Nations: New York, NY, USA, 2021. [Google Scholar] [CrossRef]
  11. Sillmann, J.; Thorarinsdottir, T.; Keenlyside, N.; Schaller, N.; Alexander, L.V.; Hegerl, G.; Senevirante, I.S.; Vautard, R.; Zhang, X.; Zwiers, F.W. Understanding, modeling and predicting weather and climate extremes: Challenges and opportunities. Weather Clim. Extrem. 2017, 18, 65–74. [Google Scholar] [CrossRef]
  12. WHO. Health Emergency and Disaster Risk Management Framework; WHO: Geneva, Switzerland, 2019; p. 48. Available online: https://www.who.int/hac/techguidance/preparedness/health-emergency-and-disaster-risk-management-framework-eng.pdf?ua=1 (accessed on 19 April 2022).
  13. United Nations. Disaster Risk Reduction and Resilience in the 2030 Agenda for Sustainable Development. Population Headliners; United Nations: New York, NY, USA, 2017. Available online: http://www.ncbi.nlm.nih.gov/pubmed/20845205 (accessed on 19 April 2022).
  14. Aram, F.; Solgi, E.; Baghaee, S.; Higueras García, E.; Mosavi, A.; Band, S.S. How parks provide thermal comfort perception in the metropolitan cores; a case study in Madrid Mediterranean climatic zone. Clim. Risk Manag. 2020, 30, 100245. [Google Scholar] [CrossRef]
  15. Zeng, X.; Yu, Y.; Yang, S.; Lv, Y.; Sarker, M.N.I. Urban Resilience for Urban Sustainability: Concepts, Dimensions, and Perspectives. Sustainability 2022, 14, 2481. [Google Scholar] [CrossRef]
  16. MacKinnon, D. Resilient City. In International Encyclopedia of the Social & Behavioral Sciences, 2nd ed.; Elsevier Inc.: Amsterdam, The Netherlands, 2015; pp. 561–567. [Google Scholar] [CrossRef]
  17. MacClune, K.; Fajber, E.; Opitz-Stapleton, S.; Orleans Reed, S. Vulnerability assessments, sector studies, and Pilot Projects. In Catalyzing Urban Climate Resilience; Tyler, S., Ed.; ISET: Tbilisi, Georgia, 2012; Chapter 5; pp. 153–193. [Google Scholar]
  18. Denton, F.; Wilbanks, T.J.; Abeysinghe, A.C.; Burton, I.; Gao, Q.; Lemos, M.C.; Wright, S.B. Climate-resilient pathways: Adaptation, mitigation, and sustainable development. In Climate Change 2014 Impacts, Adaptation and Vulnerability: Part A: Global and Sectoral Aspects; Cambridge University Press: Cambridge, UK, 2015; pp. 1101–1131. [Google Scholar] [CrossRef] [Green Version]
  19. Moench, M.; Tyler, S. Systems, agents, institutions, and exposure, a framework for urban climate resilience planning. In Catalyzing Urban Climate Resilience; Tyler, S., Ed.; ISET: Tbilisi, Georgia, 2012; Chapter 2; pp. 29–69. [Google Scholar]
  20. Delshad, V.; Pourvakhshoori, N.; Rajabi, E.; Bazyar, J.; Khankeh, H.R. International Agreements on Disaster Risk Management Based on World Conferences, Successful or Not: A Review Study. Health Emergencies Disasters Q. 2020, 6, 1–8. [Google Scholar] [CrossRef]
  21. Tyler, S.; Moench, M. A framework for urban climate resilience. Clim. Dev. 2012, 4, 311–326. [Google Scholar] [CrossRef]
  22. Godschalk, D. Urban Hazard Mitigation: Creating Resilient Cities. Nat. Hazards Rev. 2003, 4, 136–143. [Google Scholar] [CrossRef]
  23. Cutter, S.; Barnes, L.; Berry, M.; Burton, C.; Evans, E.; Tate, E.; Webb, J. A place-based model for understanding community resilience to natural disasters. Glob. Environ. Chang. 2008, 18, 598–606. [Google Scholar] [CrossRef]
  24. Desouza, K.; Flanery, T. Designing, planning, and managing resilient cities: A conceptual framework. Cities 2013, 35, 89–99. [Google Scholar] [CrossRef]
  25. Saaty, T.L. Decision Making with Dependence and Feedback: The Analytic Network Process; RWS Publication: Pittsburgh, PA, USA, 1996. [Google Scholar]
  26. Saaty, T.L. The Analytic Network Process. In International Series in Operations Research and Management Science; Springer New York LLC: New York, NY, USA, 2006; Volume 95, pp. 1–26. [Google Scholar]
  27. Statistical Center of Iran. Statistical Yearbook of Kutdistan Province 2021; Statistical Center of Iran: Tehran, Iran, 2021.
  28. Hafeznia, M.R. An Introduction to the Research Method in Humanities; The Organization for Researching and Composing University Textbooks in the Humanities (SAMT): Tehran, Iran, 2014. [Google Scholar]
  29. Intergovernmental Panel on Climate Change (IPCC). Summary for policymakers. In Climate Change 2014: Impacts, Adaptation, and Vulnerability; Part A: Global and Sectoral Aspects. Contribution of Working Group II to the Fifth Assessment; Cambridge University Press: Cambridge, UK; New York, NY, USA,, 2014; pp. 1–32. [Google Scholar]
  30. Bendimerad, F. Disaster Risk Reduction and Sustainable Development; The World Bank: Washington, DC, USA, 2003. [Google Scholar]
  31. Cowell, M.M. Bounce back or move on: Regional resilience and economic development planning. Cities 2013, 30, 212–222. [Google Scholar] [CrossRef]
  32. Yuzva, K.; Zimmermann, M. Introduction: Toward the Resilient City. In Resilient Cities2: Cities and Adaptation to Climate Change Proceedings of the Global Forum 2011; Part III; Otto-Zimmermann, K., Ed.; ICLEI: Bonn, Germany, 2012; pp. 101–103. [Google Scholar]
  33. Eichhorst, U.; Bongardt, M.D.; Miramontes, M. Climate-Proof Urban Transport Planning: Opportunities and Challenges in Developing Cities. In Resilient Cities: Cities and Adaptation to Climate Change Proceedings of the Global Forum 2010; Otto-Zimmermann, K., Ed.; ICLEI: Bonn, Germany, 2011; Chapter 9; pp. 991–1105. [Google Scholar]
  34. Mccarthy, J.J.; Canziani, O.F.; Leary, N.A.; Dokken, D.J.; White, K.S. Climate Change 2001: Impacts, Adaptation, and Vulnerability; Cambridge University Press: Cambridge, UK, 2001. [Google Scholar]
  35. Rezaei, M.R. Explain the Resilience of Urban Communities in Order to Reduce the Effects of Natural Disasters (Earthquakes). Ph.D. Thesis, University of Tehran, Tehran, Iran, 2010. [Google Scholar]
  36. Rezaei, M.R. Assessing the economic and institutional resilience of urban communities against natural disasters; Case study: Earthquake in Tehran neighborhoods. Two Q. J. Crisis Manag. 2013, 3, 27–38. [Google Scholar]
  37. Abedini, A.; Khalili, A. Determining the capacity infill development in growing metropolitans: A case study of Urmia city. J. Urban Manag. 2019, 8, 316–327. [Google Scholar] [CrossRef]
  38. Kurdistan Province Electricity Distribution Company. 2021. Available online: http://www.kurdelectric.ir/ (accessed on 15 October 2021).
  39. Kurdistan Province Gas Company. 2021. Available online: http://www.nigc-kd.ir/Gasco.aspx (accessed on 16 October 2021).
  40. Khalili, A. Optimal Model Presentation for Urban Smart Growth with Emphasis on Infill Development (Case Study: Urmia City). Master’s Thesis, University of Urmia, Urmia, Iran, 2016. [Google Scholar]
Figure 1. The situation of Sanandaj city in Iran.
Urbansci 06 00031 g001
Figure 2. The conceptual relationship between natural disasters, vulnerability, adaptation, and urban resilience.
Urbansci 06 00031 g002
Figure 3. Streets perpendicular to the general direction of earth slope.
Urbansci 06 00031 g003
Figure 4. The ultimate weighting of the resiliency in zones.
Urbansci 06 00031 g004
Table 1. Indexes used for the evaluation of city resilience [5,17,35,36,37].
PillarsIndicatorsExplanation
EcologicEnvironmentalThe use of renewable energies; air pollution rate; Access to drinking water; number and variety of energy sources; the number of water supply choices
GeographicProximity to dangerous zones (fault ،beach ،volcano…); the rate of heat; precipitation and freezing increase
Food SecurityAccess to food resources; farming development
StructuralInfrastructuresDraining facilities; civil installations; The possibility of quick exit; roads width; city installations
Land UseThe ratio of open and green spaces; access to medical centers; the number and capacity of shelters and transitory-residence places; use mixing
Public ServicesAccess to fundamental needs; the capacity of medical services; firefighting facilities
SocialSocial RelationsSocial relations of residents; Sense of place
Security and WelfareCrime rate; the number of people covered by medical insurances
EducationPeople’s skill in reaction and awareness of different disasters; the number of trained people
EconomicIncomeFamilies income level; families saving
EmploymentJob security; diversity in city economy
InsuranceDangers insurance
Managerial And InstitutionalPublic InstitutesPeople’s participation; the number of NGOs; volunteer groups of red crescent
Governmental OrganizationsCrisis management organization; credits for resistant; governmental bonuses for readiness; Supportive governmental organization; coordination between governmental institutes; the required management instruments; human, economic and technical capacity
Table 2. The rate of heat increase severe rainfall and freezing. The average of the five-year period (2009–2011).
* Title20092010201120122013
Annual temperature fluctuations (centigrade)−3.0−1.0−2.16.1−1.1
Annual precipitation fluctuations (millimeter) 3.189−4.1087.60−2.641.9
Annual fluctuations in the number of freezing days−24467−2410
* Authors’ calculations based on meteorological annuals, Sanandaj station (2012–2021).
Table 3. Area and the percentage of green space, gardens and agricultural land in the zones of Sanandaj city (2014).
Area and PercentageZone 1Zone 2Zone 3Zone 4Zone 5
area127,582264,660367,2242,039,325334,189
Percent of the whole use3.27.44.946.76
Table 4. Age and gender proportions of the population of Sanandaj city (2021).
The Age Ratio of PopulationGender RatioGender Ratio
Less Than 1515 to 6465 and MoreMaleFemale
NumberPercentageNumberPercentageNumberPercentage
92,05129.18209,01666.2514,428Apr-57160,832154,663103.99
Table 5. The ultimate significance of the indicators.
Adaptation IndicatorsWeight
Infrastructures0.205
NGOs0.135
Education0.125
Land use0.102
Food security0.082
Governmental organizations0.073
Public services0.061
Social relations0.043
Employment0.057
Environment0.054
Income0.027
Insurance0.025
Social welfare and security0.014
Table 6. The ordering of indicators according to the current situation in the zones of Sanandaj city.
AdaptationScore
Insurance0.039
Public services0.051
Social relations0.061
Land use0.061
Education0.068
Governmental organizations0.077
Environment0.081
Food security0.083
Employment0.084
Income0.087
Social welfare and security0.092
NGOs0.093
Infrastructures0.121
Table 7. The ultimate weighting of the resiliency in zones.
Zone 1Zone 2Zone 3Zone 4Zone 5
resilience0.3680.290.4130.4680.461
Publisher’s Note: MDPI stays neutral with regard to jurisdictional claims in published maps and institutional affiliations.

