1. Introduction
Studies have primarily focused on the share market because of the accessibility of statistics alongside clear financial motivations. We currently produce and gather enormous quantities of financial information owing to recent advancements in digital innovations. Since the number of statistics has exceeded our capacity for manual analysis, both academics and monetary organizations are turning to machine learning (ML) algorithms to help them estimate stock values. Artificial Neural Nets (ANN), Support Vector Models (SVM) [
1,
2,
3], Randomized Forests (RF) [
4,
5,
6], Convolutional Neural Network (CNN) [
7,
8], Principal Factor Analysis [
9], and Decision Trees (DT) are some of the best-known techniques [
10,
11].
When compared with different statistical information, the evaluation of monetary time-series info has unique challenges. The researchers pointed out that repetitive changes, unpredictable fluctuations, and periodic changes can affect financial statistics. Additionally, external elements that impact markets include macro- and microeconomic considerations, governmental and societal circumstances, and an investor’s or market manufacturer’s personality (MM). Bearing this in mind, it is understandable why share market forecasting only utilises historical information without considering into those external factors that fail to produce results meaningfully accurate enough to generate a return for the trader. It is impossible to develop a framework that accounts for every solitary recognized market-affecting element since there are countless variables to consider. Therefore, in order to effectively perform evaluation and estimation, a framework that effectively captures useful data must be created. Throughout this research, the outer market-affecting element will be examined using digital media sources.
The possibility for media statistics to serve as an effective stock price movement forecast seems to be significant. According to the effective market assumption, the share market provides a strong indicator of the collaborative decisions we make in the real world. Nevertheless, constructing a judgment does not simply come down to whether to purchase or to trade a commodity. Traders will seek to obtain knowledge in advance in order to execute the most prepared action with the greatest likelihood of financial success. Therefore, it is necessary to analyse and measure the data that could influence investor choices, which would then boost stock prices. Most traders now obtain most of their data digitally. Online media sources can thus be used to provide predictions about market changes. Since significant news like this is frequently reported, media data can help explain societal as well as governmental developments that may otherwise be difficult to evaluate.
1.1. Problem Statement
News data has been shown to be an important factor in determining an investor’s decision making regarding stock purchases and sales. Integration of news data into standalone stock prediction models is well explored in the literature. Current stock prediction models based on sentiment analysis do not account for magnitude and do not take advantage of features that can be generated by sentiment analysis. News datasets are largely unfocused and cannot be tied to a specific stock. This study will make use of a news synopsis pre-annotated to a specific stock and used by market professionals as news data, combined with additional features with comparisons of both magnitude-based and polarity-based sentiment analysis to incorporate into ML models to predict stock prices.
1.2. Research Questions
The main issues discussed as part of this research:
Which sentiment analysis model can annotate news data with the highest accuracy?
What features can be generated from sentiment analysis of news?
When combined with a neural network, what combination of features from both stock prices and sentiment analysis can predict stock prices best?
Will different time aggregations affect the results?
1.3. Aim & Objectives
The primary objective of this study is to create a prediction framework to forecast share prices which accounts for other criteria like discretized stock price movement, valence (continuous) sentiment analysis, polarity (discrete/binary) sentiment analysis, and other technical features (volume movement, positive/negative news ratio). Among the objectives, we propose:
To conduct and compare sentiment analysis of news data using polarity and valance-based lexicons.
To produce elements using already accessible stock and media information.
To predict stock prices using a neural network combined with sentiment analysis features to output RMSE, MAPE, and a percent accuracy for discrete predictions.
To compare predictions at different time aggregations.
To perform a comparative analysis of machine learning and deep learning models.
SVM showed better accuracy than NB in sentiment classification with performance improvement of 9.5 on Full corpus in manual sentiment and 15.65 on Full corpus in AFINN Sentiment. The LSTM models showed an accuracy of 94.84%,92.41%, 94.95%, and 94.43% with sequence length of 5, 15, 30, 50 respectively in sentiment classification.
1.4. Scope of the Research
The processing power needed to process a large selection of stocks is significant. Hence, for this research, 5 stocks will be selected for analysis with a time granularity of 2 data points per day (the opening price and closing price), ignoring the price fluctuations in between. The duration of analysis will be set to historic 10-year stock price data.
In terms of news data, to lower the demand of processing power, the researcher will only consider the headline of the news and the subsequent 200 words. The timeline of the news data matches our chosen stock market data timeline. Most news outlets summarize the important points of the article in the first paragraph, justifying this reduction. There is also a consideration of the relevance of the news itself to stock market movements. Positive news about irrelevant topics, such as celebrity news that may not impact the stock market, should not be analysed. To overcome this, previous research [
12] had used a custom lexicon of finance terms to output sentiment analysis scores. However, their method is conducted manually and there is a lack of documentation on how to implement this in an ML model. The researcher has chosen a compromise: to only analyse news under the category of “finance” and using only publications that specialize in financial news with a general-purpose sentiment analysis model.
1.5. Significance of the Research
While a real news research methodology remains in its infancy, research that uses extrinsic, unorganized textual information to forecast stock fluctuations has been restricted towards Google Trends [
9,
13,
14], Twitter Messages [
4,
15,
16,
17], and Wiki query activity [
18]. Since there is so much turbulence within both the stock statistics and the media information, research that employs media information explicitly is unable to link text analysis findings to fluctuations in the stock markets [
19,
20,
21]. Experts developed frameworks with increased efficiency for a current Kaggle event based on this idea, although the exact allocation of the online source that leads towards the accuracy is minimal [
22].
The significance of this paper is as follows:
Compare a novel approach (valence sentiment analysis) with traditional approach polarity sentiment analysis) in processing news data;
Generated novel features to be implemented in the model (news volume and ratio features);
Compare a discrete classifying approach with a continuous predictive approach;
Evaluate the model across different time-series aggregations.
This paper is divided into the following sections: the Literature review is included in
Section 2; the recommended methodology is described in depth in
Section 3;
Section 4 contains information regarding statistical measurements in depth; Discussions and Outcomes are dealt with in
Section 5; and Conclusions and recommendations for further research are discussed in
Section 6.
2. Literature Survey
Machine learning is well known for its ability to forecast the share market. Typical ML systems cannot produce accurate results that are adequate for the arguments outlined in
Section 1.1 [
23]. Using historical share value statistics or adding an additional factor towards the forecasting framework seem to be two common strategies used by academics to address the limitations of conventional models. Users may add a technological signal or even a basic signal when they add an additional factor.
2.1. Standalone Historic Stock Price Models—Hybrid Models
Experts who only study historical share value statistics have tried to increase the validity of the prototype by crossbreeding or using two or more systems simultaneously. Support vector regression (SVR) was employed by the researchers of [
23] to outcross the framework. They employed an SVR-ANN as well as an SVR-RF hybrids framework that demonstrated a notable boost over solo SVR and ANN systems. In [
24], researchers tested the results of a standalone backpropagation neural network using a mixture of the ANN-GA and ANN-SA. An arbitrary combination clustering-fuzzy inferential neural network framework was implemented by the researchers [
25]. It is challenging to evaluate these findings. This is possibly due to each study using a distinct set of accuracy-determining factors as well as the features mentored on various sets of trade data.
2.2. External Variable Models—Technical Indicators
Technical analysis is organised into transactional statistics that seem to be simple to correlate to certain equities based on date. Although it has the benefit of organisation, technical evaluation in ML poses its own unique set of difficulties. Macroeconomic issues are challenging to evaluate. Scholars claim that merely using technological indicators in frameworks make sense because technical information can only partly compensate for macroeconomic aspects [
12,
14,
15,
17]. Experts are concerned whether technological indicators should be employed. Technical analysis often includes Put/Call Ratio (PCR), stochastic oscillator, Moving Average (MA), Relative Strength Index (RSI), and several others [
26].
2.3. External Variable Models—Fundamental Indicators
Unstructured statistics are made up of fundamental indications that are challenging to measure. These involve changes within the governmental landscape, the cost of commodities, the world economy, worldwide events, the motion of foreign markets, a firm’s marketing plans, and shareholder emotions, among others. Fundamental diagnostic research is not as widely recognized as technical diagnostic analyses. Fundamental indications as exterior elements studies focus primarily on unorganized information to assess shareholder emotion because quantified basic signals could be conveniently combined into technical frameworks, as described previously. Research has demonstrated that it is possible to anticipate share markets activity quite well using Internet search engines, Wiki consumption [
18], Twitter trending [
15,
16,
17], Google statistics [
13,
14], and news articles [
22,
27,
28].
2.4. Use of News Data as an External Variable
Experts attempt to gauge shareholder emotion to get around the issue of the analytical signals’ excess of data. Market sentiment beyond a particular commodity can be influenced by information about the forecast for the sector, government statistics and new policies, accounting records, or even international events, as well as share market behaviour [
29]. It is logical to believe that information encountered online can justify or perhaps even anticipate the motion of the share market since online sources serve as the most available source of information. In addition, media data—especially from publications with a monetary focus—is a useful recap of recent financial developments as it simplifies the technical analysis stated above into terms which are understandable among laypeople. Given the assumption that media information may influence investor choices and the share market, broadcast information seems to be capable of collecting market sentiment in addition to taking some technical indications into consideration.
The use of data sets to forecast the price of stocks has been extensively discussed in research. Findings, unfortunately, cannot be straightforwardly compared because of the researchers’ drastically dissimilar methodologies and strategies. For instance, combining news information with numerical stock prices may increase reliability by 72.23% to 89.90% but only if the share market values, as well as the media content, are discretized [
30]. Recurrent neural networks (RNN) as well as long short-term cognition (LSTM) hybrid prototypes have been shown, in recent research, to be capable of achieving low MAPE; conversely, the integration of textual data only lowered average MAPE from 2.13 to 2.03, raising questions about the relative commitment of data sets towards the framework [
31]. LSTM showed better performances in various applications related to time-series data. Unmonitored media information analysis differs from controlled news information analysis because it does not use a pre-existing database or lexicon. Instead, it makes use of cutting-edge methods like word2vec [
16,
30,
31]. In [
31], researchers demonstrated that polarity-based controlled sentiment classification produced better outcomes than uncontrolled textual information processing, which performed worse than having no media info at all. Authors have found methods to connect shares not just by sector but also through direct commercial links like ownership, collaboration, and being part of similar vertical supply network [
32]. They have then employed media information to anticipate market fluctuations between the focal market and connected stock. This saves time and resources by preventing the waste of media info on only one stock.
2.5. Sentiment Analysis Techniques
There are two main types of sentiment analysis techniques: rule-based (lexicon-based) and machine-learning based. A rule-based technique comprises of using a manually-compiled lexicon based on decision tree models, such as k-Nearest Neighbors (k-NN), Sequential Minimal Optimization (SMO), Hidden Markov Model (HMM), Conditional Random Field (CRF), and Single Dimensional Classification (SDC) [
33]. These are classification models where sentiment scores of detected words in an article are aggregated and classified and a score of more than 0 is positive and less than 0 is negative, with 0 meaning neutral sentiment. ML-based models are the more modern evolution of NLP models. They are capable of automation and processing large amount of data [
34]. ML-based models are also called automatic methods, due to their ability to classify vocabulary outside of a lexicon. ML-based models are further classified into supervised, semi-supervised, and unsupervised models. However, most studies use a combination of these methods and such distinct classification is neither easy nor helpful. For example, lexicon-based techniques are now almost exclusively used with ML models like Naive Bayes (NB) and SVMs, since the general-purpose lexicons such as AFINN, Text Blob, and Bing Liu’s Lexicon can be directly used as the parts of speech (POS), unigram, and bag-of-words features in ML models. The goal of sentiment analysis is to classify a body of text into two-way (positive or negative) or three-way (positive, neutral or negative) sentiments. However, more finely tuned sentiments (5 sentiment class and above) or even continuous scores [
35] do exist.
In [
36], authors proposed a completely unsupervised sentiment analysis model using deep learning: a deep generative model (DGM). The study was benchmarked against supervised SVM and Multi-layer Perceptron (MLP) models, as well as a non-model approach, with models all-buying, all-selling, and random buying and selling, to calculate profits. The DGM model was able to predict better than the other models and was able to generate a profit.
2.5.1. Issues of Sentiment Analysis
Sentiment analysis of online forums where content is user contributed, like Twitter and Reddit, has a set of unique challenges. Unlike official publications, users tend to use slang, acronyms, or emoticons which are difficult to classify [
35]. Models to treat novel language and emoticons have been proposed, as well as addition of relevant/irrelevant positive/negative sentiment, humour, marketing, neutral but mistaken for sentiment, and mixed sentiments are added to traditional 3-way classifier. To mitigate this problem in this study, only curated news headlines and synopses are used. Most studies do not have cross-validation for the sentiment analysis step [
17,
31,
37]. This means that the result of sentiment analysis is taken at face value, based on word count methods using a well-established lexicon. This is problematic. Some studies do use cross-validation. In that article, models are compared with a human’s interpretation of sentiment, showing that the accuracy is not perfect, with ranges from 48.59% to 99.51% depending on model and type of text data used [
30,
32,
36,
38]. In addition, most studies do not use a continuous measurement of news sentiment. Most use 2 levels of polarity, and occasionally 3 or 4 levels [
32,
36]. Since stock prices rarely, if ever, remain unchanged from one day to the next, the default 3 level sentiment (positive, neutral, negative) is reduced to 2 (positive and negative). In this study, sentiment analysis will be attempted using both continuous and discrete methods. However, continuous sentiment scores may not have much utility. This is because lexicons do not differentiate between the degree of positivity and negativity of words (e.g., good and amazing). As such, continuous polarity models are based on positive vs. negative word counts only.
2.5.2. Annotation Approaches of News Data
There are three approaches to labelling news articles. The first approach is manual., Each news article is labelled positive or negative by a human [
37,
38]. The downside to this approach is that it will cause the training dataset to be smaller as a manual approach uses significant resources. However, this method guarantees an accurate assessment of the article itself. The next approach is labelling using simple sentiment analysis techniques. A simple word count or rule-based method is employed to classify news. While this method seems naïve at first glance, it does achieve reasonable accuracy when validated against manual methods [
30]. This may be due to financial news being fact- based and not opinion based. Processing just the headline of an article reduces the noise generated by the remainder of the article. The third approach is labelling of news data using a machine learning method, such as NB and SVM [
39]. The model can be trained on news data already manually labelled or trained based on the stock price movement. The latter approach will occasionally show antagonistic results, where good news causes stock prices to drop. Due to the limited amount of vocabulary in financial news, overall prediction accuracy may be lower. This can be abated by including additional external variables like technical indicators.
2.5.3. Rule-based Methods
Rule-based sentiment analysis is a method which relies on a set of pre-annotated words used as a training set. Rule-based models operate on a simple word count system, where the number of positive words is deducted by the number of negative words. If the result is a positive integer, the document is classified as having a positive sentiment, and vice versa. There are several ways to optimize rule-based sentiment analysis, such as stemming, tokenization, stop-word removal, TF-IDF, and part-of-speech (POS) tagging and parsing. In [
40], authors propose using POS tagging using Penn Treebank, which is then parsed using a RNN. Each word is parsed using a sentiment lexicon with additional noun and verb phrase rules to give a sentiment-level polarity score. Using the aggregation of each sentence polarity score, the sentiment of the whole document is calculated using positive-to-negative sentiment score ratio (P/N).
The generation of a manual lexicon of positive and negative sentiment that spans an entire dictionary was one time consuming. However, the rise of ready-to-use general purpose lexicons such as Linguistic Inquiry and Word Count (LIWC), Hu & Liu Opinion Lexicon, Liu Bing’s Lexicon (Bing), MPQA Subjectivity Lexicon, and General Inquirer (GI) allow modellers to use these lexicons without having to procure their own while ensuring that the lexicons have been well validated and thoroughly used by researchers [
41]. These lexicons are unable to account for the degree or intensity of the sentiment. For example, “This place is good” and “This place is exceptional” will have the same sentiment score of “positive”, while the latter is more intense than the former. This class of lexicons is polarity based, where sentiments are classified into a set number of categories. On the contrary, valence-based sentiment analysis using lexicons such as Affective Norms for English Words (ANEW), Valence Aware Dictionary for Sentiment Reasoning (VADER), AFINN, SentiWordNet, and SenticNet are used to assign a sentiment score based on the “intensity” of the words in a given text. However, the use of valence-based sentiment analysis is hardly used in stock market prediction. In [
42], authors further improve on the ANEW lexicon, naming it AFINN-65, with valence scores from −5 to 5. Since then, a modern version of AFINN, named AFINN-en-165, has been used as the gold-standard for sentiment analysis, which is thoroughly validated on modern slang and tweets [
43].
2.5.4. Machine Learning Based Methods
ML-based models are rooted in the concepts of word vectors or word embeddings, which are used to convert a text string into numeric vectors [
32]. In this context, supervised machine learning models are training the model to classify sentiment of the text when the sentiment is already known, without a lexicon. For example, a product comment and rating, where we can assume the text comment corresponds to the 1–5 star rating the product was given, or a document that was manually classified by a human. Supervised classification uses models such as SVM and NB. On the other hand, unsupervised methods have 2 approaches: leveraging lexicons or using a purely mathematical method, such as Pointwise Mutual Information (PMI) [
44]. Unsupervised models which use lexicons defer from their rule-based counterparts due to not just taking the lexicon words at face value, but rather using the lexicon as “seed words” to predict the sentiment polarity of words not included in the lexicon based on their vector distance, for example word2vec and WordNet. Pure unsupervised models are highly troublesome. They require extensive training data containing as many features as possible, which is difficult to obtain. They are also highly computationally expensive and are difficult to interpret due to the black box nature of NNs. Several works have been undertaken to combine the benefits of word-embedding based models and lexicon-based models [
45,
46]. The summary of existing studies is shown in
Table 1.
3. Proposed Methodology
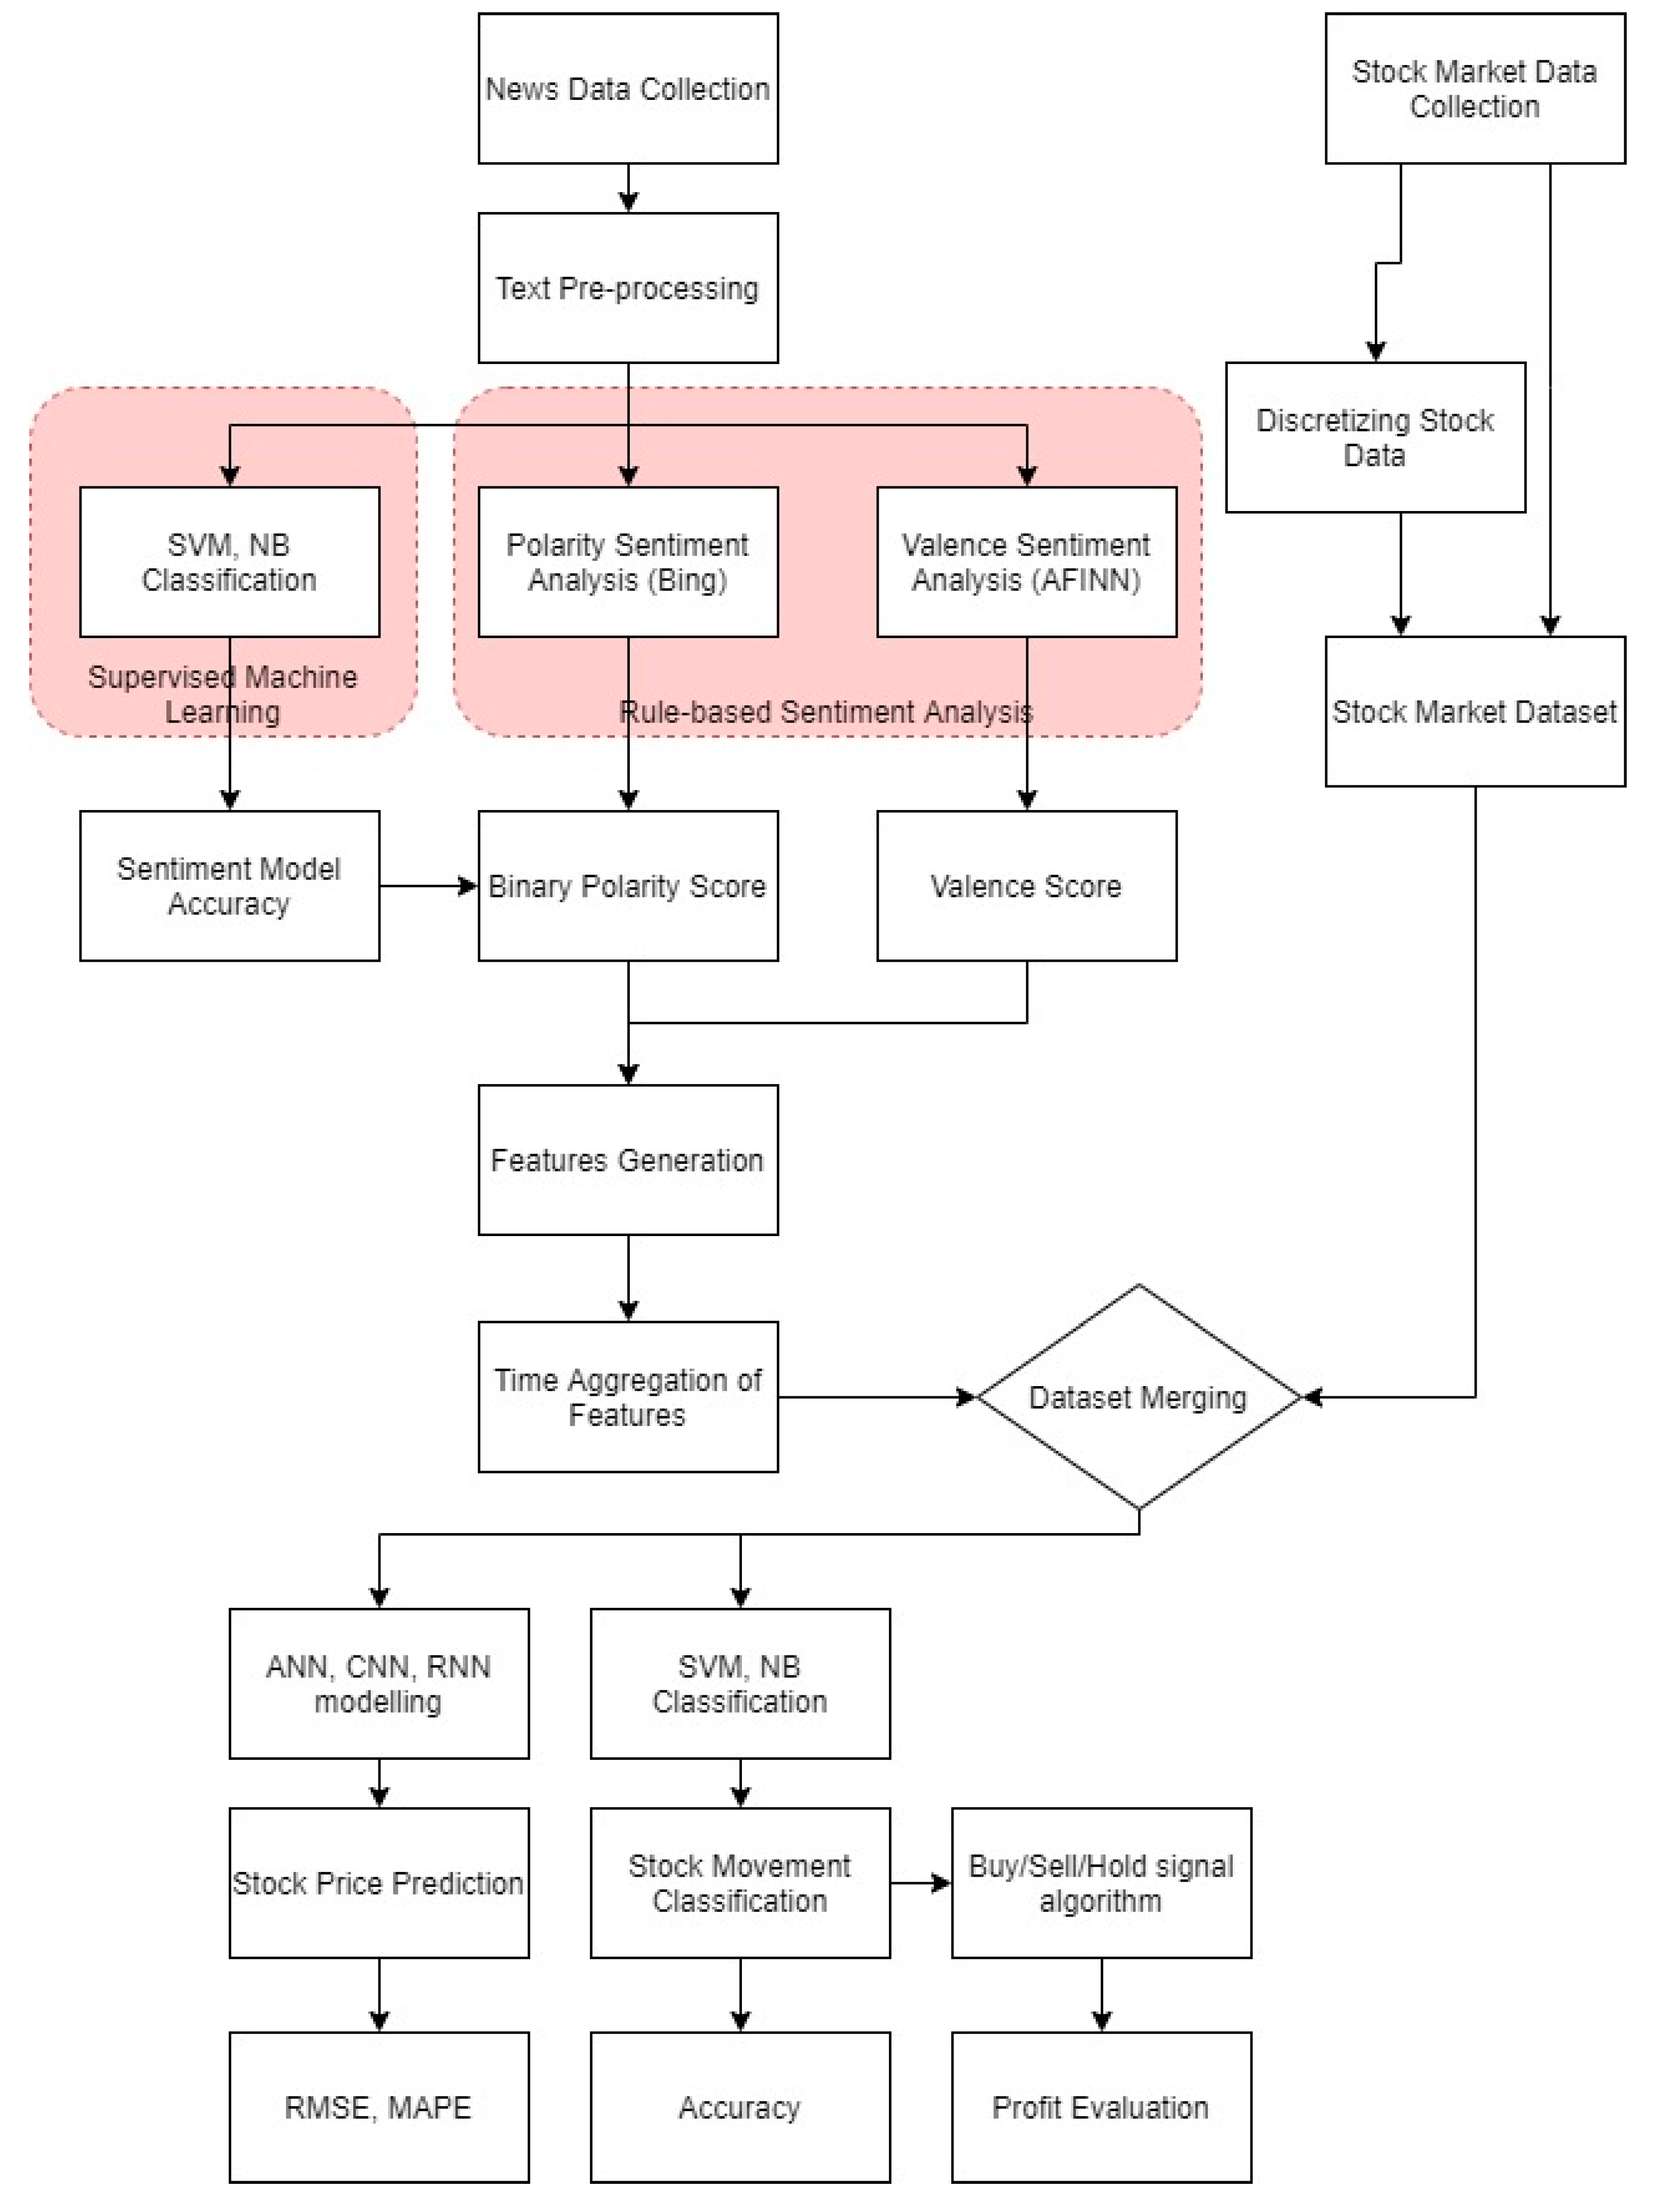
The proposed methodology is shown in
Figure 1. There are two datasets to be collected in this study: the news data and the stock data. Before generating results from the news data, simple text processing, like lemmatization and stop word removal, will be conducted. Three features will be generated from sentiment analysis of text data: positive/negative classification using a ML method, positive/negative classification by using manual lexicon, and −5 to +5 valence score by using the AFINN lexicon. Positive/negative classification using a ML method may be trained based on stock price movement or manual annotation. Since our news data is already manually annotated, the latter approach is used, but the former approach is also used as an additional feature. Each of the classification results can be used to compare their accuracies.
From the results of sentiment analysis, a few features can be generated: positive volume, negative volume, and total volume. Each day, the news data is analysed by conducting sentiment analysis on each tweet and aggregated on a per day basis. Time frame aggregation is determined using sequence length.
The stock market dataset is collected based on historic data of the stocks to be analysed. The stock prices are then discretized into positive or negative based on the movement of numeric variables. This is used to train the ML classifier for sentiment analysis and as a basis for the buy/hold/sell algorithm. The stock dataset and news dataset are then merged based on date. LSTM-RNN models are run via Keras library in Python to predict stock price while SVM and NB (from SciKit Learn) are used to classify predicted stock movement based on features from the news dataset.
3.1. Dataset Collection
3.1.1. Obtaining the Dataset
This research has 2 key datasets:
Stock market dataset
News dataset
News text data is extracted via web-scraping from a financial data news summary feed from aheadsup.com. Stock market data is extracted from Yahoo finance historical price data. Stock prices include open, close, adjusted close, high, low, and volume. Pre-processing of stock market data includes elimination of stocks that are not analysed and mid-day stock prices. As stated in
Section 1, only closing prices are considered. The time period is limited by the news dataset, whereby the stock dataset will be trimmed to tally.
3.1.2. News Dataset
There are 4 main considerations in selecting a news dataset: specificity, relevance, validity, and length (see
Table 2). Volume is a secondary consideration due to its primary use as a feature generator.
In the case of full articles, articles could be divided into stock-specific, industry-specific, or general. One of the benefits of using full articles is that by using Named Entity Recognition (NER), the effect of one article can be attributed to many different stocks. News publications are also easy to filter by credibility. For example, by only using articles from The New York times or Yahoo Finance, articles can be considered highly valid. However, due to the high variability of article formats like listicles, summaries, and opinion pieces, there does not exist a data reduction technique that can maintain the full meaning of an article. For example, reducing the corpus to only article headlines such as “5 Unstoppable Stocks to Buy With $5000” will extract no information at all, while a first-200-word reduction will only extract information of the first 2 stocks in the article. Processing entire news article corpuses is infeasible from a programming power standpoint, especially for real-time data such as stock market prices. Additionally, financial news article headlines are rarely specific, with articles such as “Oil Rallies From 3-Week Low Buoyed by Trump’s Improving Health”. While easy to output a positive sentiment, it cannot be tied to a specific stock.
Tweets, on the other hand, have the benefit of having close to exact specificity. This is because tweets are often quoted together with the stock’s ticker (i.e.,
$AAPL) and hence can be attributed directly to that stock. The sentiment dataset is web-scraped from aheadsup.com based on the ticker symbols of the stocks to be analysed. The short length also minimizes the noise of the corpus, and with high volume, this data source is highly accessible and the volume itself can be used for interpretation, unlike full article publications which only output a certain number of articles per day regardless of market conditions. However, tweets can be published by anyone and do not adhere to publication integrity like reputable news publications. In [
43], authors also highlight additional setbacks in terms of using tweets compared to traditional media, such as high amount of sarcasm, novel language, and use of emojis.
Many news sentiment studies use headlines as a means of corpus reduction for entire news articles. With article headline like “Regeneron and Gilead Stock Jump as President Trump’s Health Remains in Focus”, NER can tie a positive sentiment to stocks $REGN and $GILD without having to process the entire article. However, this is far from the norm. The exact stock name is rarely mentioned in a headline and only sometimes in the article. For specific stocks, there might only be 1 or 2 articles published per week. The volume of news articles is just not enough for a daily granularity stock price prediction, especially when that granularity can increase to a real-time level.
For this study, curated tweets are used as the news dataset. Since 2018, Twitter has increased its character count from 140 to 280. This constitutes a word count of roughly 50 words, which is much longer than using just headlines. The curated tweets consist of a combination of financial analysts’ personal analyses and headlines and summaries of top financial publications. This solves the issue of volume with full articles and the irrelevancy of standard tweets. The specificity of this method is exact as each tweet is directly attributed to a stock by the inclusion of its ticker code.
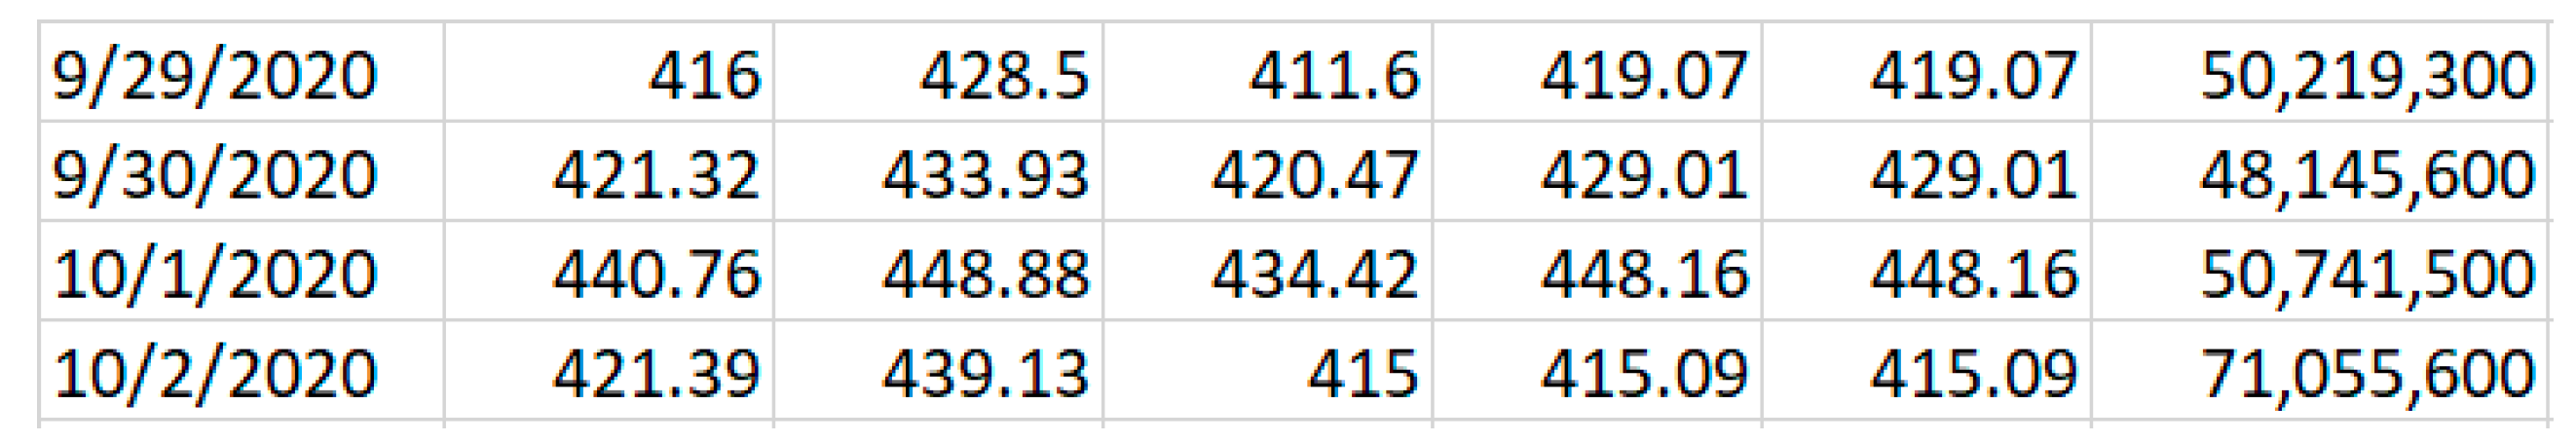
3.2. Stock Market Dataset Processing
The stock market dataset consists of Date, Opening Price, Closing Price, Volume, and Adjusted Closing price (
Figure 2).
3.3. News Dataset Processing
A simplified version of a standard NLP pipeline will be used to process news data. Tokenization, parts-of-speech tagging, lemmatization, and stop word removal are conducted using NLTK library in Python 3. Bag-of-Words, tokenization, decapitalization, lemmatization, and stemming were used to pre-process the data. A regex filter is used to filter garbage characters and non-alphabets. Additional treatments. including Parts-of-Speech (POS) tagging and Term-Frequency/Inverse Document Frequency (TF-IDF), is also used.
3.4. Sentiment Analysis
3.4.1. Rule-based Method
Unsupervised sentiment analysis is performed using 2 lexicons. NRC is used to output a binary sentiment polarity outcome with emotion count while AFINN is used to output a linear −5 to 5 sentiment valence score. Regex-based word matching is used to match the words in the tweets with the AFINN lexicon and summed. This aggregation of word scores will henceforth be referred to as ‘Valence Score’. Additional features will be generated like categorizing AFINN valence score to positive, neutral or negative, absolute positive valence, and absolute negative valence.
3.4.2. Supervised Machine Learning Method
The news dataset is already pre-annotated by their authors as positive or negative sentiment (binary). The supervised model will use this sentiment as training via NB and SVM classifiers. The prediction results of the classifiers are used as features to feed into the LSTM-RNN model. A Long Short-Term Memory Recurrent Network (LSTM-RNN) is chosen for stock price prediction due to its ability to overcome the vanishing gradient problem seen in traditional RNNs [
47]. Additionally, LSTM is preferred for time-series data analysis due to its ability to avoid long-term dependency issues. This is carried out by its gated architecture which allows for information selection, whereby information can be stored for a long period or discarded when necessary. A traditional RNN outputs a sequential pattern based on input sequences through loops, and the weights are learned based on back-propagation. The shortcoming of this is that these loop outputs have a very large or very small gradient because of the backpropagation, contributing to vanishing gradient or exploding gradient [
48]. The model can accept multiple input dimensions and is able to control carefully how instances of time, stock market prices, and sentiment scores are calculated.
3.4.3. Model Building
The Keras libraries are used to implement ML models in Python 3. As we have two stock datasets, we will use two sets of models to compare between them. Based on the accuracy of prior research [
2,
24], LSTM-RNN models will be used to predict for the base stock dataset. The design to establish the appropriate hyperparameters for the model, preliminary tests on prediction time, number of neurons and epochs, dropout values, number of layers and batch sizes, optimizer, and activation function selection are performed. The model can accept many input dimensions and train data using a sliding window mechanism.
3.4.4. Model Evaluation
There are 2 models in this study. One is the result of the classifiers and the other the result of the LSTM-RNN model. The classifiers will be evaluated using accuracy, precision, recall, and F1-score, whilst the LSTM-RNN will be evaluated using RMSE, MAPE, and accuracy.
4. Statistical Metrics
Accuracy, Precision, Recall, and F1-score are used to evaluate the performance of the NB and SVM models. Models based on LSTM are assessed using the model’s performance and are measured using RMSE, MSE, accuracy, and MAPE.
Accuracy is defined as the total number of correct results over the total number of predictions.
Precision is the ratio of how well a model extracts true positive results compared to the total number of positive results returned. A high precision for the minority class indicates that the model is specific and is used to minimize false positives.
Recall, also known as sensitivity, is the ratio of how well a model extracts true positive results compared to the maximum number of positive results that can be returned. It measures the relevancy of the items returned and is used to minimize false negatives.
For classes that are imbalanced, choosing one of the above metrics will come at the cost of the other. Instead, a balanced compromise between the two can be used and named F1-Score.
5. Results and Discussions
This section explores, in detail, the comparison of each feature set on its effect on the accuracy, RMSE, and MAPE of the LSTM model. Additionally, the LSTM model is then tested with different numbers of stock price points (number of previous day’s prices allowed) to test the accuracy decay.
5.1. Characterization of Stocks
Three stocks are selected for this study: Tesla, Apple, and Microsoft. Although all three are large capitalization stocks, each of these stocks can be broken down differently based on how they interact with the news and how investors perceive them in general (
Table 3). Tesla is a controversial company, with its agile and unpredictable CEO Elon Musk able to cause big news and stock movements by just tweeting. Tesla also tends to have several events in a year (Tesla, 2021) which occur in addition to their quarterly financial reports. The products revealed vary and and are unpredictable, like Battery Day, Cybertruck, Solar City, and car model reveals. The market sentiment for Tesla is also highly varied, with just as many die-hard fans as hard critics. Consequently, the volume and sentiment variance of tweets collected are also high. Apple is a similarly newsworthy and high-volume stock but one that features less disagreement and sentiment disparity. Compared to Tesla, which reveals wildly different products, Apple tends to only hold 2 events per year, at a set date: one to reveal updated editions of the iPhone and another for other minor products, such as iMacs and iPads. Apple does not have an unpredictable and vocal CEO, and both critics and supporters do not feel too strongly one way or the other for this stock. Microsoft, however, is not a very newsworthy stock, since they are a software-focused company. The few product unveiling they conduct do not generate as much hype as Apple and Tesla, and the company does not have many vocal critics or supporters at all.
5.2. Initial Data Exploration
The initial exploration consists of visualization and summarization of the features generated by iterating a lexicon over the sampled tweets. Analysis of results of machine classifiers will not be explored in this session due to visualization being similar. 2-polarity NB and SVM will be visually similar to Manual Sentiment Graphs, while 3- polarity NB and SVM will look similar to AFINN sentiment graphs. As the news dataset acts as the limiting factor (due to this type of curation not existing before 2017), the maximum amount of news dataset was extracted and then matched with the same duration of stock price data.
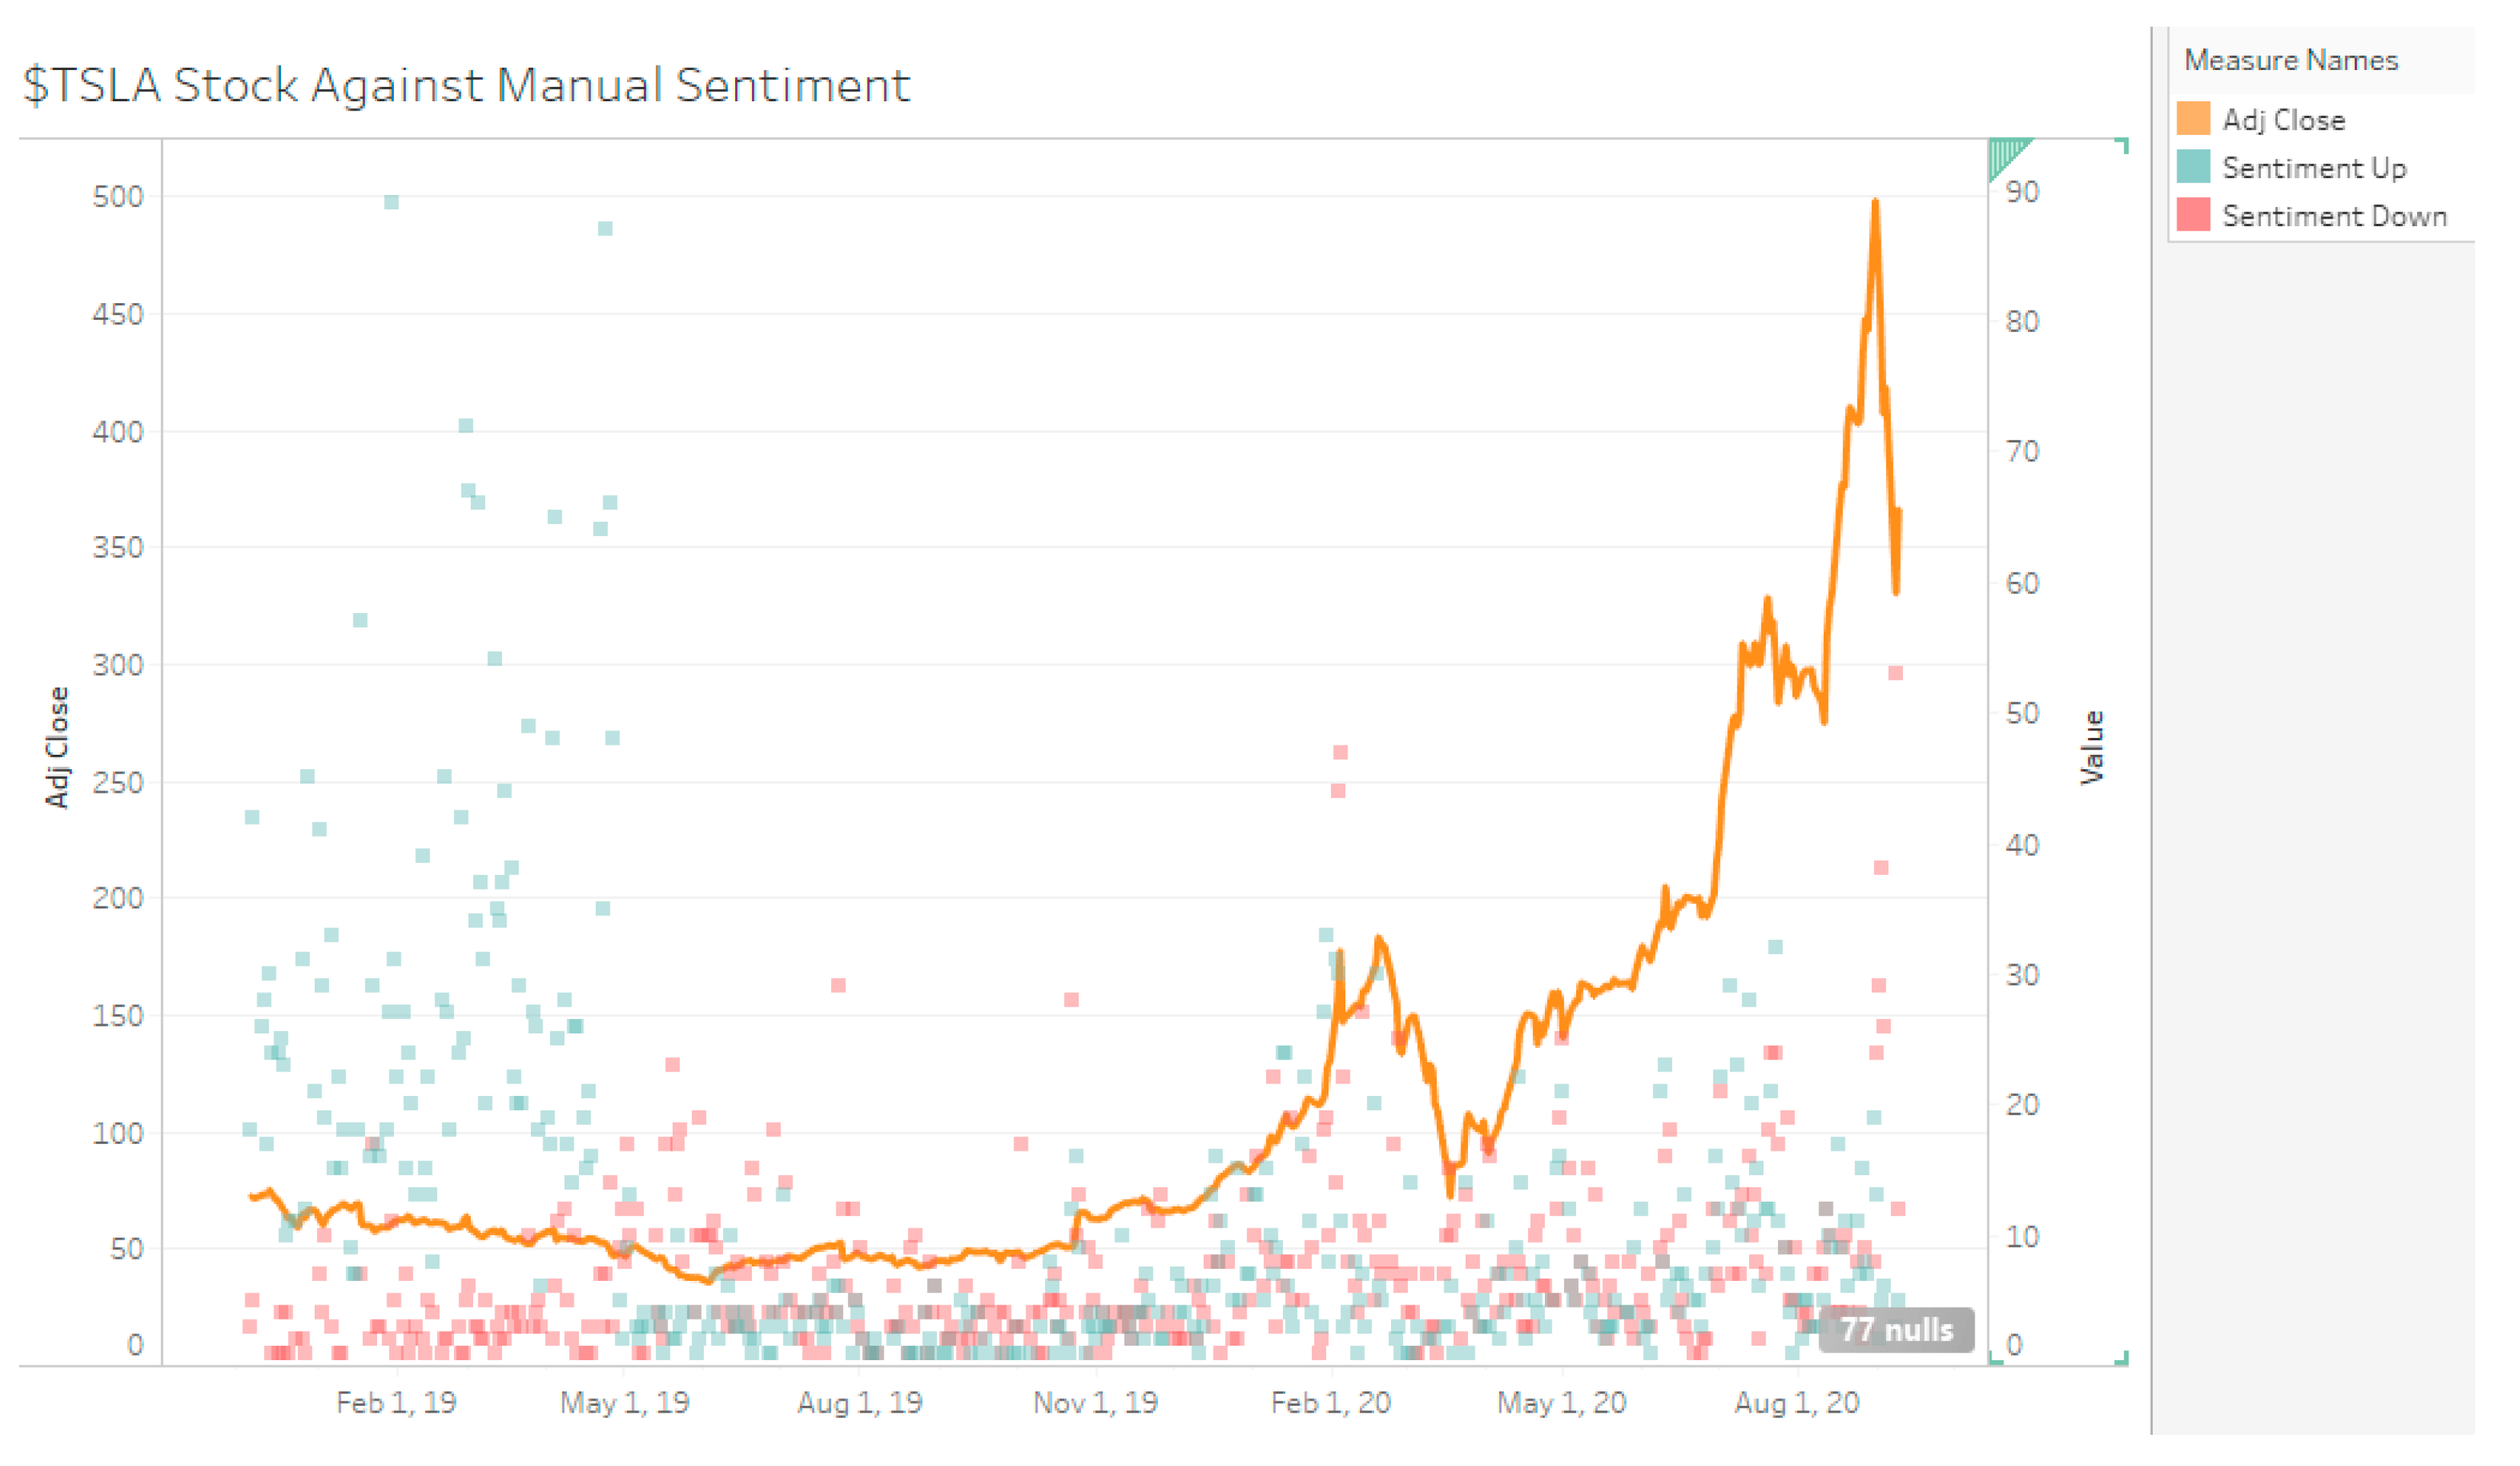
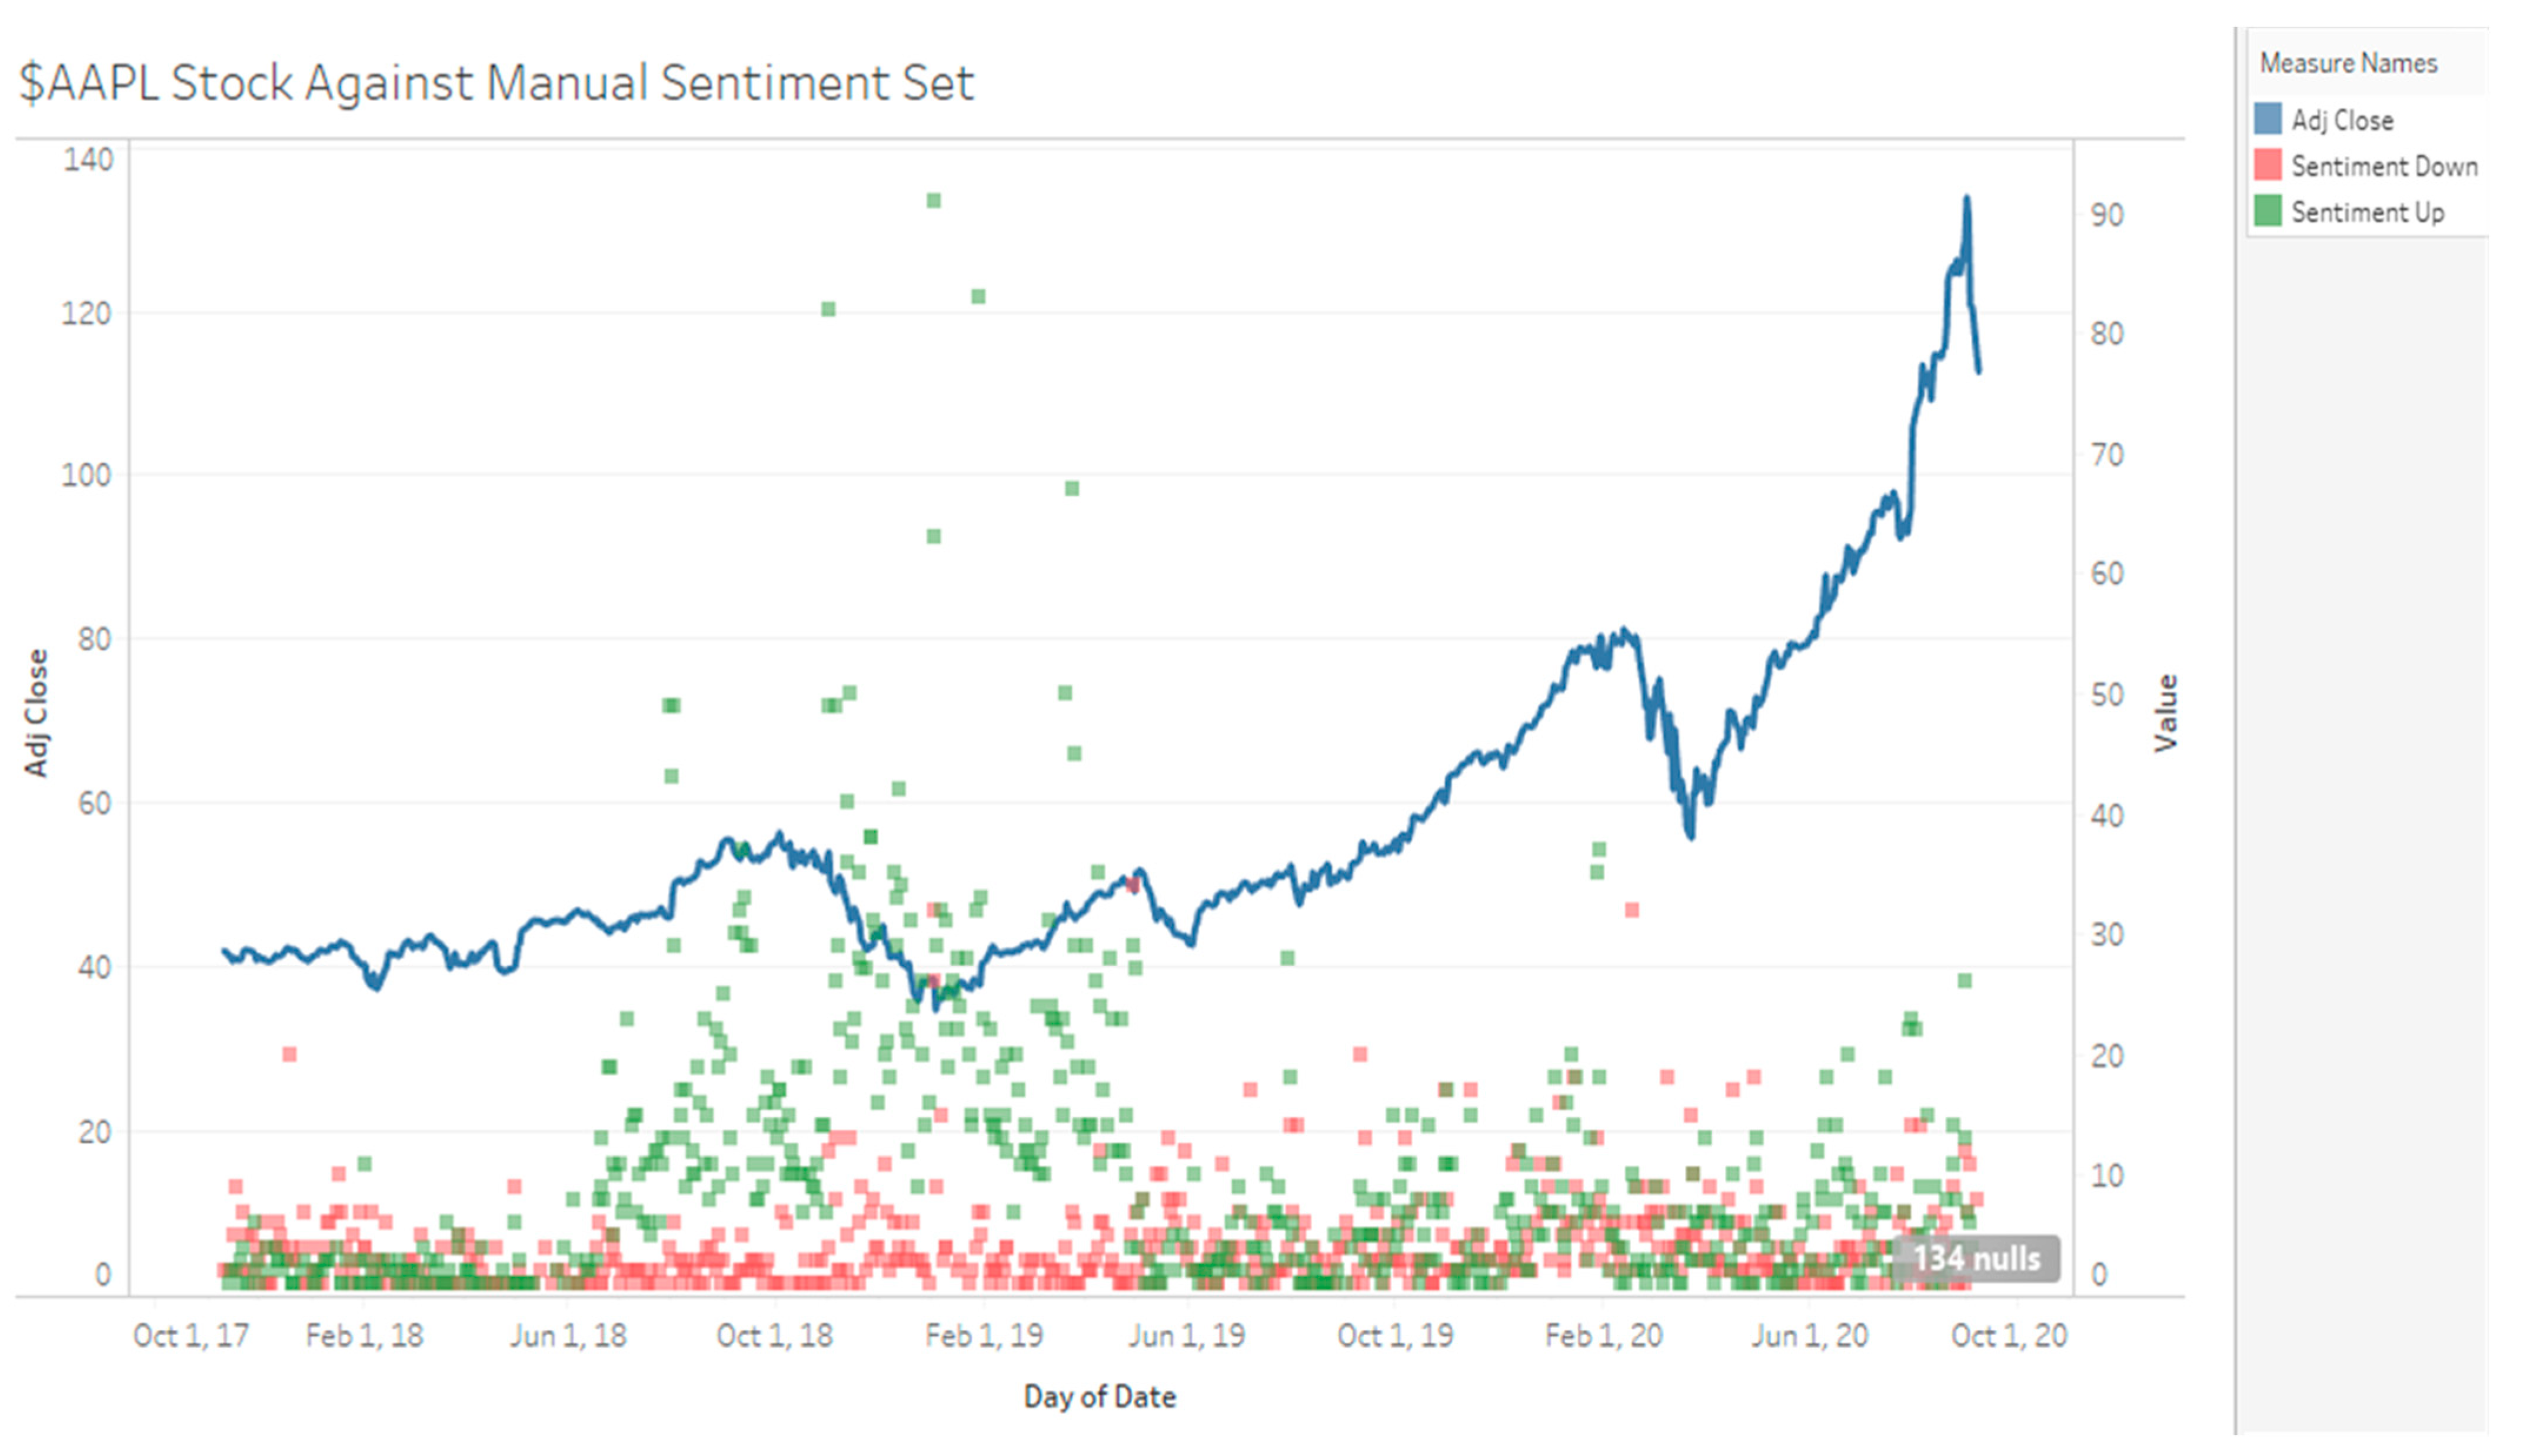
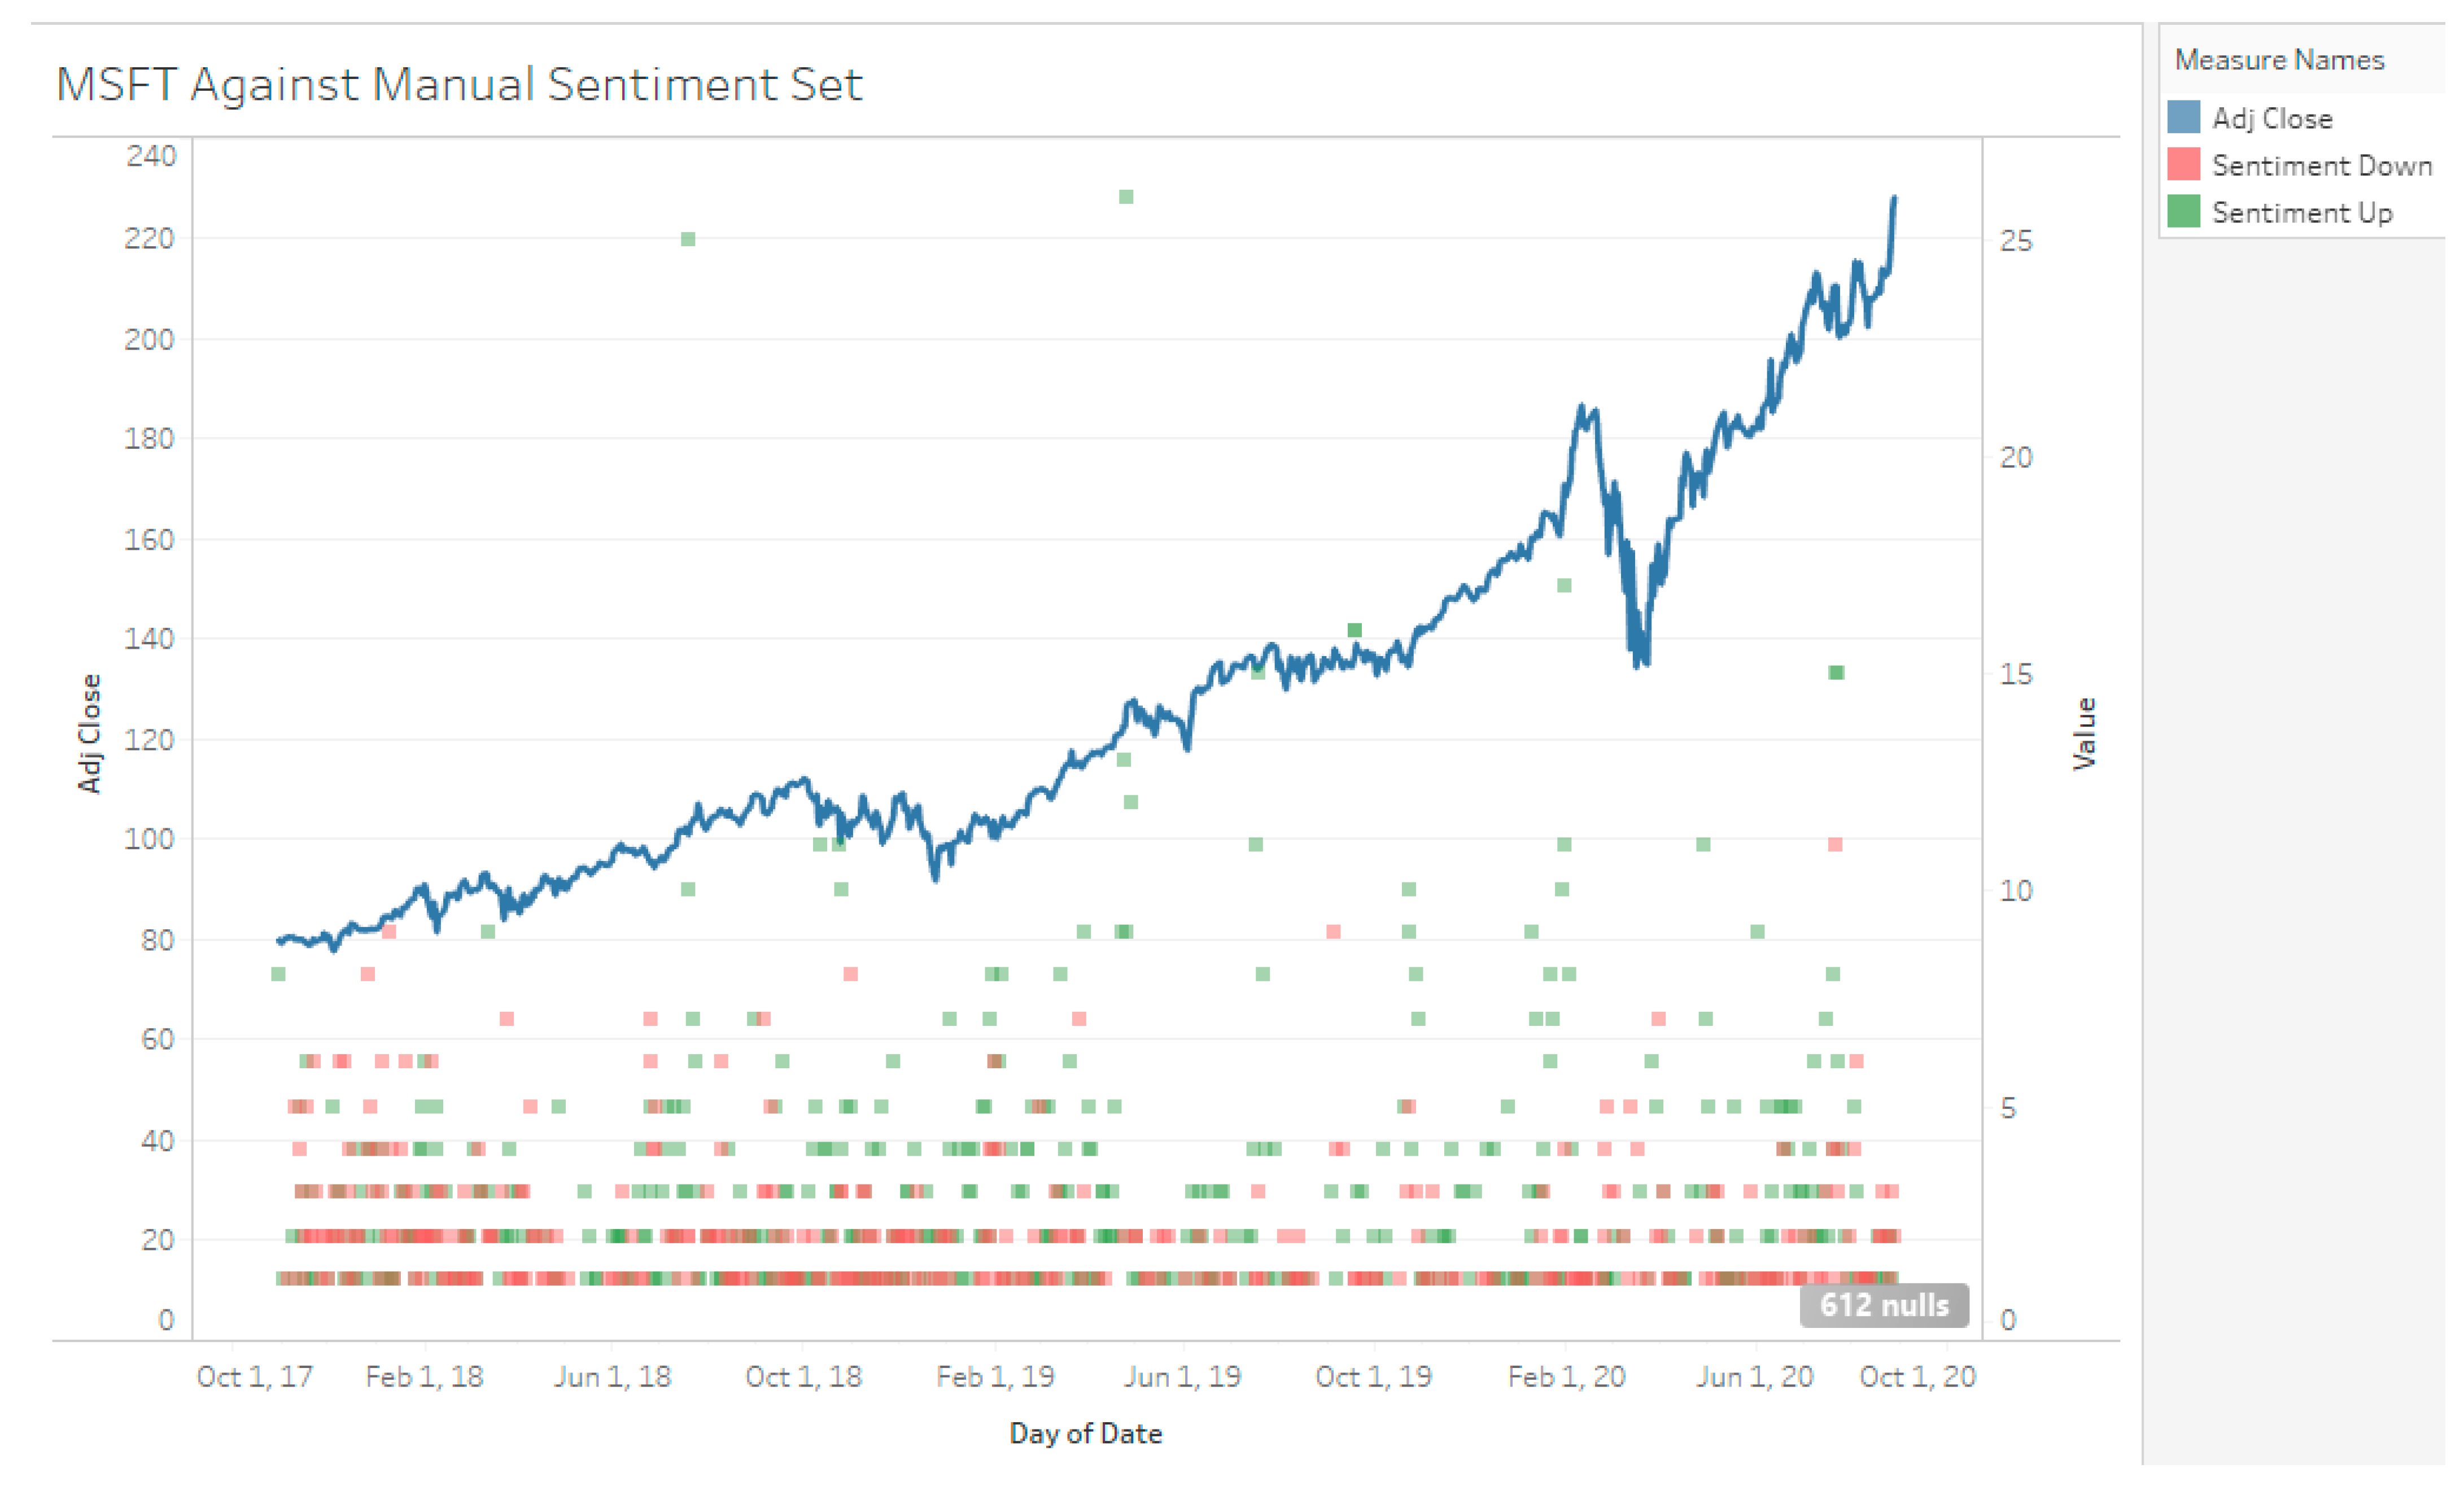
Manual Sentiment
The duration of data sampled for Tesla stock is from 8 December 2018 to 9 September 2020, with a total of 9138 tweets collected (4794 positive tweets 2945 negative tweets determined by manual sentiment). Visually, when there is a high number positive sentiment compared to negative sentiment during the December 2018 to April 2019 period, TSLA stock decreases slowly (see
Figure 3,
Figure 4 and
Figure 5). From May 2019 to November 2019, there is mixed sentiment at a low volume and the stock price remains stable. From January 2020 onwards, there is high volume of both positive and negative sentiment and the stock price rapidly increases up. For MSFT, the start date is 29 October 2017 to 30 August 2020 with 753 negative tweets and 1453 positive tweets for a total of 2206 tweets. AAPL had 3153 negative tweets and 7895 positive tweets for a total of 11,048 tweets. TSLA represents a high volume, high disagreement stock; AAPL represents a high-volume high agreement stock; and MSFT represents a low-volume, high agreement stock.
5.3. Results of Lexical Sentiment Analysis
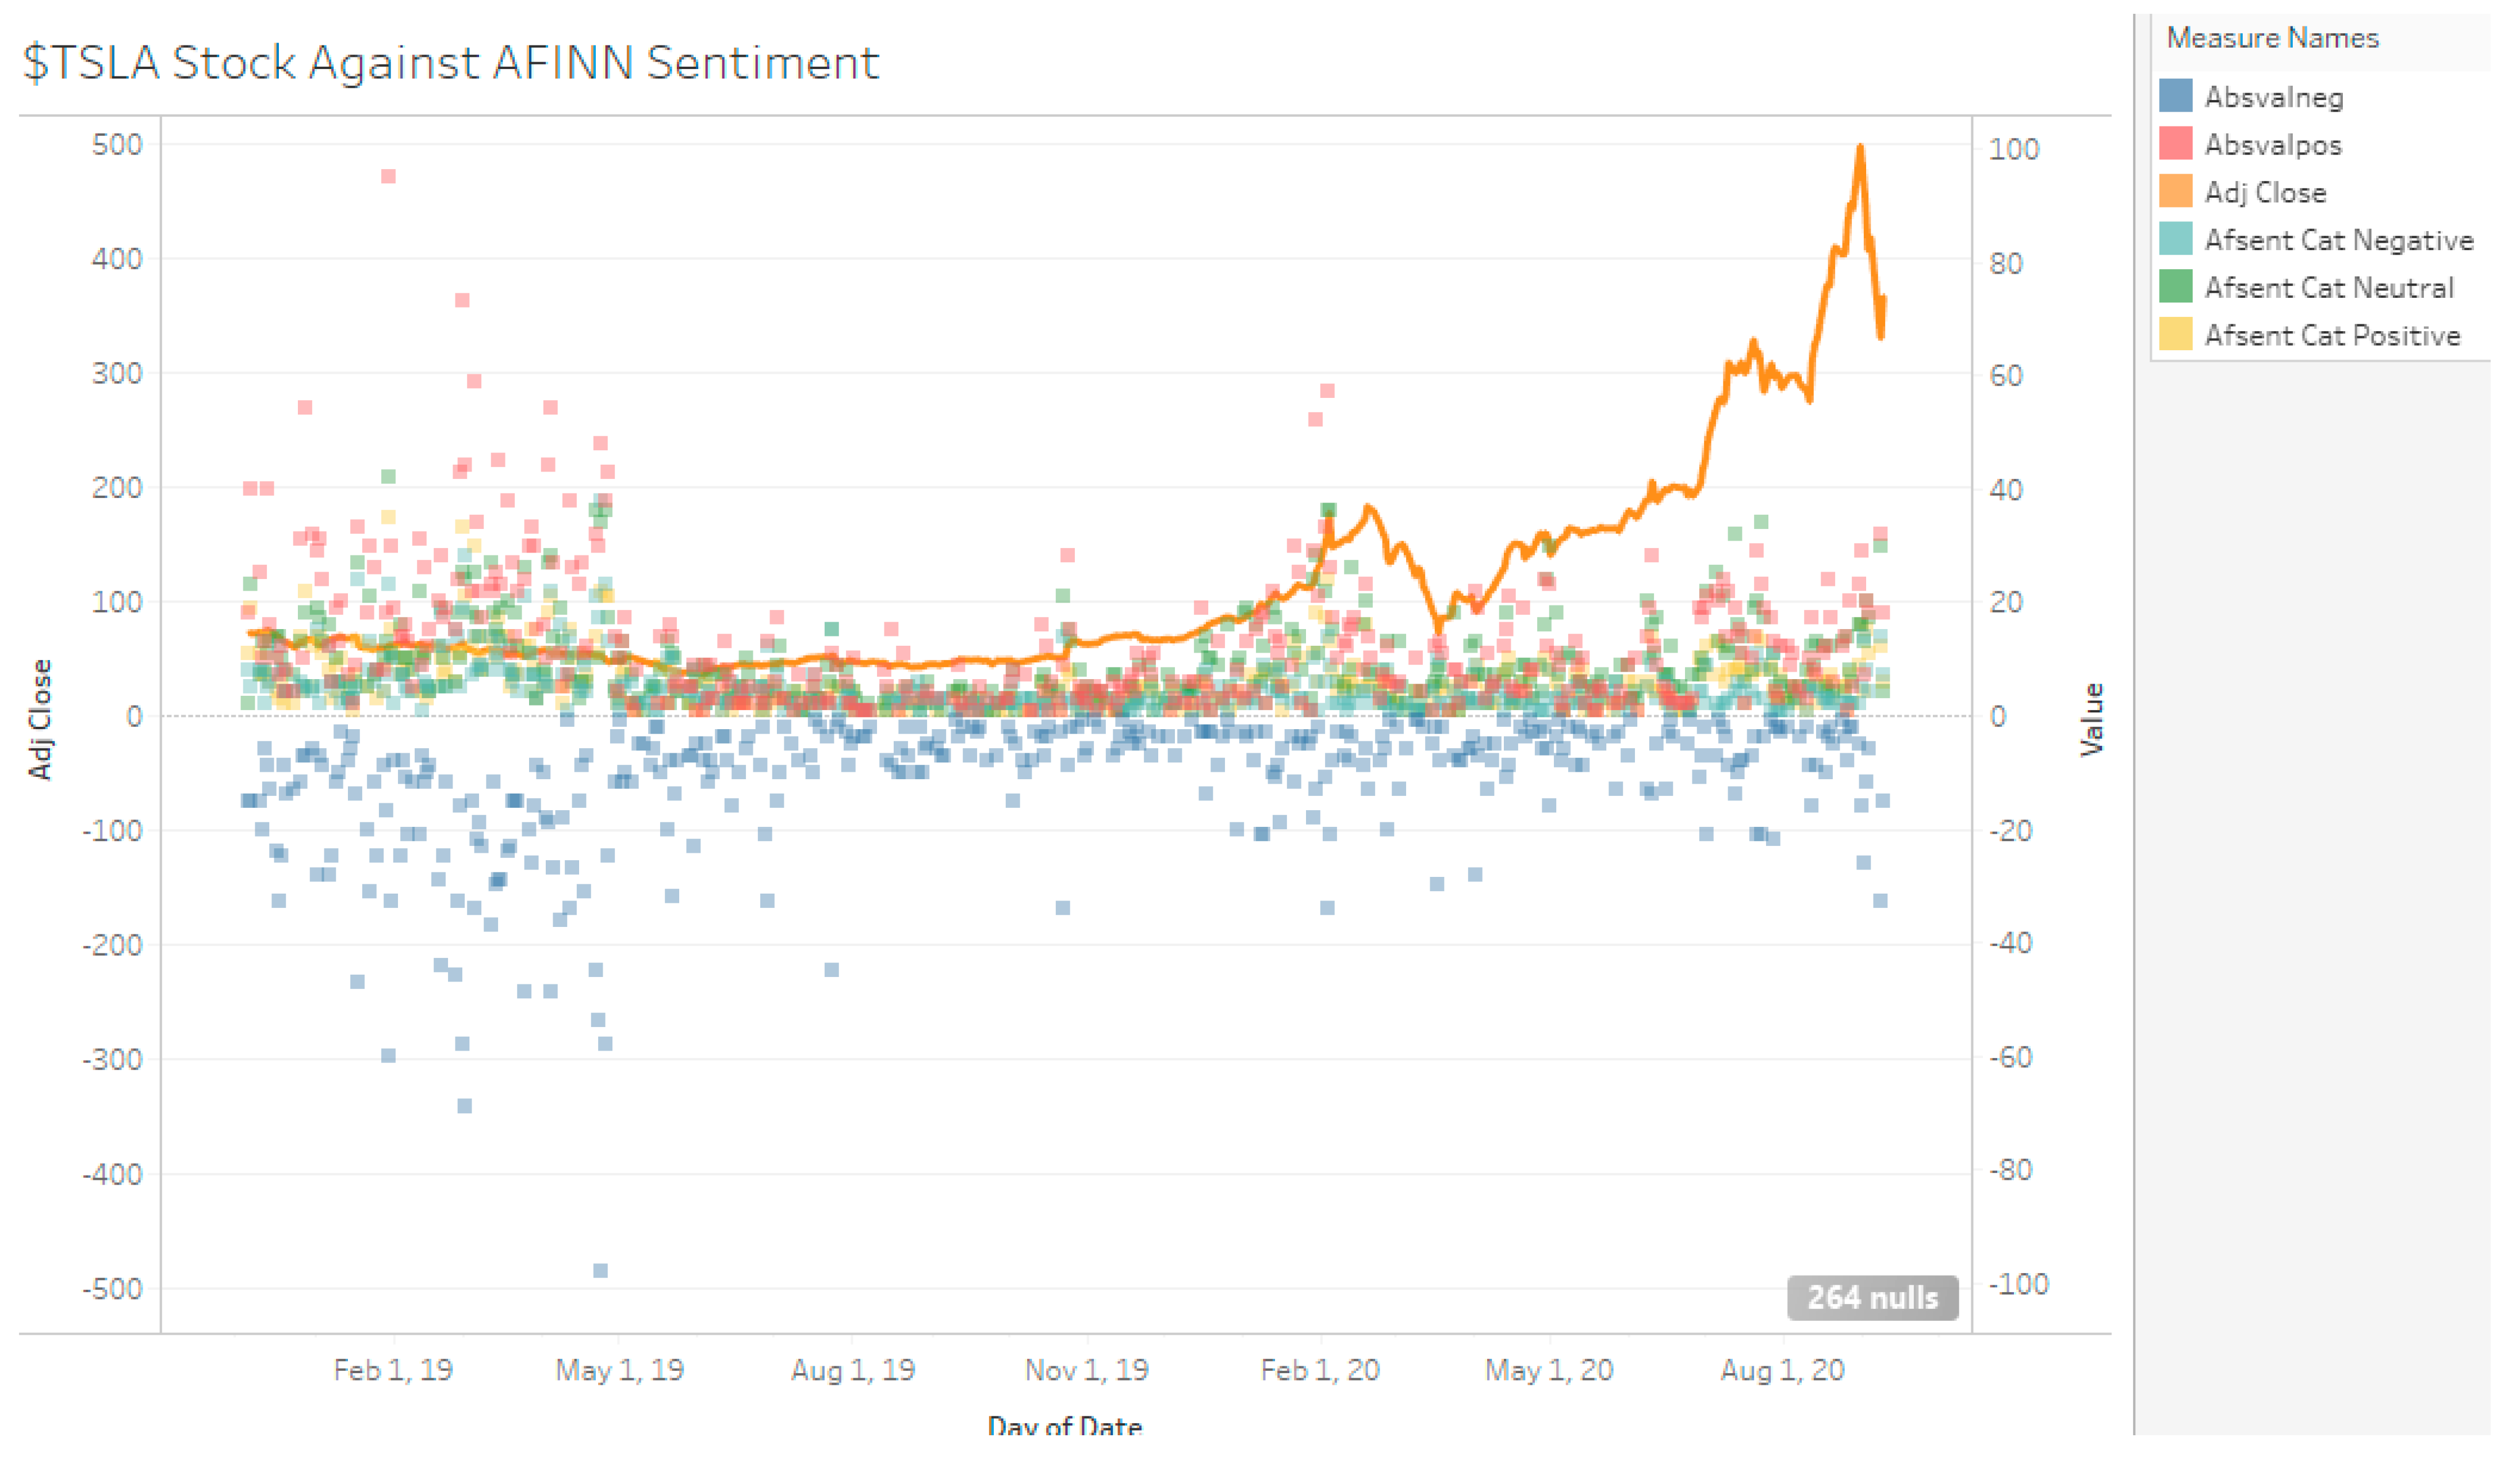
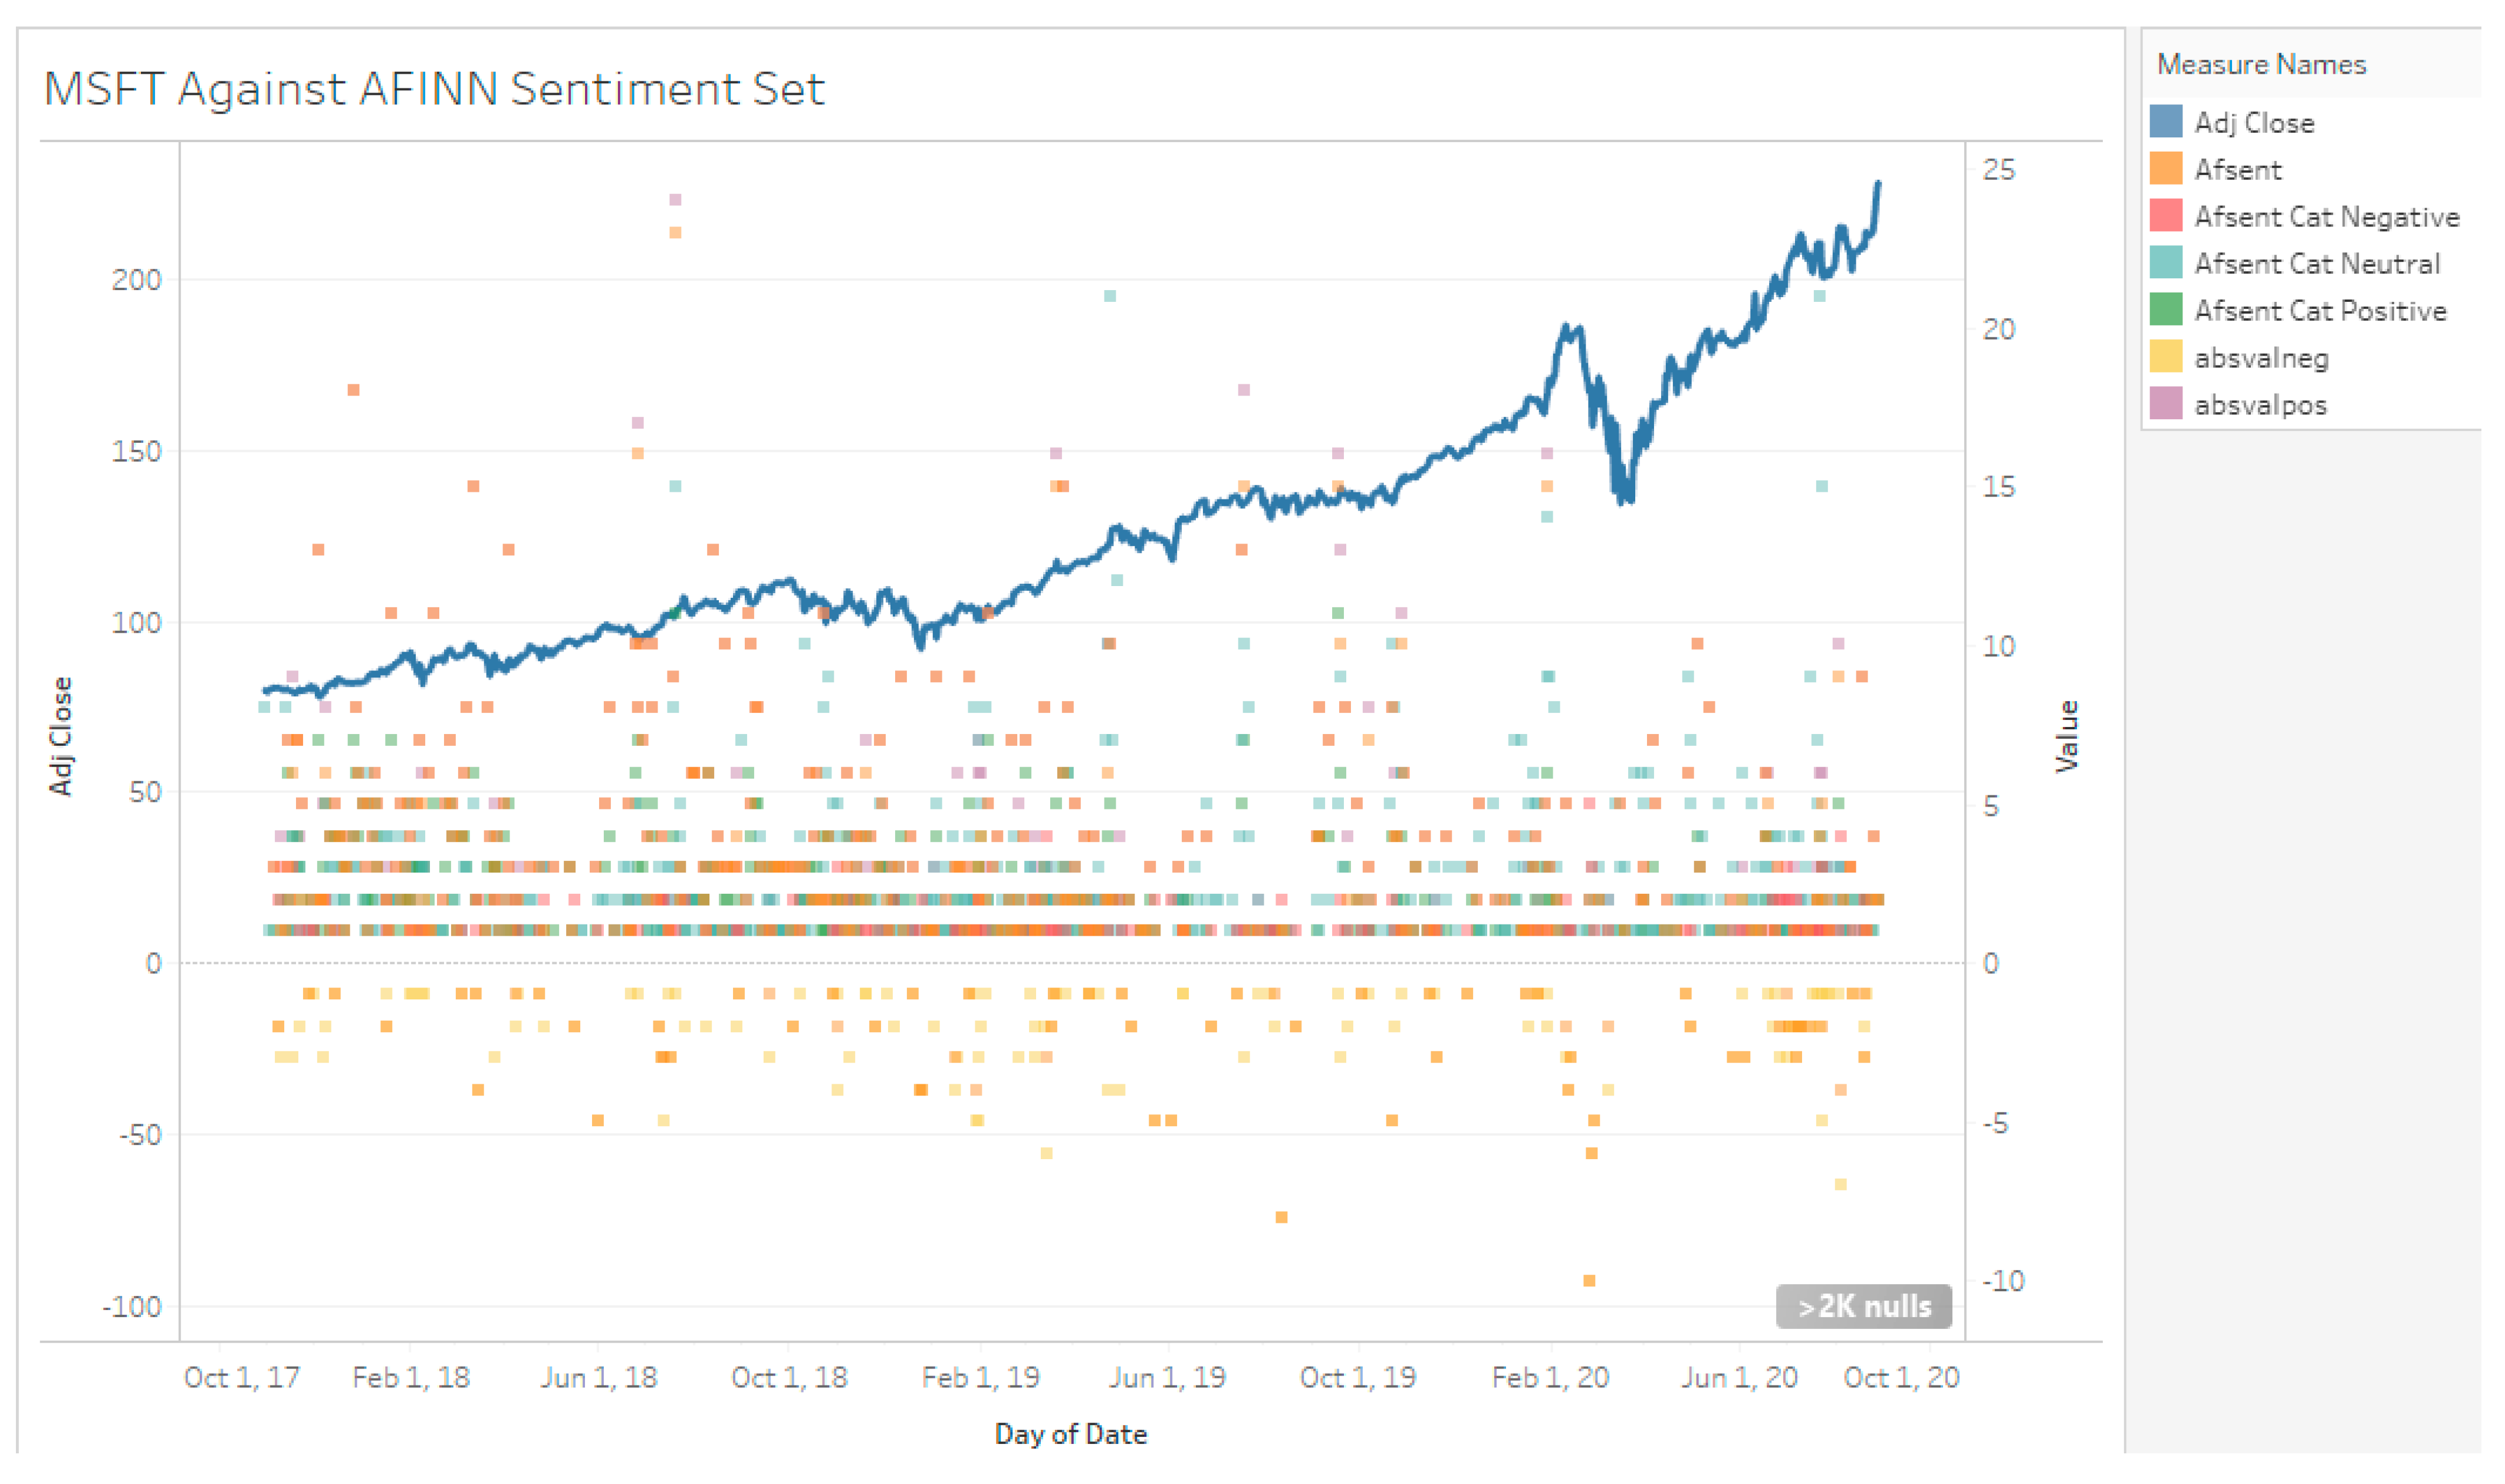
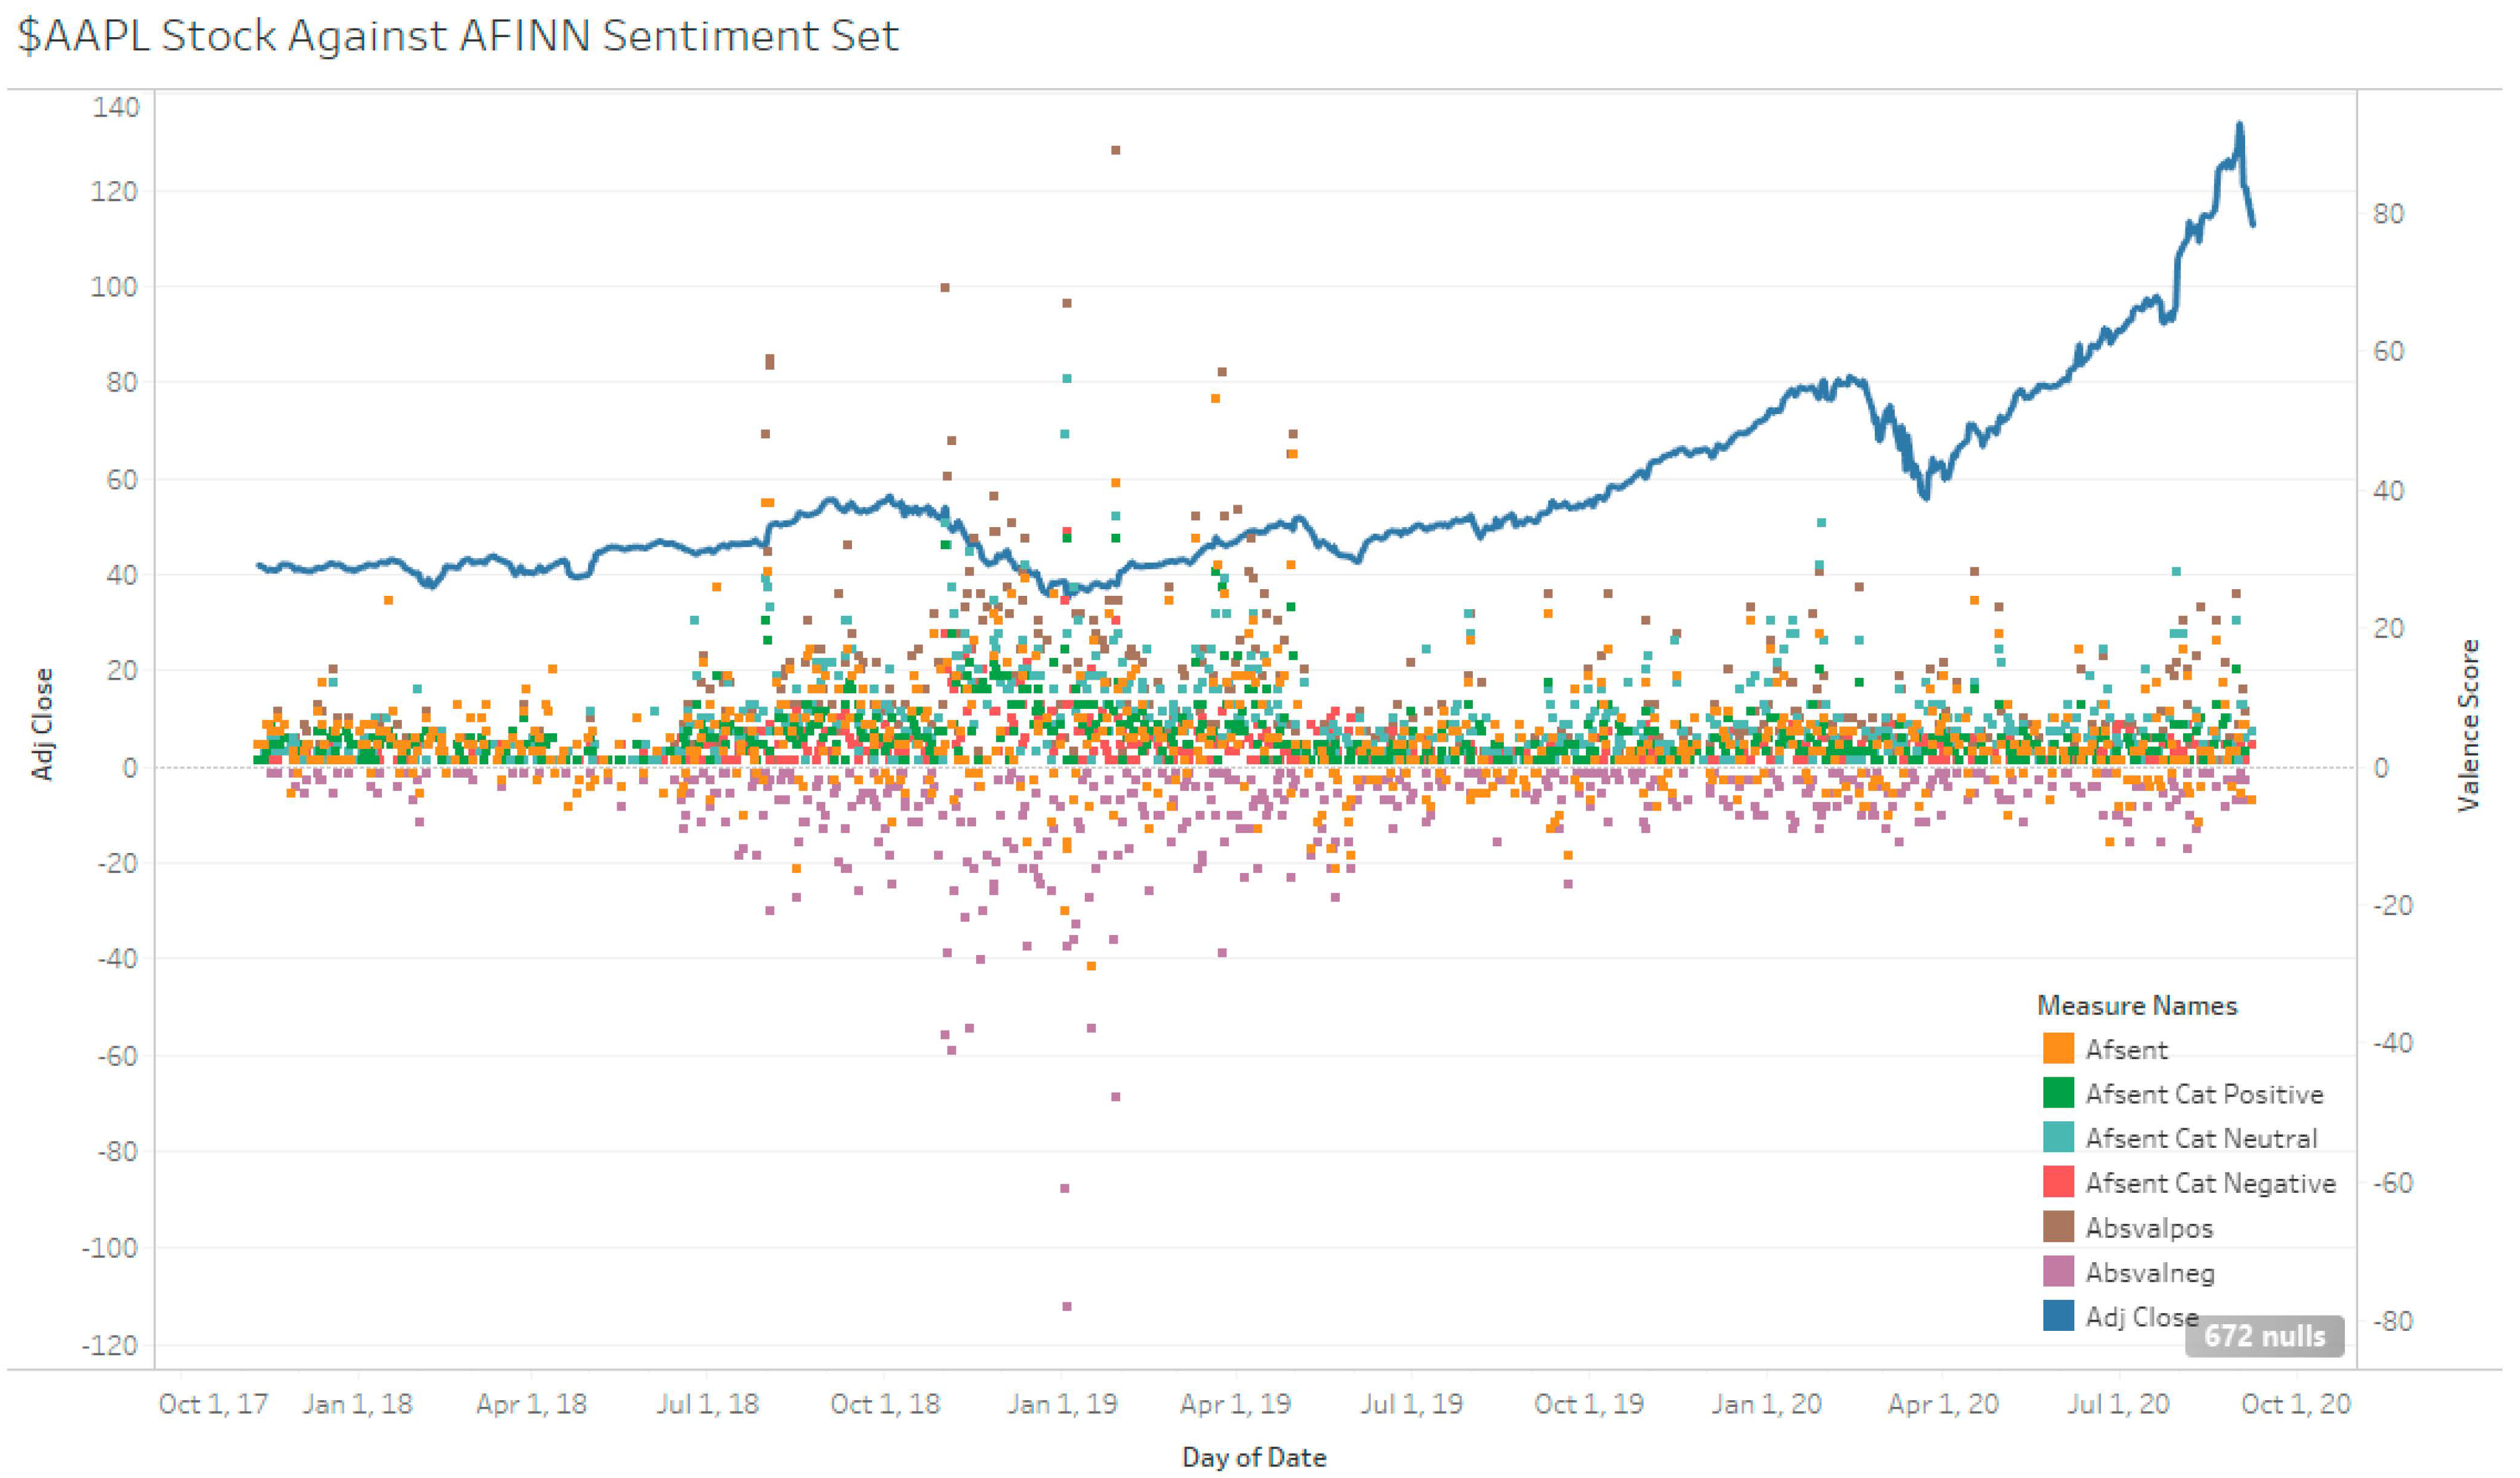
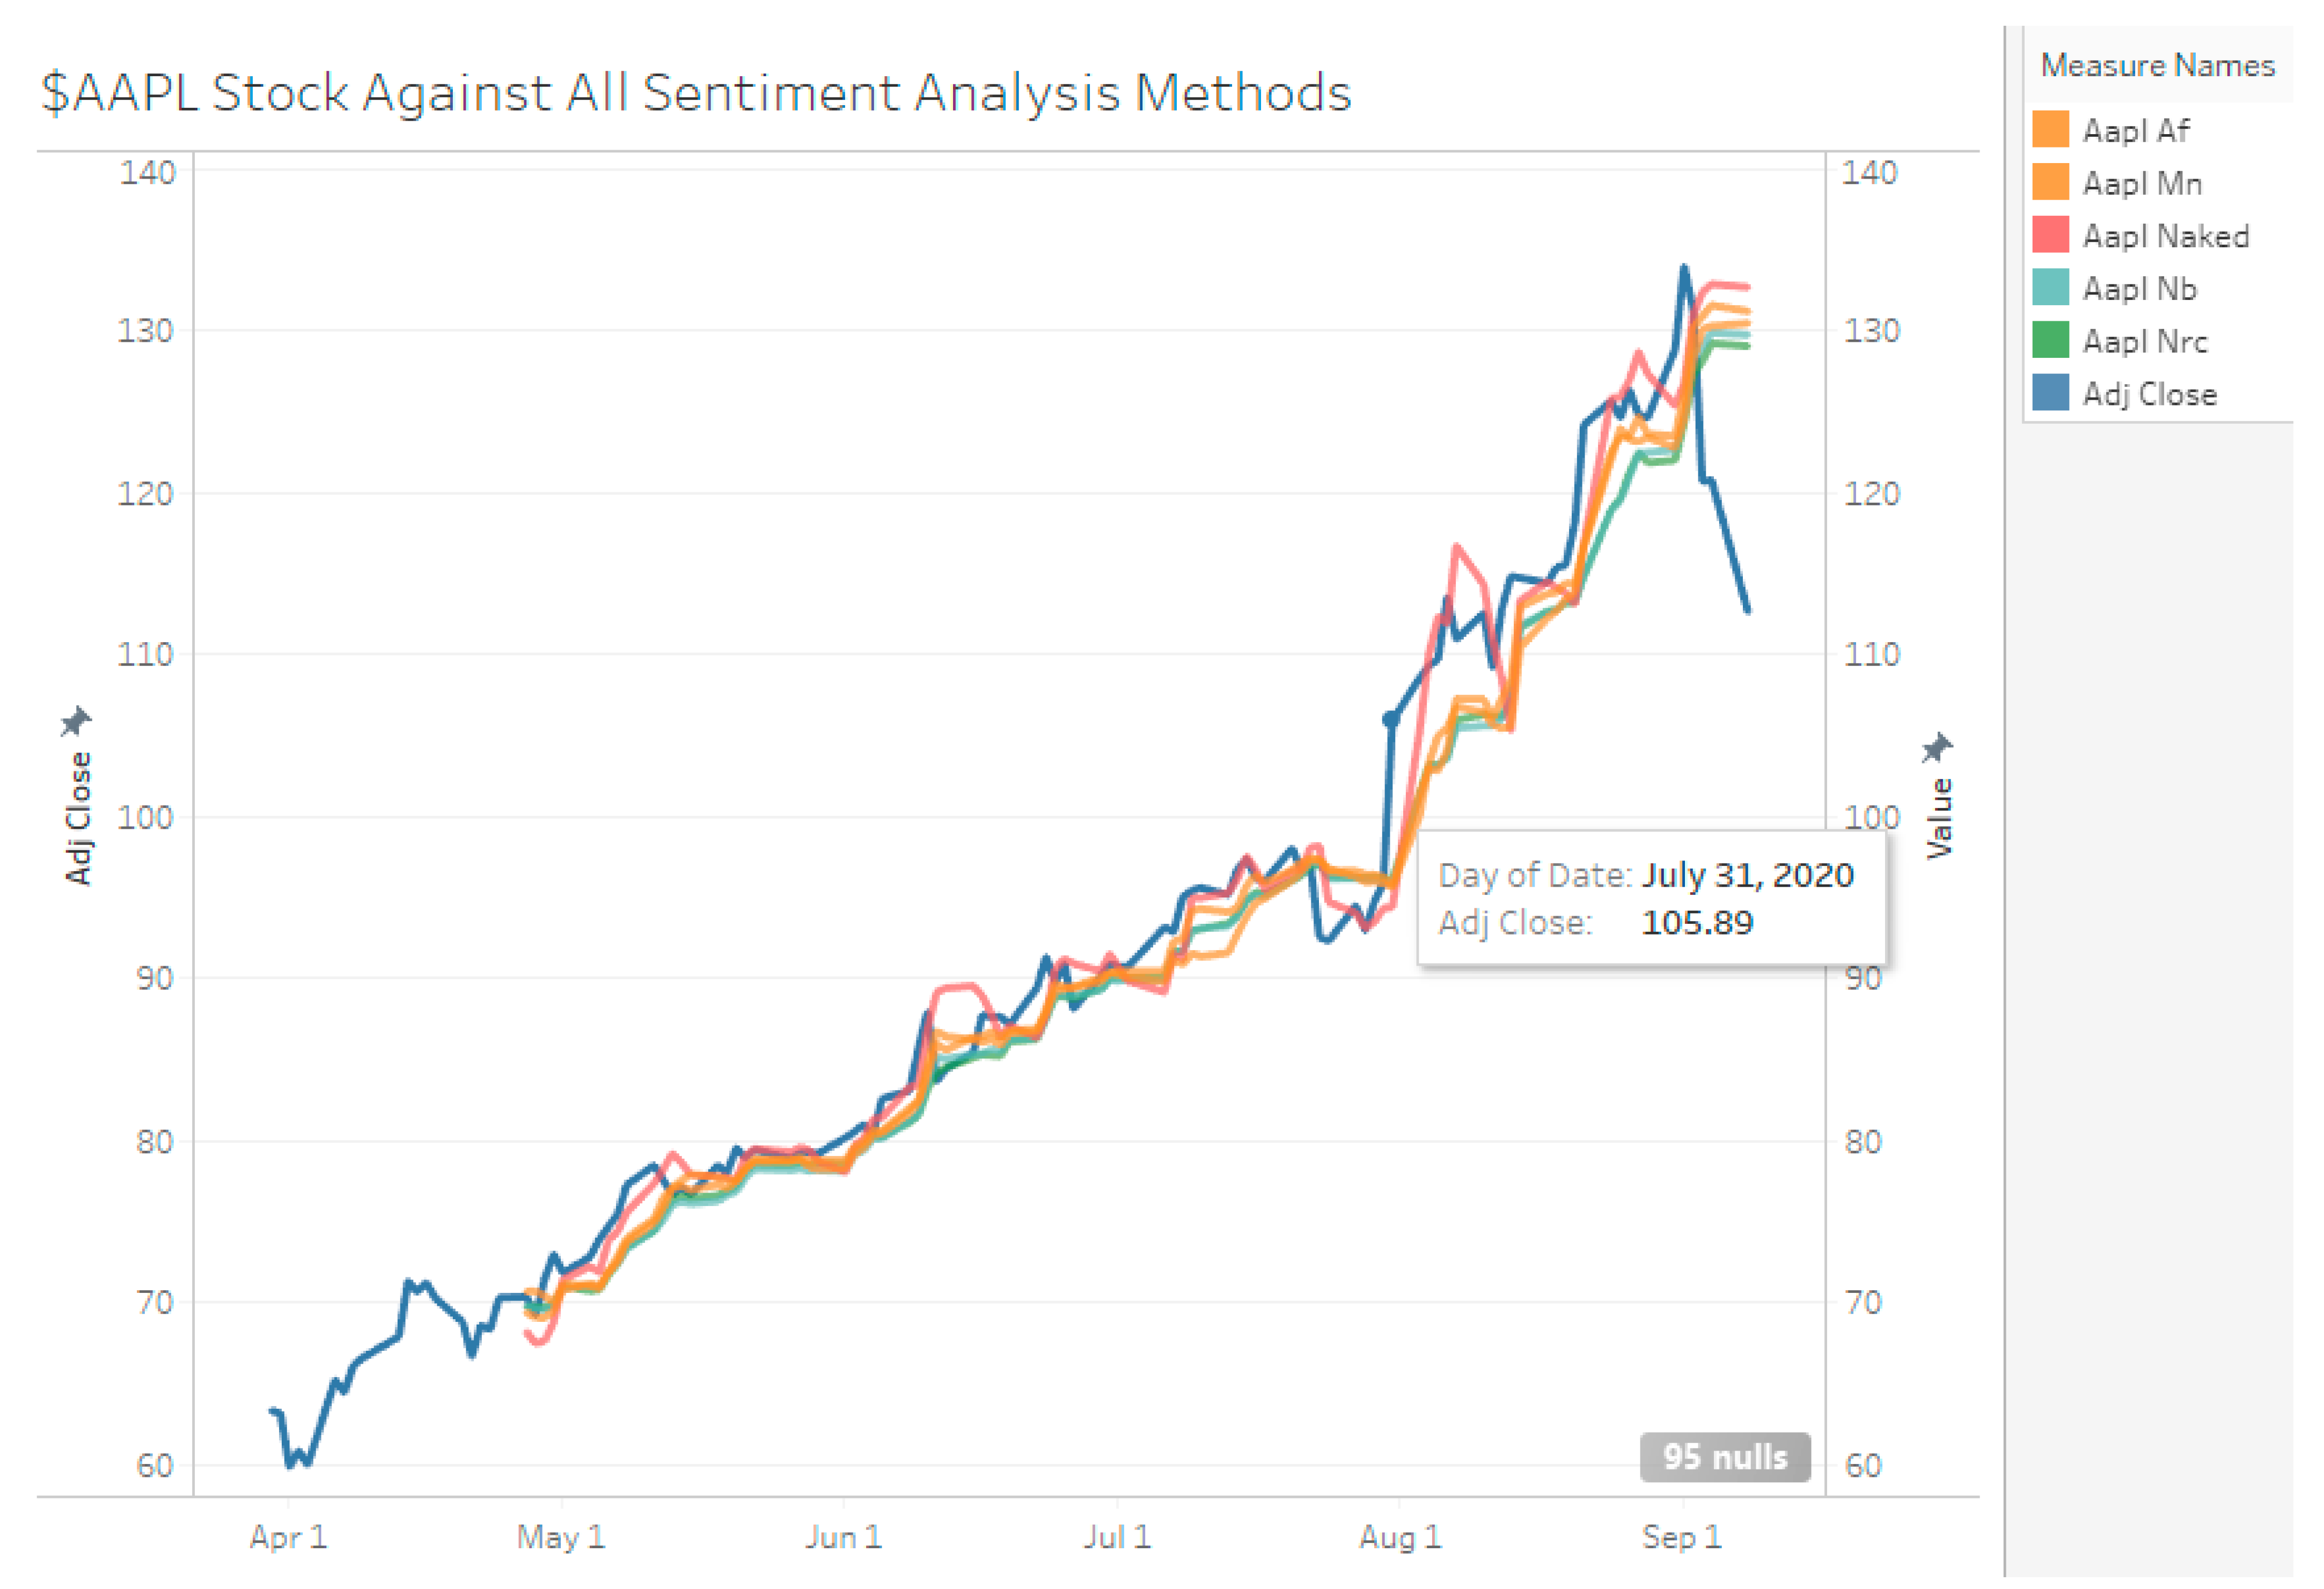
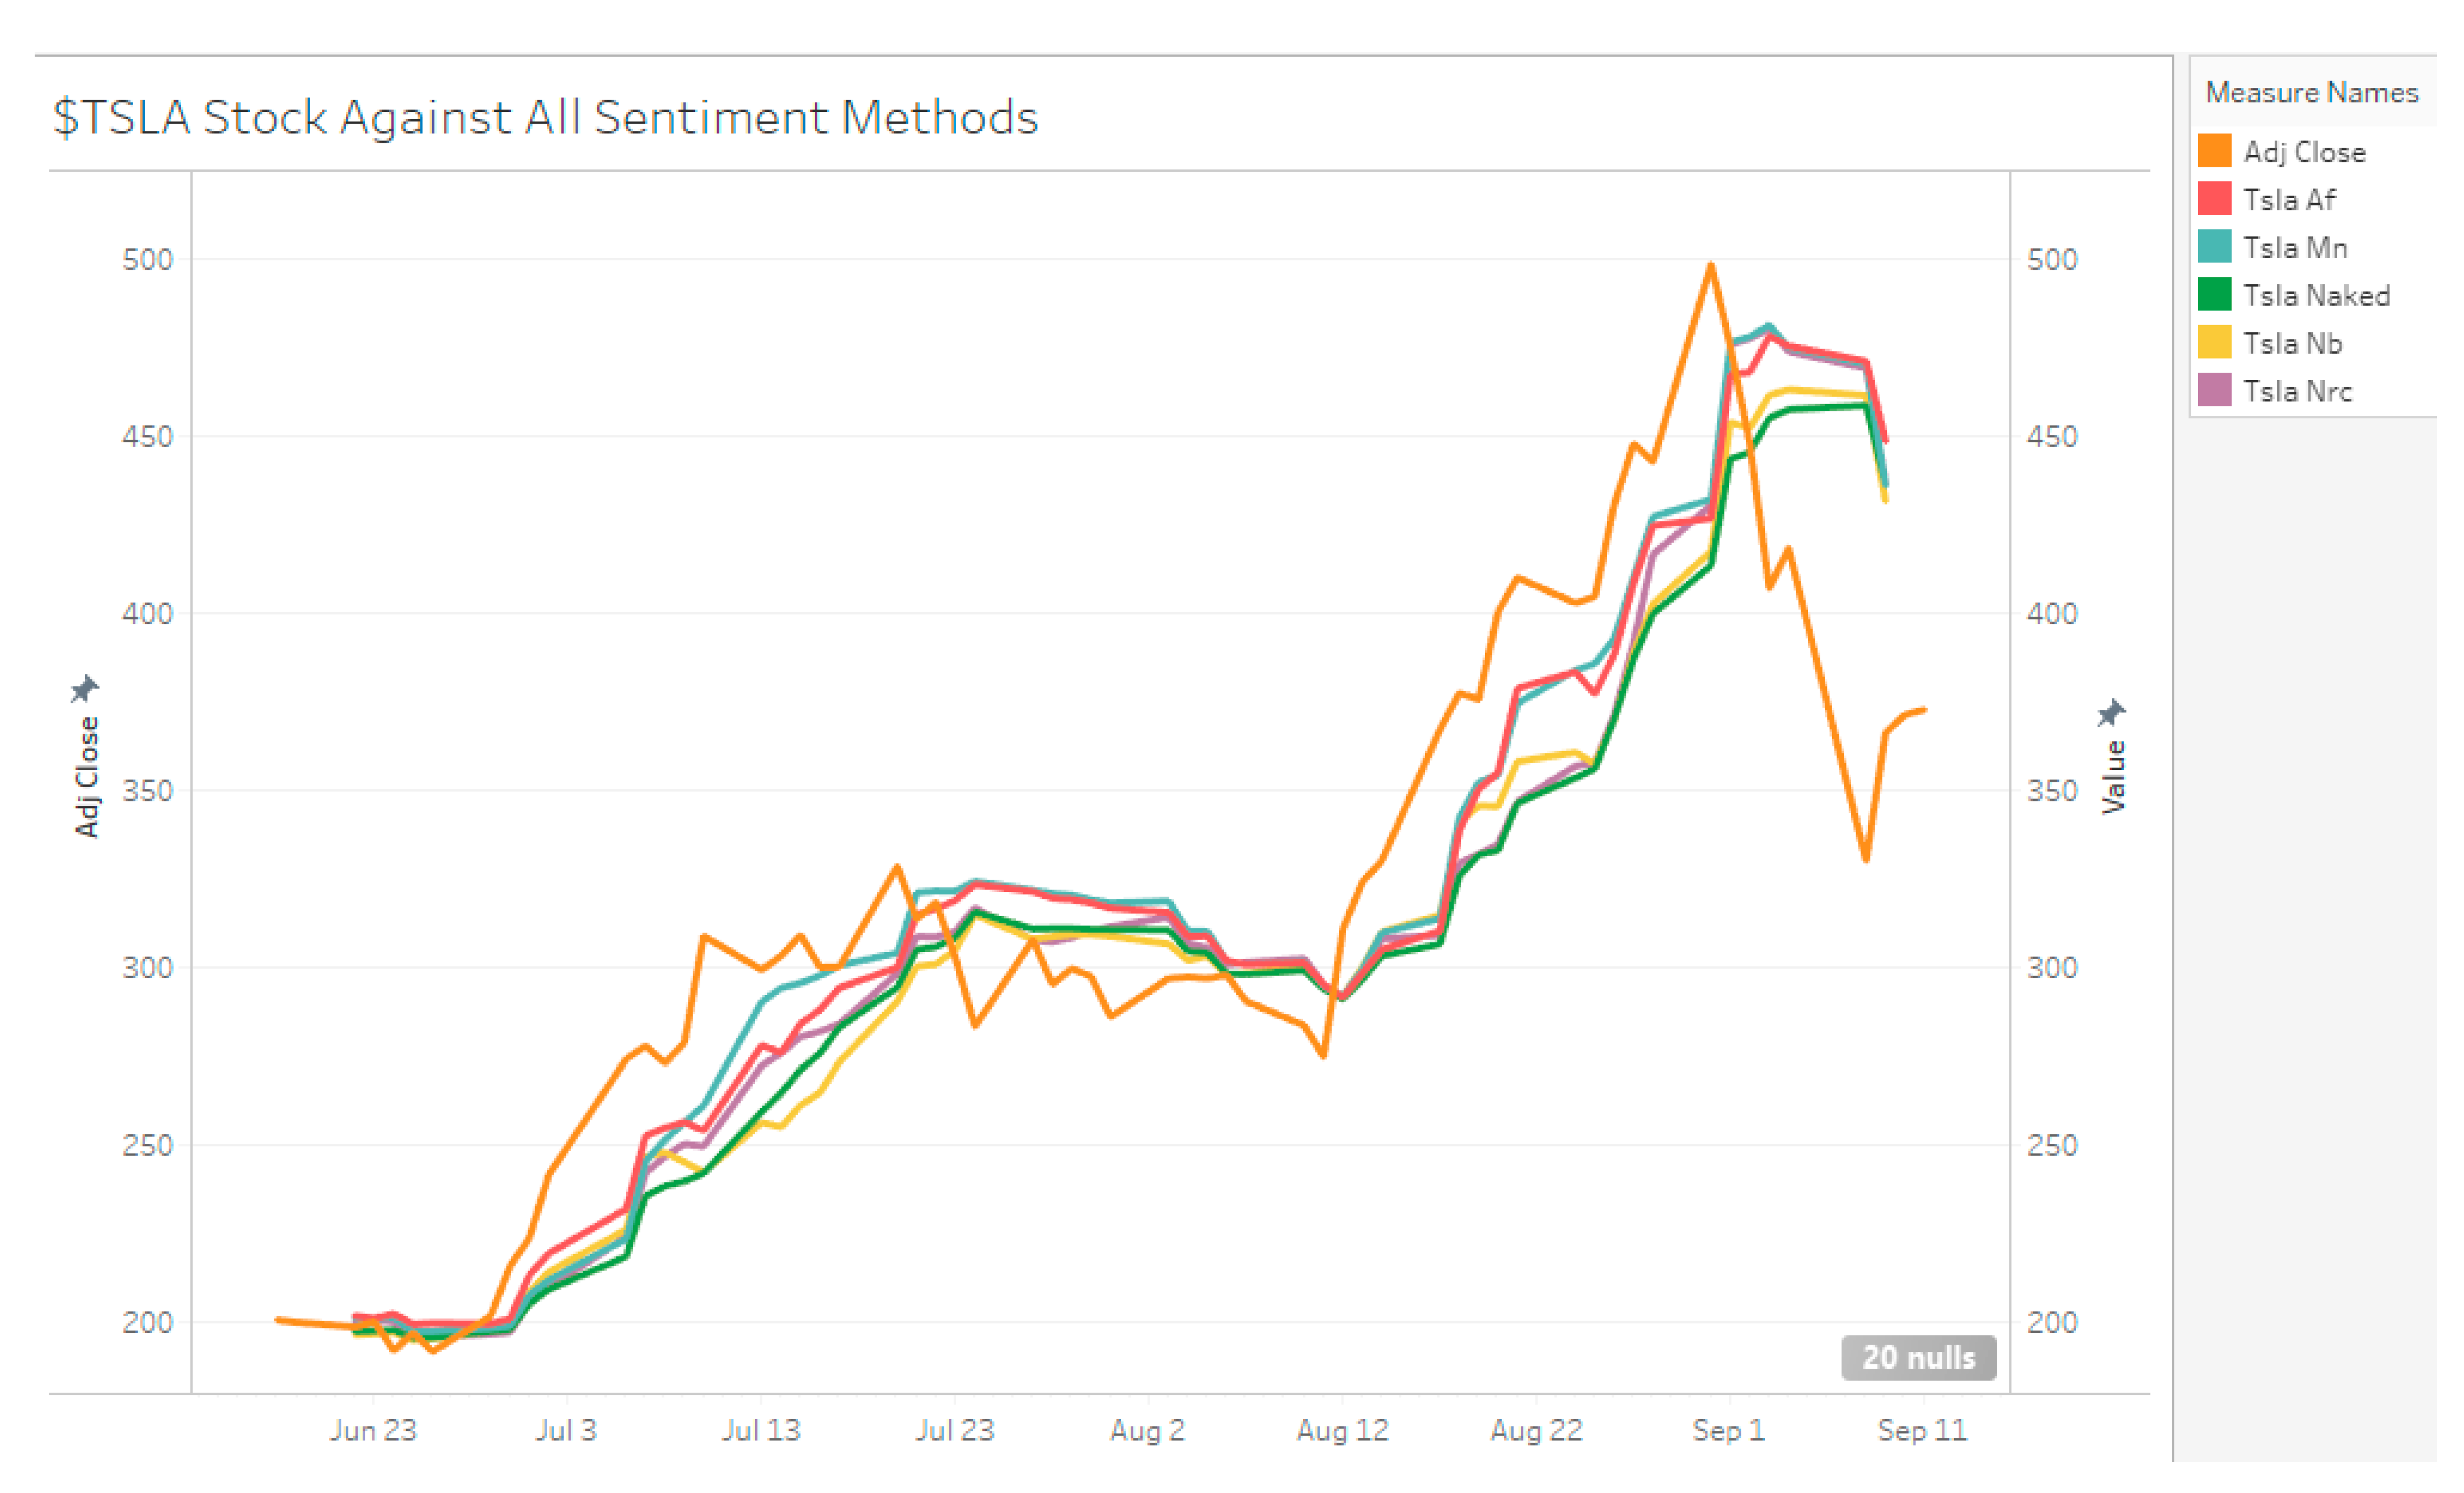
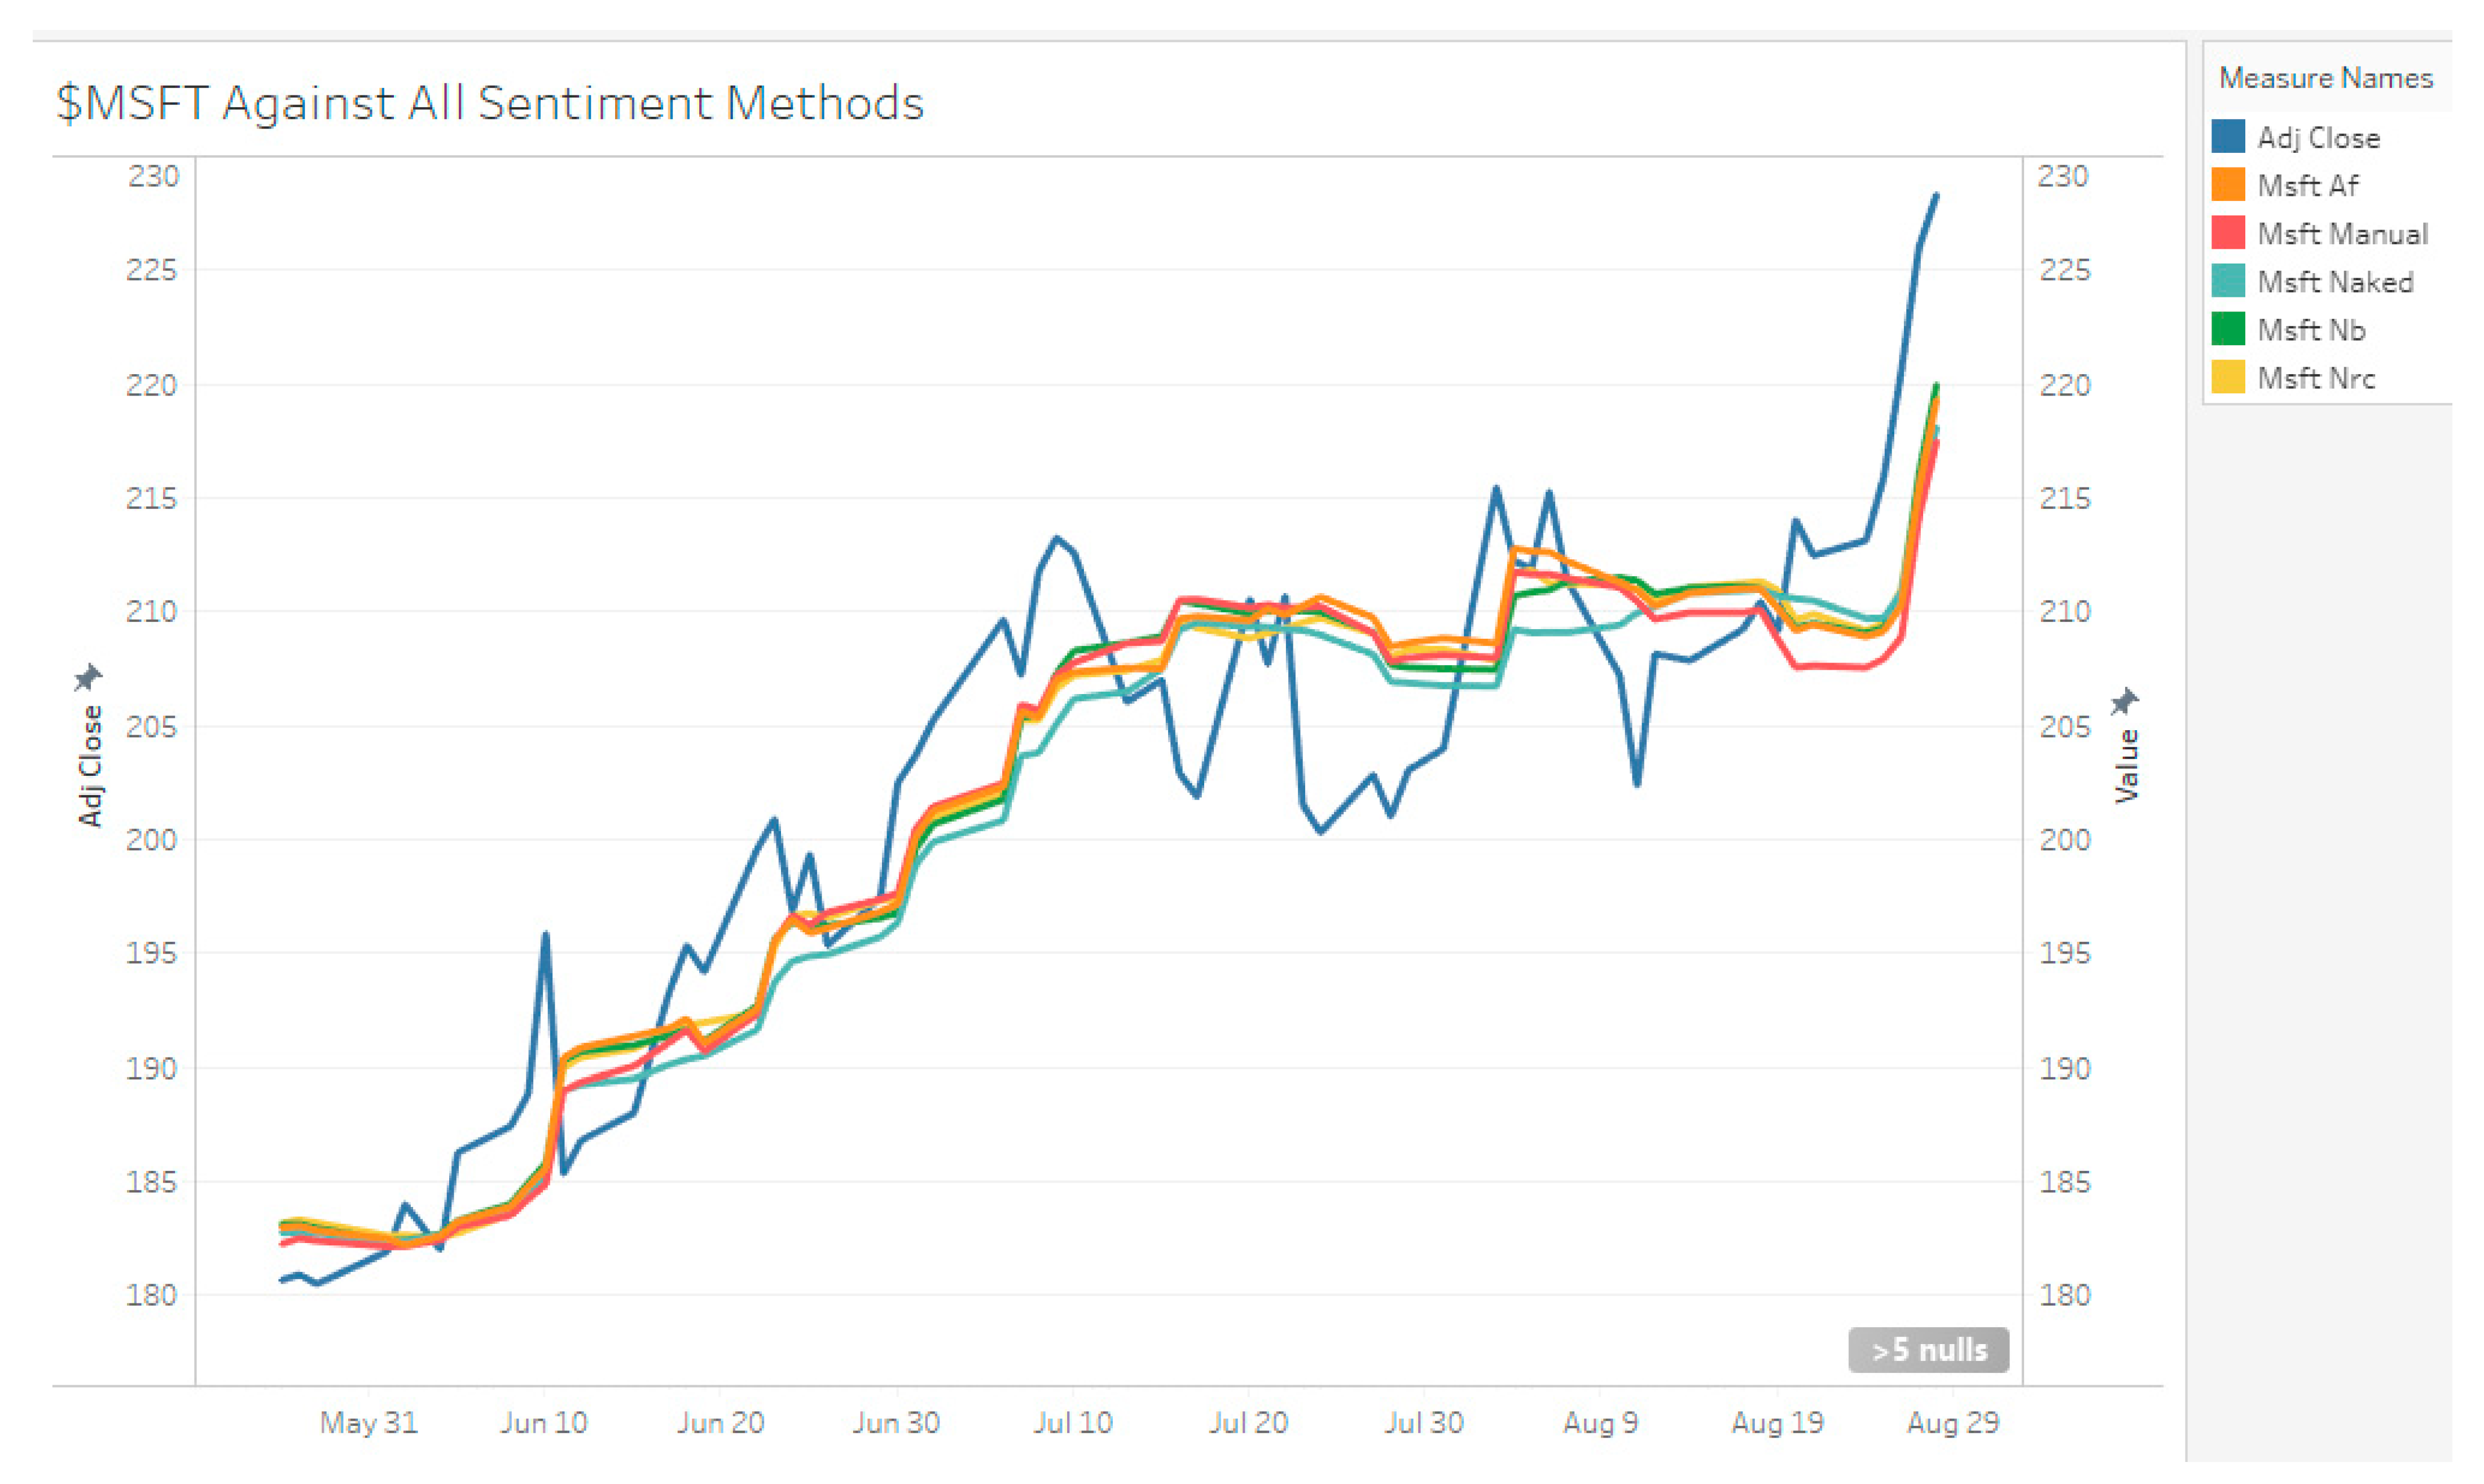
5.3.1. AFINN Sentiment
Across the full sampling duration, TSLA had a net 883 valence score, with 5890 positive valence and −5007 negative valence. MSFT and AAPL had 1210, −326, 1536 and 3643, −3804, 7447, respectively (see
Table 4 and
Figure 6,
Figure 7 and
Figure 8). These valence scores represent magnitude. The sentiment score from the AFINN lexicon was then additionally categorized into a 3-polarity scale: positive, neutral, and negative. This differs from the 2-polarity scale used for the other methods. The sentiment score does not take into account the magnitude of sentiment and is merely a test on how well the lexicon is able to tag a tweet.
5.3.2. NRC Sentiment
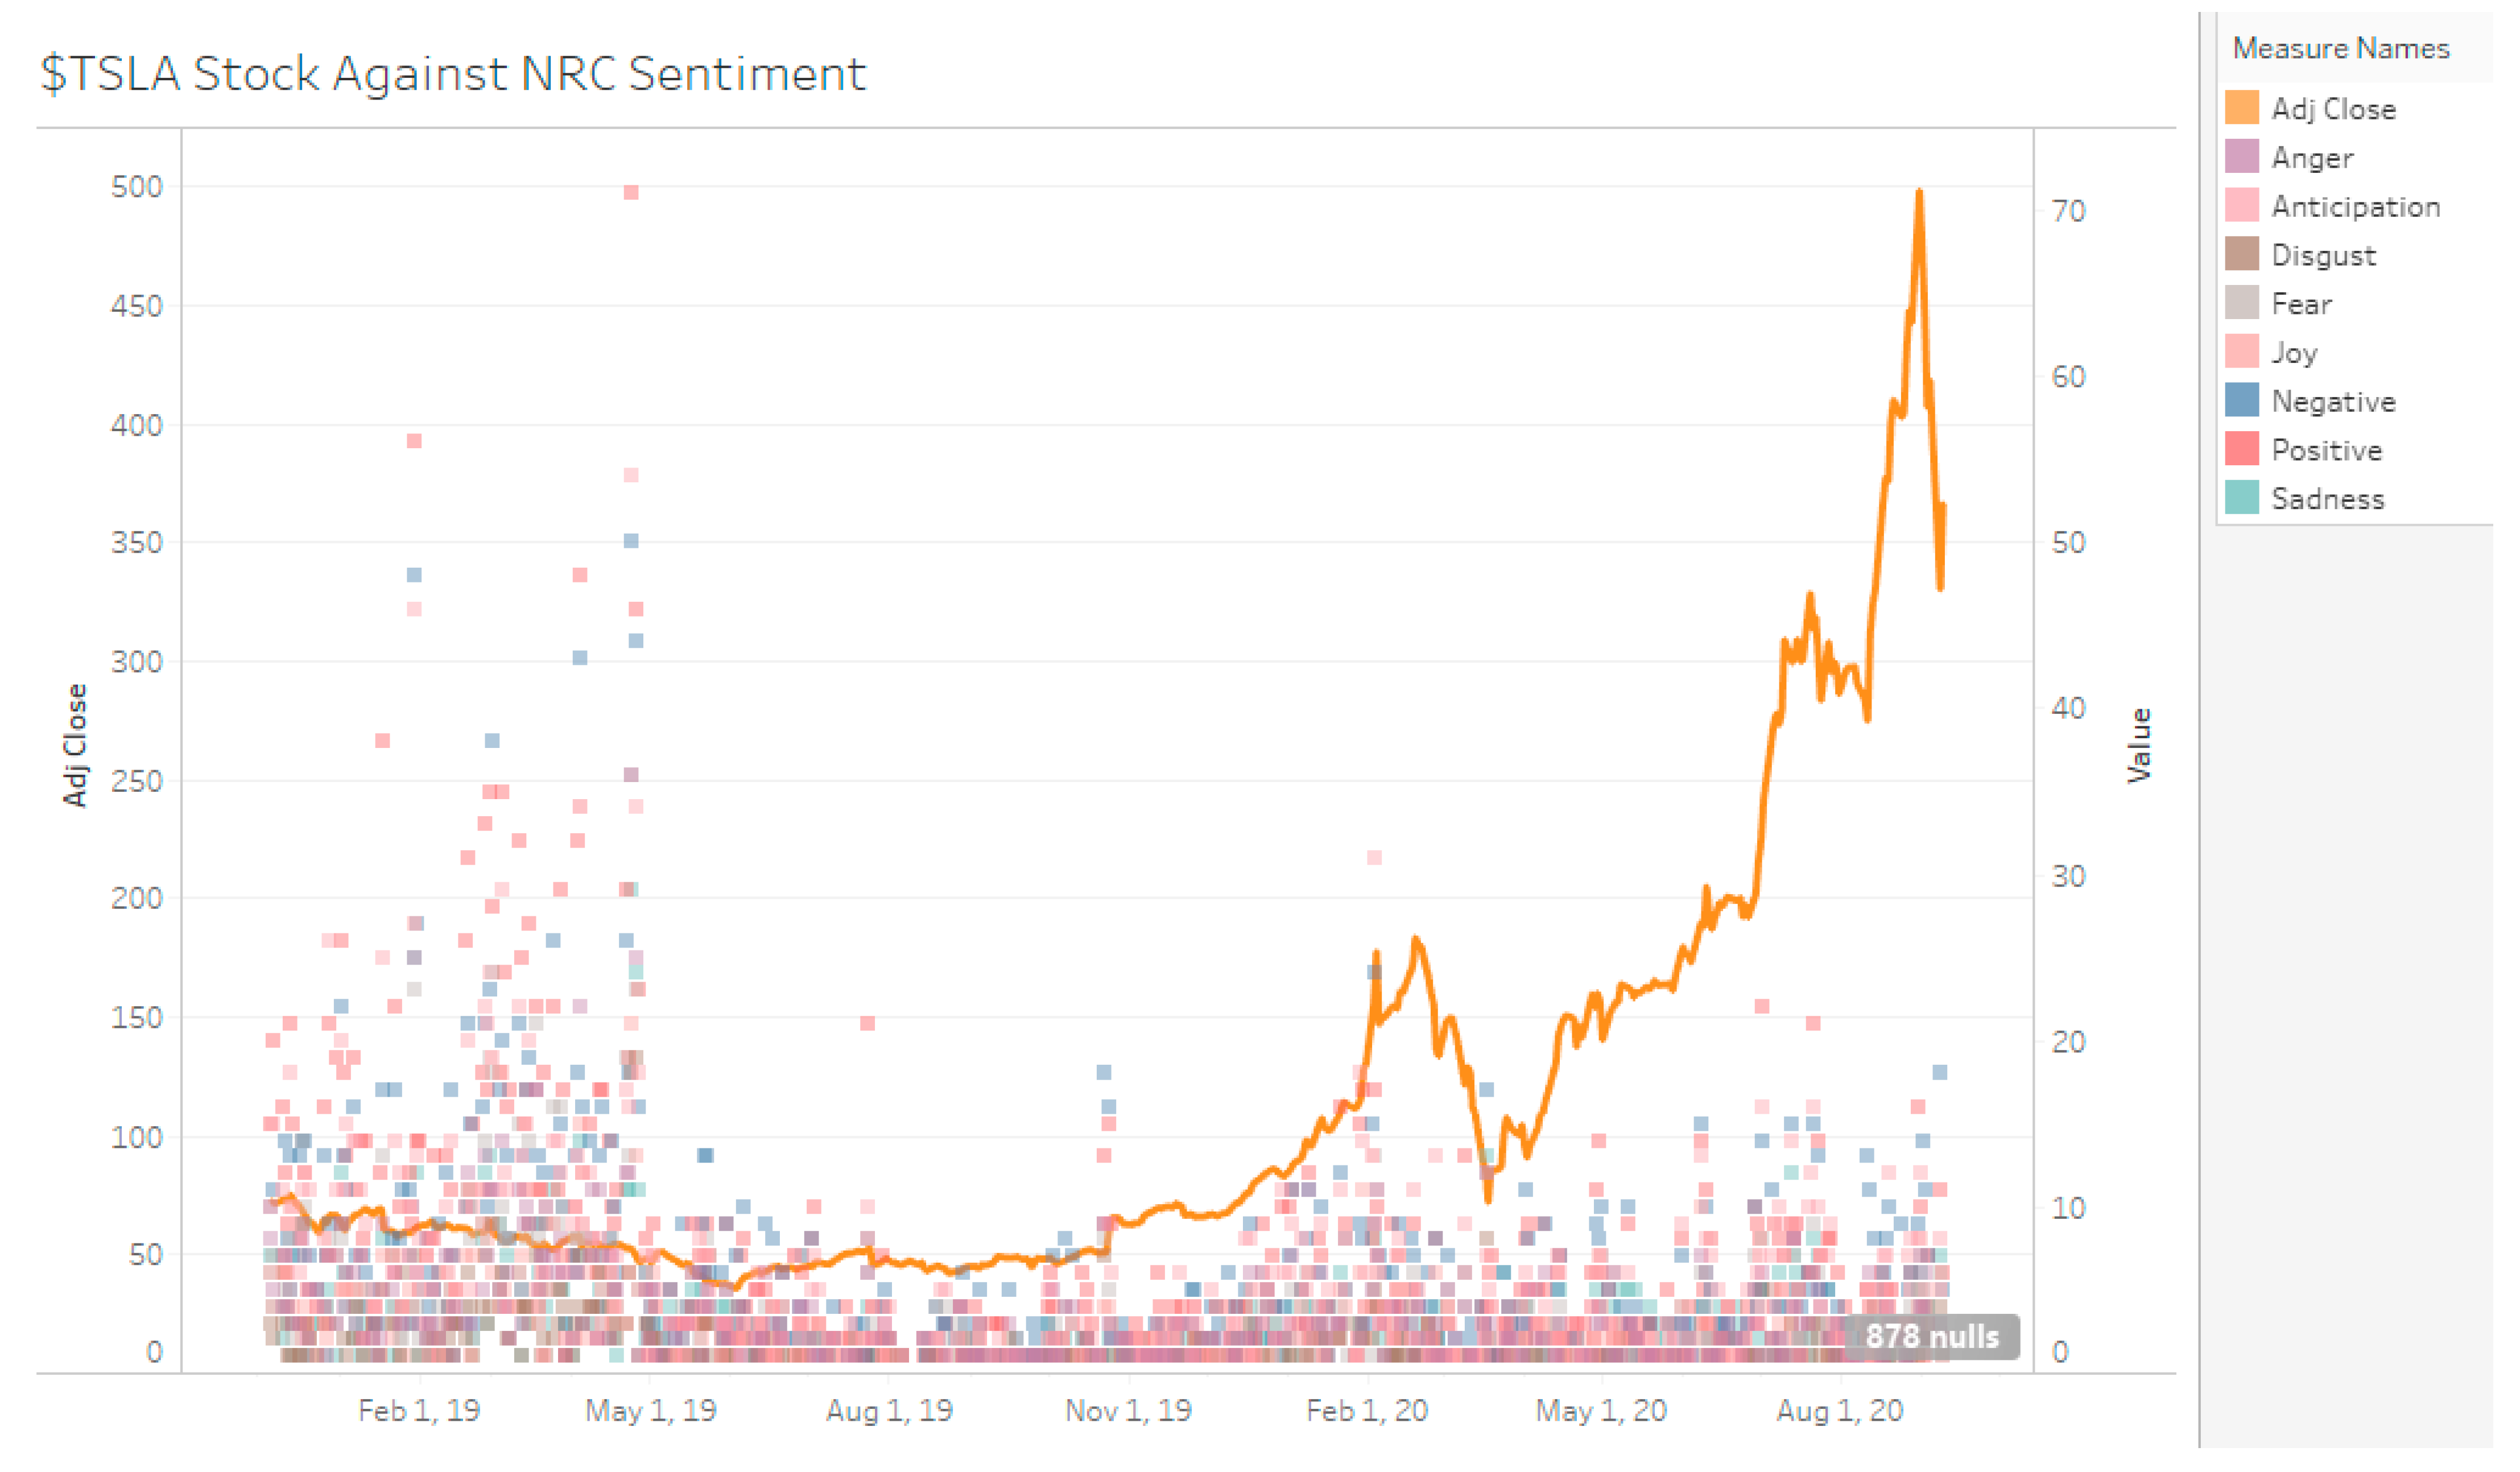
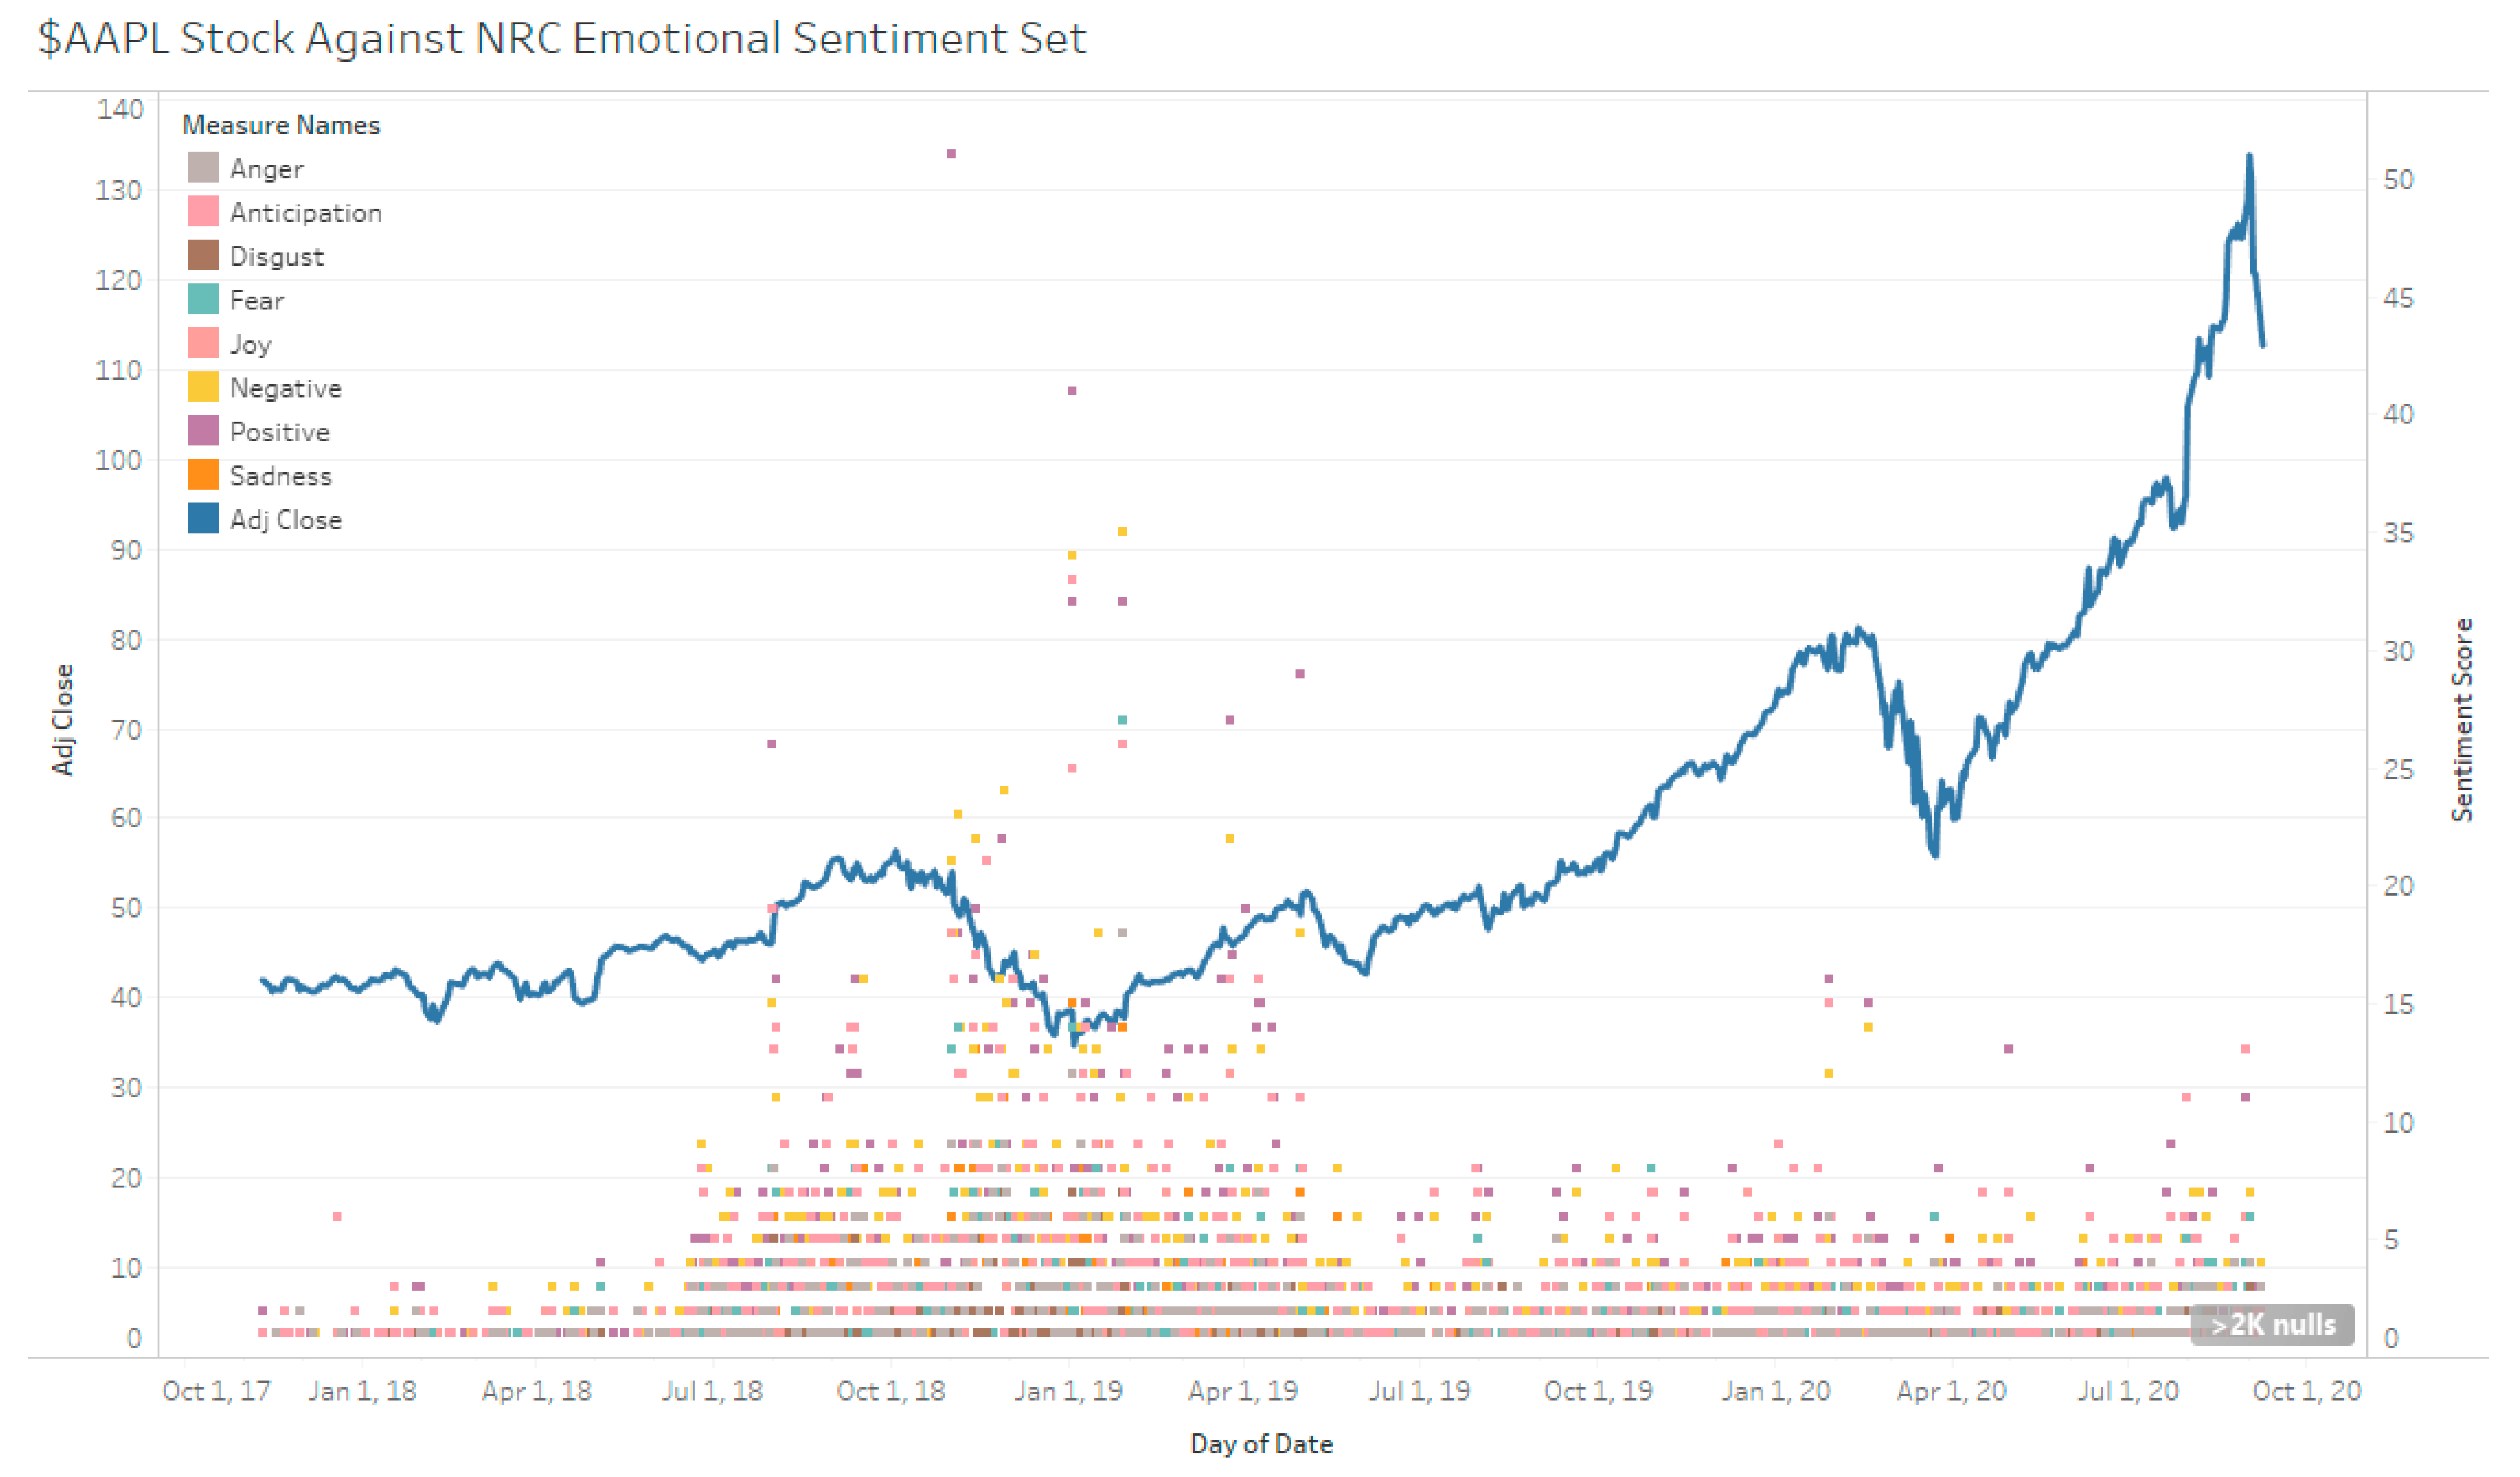
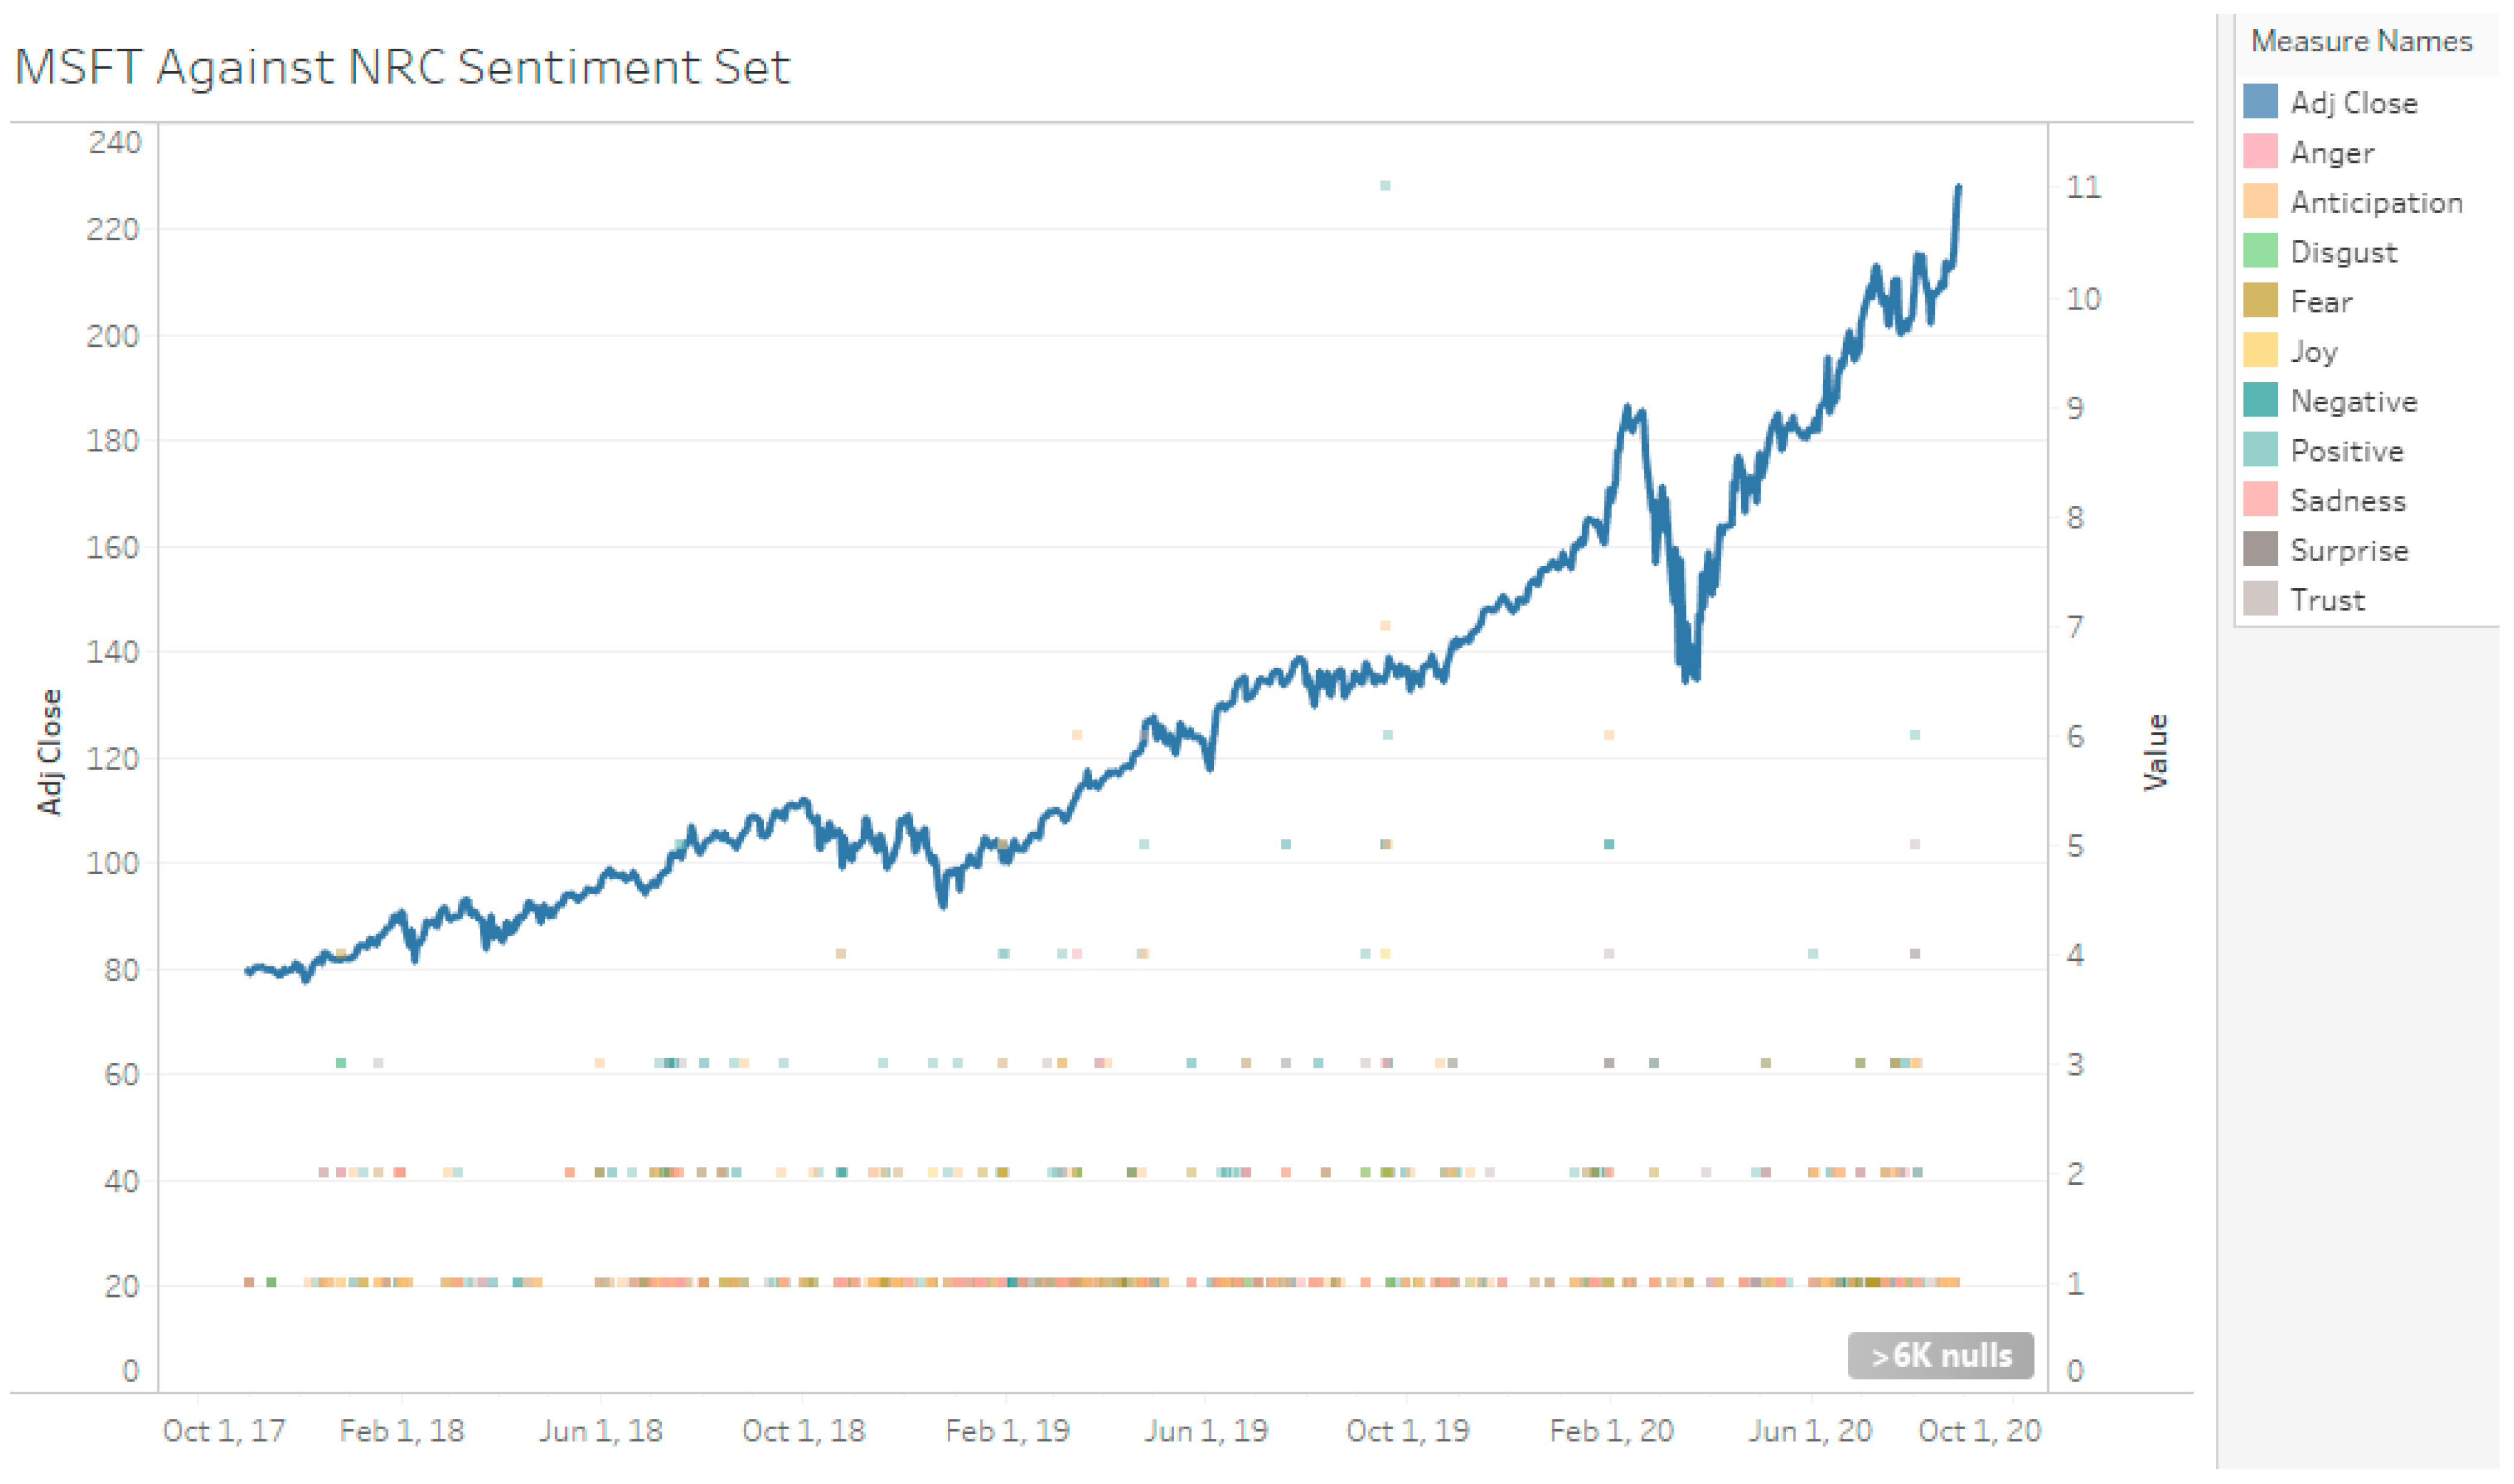
The NRC lexicon can attribute words to human emotions and to sentiment polarity. However, the negative and positive sentiment identification is more than AFINN (see
Figure 9,
Figure 10 and
Figure 11). This is expected since NRC is a much larger lexicon than AFINN (see
Table 5). However, since the manual sentiment set does not factor in neutral sentiment, the identifications by both lexicons cannot be compared.
5.3.3. Equivalency of Neutral Sentiment: 0 or Null
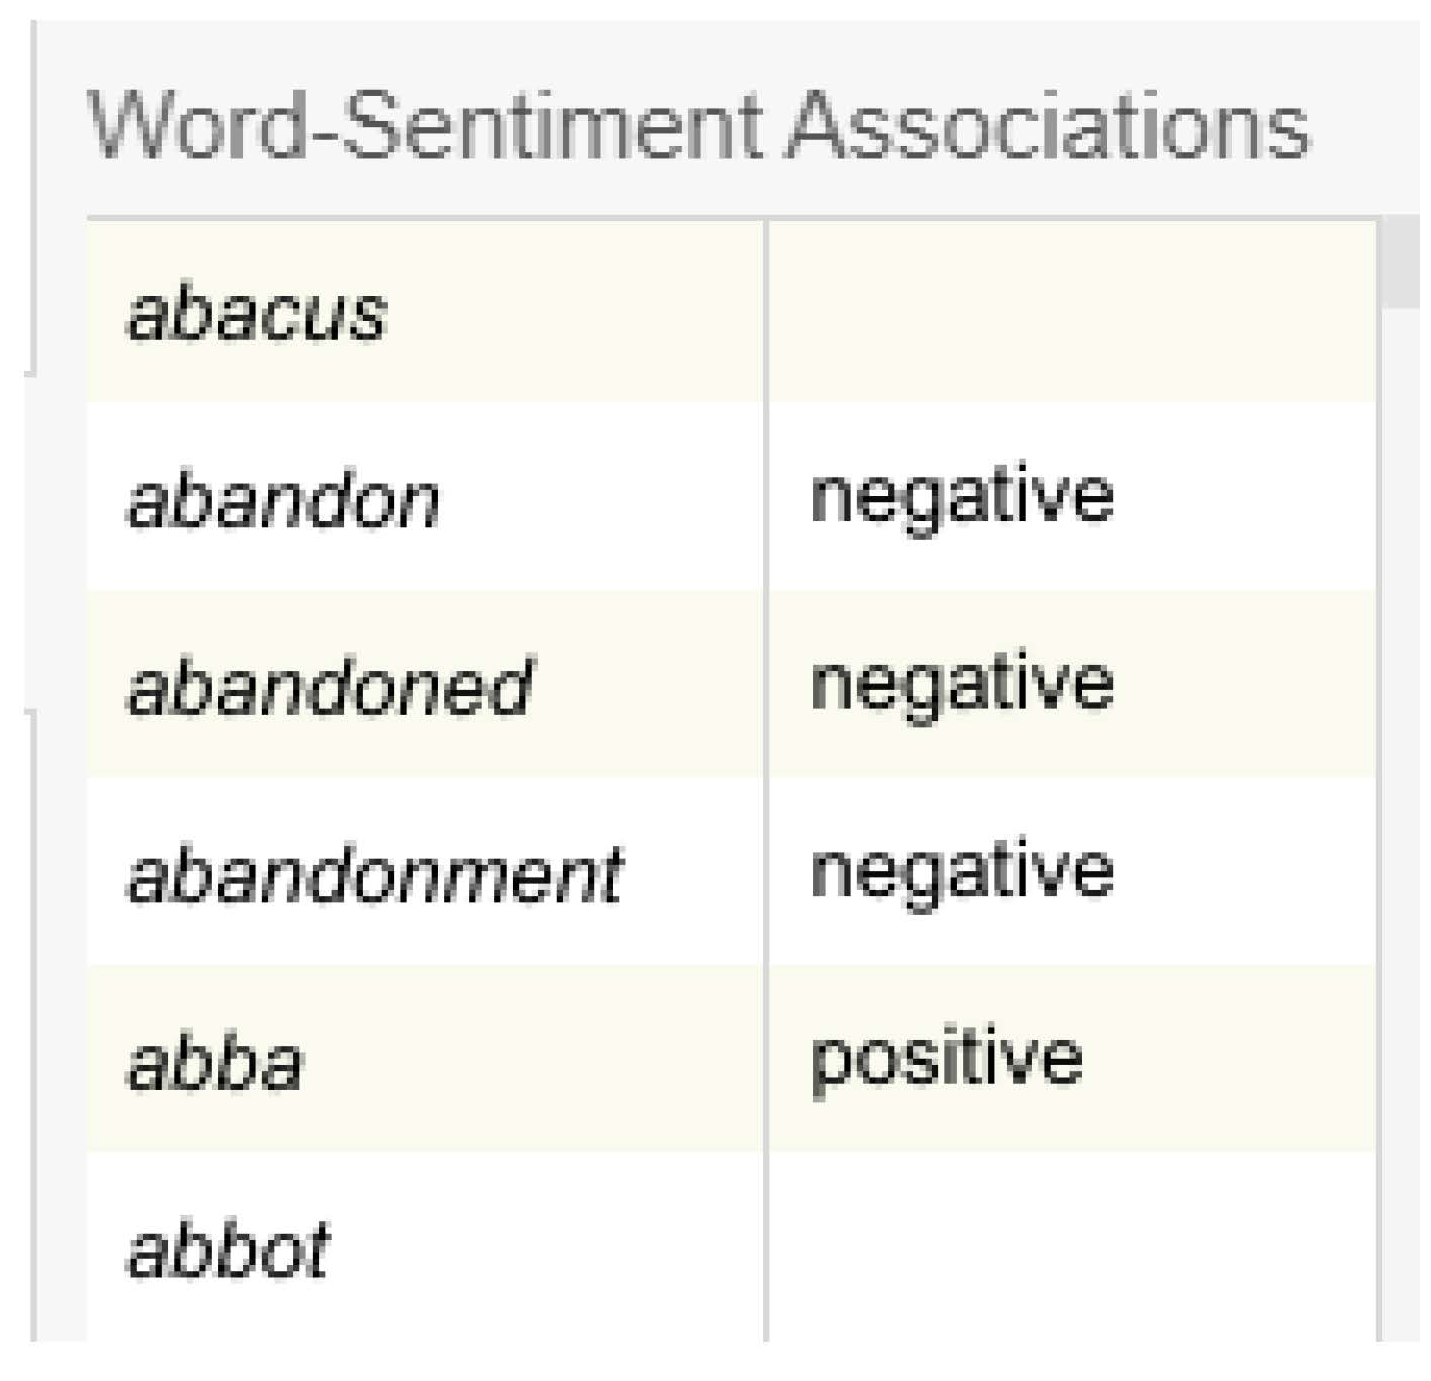
Lexical methods detect words by association. Both the lexicons used have no association to neutral sentiments. This mean that whether the lexicon fails to identify or successfully identifies a word as neutral, the result of the association for a neutral word is the same: it will be 0. Because of this, it cannot be ascertained whether a neutral sentiment is truly a neutral sentiment or a failure of the lexicon as the associated words are not in the dictionary (see
Figure 12). One method to overcome this is to utilize the SentiStrength approach [
42]. This is because SentiStrength does not have a 0 score. Instead, neutral terms have their own scale and a score of 0 will confirm failure to detect. NRC consists of 14,182 words while AFINN consists of 2477 words. For this study, both NRC and AFINN are assumed to be comprehensive and 0 values are regarded as neutral instead of failure to detect.
5.4. Results of Machine Learning Sentiment Analysis Classification
5.4.1. Minimization of Test-Train Contamination
The classification results can be summarized by
Table 6. All tweets from all stocks are merged to form a corpus, referred to as the full corpus. The full corpus results are trained using a 7:3 training-test split and the results are based on prediction on the test set. For the individual stocks, however, the model is trained on the full corpus, but by using a 3:7 split, using 30% of the full corpus to predict 100% of the individual stock’s tweet dataset. The rationale of this step is to not have the same model trained each time a stock needs to be analysed. Instead, the sum of the tweets is treated as a corpus and will help to normalize the model across a more general corpus. This is compared to having a highly specific NLP pipeline that only works well on the stock sentiment dataset it was trained on. This also prevents data loss and the need to index match during the LSTM stage of this work.
5.4.2. Comparison of Classifiers
Overall, SVM performs better than NB for all areas of classification. However, this is not to say that SVM is the better stock predictor, since the classification is supervised against a sentiment score (indicator) instead of against the stock price (the result). The AFINN classification outputs 3-polarity categories, hence the lower performance compared to the manual sentiment (see
Table 6). This result is worse than [
49], who managed to achieve 98.8% accuracy classification using SVM improved with RBF kernel when classifying against WordNet lexicon. This model achieved the classification rate while classifying up to 10 categories, namely −5 to 5 sentiment score.
5.4.3. Classification against Manual Sentiment
Initial Data Analysis shows that our classes are imbalanced; the negative sentiment is less than positive sentiment by a large margin. As such, the weighted average of F1-scores will be used as comparison (see
Table 7). Considering each of the three stocks, both classifiers seem to perform better on MSFT. MSFT is a low volume, high agreement stock. This suggests that a higher volume introduces noise to the classifier, decreasing accuracy. The low recall on negative news also suggests that the NB model tends to wrongly classify negative news as positive.
5.4.4. Classification of AFINN Sentiment
Once again, looking at F1-Scores, at a 3-polarity scale level, the NB model tends to wrongly classify negative news as neutral or positive (see
Table 8). Although trained on the full corpus, and MSFT having the lowest volume of the 3, the classifier still works best on MSFT stocks. This indicates that the tweets regarding MSFT are of higher quality. The trained models are then used to predict the sentiment scores for use in the LSTM model as a feature. Both SVM and NB features are used together as a set.
5.5. Results of LSTM Model
5.5.1. Preliminary Results for Selection of Default Settings
The number of neurons tested were 5 to 75 neurons at 10 neuron increments, with the optimal setting found to be 50. A low neuron count seemed to decrease accuracy (see
Table 9). The training batch size was set to 100, which was reasonable considering the size of the dataset. Tanh, ReLu, Softmax, sigmoid, and linear activations were tested, with linear yielding the best results. Adam optimiser was used with settings to prevent gradient clipping but, in the end, default Adam was used.
5.5.2. Comparing Sentiment Methods
All models which included sentiment scores were able to outperform the same LSTM model without using sentiment scores, except for all sentiment feature sets for AAPL barring manual sentiment (see
Figure 13,
Figure 14 and
Figure 15). MSFT has the least reduction in MAPE and RMSE while TSLA had the most decrease. AAPL did not show reductions at all with the inclusion of sentiment scores except for manual sentiment. The manual sentiment set on TSLA performed the best, with a reduction of 1.93% MAPE. All MSFT MAPE improvements were marginal, at only ~0.1% MAPE across all sentiment sets.
Visually, it seems that the LSTM models under-predict the stock prices regardless of method used. Hence, the RMSE values are largely contributed to by negative errors. It may be possible to improve the model by increasing the weights for positive detection.
5.5.3. Sequence Length
By manipulating sequence length, the ability of sentiment scores to be a data reduction technique is explored (see
Table 10). When comparing with a no sentiment score model, if the sentiment score model can provide high accuracy despite reducing the number of stock price inputs, the overall model can be optimized by not considering long-duration stock prices. Based on the results from
Section 5, TSLA with manual sentiment and TSLA with AFINN set will be used as a basis of comparison.
At a larger number of days (>15), sentiment models performed better than models without. With a 50-day length input, the stock only model only had a 81.49% accuracy whereas sentiment models AFINN and manual had an improvement of 8.67% and 12.94% accuracy respectively. This suggests that sentiment scores do impact stock prices. The disparity at 50 days sequence length suggests that sentiment does add a dimension in pattern discovery that pure stock prices alone cannot. One explanation for why pure stock prices perform better for low sequence length is that a stock price cannot fluctuate too much in a small duration and is easily predicted. However, these fluctuations compound over a longer period and so the price is less predictable. In this scenario, sentiment analysis is shown to be able to uncover the hidden pattern for long duration stock price predictions.
6. Conclusions and Future Works
When it comes to supervised learning to classify tweets, SVM outperformed Naïve–Bayes classification. Since AFINN classification has 3 levels of polarity, the 2-level polarity classification using manual sentiment performed better. Both classifiers performed best on MSFT stock and are confirmed to work well in identifying both positive and negative tweets due to high recall. NB classification showed poor recall in identifying negative tweets regardless of stock or lexicon supervisor. For the LSTM-RNN model, all sentiment analysis methods showed an improvement over LSTM-RNN on stock price data for TSLA and MSFT stock. AAPL stock, however, only benefitted from manual sentiment. Of the 3 stocks, TSLA showed the highest reduction in MAPE, from 7.31% using sole stock price data to 5.38% using manual sentiment. Additionally, sentiment analysis can improve the accuracy of the model for long sequence lengths. The detailed analysis for the proposed methods, like SVM for sentiment classification and LSTM for stock price prediction, with more stocks are considered as one of the significant avenues for future work. Testing of the performance of the models in adversarial environments is also an important study. This is primarily due to the reason that the models of machine learning and deep learning can be bypassed using adversarial models. The analysis of the training, validation, and testing of the models in different market settings must be conducted to understand the robustness of the machine learning and deep learning models. These are some important avenues for future work based on the current study.
Author Contributions
Conceptualization, S.R.V. and K.T.; methodology, S.R.V. and K.T.; software, S.R.V. and K.T.; validation, S.R.V. and K.T.; investigation, S.R.V.; resources, V.R.; writing—original draft, S.R.V. and K.T.; writing—review and editing, V.R.; supervision, V.R.; project administration, V.R.; funding acquisition, V.R. All authors have read and agreed to the published version of the manuscript.
Funding
This research received no external funding.
Institutional Review Board Statement
Not applicable.
Informed Consent Statement
Not applicable.
Conflicts of Interest
The authors declare no conflict of interest.
Abbreviations
| ANN | Artificial Neural Networks |
| CNN | Convolutional Neural Network |
| DT | Decision Trees |
| ML | Machine Learning |
| MM | Market Maker |
| MAPE | Mean Absolute Percentage Error |
| NER | Named Entity Recognition |
| NLP | Natural Language Processing |
| PCA | Principal Component Analysis |
| RF | Random Forests |
| RMSE | Root Mean Square Error |
| SVM | Support Vector Machines |
| SVR | Support Vector Regression |
| GA | Genetic Algorithm |
| SA | Simulated Annealing |
| RNN | Recurrent Neural Networks |
| LSTM | Long Short Term Memory |
| KNN | k-Nearest Neighbours |
| DGM | deep generative model |
| MLP | Multi-layer Perceptron |
| NB | Naïve Bayes |
| POS | Parts-of-Speech |
| TF-IDF | Term-Frequency/Inverse Document Frequency |
| NB-MS | Naïve-Bayes Supervised Against Manual Sentiment |
| SVM-MS | SVM Supervised Against Manual Sentiment |
| NB-AF | Naïve-Bayes Supervised Against AFINN Sentiment |
| SVM-AF | SVM Supervised Against AFINN Sentiment |
References
- Alostad, H.; Davulcu, H. Directional Prediction of Stock Prices Using Breaking News on Twitter. In Proceedings of the 2015 IEEE/WIC/ACM International Conference on Web Intelligence and Intelligent Agent Technology (WI-IAT), Singapore, 6–9 December 2015; pp. 523–530. [Google Scholar]
- Dash, R.; Dash, P.K. A hybrid stock trading framework integrating technical analysis with machine learning techniques. J. Finance Data Sci. 2016, 2, 42–57. [Google Scholar] [CrossRef] [Green Version]
- Pan, J.; Zhuang, Y.; Fong, S. The Impact of Data Normalization on Stock Market Prediction: Using SVM and Technical Indicators. In Soft Computing in Data Science; Berry, M.W., Mohamed, A.H., Yap, B.W., Eds.; Springer: Singapore, 2016; Volume 652, pp. 72–88. [Google Scholar]
- Oetama, R.S. Sentiment Analysis on Official News Accounts of Twitter Media in Predicting Facebook Stock. In Proceedings of the 2019 5th International Conference on New Media Studies (CONMEDIA), Kuta, Indonesia, 9–11 October 2019; pp. 74–79. [Google Scholar]
- Alam, F.; Kumar, D.A.; Vela, A.; Tech, M. Using News Articles to Predict Stock Movements Based on Different Forecasting Techniques Statistical, Regression and Text Mining. J. Emerg. Technol. Innov. Res. 2018, 5, 7. [Google Scholar]
- Stoean, C.; Paja, W.; Stoean, R.; Sandita, A. Deep architectures for long-term stock price prediction with a heuristic-based strategy for trading simulations. PLoS ONE 2019, 14, e0223593. [Google Scholar] [CrossRef] [Green Version]
- Chong, E.; Han, C.; Park, F.C. Deep learning networks for stock market analysis and prediction: Methodology, data representations, and case studies. Expert Syst. Appl. 2017, 83, 187–205. [Google Scholar] [CrossRef] [Green Version]
- Selvin, S.; Vinayakumar, R.; Gopalakrishnan, E.; Menon, A.V.K.; Soman, K.P. Stock price prediction using LSTM, RNN and CNN-sliding window model. In Proceedings of the 2017 International Conference on Advances in Computing, Communications and Informatics (ICACCI), Manipal, India, 13–16 September 2017; pp. 1643–1647. [Google Scholar]
- Wang, Y.; Choi, I.-C. Market Index and Stock Price Direction Prediction using Machine Learning Techniques: An empirical study on the KOSPI and HSI. arXiv 2013, arXiv:1309.7119. [Google Scholar]
- Hegazy, O.; Soliman, O.S.; Abdul Salam, M. A Machine Learning Model for Stock Market Prediction. Int. J. Comput. Sci. Telecommun. 2013, 4, 17–23. [Google Scholar]
- Elgendy, N.; Elragal, A. Big Data Analytics: A Literature Review Paper. In Advances in Data Mining. Applications and Theoretical Aspects; Perner, P., Ed.; Springer International Publishing: Cham, Switzerland, 2014; Volume 8557, pp. 214–227. [Google Scholar]
- Preis, T.; Moat, H.S.; Stanley, H.E. Quantifying Trading Behavior in Financial Markets Using Google Trends. Sci. Rep. 2013, 3, 1684. [Google Scholar] [CrossRef] [PubMed] [Green Version]
- Bijl, L.; Kringhaug, G.; Molnár, P.; Sandvik, E. Google searches and stock returns. Int. Rev. Financ. Anal. 2016, 45, 150–156. [Google Scholar] [CrossRef]
- Hu, H.; Tang, L.; Zhang, S.; Wang, H. Predicting the direction of stock markets using optimized neural networks with Google Trends. Neurocomputing 2018, 285, 188–195. [Google Scholar] [CrossRef]
- Bollen, J.; Mao, H.; Zeng, X. Twitter mood predicts the stock market. J. Comput. Sci. 2011, 2, 1–8. [Google Scholar] [CrossRef] [Green Version]
- Pagolu, V.S.; Reddy, K.N.; Panda, G.; Majhi, B. Sentiment analysis of Twitter data for predicting stock market movements. In Proceedings of the 2016 International Conference on Signal Processing, Communication, Power and Embedded System (SCOPES), Paralakhemundi, India, 3–5 October 2016; pp. 1345–1350. [Google Scholar]
- Nisar, T.M.; Yeung, M. Twitter as a tool for forecasting stock market movements: A short-window event study. J. Financ. Data Sci. 2018, 4, 101–119. [Google Scholar] [CrossRef]
- Moat, H.S.; Curme, C.; Avakian, A.; Kenett, D.Y.; Stanley, H.E.; Preis, T. Quantifying Wikipedia Usage Patterns Before Stock Market Moves. Sci. Rep. 2013, 3, 1801. [Google Scholar] [CrossRef] [Green Version]
- Gidófalvi, G. Using News Articles to Predict Stock Price Movements. Department of Computer Science and Engineering. Master’s Thesis, University of California, San Diego, CA, USA, 15 June 2001. [Google Scholar]
- Fung, G.P.C.; Yu, J.X.; Lu, H. The Predicting Power of Textual Information on Financial Markets. IEEE Intell. Inform. Bull. 2005, 5, 1–10. [Google Scholar]
- Kalyani, J.; Bharathi, P.; Jyothi, P. Stock trend prediction using news sentiment analysis. arXiv preprint 2016, arXiv:1607.01958. [Google Scholar]
- Albrecht, B.; Wang, Y.; Zhu, X. Kaggle Competition 2sigma Using News to Predict Stock Movements. 2017. Available online: https://cs229.stanford.edu/proj2018/report/82.pdf (accessed on 13 January 2023).
- Patel, J.; Shah, S.; Thakkar, P.; Kotecha, K. Predicting stock market index using fusion of machine learning techniques. Expert Syst. Appl. 2015, 42, 2162–2172. [Google Scholar] [CrossRef]
- Qiu, M.; Song, Y.; Akagi, F. Application of artificial neural network for the prediction of stock market returns: The case of the Japanese stock market. Chaos Solitons Fractals 2016, 85, 1–7. [Google Scholar] [CrossRef]
- Enke, D.; Mehdiyev, N. A Hybrid Neuro-fuzzy Model to Forecast Inflation. Procedia Comput. Sci. 2014, 36, 254–260. [Google Scholar] [CrossRef] [Green Version]
- Shannon, B. Technical Analysis Using Multiple Timeframes. In Life Vest; Independently Published: Chicago, IL, USA, 2008. [Google Scholar]
- Atkins, A.; Niranjan, M.; Gerding, E. Financial news predicts stock market volatility better than close price. J. Financ. Data Sci. 2018, 4, 120–137. [Google Scholar] [CrossRef]
- Shah, D.; Isah, H.; Zulkernine, F. Predicting the Effects of News Sentiments on the Stock Market. In Proceedings of the 2018 IEEE International Conference on Big Data (Big Data), Seattle, WA, USA, 10–13 December 2018; pp. 4705–4708. [Google Scholar]
- Mantegna, R.N.; Stanley, H.E. Scaling behaviour in the dynamics of an economic index. Nature 1995, 376, 46–49. [Google Scholar] [CrossRef]
- Khedr, A.E.; Salama, S.E.; Yaseen, N. Predicting Stock Market Behavior using Data Mining Technique and News Sentiment Analysis. Int. J. Intell. Syst. Appl. 2017, 9, 22–30. [Google Scholar] [CrossRef]
- Mohan, S.; Mullapudi, S.; Sammeta, S.; Vijayvergia, P.; Anastasiu, D.C. Stock Price Prediction Using News Sentiment Analysis. In Proceedings of the 2019 IEEE Fifth International Conference on Big Data Computing Service and Applications (BigDataService), Newark, CA, USA, 4–9 April 2019; pp. 205–208. [Google Scholar]
- Liu, J.; Lu, Z.; DU, W. Combining Enterprise Knowledge Graph and News Sentiment Analysis for Stock Price Prediction. In Proceedings of the 52nd Hawaii International Conference on System Sciences, Maui, HI, USA, 8–11 January 2019. [Google Scholar]
- Tul, Q.; Ali, M.; Riaz, A.; Noureen, A.; Kamranz, M.; Hayat, B.; Rehman, A. Sentiment Analysis Using Deep Learning Techniques: A Review. Int. J. Adv. Comput. Sci. Appl. 2017, 8, 6. [Google Scholar] [CrossRef] [Green Version]
- Wilson, T.; Wiebe, J.; Hoffmann, P. Recognizing Contextual Polarity: An Exploration of Features for Phrase-Level Sentiment Analysis. Comput. Linguist. 2009, 35, 399–433. [Google Scholar] [CrossRef] [Green Version]
- Zimbra, D.; Abbasi, A.; Zeng, D.; Chen, H. The State-of-the-Art in Twitter Sentiment Analysis: A Review and Benchmark Evaluation. ACM Trans. Manag. Inf. Syst. 2018, 9, 1–29. [Google Scholar] [CrossRef]
- Matsubara, T.; Akita, R.; Uehara, K. Stock Price Prediction by Deep Neural Generative Model of News Articles. IEICE Trans. Inf. Syst. 2018, 101, 901–908. [Google Scholar] [CrossRef] [Green Version]
- Sarkar, A.; Sahoo, A.K.; Sah, S.; Pradhan, C. LSTMSA: A Novel Approach for Stock Market Prediction Using LSTM and Sentiment Analysis. In Proceedings of the 2020 International Conference on Computer Science, Engineering and Applications (ICCSEA), Sydney, Australia, 28–29 March 2020; pp. 1–6. [Google Scholar]
- Kirange, M.D.; Deshmukh, R.R. Sentiment Analysis of news headlines for stock price prediction. COMPUSOFT Int. J. Adv. Comput. Technol. 2016, 5, 2080–2084. [Google Scholar]
- Kaya, M.Y.; Karsligil, M.E. Stock price prediction using financial news articles. In Proceedings of the 2010 2nd IEEE International Conference on Information and Financial Engineering, Chongqing, China, 17–19 September 2010; pp. 478–482. [Google Scholar]
- Tan, L.I.; Phang, W.S.; Chin, K.O.; Patricia, A. Rule-Based Sentiment Analysis for Financial News. In Proceedings of the 2015 IEEE International Conference on Systems, Man, and Cybernetics, Hong Kong, China, 9–12 October 2015; pp. 1601–1606. [Google Scholar]
- Gilbert, C.H.E.; Hutto, E. Vader: A parsimonious rule-based model for sentiment analysis of social media text. In Proceedings of the Eighth International Conference on Weblogs and Social Media (ICWSM-14), Ann Arbor, MI, USA, 1–4 June 2014; Volume 81, p. 82. Available online: http://comp.social.gatech.edu/papers/icwsm14.vader.hutto.pdf (accessed on 16 April 2020).
- Nielsen, F.A. A new ANEW: Evaluation of a word list for sentiment analysis in microblogs. arXiv 2011, arXiv:1103.2903. [Google Scholar]
- Toninelli, D.; Schlosser, S.; Cameletti, M. Comparing Methods to Retrieve Tweets: A Sentiment Approach. Proc. CARMA 2020, 299–306. [Google Scholar] [CrossRef]
- Turney, P.D.; Mohammad, S.M. The natural selection of words: Finding the features of fitness. PLoS ONE 2019, 14, e0211512. [Google Scholar] [CrossRef]
- Ke, Y.; Hagiwara, M. Improve Lexicon-based Word Embeddings by Word Sense Disambiguation. arXiv 2017, arXiv:1707.07628. [Google Scholar]
- Kuznetsov, I.; Gurevych, I. From Text to Lexicon: Bridging the Gap between Word Embeddings and Lexical Resources. In Proceedings of the 27th International Conference on Computational Linguistics, Santa Fe, NM, USA, 12–17 October 2022; pp. 233–244. [Google Scholar]
- Hochreiter, S.; Schmidhuber, J. LSTM can solve hard long time lag problems. Adv. Neural Inf. Process. Syst. 1996, 9, 473–479. [Google Scholar]
- Althelaya, K.A.; El-Alfy, E.M.; Mohammed, S. Evaluation of bidirectional LSTM for short-and long-term stock market prediction. In Proceedings of the 2018 9th International Conference on Information and Communication Systems (ICICS), Leuven, Belgium, 3–5 April 2018; pp. 151–156. [Google Scholar]
- Gopi, A.P.; Jyothi, R.N.S.; Narayana, V.L.; Sandeep, K.S. Classification of tweets data based on polarity using improved RBF kernel of SVM. Int. J. Inf. Technol. 2020. [Google Scholar] [CrossRef]
Figure 1.
Overall Methodology for Research.
Figure 1.
Overall Methodology for Research.
Figure 2.
Stock Market Dataset.
Figure 2.
Stock Market Dataset.
Figure 3.
TSLA Stock Against Manual Sentiment.
Figure 3.
TSLA Stock Against Manual Sentiment.
Figure 4.
AAPL Stock Against Manual Sentiment.
Figure 4.
AAPL Stock Against Manual Sentiment.
Figure 5.
MSFT Stock Against Manual Sentiment.
Figure 5.
MSFT Stock Against Manual Sentiment.
Figure 6.
TSLA Stock Against AFINN Sentiment.
Figure 6.
TSLA Stock Against AFINN Sentiment.
Figure 7.
MSFT Stock Against AFINN Sentiment.
Figure 7.
MSFT Stock Against AFINN Sentiment.
Figure 8.
AAPL Stock Against AFINN Sentiment.
Figure 8.
AAPL Stock Against AFINN Sentiment.
Figure 9.
TSLA Stock Against NRC Sentiment.
Figure 9.
TSLA Stock Against NRC Sentiment.
Figure 10.
AAPL Stock Against NRC Sentiment.
Figure 10.
AAPL Stock Against NRC Sentiment.
Figure 11.
MSFT Stock Against NRC Sentiment.
Figure 11.
MSFT Stock Against NRC Sentiment.
Figure 12.
Visualization of NRC Lexicon.
Figure 12.
Visualization of NRC Lexicon.
Figure 13.
All SA-LSTM Model Comparison—AAPL.
Figure 13.
All SA-LSTM Model Comparison—AAPL.
Figure 14.
All SA-LSTM Model Comparison—TSLA.
Figure 14.
All SA-LSTM Model Comparison—TSLA.
Figure 15.
All SA-LSTM Model Comparison—MSFT.
Figure 15.
All SA-LSTM Model Comparison—MSFT.
Table 1.
Comparative Analysis of Various Stock Prediction Methods Based on Sentiment Analysis.
Table 1.
Comparative Analysis of Various Stock Prediction Methods Based on Sentiment Analysis.
| Author | External Variable | External Variable Treatment | Method | Enhancement of Features | Model | Details | Accuracy | Prediction Method | Prediction Accuracy |
|---|
| Kirange & Deshmukh (2016) [38] | news headlines | LIWC Lexicon | supervised classification | none | SVM KNN Naive Bayes | LIWC lexicon, four levels of sentiment polarity | 48.59 to 99.51 | correlation | significant correlation |
| Matsubara, Akita, & Uehara (2018) [36] | news headlines | MeCab, Paragraph Vector Algorithm | unsupervised deep learning classification | none | DGM | Multiple articles aggregated to per day, 2 level polarity | 61.1 | log-probability | Profit, 37.06% |
| Nisar & Yeung (2018) [17] | Tweets | Umigon Lexicon | supervised classification | Positive to negative ratios of tweet volume | Umigon | correlation only | No cross validation | Linear Regression | significant correlation |
| B. Liu (2012) [32] | news and technical indicators | Sentiment Score of Words | supervised classification | Stock correlations, company relationship knowledge graph using TransR, Named Entity Recognition (NER), and Relation Extraction (RE). | Jieba | The lexicon is based on the top 10% of repeating terms and has a two-level polarity. | 79.2 | GRU | 71.3 |
| Mohan et al. (2019) [31] | news data | None | supervised classification, semi-superivsed vector | Aggregation of t − 1 through t − n time windows | NTLK, word2vec | Semi-supervised word2vec TF-IDF supervised NTLK to classify two levels of polarity | No cross validation | RNN LSTM | MAPE values between 2.03 and 2.17. |
| Khedr, Salama, S.E. & Yaseen (2017) [30] | news data | None | supervised classification | Stock data discretion | Naive Bayes | bigram TF-IDF for sentiment analysis, whole NLP pipeline | 86.21 | KNN | 72.73 to 86.21 without news data, news data 89.80 |
| Sarkar et al., (2020) [37] | news headlines | Event Registry API | supervised classification | none | not stated | Adam Optimiser, gradient descent with momentum, and RMSprop Hinton are three optimisers. | No cross validation | LSTM-RNN | 40% variance improvement |
| Oetama (2019) [4] | Tweets | Bing Liu lexicon | supervised classification | Aggregation of Moving Averages 5, 10, 15 days, buy/hold/sell conditions | word count | Bing Liu lexicon, 2 level polarity | 75.4 | DT | 0.73$ profit per day |
Table 2.
Comparison Between News Article Sources.
Table 2.
Comparison Between News Article Sources.
| News Source | Specificity | Relevance | Length | Volume | Validity |
|---|
| Full Articles | Medium | Medium | Long | Low | High |
| Tweets | Exact | Highly variable | Short | High | Low |
| Headlines | Low | Highly variable | Short | Low | Medium |
| Forum Posts | High | High | Medium | Medium | Medium |
| Curated Tweets | Exact | High | Short | Medium | High |
Table 3.
Characterization of Stocks.
Table 3.
Characterization of Stocks.
| Stock | Characterization |
|---|
| Tesla | Unpredictable, High Volume, High Disparity, Strong Sentiment |
| Apple | Predictable, High Volume, Moderate Disparity, Moderate Sentiment |
| Microsoft | Predictable, Low Volume, Low Disparity, Weak Sentiment |
Table 4.
Initial Data Exploration of AFINN Set.
Table 4.
Initial Data Exploration of AFINN Set.
| AFINN Criteria | TSLA | MSFT | AAPL |
|---|
| Net AFINN Valence Sentiment | 883 | 1210 | 3643 |
| Sum of Negative Valence Scores | −5007 | −326 | −3804 |
| Sum of Positive Valence Scores | 5890 | 1536 | 7447 |
| Number of Negative Tweets | 2126 | 202 | 3486 |
| Number of Neutral Tweets | 4335 | 1169 | 5680 |
| Number of Positive Tweets | 2677 | 835 | 1882 |
| Total Tweets | 9138 | 2206 | 11,048 |
Table 5.
Initial Data Exploration of NRC Lexicon.
Table 5.
Initial Data Exploration of NRC Lexicon.
| NRC Moods | TSLA | AAPL | MSFT |
|---|
| Positive | 2932 | 2999 | 244 |
| Negative | 2589 | 2424 | 277 |
| Anger | 1224 | 921 | 97 |
| Anticipation | 2323 | 2475 | 232 |
| Disgust | 519 | 395 | 31 |
| Fear | 1390 | 1167 | 130 |
| Joy | 1008 | 948 | 84 |
| Sadness | 1127 | 1044 | 244 |
| Surprise | 818 | 746 | 277 |
| Trust | 2031 | 2081 | 113 |
Table 6.
Results of Machine Learning Sentiment Analysis Classification.
Table 6.
Results of Machine Learning Sentiment Analysis Classification.
| Predicted Set | Accuracy |
|---|
| NB-MS | SVM-MS | NB-AF | SVM-AF |
|---|
| Full Corpus | 79.96 | 89.46 | 66.91 | 82.56 |
| TSLA | 73.85 | 88.52 | 65.86 | 83.75 |
| AAPL | 84.09 | 92.01 | 69.17 | 85.6 |
| MSFT | 91.29 | 96.18 | 79.88 | 91.29 |
Table 7.
Results of Classifiers Supervised Against Manual Sentiment.
Table 7.
Results of Classifiers Supervised Against Manual Sentiment.
| | NB | SVM |
|---|
| Precision | Recall | F1 | Support | Precision | Recall | F1 | Support |
|---|
| Full Corpus |
| negative | 0.96 | 0.43 | 0.59 | 5242 | 0.9 | 0.78 | 0.83 | 5242 |
| positive | 0.77 | 0.99 | 0.87 | 10,166 | 0.89 | 0.95 | 0.92 | 10,166 |
| macro avg | 0.87 | 0.71 | 0.73 | 15,408 | 0.9 | 0.87 | 0.88 | 15,408 |
| weighted avg | 0.84 | 0.8 | 0.77 | 15,408 | 0.89 | 0.89 | 0.89 | 15,408 |
| AAPL |
| negative | 0.94 | 0.48 | 0.63 | 3147 | 0.89 | 0.82 | 0.85 | 3147 |
| positive | 0.82 | 0.99 | 0.9 | 7887 | 0.93 | 0.96 | 0.95 | 7887 |
| macro avg | 0.88 | 0.73 | 0.76 | 11,034 | 0.91 | 0.89 | 0.9 | 11,034 |
| weighted avg | 0.86 | 0.84 | 0.82 | 11,034 | 0.92 | 0.92 | 0.92 | 11,034 |
| TSLA |
| negative | 0.97 | 0.37 | 0.54 | 3293 | 0.92 | 0.78 | 0.85 | 3293 |
| positive | 0.7 | 0.99 | 0.82 | 4801 | 0.87 | 0.95 | 0.91 | 4801 |
| macro avg | 0.83 | 0.68 | 0.68 | 8094 | 0.89 | 0.87 | 0.88 | 8094 |
| weighted avg | 0.81 | 0.74 | 0.7 | 8094 | 0.89 | 0.89 | 0.88 | 8094 |
| MSFT |
| negative | 0.96 | 0.79 | 0.87 | 1022 | 0.96 | 0.93 | 0.95 | 1022 |
| positive | 0.89 | 0.98 | 0.94 | 1861 | 0.96 | 0.98 | 0.97 | 1861 |
| macro avg | 0.93 | 0.88 | 0.9 | 2883 | 0.96 | 0.95 | 0.96 | 2883 |
| weighted avg | 0.92 | 0.91 | 0.91 | 2883 | 0.96 | 0.96 | 0.96 | 2883 |
Table 8.
Results of Classifiers Supervised Against AFINN.
Table 8.
Results of Classifiers Supervised Against AFINN.
| | NB | SVM |
|---|
| Precision | Recall | F1 | Support | Precision | Recall | F1 | Support |
|---|
| Full Corpus |
| negative | 0.93 | 0.11 | 0.2 | 2802 | 0.82 | 0.6 | 0.69 | 2802 |
| neutral | 0.63 | 0.94 | 0.75 | 7736 | 0.79 | 0.94 | 0.86 | 7736 |
| positive | 0.79 | 0.55 | 0.65 | 4870 | 0.91 | 0.77 | 0.84 | 4870 |
| macro avg | 0.78 | 0.54 | 0.54 | 15,408 | 0.84 | 0.77 | 0.8 | 15,408 |
| weighted avg | 0.73 | 0.67 | 0.62 | 15,408 | 0.83 | 0.83 | 0.82 | 15,408 |
| AAPL |
| negative | 0.95 | 0.13 | 0.22 | 1882 | 0.87 | 0.66 | 0.75 | 1882 |
| neutral | 0.64 | 0.97 | 0.77 | 5666 | 0.82 | 0.96 | 0.88 | 5666 |
| positive | 0.85 | 0.55 | 0.67 | 3486 | 0.93 | 0.8 | 0.86 | 3486 |
| macro avg | 0.81 | 0.55 | 0.55 | 11,034 | 0.87 | 0.81 | 0.83 | 11,034 |
| weighted avg | 0.76 | 0.69 | 0.65 | 11,034 | 0.86 | 0.86 | 0.85 | 11,034 |
| TSLA |
| negative | 0.94 | 0.18 | 0.3 | 1856 | 0.84 | 0.7 | 0.77 | 1856 |
| neutral | 0.61 | 0.95 | 0.74 | 3908 | 0.81 | 0.93 | 0.86 | 3908 |
| positive | 0.8 | 0.55 | 0.65 | 2330 | 0.9 | 0.79 | 0.84 | 2330 |
| | 0.78 | 0.56 | 0.56 | 8094 | 0.85 | 0.81 | 0.82 | 8094 |
| weighted avg | 0.74 | 0.66 | 0.61 | 8094 | 0.84 | 0.84 | 0.84 | 8094 |
| MSFT |
| negative | 0.94 | 0.06 | 0.12 | 252 | 0.9 | 0.67 | 0.77 | 252 |
| neutral | 0.77 | 0.94 | 0.84 | 1488 | 0.89 | 0.97 | 0.93 | 1488 |
| positive | 0.85 | 0.78 | 0.81 | 1143 | 0.96 | 0.89 | 0.92 | 1143 |
| avg | 0.85 | 0.59 | 0.59 | 2883 | 0.92 | 0.84 | 0.87 | 2883 |
| weighted avg | 0.82 | 0.8 | 0.77 | 2883 | 0.92 | 0.91 | 0.91 | 2883 |
Table 9.
Comparison of Results of Sentiment Methods after LSTM.
Table 9.
Comparison of Results of Sentiment Methods after LSTM.
| Sentiment Set | Metrics | AAPL | TSLA | MSFT |
|---|
| Stock Data Only | MSE | 7.358 | 1009.899 | 17.009 |
| Accuracy | 97.90% | 92.69% | 98.24% |
| MAPE | 2.10% | 7.31% | 1.76% |
| RMSE | 2.71 | 31.78 | 4.12 |
| AFINN | MSE | 8.281 | 702.510 | 15.257 |
| Accuracy | 97.89% | 94.27% | 98.38% |
| MAPE | 2.11% | 5.73% | 1.62% |
| RMSE | 2.88 | 26.50 | 3.91 |
| NRC | MSE | 8.877 | 859.046 | 14.891 |
| Accuracy | 97.76% | 93.47% | 98.36% |
| MAPE | 2.24% | 6.53% | 1.64% |
| RMSE | 2.98 | 29.31 | 3.86 |
| Classification | MSE | 9.142 | 888.633 | 14.758 |
| Accuracy | 97.69% | 93.16% | 98.38% |
| MAPE | 2.31% | 6.84% | 1.62% |
| RMSE | 3.02 | 29.81 | 3.84 |
| Manual | MSE | 6.965 | 608.909 | 16.094 |
| Accuracy | 98.22% | 94.62% | 98.34% |
| MAPE | 1.78% | 5.38% | 1.66% |
| RMSE | 2.64 | 24.68 | 4.01 |
Table 10.
Comparison of Sequence Length.
Table 10.
Comparison of Sequence Length.
| Model | Sequence Length (Days) |
|---|
| 5 | 15 | 30 | 50 |
|---|
| TSLA AFINN | 94.61% | 91.85% | 93.36% | 90.16% |
| TSLA Stock Only | 95.71% | 90.25% | 92.37% | 81.49% |
| TSLA Manual | 94.84% | 92.41% | 94.95% | 94.43% |
| Disclaimer/Publisher’s Note: The statements, opinions and data contained in all publications are solely those of the individual author(s) and contributor(s) and not of MDPI and/or the editor(s). MDPI and/or the editor(s) disclaim responsibility for any injury to people or property resulting from any ideas, methods, instructions or products referred to in the content. |
© 2023 by the authors. Licensee MDPI, Basel, Switzerland. This article is an open access article distributed under the terms and conditions of the Creative Commons Attribution (CC BY) license (https://creativecommons.org/licenses/by/4.0/).


