1. Introduction
Performance variables represent the basis of a significant portion of applied research in the automotive and road safety field. Their importance arises because, in the modern perspective of smart roads, they constitute an interconnection between all the elements of the road system: the vehicle, the road and, above all, the user. The latter is particularly complex to analyze and represent through analytical variables due to the extreme heterogeneity of drivers in terms of age, driving experience, skills, risk propensity, etc. [
1].
For some decades, the aim has been to control the stress on the human being while driving through a series of measures, which fall within the very wide scope of the so-called workload.
Workload is an aspect, which can greatly influence the driving ability of drivers [
2]. When the level of workload is high, attention and the ability to concentrate can decrease, increasing the risk of road accidents.
Advances in low-cost sensors and the computing capabilities of microprocessors have simplified workload measures, which can be classified into three broad categories: subjective measurements (e.g., questionnaires for users [
3,
4]), physiological measurements (e.g., fixations, pupil dilation, dermal conductivity, heart rate [
5,
6,
7,
8]) and performance measurements. There is some overlap between them; for example, electroencephalography (EEG) can be used both as a physiological measurement and also as a subjective measure of workload. Moreover, a driver might perceive a high danger while maneuvering (subjective measure), but his or her steering speed (performance measure) might still be compliant with an ideal driving behavior. Performance measures encompass primary and secondary measures. Primary measures directly evaluate task performance, while secondary measures assess the residual workload of the driver. These measures concern vehicle control in relation to driving behavior or vehicle dynamics. Variables illustrating the correctness of the turning maneuver and mainly the lateral position [
9,
10,
11] and the activity of steering in terms of angle or speed [
12] belong to the former group. In this regard, McAdam et al. [
13] proposed a model studying the interaction between vehicle driving strategy and the control mechanism executing it. Subsequently, Toffin et al. [
14] compared the predictions of the driving model and the results of simulated driving in terms of root mean square (RMS) variability of the steering angle by calculating it in the circular section only.
In another study, the standard deviation of lane position (SDLP) and steering wheel reversal rate (SRR) were selected as lateral control ability indicators to estimate the driver’s cognitive workload. SDLP was calculated using 0.1 Hz high-pass filtered lateral position data. SRR was calculated by counting the number of steering wheel reversals from the 2 Hz low-pass filtered steering wheel angle data. Window size was considered the summarizing parameter for inputs in slots of 5, 10, 15, 20 s over which SDLP and SRR data were averaged. However, this procedure, which can only be applied for datasets longer than 10 s, cannot be used during lane changes or along curves [
15].
These authors have recognized the primary role of driving behavior in road safety. The functions relating to the steering angle, lane position or steering wheel reversal rate have been synthesized with statistical operators, and this may have resulted in loss of information at the local level in particular points of the road.
Another performance measure is takeover time, which is the time required by the driver to reach a threshold of a 2-degree steering wheel angle or a 10% decrease in brake pedal position [
16,
17,
18]. However, this measure is not specifically correlated with a particular maneuver phase. Moreover, there is no universal definition of recovery time in simulation studies [
19,
20,
21]. Furthermore, several research works have proposed models for assessing risk factors and estimating the probability of frontal collisions through statistical analyses using the minimum time to collision (TTC) as a performance measure [
22,
23].
Very often, the mean or the standard deviation of the performance variable studied (such as vehicle speed, the difference between average vehicle speed and speed limit, or steering angle and speed) are treated as metrics on the basis of which subsequent analyses are applied. However, these metrics are global and synthetic indicators, which are not always useful in focusing attention on user behavior in the various phases of a single maneuver. By averaging the data, there is a risk of neglecting the factors closely linked both to the road and to the driver’s decision-making process [
24]. For example, averaging or considering the maximum value in the complexity of a section including straight lines, circular and transition curves, accesses, etc., may hide some user behaviors, which deviate from those theoretically expected.
Other more recent studies have proposed some procedures in which road safety was correlated with road geometric characteristics. For example, Riccardi et al. [
25] have identified two different approaches, named reactive and proactive, based, respectively, on accident data and on specific risk factors on a road, which may increase the probability of unwanted events. When the accident data collected are not sufficient or poorly aggregated, then it is more convenient to apply proactive procedures, i.e., based on measures, which evaluate the environmental risk factors and which thus allow the calculation of a risk index, which can be geographically referenced using web-GIS platforms [
26]. Among the risk factors, the ones most used are geometric, physical, functional defects or information relating to operation, such as traffic volume and average speed [
27].
Other measures have been used to understand driving behavior in curves [
28] related to standard deviation in the lateral position, maximum encroachment in the shoulder, maximum encroachment in the opposite lane, relative length of shoulder encroachment and relative length of opposite lane encroachment. Again, in order to identify the factors influencing accident events, Wang et al. [
29] cross-referenced data from 108 critical events with 216 ordinary driving events. Among the most dangerous factors, the authors found speeding, visual distraction and geometric characteristics of the curves.
The literature review highlighted that some aspects relating to the evaluation of vehicle control have been neglected or used for purposes other than those relating to road safety. A superficial consideration can lead to unhelpful results, which do not consider the specificity of the geometric element covered (straight line, circular curve, transition curve). In this context, the purpose of this research concerns the following:
In particular, the study—based on an experimental drive along four different curves of known geometry in a simulated environment—focused on steering activity (steering angle and speed) because it explains very well the relationships between the infrastructure, the external context and the driver’s reaction. In this regard, the authors proposed eight variables related to the steering angle (SA) and steering speed (SS). Depending on the geometric element traveled (clothoids, residual circular arc), the authors compared the ideal trend—derived from prescription or theoretical considerations contained in Italian road standards—with the experimental one. The comparison with real driving conditions allows quantification of the deviation and therefore obtaining a quantitative judgment on the driver’s performance.
2. Methodology
The study was carried out in a simulated environment, considering experimental data derived from a single driver. Although it is obviously not possible to identify general behavior based on these tests without the necessary validation in a real environment, the aim of this first research step is to focus on the representativeness of the proposed indicators and not on the value of the result. Only after having tested the correctness of the indicators can these be applied to specific contexts, obtaining results of general value.
The real driving context was discarded for several reasons: lower safety for subjects involved in the trials, less control over certain variables (light, weather, traffic) and higher economic burden for instrumenting the vehicle. The benefits, which could have been achieved with greater realism, were considered not useful, as this first phase of the research placed greater emphasis on defining the methodological aspects without any regard for results of overall significance.
Below, a summary of the instrumentation used, the data characteristics and the numerical procedures used for their analysis is provided.
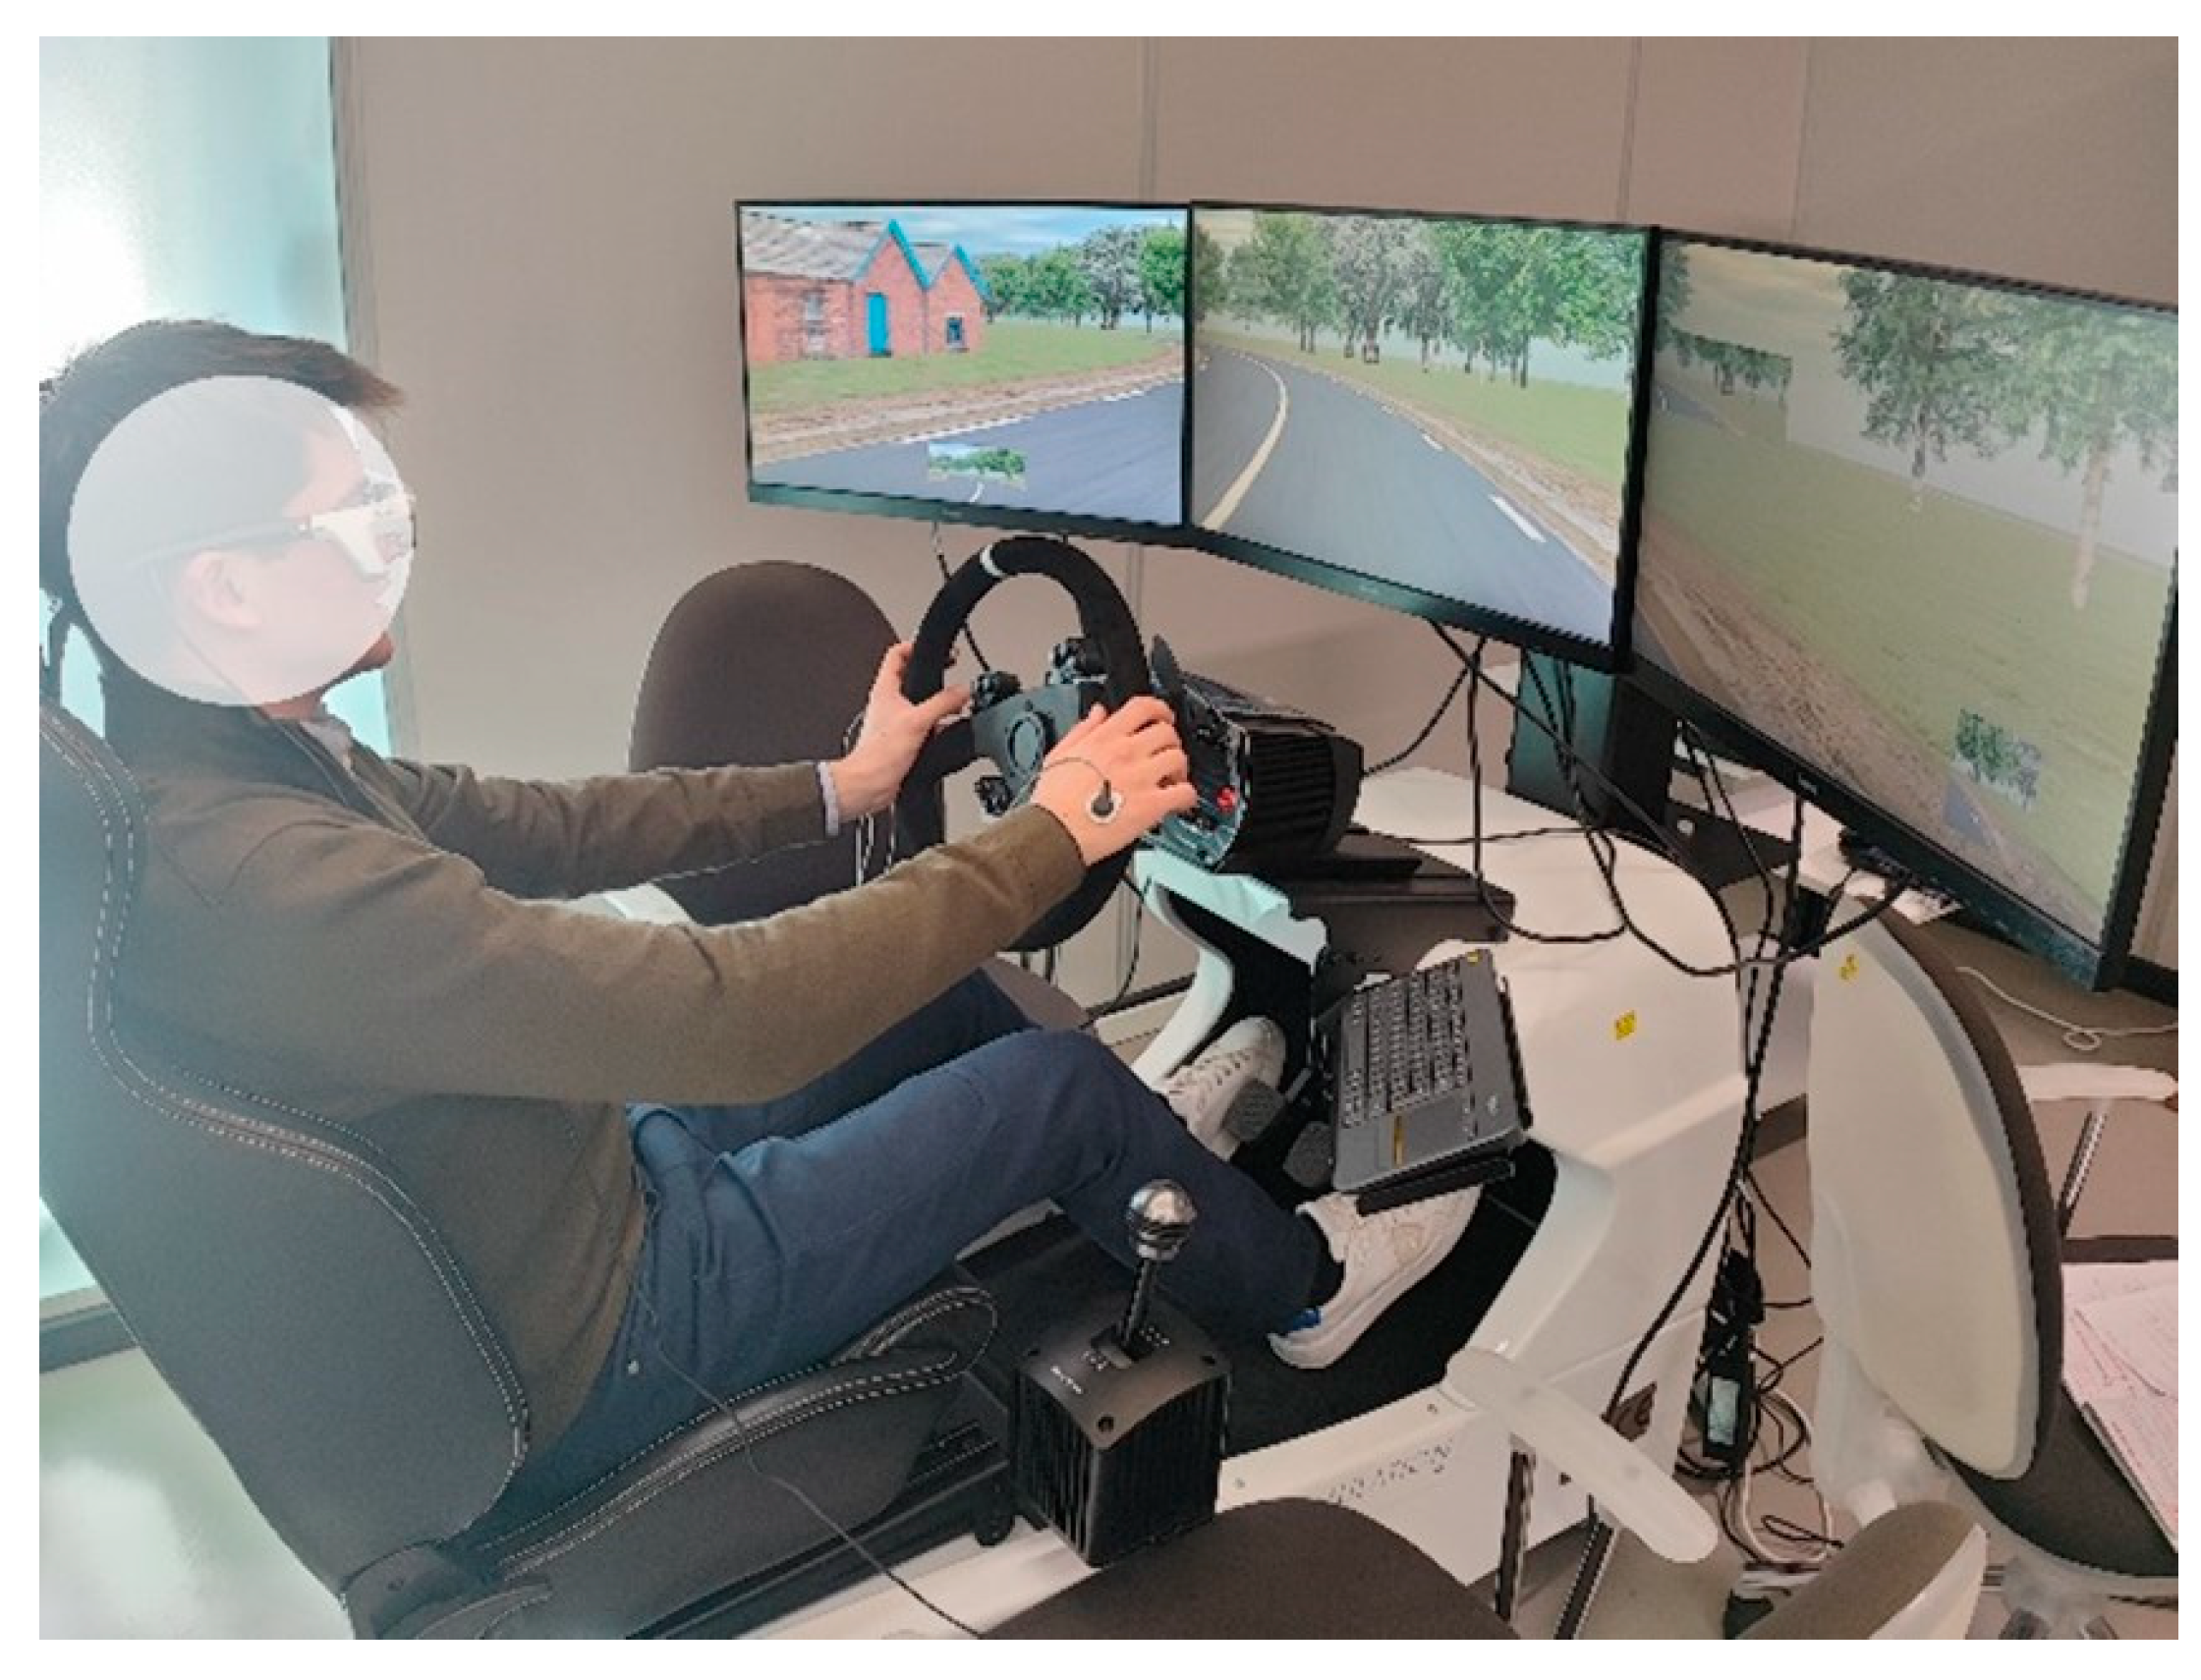
The driving simulator used in this study is owned by the Digital Laboratory for Road Safety (DiLaRS) at the University of Messina. It is a compact, static simulator with an ergonomic driving position and traditional driving controls (clutch, brake and throttle, with manually adjustable passive force feedback and a 7 + 1 manual gearbox), featuring a steering wheel with an active force feedback system. The simulator is equipped with three monitors displaying the external scenario to the driver (
Figure 1). The software used is Scaner Studio
® vers.2022.2—a suite, which guarantees complete control over the driving environment, including the vehicle, the road (in terms of geometry and pavement characteristics), traffic and environmental conditions.
The software’s features allow the road environment to be modeled entirely through the management of the following modules: Terrain, Vehicle, Scenario, Simulation and Analysis. For this work, for all sections of the profile, road objects were created, which contain within them the constituent elements of the road profile—material, lane, road markings, sidewalks, etc.—thus editing the dimensions and characteristics of the cross-section.
Among the main features of the software are the following:
Possibility to modify the mechanical and dynamic characteristics of the vehicle.
Possibility to organize the dashboard in the best way.
Ability to acquire simulation scenarios from Google Earth®, Autodesk Infraworks®2023, Autodesk Civil 3D® 2023, TomTom®2021, etc.
Full control of road geometry (circular or transition curves, vertical curves, etc.).
Insertion of objects in the driving context (pedestrians, other vehicles, motorcycles and bicycles, barriers, etc.), which respond to the laws of physics (including collisions).
Possibility of entering traffic flows (vehicles/h) with components of any type (bicycles, motorcycles, motor vehicles, commercial vehicles) equipped with artificial intelligence.
Possibility of configuring “active” pedals (ACC, ABS feedback, dynamic pedal force feedback, etc.).
Recording of telemetry data, concerning variables such as position, speed and acceleration in all directions of space, pedal and steering activity, steering rotation speed, lateral position of the vehicle with respect to lane or road axes or other landmarks, velocity diagrams, etc., with the possibility of exporting these data externally.
Possibility to configure the characteristics of the pavement.
Ability to configure multiple weather conditions.
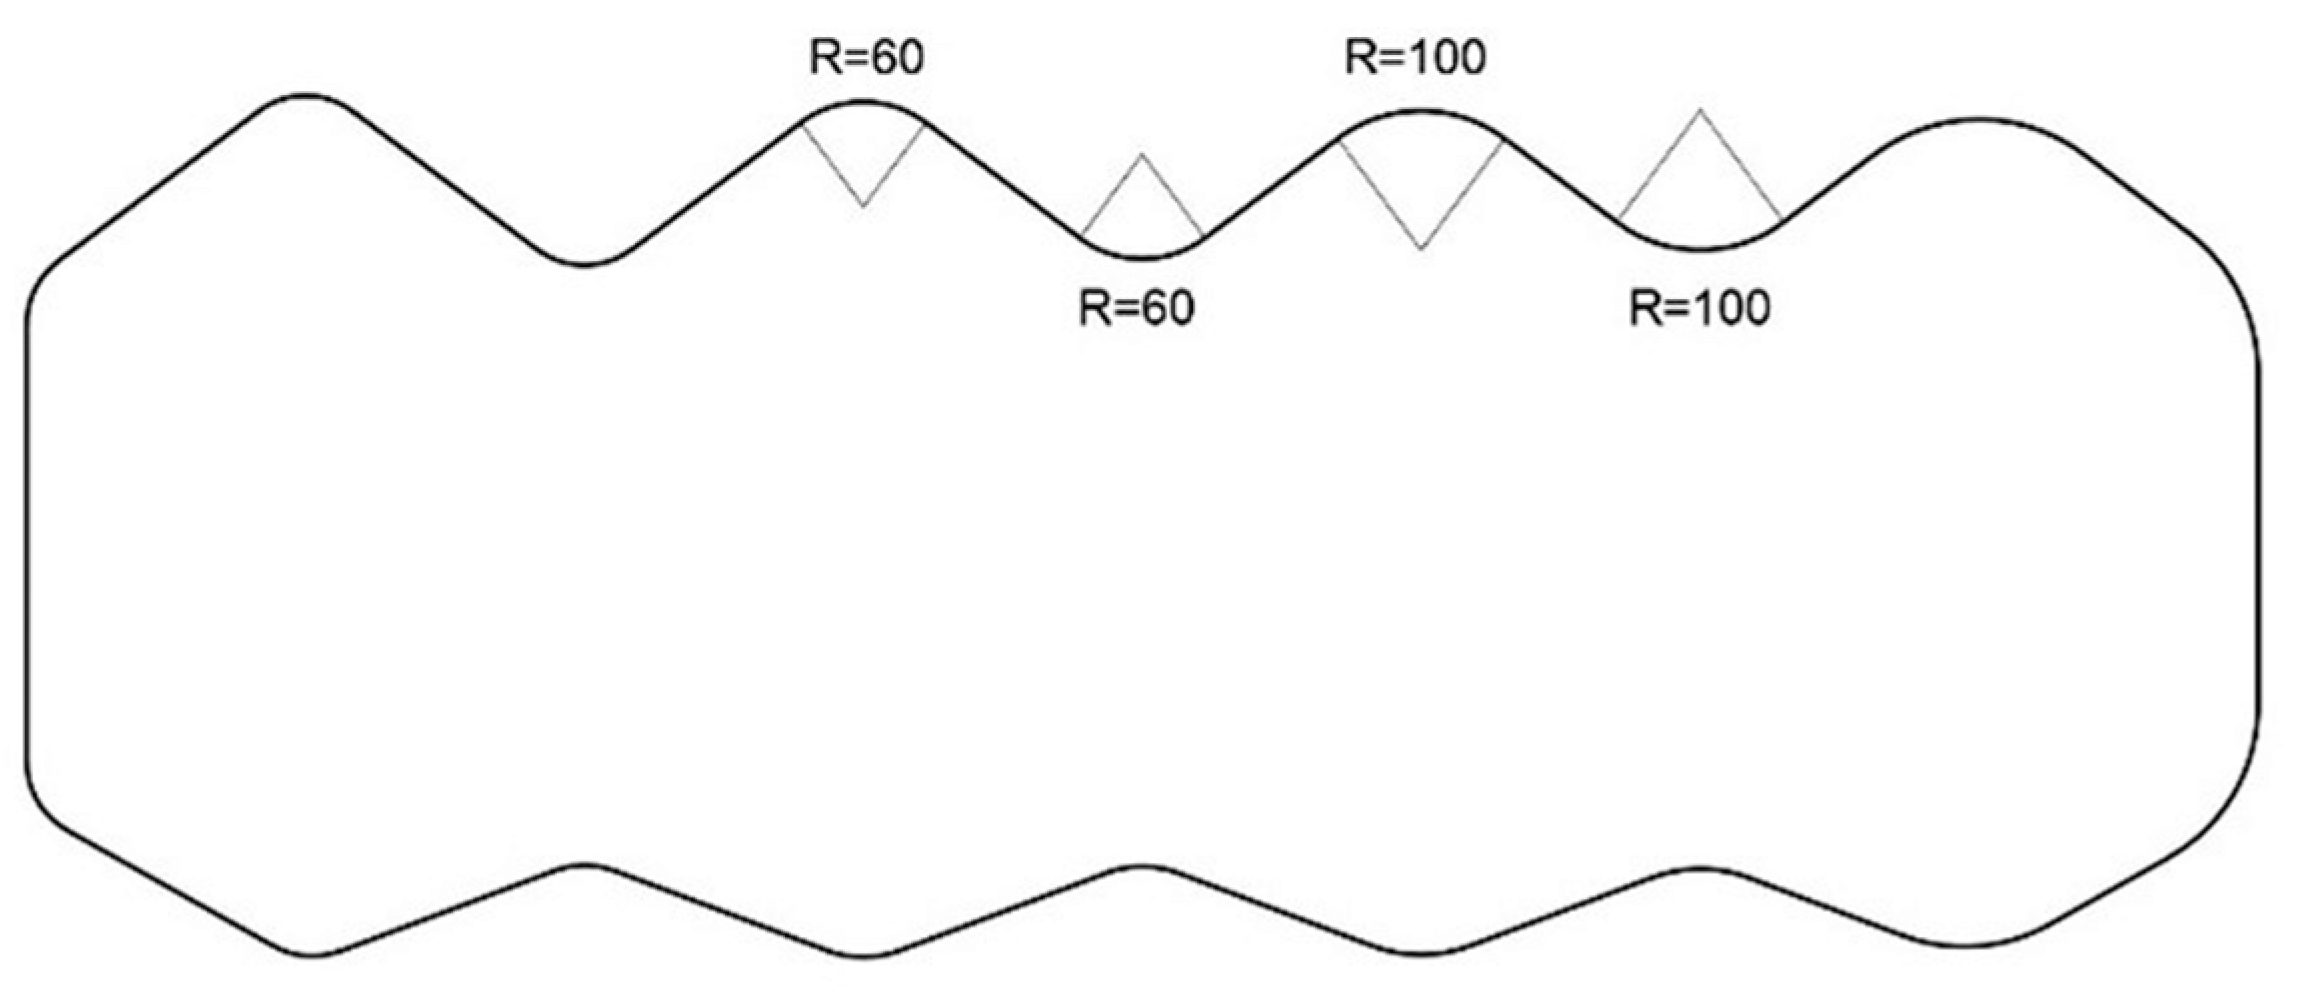
The experimentation was carried out on a rural road—type F, according to Italian road standards [
31]. Its cross-section consists of two lanes and two shoulders, 9 m wide in total. The road consists of a succession of alternating curves with radii of 60 m and 100 m and is about 5000 m long (
Figure 2).
Detailed characteristics of the two types of curves are shown in
Figure 3, where R indicates the radius of the circular curve; A is the parameter of the transition curves (clothoids); and L is the length of each geometric element (i.e., clothoids or circular arc). The radii of the circular curves are 60 m and 100 m. These close and quite small values determine a certain load for the driver but also ensure good consistency in the choice of speed. The transition curves are clothoids, fully in compliance with Italian road design standards. The driving test was carried out in absence of traffic because Italian road design regulations rely on this condition. Clearly, the scenario was deliberately simplified in order to limit the number of variables in the problem and mitigate their randomness.
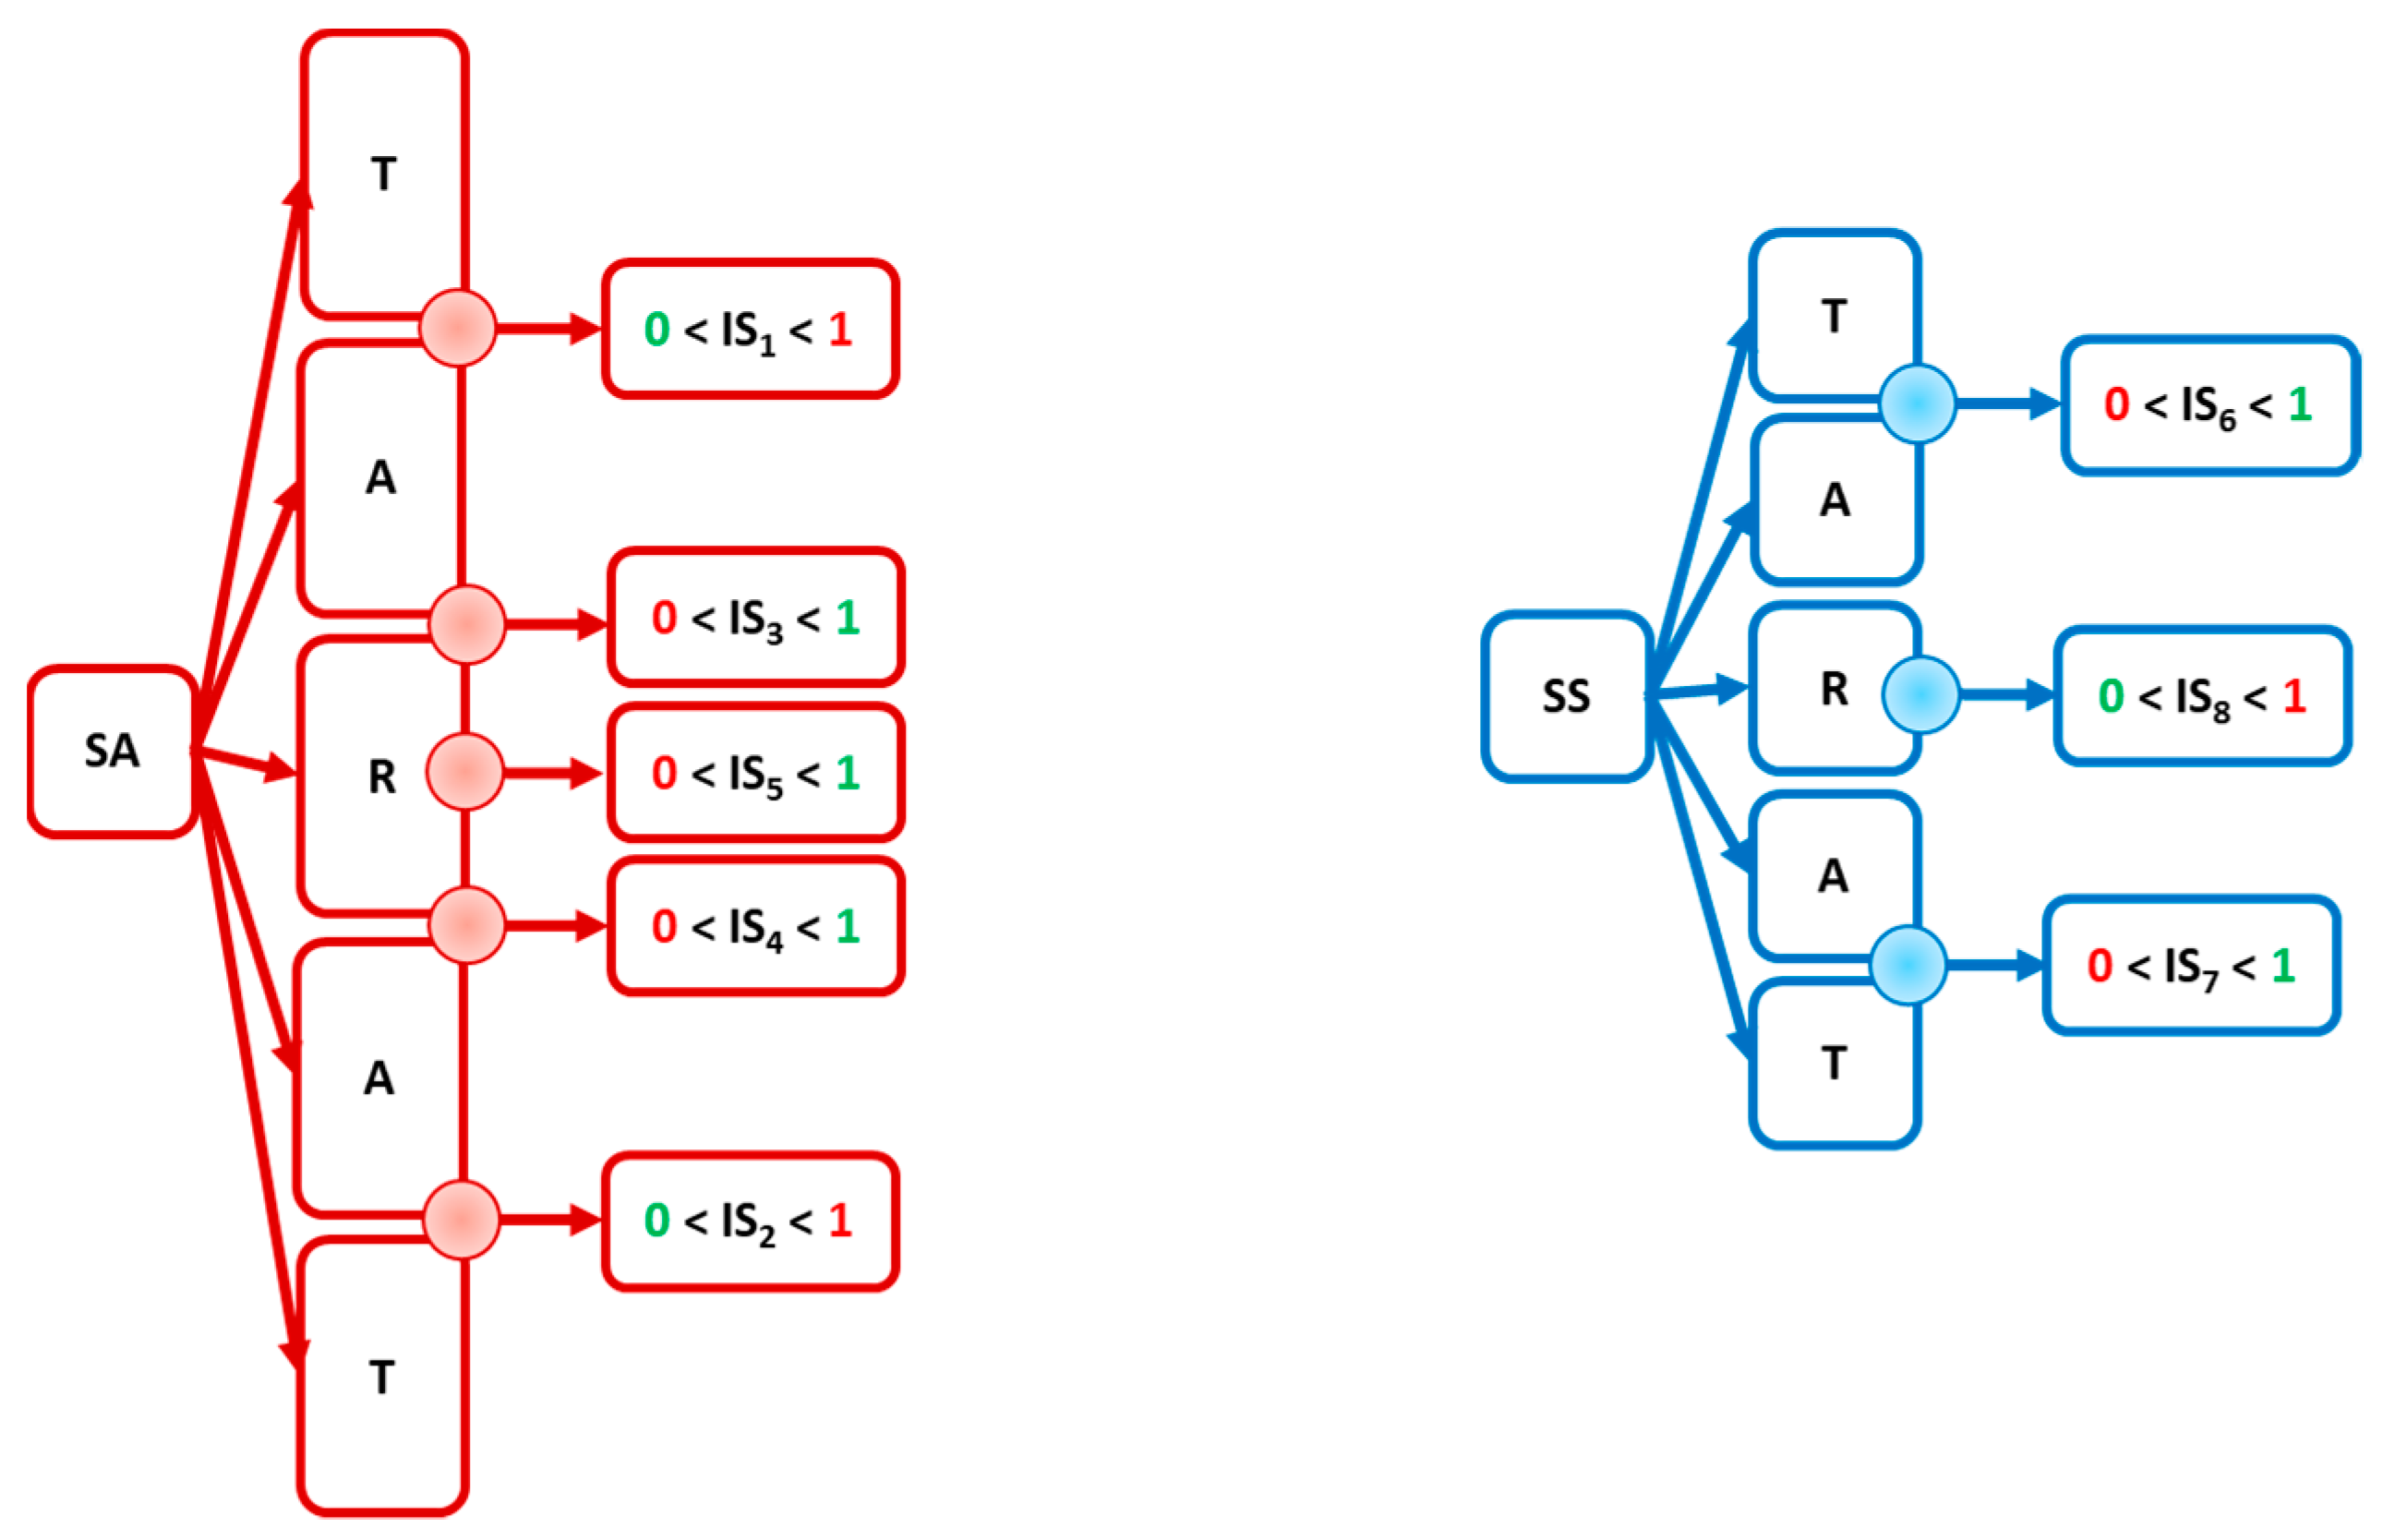
The section below explains the methodology through which—starting from the study of the performance function—eight different synthetic indicators related to the steering angle and steering speed were proposed. The number and type of these functions were chosen to try to properly describe the trend along a curve. Road horizontal curves are generally composed of three sections: the initial and final sections exhibit transition elements (with variable radii), while the central section is a circular arc. It is essential to evaluate the trend of these functions at each point of discontinuity between different sections, and therefore, the number of indicators chosen is the minimum number for a complete understanding of the phenomenon. A larger number of variables may further complicate the analytical context and the phenomenon’s evaluation. Therefore, in this step of the research, eight indicators—five for SA and three for SS, respectively—were defined and calculated.
The objective of these indicators is to demonstrate any difference between the ideal theoretical trend of the performance variable—defined according to hypotheses in Italian road standards—and the real one acquired via measurements while driving.
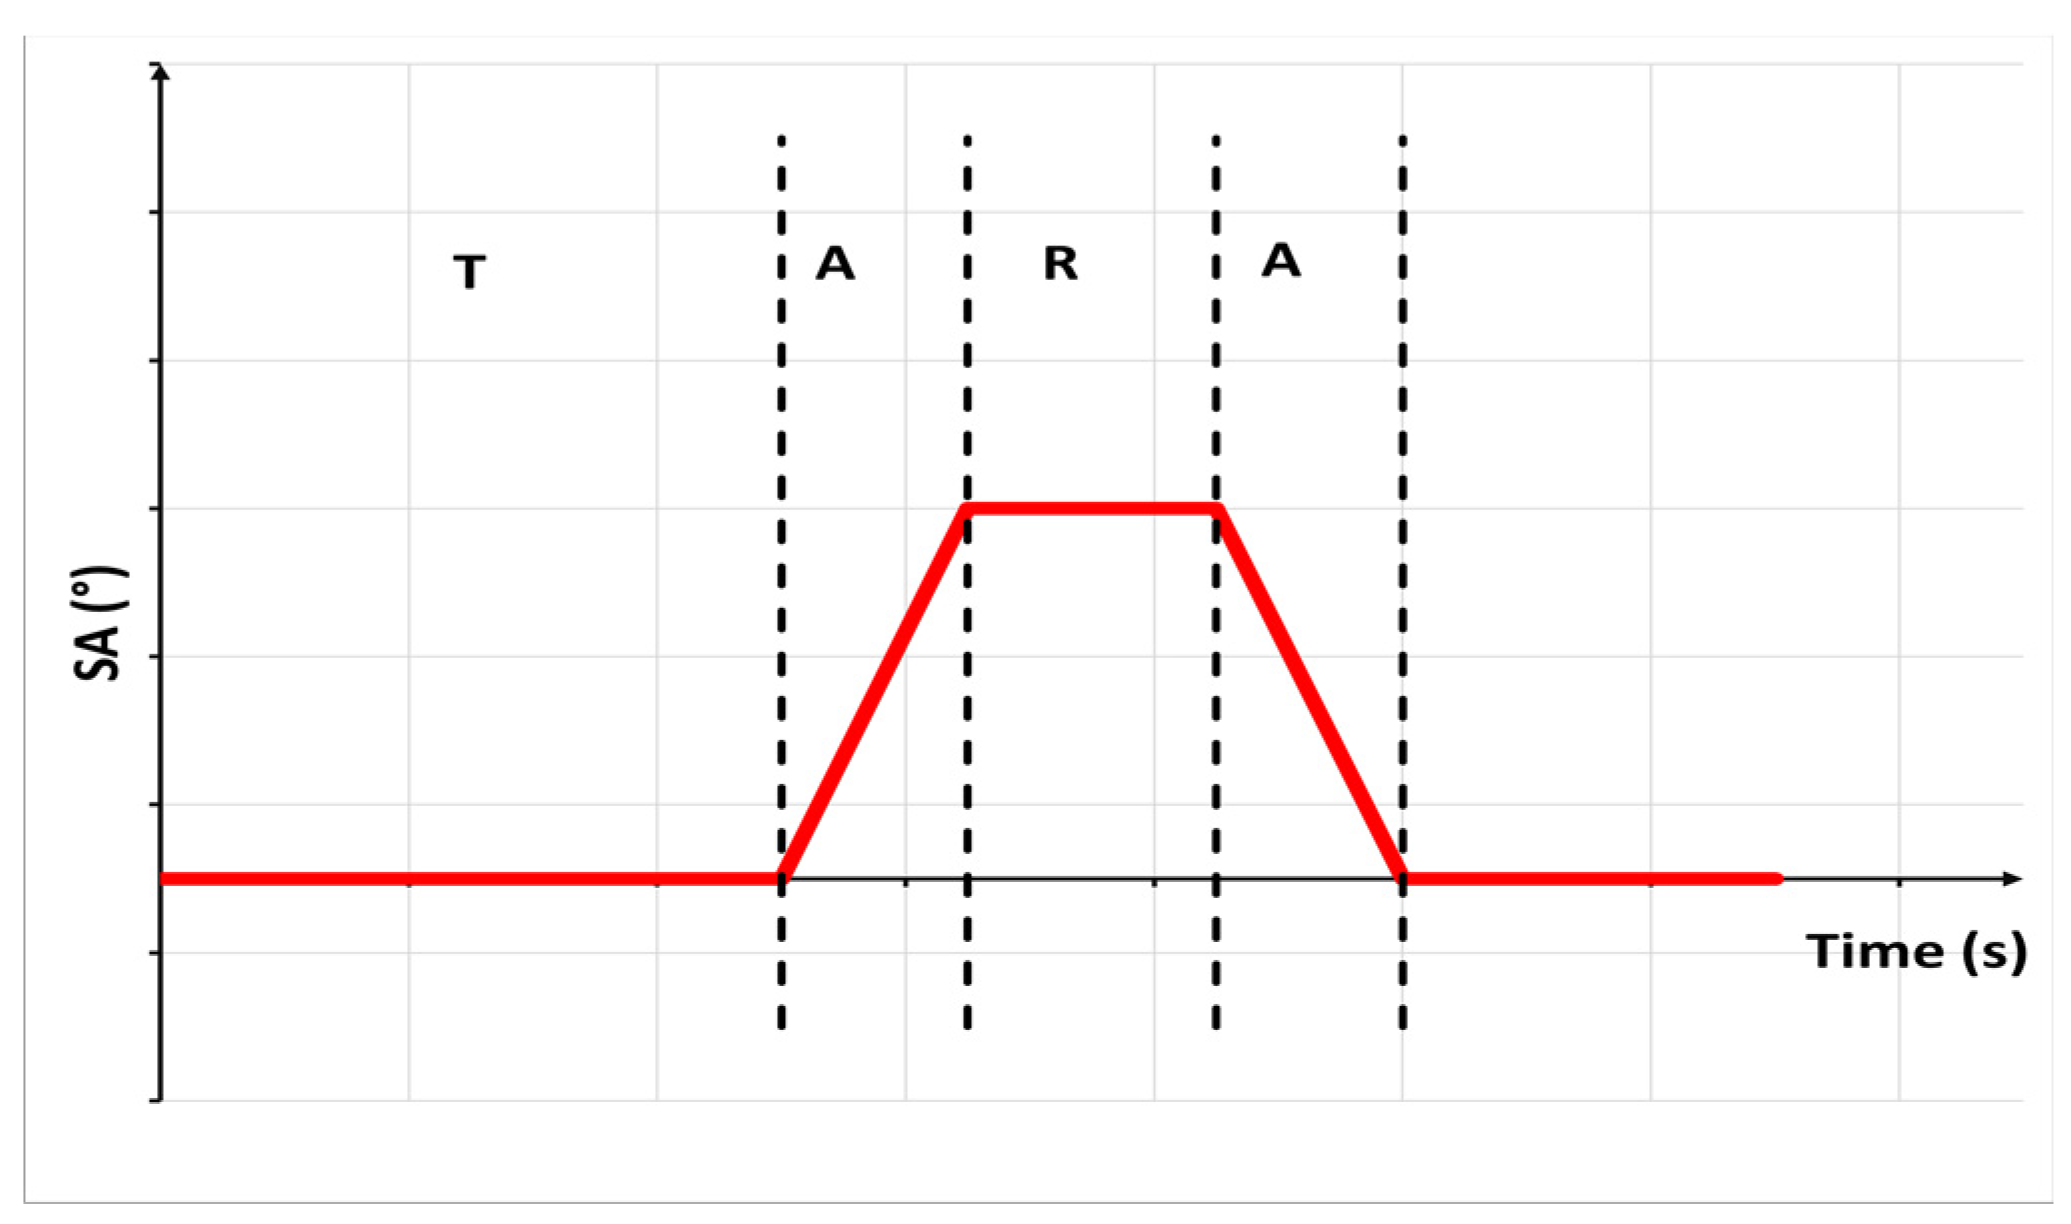
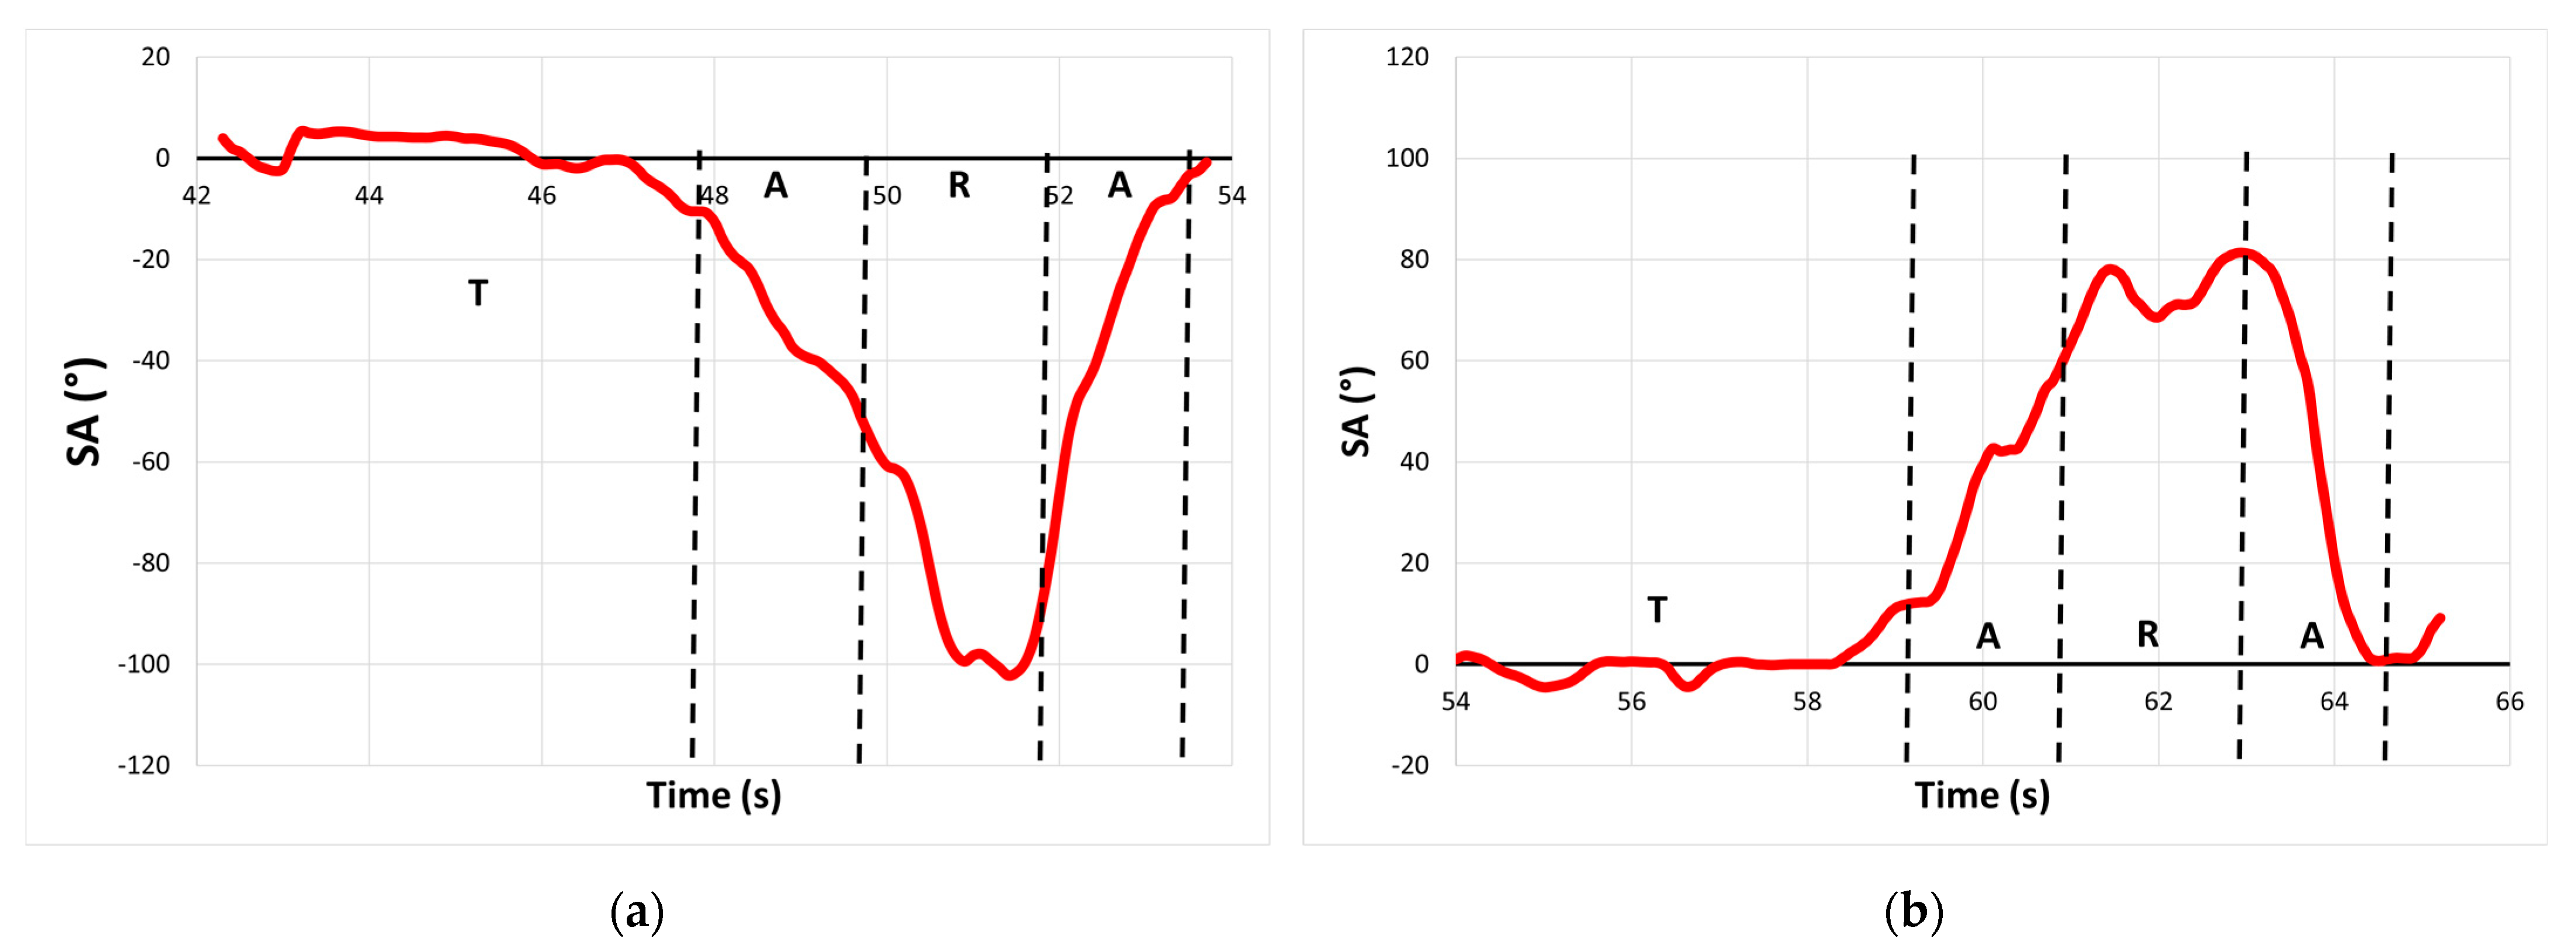
The proposed indicators are dedicated to the individual variables of performance and to appropriate points of the road; thus, the performance functions related to the individual geometric elements of the road will be evaluated. In the following, “T” refers to the straight section preceding the transition curve; “A” denotes the transition curves (clothoids) in input and output; and “R” denotes circular curves. In addition, to simplify reading, each proposed synthetic indicator (SI) is associated—in addition to an explanatory nomenclature—with reference ID (ISn with n from 1 to 8).
2.1. Steering Angle (SA)
Figure 4 depicts the ideal trend of
SA in different sections. Specifically,
[T]: The theoretical value of the SA should be zero. Deviations from this value could be classified in two easily understandable ways: they could be the result of sudden events forcing the driver to make corrective maneuvers (e.g., to avoid a pothole or an obstacle), or, if the signal is substantially periodic and of small amplitude, they could be attributable to a typical weaving motion in normal driving conditions. In this case, it is sufficient to properly filter out this “background noise”. The measurement becomes more interesting just before (or just after) a curve, as a pronounced deviation from zero could be indicative of an early (or late) steering maneuver due to difficulty in understanding the beginning of the curve; it could also represent a voluntary behavior, encouraged by a cross-sectional width, which allows free movement relative to the lane axis.
[A]: The theoretical value should be represented by a linear function of the SA, which starts from zero at the initial point (the end of the tangent section) and ends at the final point (the beginning of the circular arc). The same reasoning applies to the exit branch of the transition curve.
[R]: The ideal trend is represented by a constant value, not equal to the deviation angle between the two consecutive straight lines located at the ends of the curve. Rather, it mainly depends on the mechanical characteristics of the vehicle’s steering system and the motion conditions (speed, lateral acceleration). A deviation from this constant trend could create the need to complete the steering maneuver, which should have been properly completed in the transition section, or it could amplify the user’s willingness to approach the inside edge, aiming for the so-called “apex”, in order to minimize the distance traveled (“curve cutting”). The latter behavior is more common in right-hand curves, since users have a greater perception of danger on the left due to the possibility of oncoming traffic.
Figure 4.
Ideal steering angle (SA) trend.
Figure 4.
Ideal steering angle (SA) trend.
The following indicators were identified for this performance measure:
At the point between T and the transition curve A, as seen previously, the steering angle should theoretically be equal to zero. Any deviation from this value may be a signal of criticism of the maneuver. For this reason, the first two indicators identified (IS1 and IS2) are related to SA at these points (named, respectively, “TanClo” and “CloTan”) relative to the incoming (In) and outgoing (Out) clothoids. These indicators are calculated as a ratio between the absolute value of the steering angle at this point and the maximum steering value recorded along the entire curve (composed of incoming clothoids, a circular section and outgoing clothoids)—also an absolute value. The use of the absolute value for these indicators is necessary because the right and left curves have SA values with opposite signs.
The index ranges from 0 (no steering, ideal behavior) to 1 (steering already completed before the curve), and its achievement at this point of the road can only be hypothetical (and is obviously almost impossible). Although the limit of 1 is highly unrealistic, an indicator value significantly different from 0 indicates criticality in understanding the curve for the two points.
At the end of the incoming clothoids, the
SA should have reached its maximum. The third index (
IS3) is related to the value of
SA at the point of intersection between the clothoids and the circular arc (“
CloCir”) and is given by the ratio between the angle value at this point and the maximum angle detected along the entire curve. The reasoning is the same as for the first two indicators. However, this time, the limits of 0 and 1 have opposite meanings: the indicator tends toward 0 if the user has not yet started the steering maneuver and must therefore complete it on the circular arc (worse behavior), while it presents values close to 1 when the steering is completed, and the user does not need to rotate the steering wheel. The considerations at the initial point of the outgoing clothoids (“
CirClo”) are analogous to the previous point (
IS4).
At a circular curve, the
SA should preferably have a constant trend. For this section (“
Cir”), an index defined as the ratio between the average of the (absolute) values along the circular curve and the maximum value detected along the entire curve (always an absolute value) is considered. The index varies between 0 and 1, where the latter represents an ideal behavior, which occurs when the steering is completed, and the user keeps the steering in place:
2.2. Steering Speed (SS)
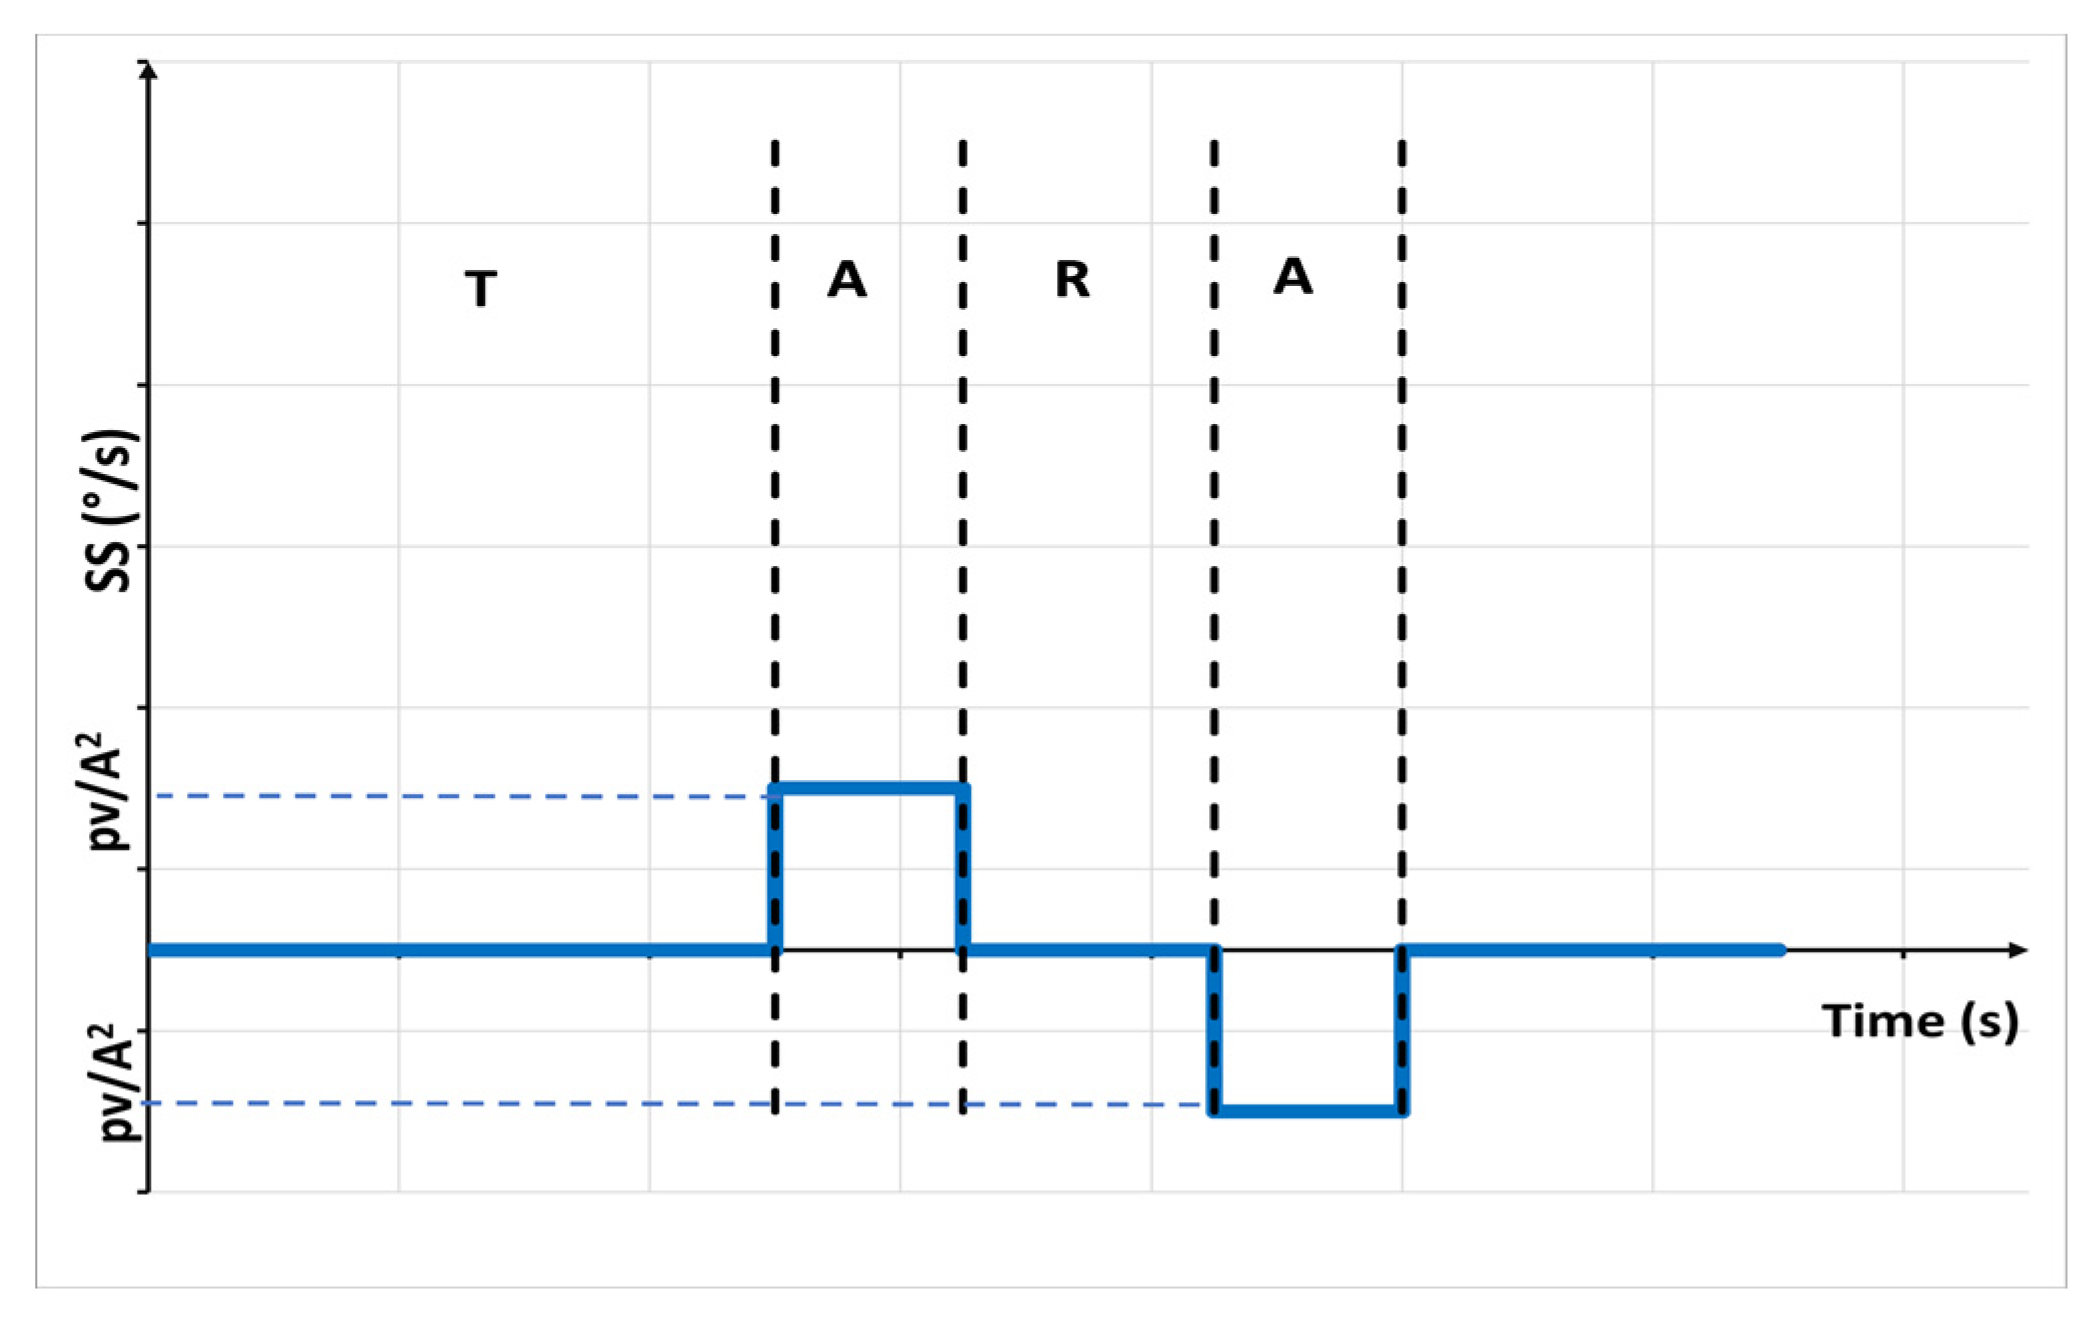
The ideal trend of SS in the different sections is shown in
Figure 5. In particular,
[T]: In this case, the ideal value would be zero. Any impulsive signals should be identified, and spikes due to normal driving behavior should be filtered. Attention should also be focused on the straight sections near the curves to evaluate any anomalous behaviors.
[A]: The steering speed function should have a constant trend and should ideally be equal to pv/A2, where p is the vehicle’s wheelbase; v is the speed in m/s; and A is the parameter of the clothoids.
[R]: The theoretical steering speed should be zero. The maximum value could also be evaluated here to identify any impulsive maneuvers along the curve. The presence of significant positive or negative peaks could be indicative of interpretation errors (peak location at random points) or excessive aggressiveness (curve cutting, with the peak placed on the bisector).
Figure 5.
Ideal steering speed (SS) trend.
Figure 5.
Ideal steering speed (SS) trend.
The following indicators were identified for this performance measure:
The first two indicators (
IS6 and
IS7) related to
SS were identified, respectively, at the point between T and transition curve A (“
TanClo”) relative to incoming clothoids (
In) and between clothoids and T for outgoing clothoids (“
CloTan”). These indicators are given by the ratio between the average absolute values of SS and the maximum absolute value throughout clothoid development. The ideal value should be 1, meaning that a uniform SS value is observed in the clothoids. Values lower than 1 indicate fluctuations in this variable along the transition curves:
An index,
IS8, is proposed on the circular curve for the circular arc (“
Cir”), which is equal to the ratio between the average absolute values of
SS and the maximum absolute value along the circular arc. Its ideal value should be 0, indicating that the steering is stationary on this element. Higher values, tending toward 1, indicate unexpected activity while steering.
Figure 6 presents a summary flowchart of the proposed indicators with their respective validity ranges for the two performance variables.
The quantification of these indicators does not depend on the type of road, drivers’ personal characteristics or the road context conditions but only on the value assumed by some performance variables with respect to time and space. Although the experimentation was carried out on a rural road, for reasons related to greater simplicity of the driving environment, the application to an urban road does not alter the representativeness of the indicators, which continue to have the same value in all situations.
In this regard, modern sensors read measurements of interest at high frequencies, producing very significant quantities of data, which must be collected, stored and managed for subsequent use. Furthermore, raw data cannot be used directly in traditional statistical analyses (for example, ANOVA) and need to be appropriately filtered without losing significance. The indicator, having ascertained its representativeness, is more suitable than raw data for inclusion in subsequent analyses regarding road safety. Using indicators allows analysts to eliminate much of the redundant data and process a small amount of information, which can then be easily stored, transmitted or processed later. The number of these original indicators is commensurate with the complexity of the phenomenon and with the depth of the planned analysis. For example, representing SS along a curve only through its average would result in a significant loss of detail at certain points of the curve. This means that a single indicator is not sufficiently representative to adequately describe the investigated phenomenon.
3. Results
As previously stated, in order to test the functionality of these eight indicators, the performance functions related to steering were derived by analyzing the SA and SS during a driving test conducted in a simulated environment using a reference user’s test on four curves of the path. The choice to evaluate the performance of a single user arises from the fact that, at this preliminary phase, the aim is not to interpret the general behavior of a suitable class of drivers but only to verify the sensitivity of the indicators in synthetically representing actual performance. Furthermore, a single driver has a certain uniformity of performance in all four curves, and therefore, any difference should only be due to the geometric characteristics of the curves, which differ from each other in terms of the circular arc radius and travel direction. In particular, the four curves have the following characteristics:
(C1) R = 60 m and right direction.
(C2) R = 60 m and left direction.
(C3) R = 100 m and right direction.
(C4) R = 100 m and left direction.
The graphs of these functions are reported in
Figure 7 (
SA) and
Figure 8 (
SS), while the results of various previously defined indicators are reported in
Table 1.
4. Discussion
In this study, the authors aimed to propose some synthetic indicators, which were sufficiently representative of user performance on a particular road segment. The examination was limited to only four curves driven by a single driver because, at this stage of the research, the focus is on developing novel indicators of driver performance, not verifying behaviors with general validity. Additionally, a larger sample size of drivers would have complicated the presentation of the data. The identification of indicators useful for understanding in detail the trend of some performance variables can be useful for the development of technologies related to the digitization of existing roads [
32].
Although steering is a maneuver whose importance has always been considered in the literature [
12], the use of data from sensors has not always been particularly profitable. In fact, the simplification of these functions through summary indicators [
14,
15], such as RMS, averages or variances, does not allow fully grasping certain critical issues. Even the use of thresholds—although it allows extremely simple judgments—leads to hasty and often erroneous conclusions [
16,
17,
18]. Therefore, there is a need to identify indicators capable of better understanding the complexity of the observed phenomenon in all its details [
24].
4.1. SA
Regarding the
SA for the two curves with R = 60 m (C1,
Figure 7a and C2,
Figure 7b), significantly high values are observed at the initial point
IS1, equal to 0.10 and 0.15, respectively; namely, 10% and 15% of the complete steering angle are completed at this point. No critical points are observed at the end of both curves (
IS2 = 0.01).
In the curves with R = 100 m, on the right (C3,
Figure 7c), values, which are barely noticeable at the beginning of the curve (
IS1 = 0.06) and almost zero at the end (
IS2 = 0.01), are highlighted, while on the left (C4,
Figure 7d), the extreme points are characterized by
SA values practically equal to 0 (
IS1 = 0.01 and
IS2 = 0.02, respectively).
The 60 m right curve (C1,
Figure 7a) shows a very low value of the entrance indicator (
IS3 = 0.54), indicating that steering was only completed up to 54% instead of 100%. Then, the remaining angle must be recovered on the circular arc, which should instead have been traveled without steering activity. The point between the circular arc and the outgoing clothoid
IS4 = 0.76 is certainly better than the previous one but confirms the difficulty in driving along the curve.
The left curve (C2,
Figure 7b) instead shows
IS3 and
IS4 values equal to 0.83 and 0.99, respectively, which can certainly be considered better than C1.
The 100 m right curve (C3,
Figure 7c) also has values, which are not properly optimal (0.82 and 0.80, respectively), but there is a critical peak along the circular arc, which shifts upward of the maximum value of
SA, representing the denominator of all the related proposed indicators. The left curve (R = 100 m, C4,
Figure 7d) instead shows an optimal value (
IS3 = 0.96) at the point between the incoming clothoid and the circular curve, while a fairly low value (
IS4 = 0.73) between the circular curve and the outgoing clothoid is observed. This indicates that the user steered while driving along the circular arc.
Regarding the fifth proposed indicator, the C1 curve (
Figure 7a) exhibits a constant trend—equal to the maximum steering angle—only for the second half of the circular curve. The first section is used for steering, and this suboptimal behavior is confirmed by a rather low value of this indicator (
IS5 = 0.83).
The second curve (C2,
Figure 7b) has a much smoother
SA trend in the circular section, which is well captured by the indicator, equal to 0.92.
C3 and C4 (shown in
Figure 7c and
Figure 7d, respectively) have values similar to C1 (
IS5 = 0.84 and 0.86, respectively). The driver in these curves steered impulsively, but the result can be considered acceptable.
Overall, all the proposed indicators effectively represent the behavior of the functions in the four different curves and are all essential for understanding the observed phenomenon. For instance, in the case of the last indicator (IS5 = SACir), C1, C3 and C4 show a similar result, but the graphs are quite different. However, the other indicators (e.g., IS3 = SA(CloCir)In) highlight a different behavior at the beginning of the circular section and therefore help in defining the steering angle function more completely.
4.2. SS
Regarding the four curves,
IS6 and
IS7 (
SS(Clo)In and
SS(Clo)Out, respectively) are quite far from the theoretical value of 1 (ranging between 0.29 and 0.50) due to a function behavior, which is far from the theoretical behavior. However, the indicators seem to work very well. The highest value (
IS6 = 0.50) is related to the incoming clothoid of the first curve (C1,
Figure 8a), where the function resembles a constant behavior. On the contrary, the value assumed by
IS6 in the outgoing clothoid of C3 (
Figure 8c) is the lowest, at 0.29. Certainly, the function has a very irregular behavior, far from the ideal one. However, for this variable, referring to the maximum value of
SS in the entire curve is also convenient for identifying even possible peaks obviously deleted by the average. For example, C2 (
Figure 8b) presents a negative peak on the outgoing clothoid, which is not highlighted in the corresponding index (
IS7) but is much better detected by the maximum value in the entire curve (135.44 degrees/s). The last indicator
IS8 =
SS(Cir) is structurally like the first two and presents the same difficulties, which can be overcome with knowledge of the maximum value.
4.3. Strengths and Limitations
The
SA and
SS indicators are quite different from those based on proactive procedures [
25,
26,
27]. The latter are calculated through knowledge of the geometric and physical characteristics of the infrastructure under investigation, while those proposed in this paper can only be determined via knowledge of the driving behavior and, in particular, some performance variables. In this regard, it would be convenient to calculate these indicators at the end of a comprehensive process for safety evaluation: first, the reactive-type indicators should be calculated based on accident data; subsequently, calculation of the proactive indicators should be carried out, which are deducible from the characteristics of the infrastructure and easily geo-referenceable; only lastly could the analyst apply more in-depth performance indicators, such as the
SA and
SS.
In recent decades, scientific research has produced numerous indicators useful for quantifying road safety. Among these, the references reported in the Introduction section allow the deduction of some considerations of particular interest, which confirm the correctness of the procedures proposed in this paper:
- -
For about twenty years, the target has been to derive a relationship between road safety and driver performance [
13,
14] without considering any relationship with road alignment. Recent new technologies make it possible to carry out these investigations at sufficiently low costs compared to the situation in the past.
- -
Very often, driving behavior has been summarized using elementary statistical procedures (e.g., mean, or standard deviation) applied to the variables of interest [
18]. The result is not always sufficient, especially when the functions describing these variables in time or space are very complex, and the use of statistical operators could cause the loss of localized information [
11,
19,
20,
21].
- -
Based on these considerations, it is opportune to represent the complexity and variability of driving behavior with many indicators, so that each of them contributes to the overall knowledge of the phenomenon [
11,
24,
33]. These indicators must be referenced to geometric elements of the road as straight lines, circular and transition curves, so that the manager can make the necessary changes to the infrastructure if he or she deems them useful.
In summary, the objective of this research is to propose some indicators to relate the physical aspects of vehicle motion to the individual geometric elements of the road. Therefore, in this phase, the aim was not to determine the safety of a sample of users traveling along a road but rather to propose synthetic indicators able to represent the complexity of the physical variable investigated through a single value referring to an acceptance threshold.
The numerical results obtained do not have general relevance, both because they were obtained from a single driver and because the road examined represents a very particular context. Furthermore, the indicators depend on the expected trends of variables according to the general hypotheses of Italian road standards. In fact, under the conditions of uniformly accelerated motion, the SA and SS assume very precise ideal trends with reference to the transition curves or the circular sections of the curve. The proposed indicators allow the determination of any deviation from the ideal trend in these parts of the alignment, thus determining a complete overall judgment on the maneuver.
As mentioned before, the indicators measure the performance in terms of steering while traveling on a road at certain points of the curve (beginning and end of clothoids and circular arcs), but their values could depend on the users’ personal capabilities (skills, age, driving experience). When the indicators are applied on a large scale, it will be in the researcher’s interest to investigate appropriate samples of users with homogeneous characteristics. Whomever these samples comprise, the indicators will always return a value, which can be compared with the acceptability thresholds in order to evaluate the safety of the road section examined.
5. Conclusions
The present study arises from the need to synthesize certain continuous variables representing driving performance through appropriate indicators. Typically, in the literature, these variables are simplistically and uncritically summarized in terms of mean and standard deviation, resulting in loss of some valuable information.
In order to overcome these limitations, in this paper, several indicators were proposed for each of the performance variables considered. Their effectiveness was tested via simulated driving along four planimetric curves with different radii and directions.
The numerical value of the indicators, which synthetize continuous functions and can be used for evaluating driving maneuvers, can be used for subsequent analyses (newly derived indices, statistical analyses, etc.), where big data are not easily manageable.
The results in a real environment could be very different from those obtained in a simulated environment, but the ability to capture useful information remains perfectly valid in both cases. In this regard, the greatest value of the proposed indicators is their vast generality: they can equally well represent different types of users as well as infrastructures with different functional classes without losing their significance.
The future directions of this research must include the application of samples of certain drivers within different road contexts to confirm their ability to represent driving behavior in general terms. A further step should include validation of the indicators both on an existing road and in a simulated environment, where previously tested real conditions are reproduced as faithfully as possible.
Obviously, experimentation in other road contexts and with different classes of users could produce different numerical results without affecting the indicator structure. While maintaining the acceptance limits, managers can interpret these values differently depending on the cases and specific scenario characteristics.
The result of the indicators will depend on driver performance along the curve in terms of steering and, consequently, on his or her psycho-physiological characteristics. Homogeneous samples of users could be analyzed in order to deduce dedicated steering behavior models. In this way, it would be possible to evaluate more precisely the eventual deviation of a user from the considered class.
Finally, these indicators, which relate human behaviors to the geometry of specific road sections, could feed special repositories or Web-GIS platforms and could be really useful to motorists and infrastructure managers to improve safety. [RW2-2] In particular, the idea is to transmit the raw data of all users acquired via integrated sensors in their vehicles to cloud-based digital platforms, where they can be processed, in order to derive and properly analyze the performance indicators. In this way, the total information obtained can be returned and used by different key actors, including drivers, road operators and other stakeholders, to suggest eventual improvements or corrections.


