Article

Electrification of Transport Service Applied to Massawa–Asmara

1
Department of Energy, Politecnico di Milano, Via La Masa 34, 20156 Milan, Italy
2
CanmetENERGY Research Centre, Natural Resources Canada, 1 Haanel Drive, Ottawa, ON K1A 1M1, Canada
3
Design Department, Mobility and Transport Laboratory, Politecnico di Milano, Via Candiani 72, 20158 Milano, Italy
*
Author to whom correspondence should be addressed.
Infrastructures 2023, 8(8), 121; https://doi.org/10.3390/infrastructures8080121
Submission received: 7 June 2023 / Revised: 24 July 2023 / Accepted: 28 July 2023 / Published: 1 August 2023

Abstract

:
Considering the proposed strict new constraints of public authorities, decarbonization has become a key trend in recent years. Although several countries have started the process of decarbonization through the introduction of electric vehicles in their public services, for many countries, especially developing countries, transportation is still a hard sector to decarbonize. The presence of obsolete and polluting vehicles discourages citizens from using public transport and thus incentivizes the use of private vehicles, which create traffic congestion and increase emissions. Based on these considerations, this paper aimed to implement a simulation for a public service in Eritrea, evaluating whether it is possible to take a long trip using an electric minibus. A case study is implemented highlighting the barriers of electrifying transportation in this area, producing results on fuel consumption and service reliability. In the case study, four scenarios are presented to estimate the service. The scenarios evaluate the possibility to perform from three to five recharges. Fewer charges mean longer charging time, leading to a 2 h charging phase in Scenario 1, while recharging more than twice along the route will lead to shorter 30 min charges, as in Scenario 3. The case study also highlights the relevance of the slope in electric vehicle performance, as reported for the case of Asmara–Massawa travel ( E c o n s = 6.688 kWh). Finally, an environmentally sustainable solution, such as a 92 kWh/day photovoltaic plant, is proposed to power the service.

1. Introduction

The 2021 United Nations Climate Change Conference and COP26 highlighted, promoted, and reaffirmed the ambitious goals set by the European Community related to the reduction in greenhouse gas (GHG) emissions. Climate change, which has become increasingly evident in recent years, is causing floods, droughts, and storms globally, and global warming has also become an issue of particular concern.
From a policy perspective, there has been a strong effort to establish decarbonization policies to reduce global net emissions to zero by 2050 in many sectors. Despite these efforts, GHG concentrations in the atmosphere and average global temperatures will rise [1,2,3]. It is estimated that the transport and mobility of people and the goods sector account for about 30% of global CO2 emissions, second only to the sector related to electricity generation [4].
Decarbonization policies adopted at the national level and then by individual countries are different: they can, for example, refer to light transport (e.g., electric car sharing and carpooling), heavy transport, and public transport. Regarding the latter, some countries have started the decarbonization process by renewing bus fleets, especially in urban areas. This measure basically consists of two issues: (i) replacement of the most polluting diesel- or gas-powered vehicles; (ii) promotion and improvement of transportation service.
The first issue is the most impactful because it requires a lot of resources, both economic and time, and because it involves several actors (transportation company, administration, etc.). In this way, it is possible to reduce local emissions and traffic congestion (reducing the number of private cars, often characterized by a low occupancy coefficient), improving the air quality index and the quality of life of inhabitants [5,6,7,8,9]. Linked to this challenge, the study of the optimal positioning of infrastructures for recharging electric vehicles represents a non-negligible objective for current mobility [10,11].
These policies, measures, and strategies may work well in European countries that are highly developed and already have significant infrastructure; however, it must be considered that unfortunately, there are several regions of the world where this green transition is more difficult for at least two reasons: (i) a very limited number of electric vehicles (EVs) and (ii) an absence of electric infrastructure that can support and encourage this transition. From a quantitative point of view, in the sub-Saharan African region, it is estimated that about 20% of the population in urban areas do not have access to electricity.
This percentage increases to 70% in rural areas [12,13,14]. As a result, this condition has a strong impact on public transport planning and management where fleets are composed of old and polluting vehicles; in fact, it creates a slowdown in the decarbonization process. In addition, in rural areas, it is also necessary to consider that travel takes place on routes (roads) that are on average long and not always comfortable, thus representing an obstacle for EVs. However, the continued development of EVs means that nowadays this type of technology and market is ready to land in developing countries as well. On the one hand, EVs have become more reliable and higher-performing, and on the other hand, infrastructure is beginning to be more easily accessible [15,16,17]. Moreover, since EVs represent deferrable loads, they can represent an opportunity for the development of microgrids, enabling the possibility of vehicle–infrastructure integration and interaction [18]. With this in mind, the goal of this paper is to assess the technical feasibility of using an electric vehicle (EV) on a challenging route in terms of length and slope. The analysis focuses on the implementation of an all-electric suburban minibus service in a developing country. The selected case study is the road connection between the cities of Asmara (the Eritrean capital) and Massawa (the country’s main port). The end of the war, the need for new infrastructure, and the economic and tourist development through which the country is going can represent a driver towards sustainable mobility for this developing country. The route was chosen both for practical reasons, the connection between the two most important cities, and for technical reasons, the significant height difference and the distance between the cities represent a unique challenge for a service that wants to use EVs. Furthermore, the high availability of solar radiation (6 kWh/m2/day) [19] in the region would favor the development of a service powered by green energy. Therefore, the chosen case study aims to be a test bed for testing an extra-urban service in a developing country, in order to be transferred to other regions, all using clean energy.
The paper is organized as follows. Section 2 is a literature review of the transport electrification trend and its consequences. In Section 3, the case study is presented, starting with route and vehicle definition. In Section 4, simulations are performed, and results are provided. The results are presented and discussed in Section 5, also evaluating the possibility of powering the service through renewable energy sources (RESs). Finally, the conclusions emphasize the possibility and desirability of implementing this service in a sustainable way.

2. Literature Review

The transition from ICE (internal combustion engine) vehicles to EVs has become the main trend in current mobility. EVs represent the most usable method to lower CO2 emissions related to the transport sector [20,21,22]. EVs represent the best solution in terms of efficiency, and through careful driving, they can also allow the recovery of energy from braking [23,24]. Although the emissions related to the activity of the vehicle would be significantly reduced, since EVs would have no emissions, considering the entire LCA (life cycle assessment) not even electric vehicles would be completely green, despite having a significantly lower impact [25]. The simplest method to further reduce the environmental impact of EVs is to make charging as sustainable as possible. This can be achieved using renewable energy systems (RESs) in the electricity grid. It should be emphasized that the inclusion of photovoltaic (PV) panels can increase the variability of production, although there are transferable methods to ensure uniformity of production [26,27]. To assist RESs, it is possible to combine the PV plant with a storage system, which can give reliability to the grid, supplying power when required by the connected loads. The presence of EVs on the one hand can represent a challenge, since it increases the electrical load of the network and at the same time its variability [28]. On the other hand, the presence of EVs could represent an opportunity if the network were suitably managed through algorithms that optimize the management of vehicle batteries, applying vehicle-to-grid (V2G) [29,30,31]. V2G generally represents the interaction and bidirectionality of the network with the EVs. V2G can represent a profitable opportunity not only for users but also for the grid manager, who would have a more resilient electricity grid thanks to a less variable and more uniform load. These load curve damping practices are called load leveling and represent a topical issue for the electricity grid, which with the addition of EVs will have to become more flexible. In developing countries, the transition to EVs also represents an opportunity for the development of a wider and more resilient network, capable of covering more rural regions.
Despite all the advantages of EVs, it must be recognized that there are several limitations. Range anxiety is still the prevailing disincentive to buying an electric vehicle, but not the only one [32]. Charging infrastructure has not yet reached a high enough amount for user perception. In addition to this, many users believe that the recharging times are excessive. To overcome these problems, funds have been allocated for the development of the recharging infrastructure network. The recharges are always shorter thanks to the high power that the new charging stations (CSs) are able to transmit. Furthermore, vehicle batteries always have greater capacities and are increasing in performance [33,34,35]. Although for batteries it is difficult to say that there is a net zero emission disposal, it should be emphasized that when EV batteries are replaced because they have reached a state of health (SoH) that is not acceptable for traction, they can be used for stationary applications, such as frequency regulation or to assist PV plants in production management [36,37]. Furthermore, V2G has not yet been completely cleared by customs, since the continuous mini-cycles of charge and discharge affect the SoH of the battery and the practice is currently not regulated and therefore not remunerated [38,39].

3. Case Study Implementation

The first step for the implementation of a road electrification case study is the selection of the path. The path identified for the evaluation is in sub-Saharan Africa, in a low-income country (Eritrea) and connects its two main cities [40]. The electrification of this road can bring benefits in terms of emissions reduction and increment in life quality for people who live in the surroundings of this road. The road was built from 1935 to 1938 to create a connection between the main port on the Red Sea, Massawa, and the capital, Asmara. The cities were previously connected also using a rail infrastructure with a narrower gauge in order to reach the altitude of the capital, but during the 1970s, this was lost due to the war with Ethiopia, making the road the only way to connect Massawa and Asmara [41]. In the beginning of the 2000s, the rail infrastructure was restored, but the importance of the road connection between the cities was not dampened. Over the years, especially after having signed a peace with Ethiopia and the opening, albeit regulated, of the borders, Eritrea has increased the traffic of visitors linked to tourism [42]. Massawa has a long history that attracts history buffs; in fact, it was constructed in the nearby port of Adulis, one of the most important ports in the region until the eighth century [43]. In addition to history, however, Massawa also host the archipelago of the Dahlak Islands, which attracts tourists and diving enthusiasts, thanks to its coral reef [44]. This new wave of tourism can require the decarbonization of this path; in fact, the operating Eritrean airport for passengers is located in Asmara, and to reach Massawa, the road is still the main connection, even if is still used by pollutant and outdated vehicles, which moreover require the fixed cost linked to oil, which in the region is not cheap [45]. However, the touristic attraction is not located only in Massawa and the capital, Asmara, famous for the recent history in the last century, but also along the entire road connection between the two cities. Therefore, due to the presence of inhabited centers and attractions, the renewal of the suburban transport service between Asmara and Massawa has become an issue. The road connection between Massawa and Asmara and its points of interest are illustrated in Figure 1.
Focusing on the road infrastructure, in order to achieve decarbonization, it is first necessary to identify the characteristics of the route. The road is 113 km long, and to cross it, at least 2 h are required. However, the distance is not the only obstacle to electrification: Massawa is located at sea level (0 masl), while Asmara is sited on a plateau whose altitude is 2323 masl. Moreover, since the route is narrow and sinuous, the use of 12 m or longer buses is unpleasant for drivers and passengers. Therefore, the usage of a shorter electric minibus, based on the Fiat Ducato Maxi Cabinato, 5.7 m long, with a reduced onboard capacity of 22 seats, is preferred, and its characteristics are reported in Table 1 [46].
As reported in many studies, high slopes can significantly affect the reliability of range estimation of an EV [47]. It is clear that in the uphill phase, the vehicle will consume significantly more than in the downhill phase, which will have reduced fuel consumption thanks to the use of regenerative braking. Based on this consideration, the case study will take into account the two phases of the service, in order to be as reliable as possible, considering both the worst case and the best case in terms of consumption.
Considering the nominal maximum range of the minibus, the length of the line, and the slope, it is impossible for the vehicle to cover the road from Massawa to Asmara without at least one charging stop. Therefore, one to three charging stops are considered along the route in addition to the two at the terminals. The two alternating current (AC) slow-charge CSs, whose charging power is 22 kW, are located at two points based on the proximity of inhabited centers and facilities for tourists, who can enjoy the areas while the EV charges the onboard battery. The slope profile with the different stops and the CSs from Massawa to Asmara are shown in Figure 2a and in Figure 2b the downhill route is shown.
As shown in Figure 2, the locations selected for the CSs along the route are Gahtielay, Ghinda, and Nefasit, respectively 40 km, 61 km and 83 km from Massawa. Although the insertion of a single column may be sufficient to meet the charging requirements of the minibus, the necessity to charge the vehicle at 22 kW AC would impose long charging time, which would make the transport service uncomfortable. Therefore, three distributed charges are considered on the line. These allow the passengers to rest in service areas or enjoy the surroundings, such as in the case of Nefasit, located near Debre Bizen, the most prominent beacon and symbol of Christianity in Eritrea [48]. Based on this consideration of the route, the service implemented is presented in Figure 3.

4. Methodology Adopted for the Simulation

This section discusses the modeling of the EV by considering the forces that interact with it during transit. The forces that influence vehicle motion along the longitudinal axis include the powertrain (including, in selected models, traction control), the brakes, the aerodynamic drag, and tire-rolling resistance, as well as the influence of gravity when the car is moving on a road with a nonzero inclination (or gradient).
The algorithm developed and integrated into the AnyLogic software aims to calculate the power consumption, travel time, and charging time of the vehicle studied in the present work [49]. Thus, the modeling of the vehicle and its integration within the simulator is taken into account.

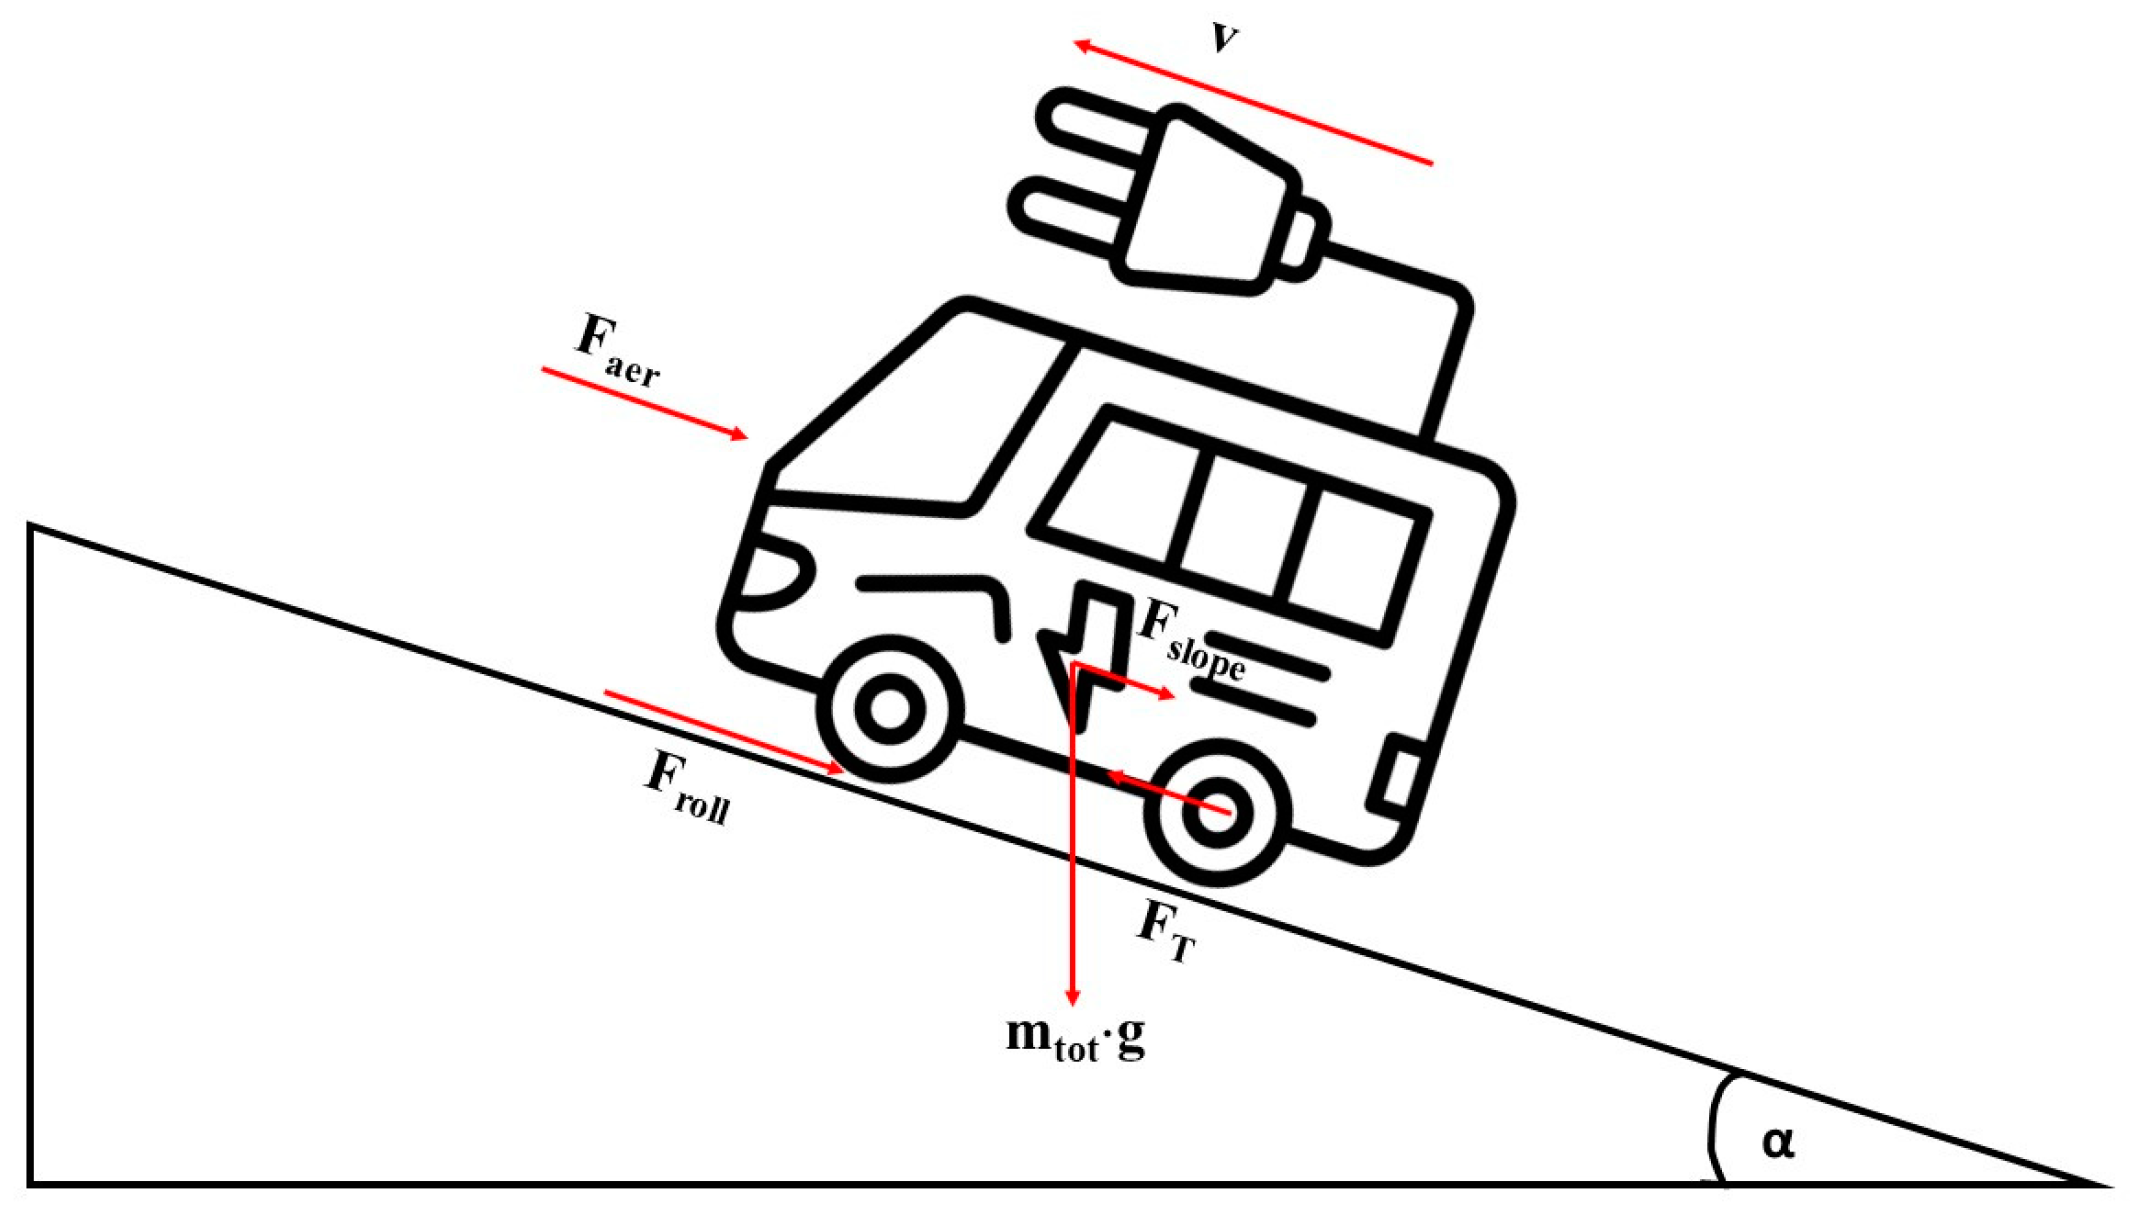
4.1. Electric Vehicle Modeling Description

The minibus will have to make the journey from A (Massawa) to B (Asmara). The active force (traction or breaking) F r is determined by the following equation:
F r = R + m e a
where m e is the equivalent mass, a is the acceleration of the vehicle, and R is the resulting resistance forces. However, considering that for the simulations, given also the peculiarity of the road, a constant speed of 50 km/h were maintained, in this case, the equivalent m e turns out to be zero.
During movement, the vehicle has to undergo various types of resistance, particularly due to slope ( R s l o p e ), rolling ( R r o l l i n g ), and finally aerodynamics ( R a e r ), the force acting opposite to the relative motion of any object moving with respect to a surrounding fluid. Curvature resistance and inertial force are neglected in this model and will not be discussed. Figure 4 shows forces acting on a vehicle in motion.
These types of resistance can be modeled as follows:
  • R s l o p e = m · g · sin α , where m is the total mass (full load) of the vehicle, g equals 9.81 m / s 2 , α is the angle of the slope, and s i n (α) is expressed per thousand (‰).
  • R r o l l = f v · m · g , where f v is the rolling resistance coefficient (0.02), m is the mass (full load) of the vehicle, and g is the acceleration gravitational constant of 9.81 m / s 2 .
  • R a e r = 1 2 · ρ a i r · A · C v · v 2 , where ρ a i r is 1.25 k g / m 3 , A is the frontal area of the vehicle, C v is the drag coefficient of the vehicle, and v is the speed at which the vehicle is moving, although in this case, it will have a constant value.
At this point, one can proceed to calculate the two powers involved:
  • Mechanical power— P m e c h = R r o l l i n g + R e r o d y n a m i c + R g r a d e · v
  • Electric ower— P e l e = P m e c h η T W + P a u x , where η T W is the tank-to-wheel efficiency and is assumed to be 80%, while P a u x represents the power of auxiliaries (e.g., lights, air conditioner, etc.).
These formulae are used to implement the power consumption that affects the EV while moving along the road.

4.2. Model Description

In order to support the development of new road infrastructure or to predict traffic flows in the various components of the transport system, transport models based on a macroscopic approach are used in which aggregate data are set. Despite being incredibly efficient computationally, the behavior of individual vehicles, i.e., their decision-making processes, such as where, when, and how long to charge the batteries, are not taken into account by macroscopic models because they are too coarse. For this reason, they are less suited to analyzing the effects of various deployment scenarios for charging infrastructure. Since the objective of this study was to implement a public service and highlight the barriers to transport electrification in a certain area, agent-based models, where each agent is simulated independently, can be used to better understand the impact of a certain charging infrastructure (microscopic approach). By following this approach, the model is developed according to the multi-method simulation of AnyLogic software [50]. AnyLogic is simulation software for industrial and business applications. It includes a graphical modeling language, state chart, and flowchart and allows the user to extend simulation models with Java code. Moreover, this software combines the three paradigms of the simulation modeling (discrete event, agent-based, and system dynamic) in order to build highly complex simulation models. The model developed for this research comprises three agents: the road section, charging station and electric, vehicle. “Agent” is the main building block of the AnyLogic model, and it is a unit of model design that can include behavior, memory (history), timing, contacts, etc. The road section Agent is realized using the tool GISmap (map based on a geographic coordinate system that is downloaded in real time from special online map services, such as OpenStreetMap) while charging station and electric vehicle agents are realized using a population of agents, through the paradigm Agent based.
The model is solved iteratively, and for each iteration (1 s), variations in the travel plan of the agents are introduced. For the model to give accurate results, several elements are needed:
  • Input data in order to create the electric vehicle agent, with corresponding characteristics (e.g., vehicle type, weight, charging connections, type, and battery capacity onboard).
  • Transport network in which the agents move, with an adequate level of discretization, specifying the road slope and the charging infrastructure available (specifying the number of charging connections, type, power capabilities, geographical location).
  • Calibration data (e.g., battery charging process as a function of the capacity and state of charge (SoC) to validate the modeling approach and results.
In order to limit the size of the model and keep it solvable, several assumptions are made. The electric vehicle travels at a constant speed, as driving lanes and acceleration/deceleration profiles are excluded. Charging is always performed at the highest possible power (depending on the limitations of the battery and the charger), and charging losses are not considered.

5. Results and Discussion

This section reports the results obtained via the simulation model and is composed of a first part referring to the outward trip of Massawa–Asmara and a second part that deals with the return journey of Asmara–Massawa. Being an uphill stretch with a difference of 2323 m between the departure and arrival points, the outward journey proves to be the most problematic and most interesting part in the analysis of the results. For this reason, different scenarios of the outward journey are simulated with the AnyLogic software with the aim of optimizing the distribution of the charging infrastructure and charging times. For each scenario, the results of energy-consumed profile, SoC profile, the charging times, and total travel time are reported. It is assumed that the driver will plan ahead, and thus the EV starts the simulation with an SoC of charged battery equal to 80%. Before the simulation starts, a plan for the travel is set up for the electric vehicle, specifying the route that should be followed to accomplish the travel. This plan also includes the charging stops, which will be carried out at CSs encountered during the route. The factor that varies between the scenarios is the distribution of the charging infrastructure: the number of CSs along the path and the SoC target. Deducing the energy consumption profile in the various scenarios is the same because of the motion of the electric vehicle. Finally, the calculated EV power consumption is affected by both internal factors, such as air-conditioning or heating, which are represented by the P a u x term used to calculate electric power, and external factors, such as road slope. The results may not be reproduced exactly under actual driving conditions in the field. However, it is important to note that the use of simulation is a valuable tool for understanding and evaluating the behavior of a system prior to large-scale testing in the field. Simulation provides an opportunity to examine a wide range of scenarios and driving conditions that may be difficult to reproduce in reality. It also allows the effects of various factors that might affect the system to be studied without incurring the high costs and risks associated with field testing. Thus, although the results of a simulation study may not be directly replicable in real driving conditions, accurate validation of simulation models through field testing is critical to ensure their validity and provide a sound basis for analysis and evaluation of the system in question.

5.1. Massawa–Asmara: Scenario 1

Scenario 1 is used as a reference case for comparison, since it is declared the “worst case scenario.” This scenario has three CSs along the route, located in Massawa ( C S 1 ), Ghinda ( C S 2 ) and Asmara ( C S 3 ) . The results of the SoC and energy consumption profiles obtained from the simulation of scenario 1 are shown in Figure 5.
The following scenario is defined the “worst case scenario,” due to the fact that it is the borderline case. The EV reaches C S 2   G h i n d a and C S 3 (Asmara) with a reduced SoC, even lower than 10%. This situation is not acceptable for an electric transport service since it inevitably increases passenger anxiety. For this reason, an improvement in the charging infrastructure is necessary to make the route more accessible to an electric vehicle. The travel time, 6 h 13 m, is strongly influenced by the long charging time carried out at C S 2 , which is necessary to reach the destination. The battery percentage (SoC) to be reached via charging is set at 80%, as numerous studies state that staying within the 20–80% range allows for faster charging and increased longevity [26]. Table 2 shows the travel time and charging times for C S 2 and C S 3 .

5.2. Massawa–Asmara: Scenario 2

Scenario 2 may be used as a reference case for comparison since it is declared “worst.” Scenario 2 is characterized by an improvement in the distribution of the charging infrastructure. Two more charging stations are added: one in the town of Gathelay ( C S 2 ) and the other in Nefasit ( C S 4 ). In this way, the electric vehicle receives four charges of reduced duration compared to scenario 1. It can be seen from Figure 6 that during the whole journey, the SoC of the electric vehicle stays within the 40–80% range and never reaches values equal to or less than 10%. In this way, a safe travel itinerary is obtained for an electric vehicle user, reducing to zero the possibility of discharging the battery during the journey.
As shown in Table 3, the SoC target set in the simulation is equal to 80%, thus obtaining recharging times of 1 h each. The improvement in this case is effective and leads to a reduction in range anxiety. For this reason, scenario 2 is more appropriate for this case study than scenario 1.

5.3. Massawa–Asmara: Scenario 3

It is deduced from the results obtained in scenario 2 that the ideal distribution of charging infrastructures for the case study is identified. Subsequently, in scenario 3, proceed to optimize the charging times along the route, reducing the SoC target from 80% to 60% (except for C S 5 , so that the SoC of the electric vehicle for the trip Asmara–Massawa is set to 80%). As Figure 7 shows, the SoC fluctuates in the 20–60% range for the entire trip, except for the first 25 km, since the electric vehicle has an initial SoC of 80%.
By reducing the SoC target from 80% to 60%, it is noted that the recharging at C S 2 is of decreased duration compared to Scenario 2, with a recharging time of approximately 30 min, while for C S 3 and C S 4 , it remains unchanged. The charging times of scenario 3 are shown in Table 4.

5.4. Asmara–Massawa

If the climbing phase requires the evaluation of multiple scenarios to optimize the charging stops, the descent phase is much easier for the electric vehicle. In fact, from the performed simulation, due to the negative slope and the use of recovery braking, no stop is required for any charging phase, as shown in Figure 8.
The result may seem unusual, but it has to be considered that in the model developed, the vehicle is running at a constant speed of 50 km/h; therefore, whenever a negative slope occurs, the electric vehicle needs to slow down in order to keep the speed constant, activating regenerative braking. In this way, the kinetic mechanical energy is transformed into electrical energy to be stored in the traction battery of the vehicle. Since the electric vehicle does not need to recharge to reach the city of Massawa, the travel time is radically reduced, equal to 2 h 13 m, with a difference in the SoC between the departure and arrival points equal to 11%, which converts correspond to a total energy consumption of 6.688 kWh.
In the four different scenarios, consumption is analyzed through vehicle travel, while also evaluating the service through recharging times. It should be noted that the times linked to recharging are currently not satisfactory and reflect the difficulties encountered in mobility trends. However, it should be specified that the currently existing service is also less efficient, and the buses are outdated. In addition, the CSs used have a power of 22 kW, which are not used for fast charging normally, and thus for the future it is desirable to install CSs capable of delivering more power [51]. Considering the low power demand required by the service, it is possible to implement microgrids in the proximity of the CS locations, powered by PV panels sustained by storage banks to avoid instabilities, to supply the CSs. The selection of a PV power plant is strictly linked to the high solar radiation availability of the region, about 6 kWh/m2/day [19]. In order to satisfy the power requirements of the vehicle, the peak power of the plant will be 22 kW, the maximum power transferrable from the CS to the EV. To perform this brief simulation, the software Homer Pro and Global Solar Atlas were used [52,53]. In that region, to have that peak power, considering a high load variability, such as the one proposed, using a generic monocrystalline flat plate PV, with an efficiency of 13%, the required PV plant size is 350 m2. Therefore, based on this consideration, the daily production will be 92 kWh. Based on the difference in the bus service, the size of the plant can be reduced, using also batteries to store the energy produced that is not used immediately. Moreover, in sub-Saharan region, where electricity access represents an issue, the production of excess electricity can represent an opportunity for locals to improve their life quality [54,55,56]. Figure 9 shows some possible locations next to the bus stops where is possible to place the PV panels to support the CSs.
Currently, the users interested in this service would only appear to be tourists, who would agree to stop in the areas for more than half an hour, where they can appreciate the local attractions. However, if the service along the line were to increase and the infrastructure increased its power, it would be possible to reduce waiting times, providing a reliable service for habitual users, who currently do not have a reliable service. Finally, considering the European and global framework on the decarbonization trend, the case study presented aims to provide a repeatable and scalable example for the decarbonization of the transport sector, feeding it with sustainable energy. The major global players and stakeholders are encouraging decarbonization through stringent incentives and policies [57,58,59]. This model applicable to several case studies is supported by several already validated case studies [60,61]. The model allows one to have a quantitatively reliable idea of consumption and service times by providing a comparison, both for other models and for theoretical simulations.

6. Conclusions

The constraints proposed by public authorities have strongly encouraged decarbonization in recent years, and the transport sector is still one of the most polluting. Several countries have started to work on decarbonization through the replacement of obsolete vehicles in the local public transport fleet. However, for developing countries, this change is still a problem. The purpose of this paper was to analyze the possibility of decarbonizing traffic on one of the main roads in a developing country by starting with the use of an electric minibus, analyzing its consumption and the service provided. This led to the study of different scenarios trying to best optimize the service by analyzing the outward and return routes trying to understand if this sustainable mobility can be powered by a photovoltaic system. This work, therefore, highlights the possibility of increasing the penetration rate of electric vehicles in developing countries, whose adoption is still limited, through the use of a simulation model developed with AnyLogic software. Based on the obtained results, optimization of the charging infrastructure is performed to minimize the total travel time of an electric vehicle in a long-distance trip.

Author Contributions

Conceptualization, C.G.C., M.L. and A.S.; methodology, C.G.C., M.L. and A.S.; validation, W.Y. and M.L.; formal analysis, C.G.C., M.L. and A.S.; investigation, W.Y. and M.B.; resources, F.B.; writing—original draft preparation, C.G.C., M.L., W.Y. and A.S.; writing—review and editing, F.B.; supervision, M.L.; project administration, M.B. All authors have read and agreed to the published version of the manuscript.

Funding

This research received no external funding.

Data Availability Statement

Not applicable.

Conflicts of Interest

The authors declare no conflict of interest.

References

  1. Arora, N.K.; Mishra, I. COP26: More challenges than achievements. Environ. Sustain. 2021, 4, 585–588. [Google Scholar] [CrossRef]
  2. Eropean Commission. Communication from the Commission, The European Green Deal. Available online: https://eur-lex.europa.eu/legal-content/EN/TXT/?uri=CELEX%3A52019DC0640 (accessed on 11 July 2023).
  3. Eropean Commission, Communication from the Commission to the European Parliament, the Council, the European Economic and Social Committee and the Committee of the Regions. Sustainable and Smart Mobility Strategy—Putting European Transport on Track for the Future. Available online: https://eur-lex.europa.eu/legal-content/EN/TXT/?uri=CELEX%3A52020DC0789 (accessed on 11 July 2023).
  4. International Energy Agency-IEA. “Global Energy Review: CO2 Emissions in 2021”, Flagship Report—March 2022. Available online: https://www.iea.org/reports/global-energy-review-co2-emissions-in-2021-2 (accessed on 11 July 2023).
  5. da Silva, T.B.; Baptista, P.; Silva, C.A.S.; Santos, L. Assessment of decarbonization alternatives for passenger transportation in Rio de Janeiro, Brazil. Transp. Res. Part D Transp. Environ. 2022, 103, 103161. [Google Scholar] [CrossRef]
  6. Ku, A.; de Souza, A.; McRobie, J.; Li, J.; Levin, J. Zero-emission public transit could be a catalyst for decarbonization of the transportation and power sectors. Clean Energy 2021, 5, 492–504. [Google Scholar] [CrossRef]
  7. Hamilton, I.G.; Summerfield, A.J.; Shipworth, D.; Steadman, J.P.; Oreszczyn, T.; Lowe, R.J. Energy efficiency uptake and energy savings in English houses: A cohort study. Energy Build. 2016, 118, 259–276. [Google Scholar] [CrossRef] [Green Version]
  8. Ramanditya, W.; Riyanti, D.; Akihisa, M. Urban Experiments with Public Transport for Low Carbon Mobility Transitions in Cities: A Systematic Literature Review (1990–2020). Sustain. Cities Soc. 2021, 72, 103023. [Google Scholar] [CrossRef]
  9. Kouridis, C.; Vlachokostas, C. Towards decarbonizing road transport: Environmental and social benefit of vehicle fleet electrification in urban areas of Greece. Renew. Sustain. Energy Rev. 2022, 153, 111775. [Google Scholar] [CrossRef]
  10. Ullah, I.; Liu, K.; Yamamoto, T.; Zahid, M.; Jamal, A. Modeling of machine learning with SHAP approach for electric vehicle charging station choice behavior prediction. Travel Behav. Soc. 2023, 31, 78–92. [Google Scholar] [CrossRef]
  11. Saldarini, A.; Barelli, L.; Pelosi, D.; Miraftabzadeh, S.; Longo, M.; Yaici, W. Different Demand for Charging Infrastructure along a Stretch of Highway: Italian Case Study. In Proceedings of the 2022 IEEE International Conference on Environment and Electrical Engineering and 2022 IEEE Industrial and Commercial Power Systems Europe, EEEIC/I and CPS Europe 2022, Prague, Czech Republic, 28 June–1 July 2022. [Google Scholar]
  12. Trotter, P.A.; McManus, M.C.; Maconachie, R. Electricity planning and implementation in sub-Saharan Africa: A systematic review. Renew. Sustain. Energy Rev. 2017, 74, 1189–1209. [Google Scholar] [CrossRef]
  13. Worlbank. Access to Electricity, Urban (% of Urban Population)—Sub-Saharan Africa. Available online: https://data.worldbank.org/indicator/EG.ELC.ACCS.UR.ZS?locations=ZG (accessed on 11 July 2023).
  14. Worlbank. Access to Electricity, Rural (% of Rural Population)-Sub-Saharan Africa. Available online: https://data.worldbank.org/indicator/EG.ELC.ACCS.RU.ZS?locations=ZG (accessed on 11 July 2023).
  15. Ding, Y.-L.; Cano, Z.; Yu, A.; Lu, J.; Chen, Z. Automotive Li-Ion Batteries: Current Status and Future Perspectives. Electrochem. Energy Rev. 2019, 2, 1–28. [Google Scholar] [CrossRef]
  16. Deb, S.; Tammi, K.; Kalita, K.; Mahanta, P. Impact of Electric Vehicle Charging Station Load on Distribution Network. Energies 2018, 11, 178. [Google Scholar] [CrossRef] [Green Version]
  17. Bonges, H.A.; Lusk, A.C. Addressing electric vehicle (EV) sales and range anxiety through parking layout, policy and regulation. In Transportation Research Part A: Policy and Practice; Elsevier: Amsterdam, The Netherlands, 2016; Volume 83, pp. 63–73. [Google Scholar]
  18. Lemeski, A.T.; Ebrahimi, R.; Zakariazadeh, A. Optimal decentralized coordinated operation of electric vehicle aggregators enabling vehicle to grid option using distributed algorithm. J. Energy Storage 2022, 54, 105213. [Google Scholar] [CrossRef]
  19. Solargis. Massawa, Eritrea GHI. 2022. Available online: https://apps.solargis.com/dashboard/recent (accessed on 11 July 2023).
  20. Hannan, M.A.; Hoque, M.M.; Hussain, A.; Yusof, Y.; Ker, P.J. State-of-the-Art and Energy Management System of Lithium-Ion Batteries in Electric Vehicle Applications: Issues and Recommendations. IEEE Access 2018, 6, 19362–19378. [Google Scholar] [CrossRef]
  21. Yu, A.; Wei, Y.; Chen, W.; Peng, N.; Peng, L. Life cycle environmental impacts and carbon emissions: A case study of electric and gasoline vehicles in China. Transp. Res. Part D Transp. Environ. 2018, 65, 409–420. [Google Scholar] [CrossRef]
  22. Tang, B.; Xu, Y.; Wang, M. Life Cycle Assessment of Battery Electric and Internal Combustion Engine Vehicles Considering the Impact of Electricity Generation Mix: A Case Study in China. Atmosphere 2022, 13, 252. [Google Scholar] [CrossRef]
  23. Di Martino, A.; Miraftabzadeh, S.M.; Longo, M. Strategies for the Modelisation of Electric Vehicle Energy Consumption: A Review. Energies 2022, 15, 8115. [Google Scholar] [CrossRef]
  24. Heydari, S.; Fajri, P.; Rasheduzzaman, M.; Sabzehgar, R. Maximizing Regenerative Braking Energy Recovery of Electric Vehicles Through Dynamic Low-Speed Cutoff Point Detection. IEEE Trans. Transp. Electrif. 2019, 5, 262–270. [Google Scholar] [CrossRef]
  25. Tintelecan, A.; Dobra, A.C.; Marţiş, C. LCA Indicators in Electric Vehicles Environmental Impact Assessment. In Proceedings of the 2019 Electric Vehicles International Conference (EV), Bucharest, Romania, 3–4 October 2019; pp. 1–5. [Google Scholar] [CrossRef]
  26. Miraftabzadeh, S.M.; Colombo, C.G.; Longo, M.; Foiadelli, F. A Day-Ahead Photovoltaic Power Prediction via Transfer Learning and Deep Neural Networks. Forecasting 2023, 5, 213–228. [Google Scholar] [CrossRef]
  27. Miraftabzadeh, S.M.; Longo, M. High-resolution PV power prediction model based on the deep learning and attention mechanism. Sustain. Energy Grids Netw. 2023, 34, 101025. [Google Scholar] [CrossRef]
  28. Lu, X.; Liu, Z.; Ma, L.; Wang, L.; Zhou, K.; Feng, N. A robust optimization approach for optimal load dispatch of community energy hub. Appl. Energy 2020, 259. [Google Scholar] [CrossRef]
  29. Thomas, D.; Deblecker, O.; Ioakimidis, C.S. Optimal operation of an energy management system for a grid-connected smart building considering photovoltaics’ uncertainty and stochastic electric vehicles’ driving schedule. Appl. Energy 2018, 210, 1188–1206. [Google Scholar] [CrossRef]
  30. Mehta, R.; Srinivasan, D.; Khambadkone, A.M.; Yang, J.; Trivedi, A. Smart Charging Strategies for Optimal Integration of Plug-In Electric Vehicles Within Existing Distribution System Infrastructure. IEEE Trans. Smart Grid 2016, 9, 299–312. [Google Scholar] [CrossRef]
  31. Zheng, Y.; Niu, S.; Shang, Y.; Shao, Z.; Jian, L. Integrating plug-in electric vehicles into power grids: A comprehensive review on power interaction mode, scheduling methodology and mathematical foundation. Renew. Sustain. Energy Rev. 2019, 112, 424–439. [Google Scholar] [CrossRef]
  32. Pevec, D.; Babic, J.; Carvalho, A.; Ghiassi-Farrokhfal, Y.; Ketter, W.; Podobnik, V. A survey-based assessment of how existing and potential electric vehicle owners perceive range anxiety. J. Clean. Prod. 2020, 276, 122779. [Google Scholar] [CrossRef]
  33. Yang, X.-G.; Wang, C.-Y. Understanding the trilemma of fast charging, energy density and cycle life of lithium-ion batteries. J. Power Sources 2018, 402, 489–498. [Google Scholar] [CrossRef]
  34. Wang, L.; Qin, Z.; Slangen, T.; Bauer, P.; Van Wijk, T. Grid Impact of Electric Vehicle Fast Charging Stations: Trends, Standards, Issues and Mitigation Measures—An Overview. IEEE Open J. Power Electron. 2021, 2, 56–74. [Google Scholar] [CrossRef]
  35. Christopher, H.; Roya, A.; Felix, S.; Jan, F.; Matthias, J.; Dirk Uwe, S. 6th E-Mobility Power System Integration Symposium|The Hague. 2022. Available online: https://www.platformelectromobility.eu/2022/04/27/6th-e-mobility-power-system-integration-symposium-10-october-2022-delft-the-hague-netherlands/ (accessed on 11 July 2023).
  36. Bobba, S.; Mathieux, F.; Ardente, F.; Blengini, G.A.; Cusenza, M.A.; Podias, A.; Pfrang, A. Life Cycle Assessment of repurposed electric vehicle batteries: An adapted method based on modelling energy flows. J. Energy Storage 2018, 19, 213–225. [Google Scholar] [CrossRef]
  37. Maria Anna, C.; Francesco, G.; Sonia, L.; Marina, M.; Maurizio, C. Reuse of electric vehicle batteries in buildings: An integrated load match analysis and life cycle assessment approach. Energy Build. 2019, 186, 339–354. [Google Scholar] [CrossRef]
  38. Thompson, A.W. Economic implications of lithium ion battery degradation for Vehicle-to-Grid (V2X) services. J. Power Sources 2018, 396, 691–709. [Google Scholar] [CrossRef]
  39. Li, S.; Li, J.; Su, C.; Yang, Q. Optimization of Bi-Directional V2G Behavior With Active Battery Anti-Aging Scheduling. IEEE Access 2020, 8, 11186–11196. [Google Scholar] [CrossRef]
  40. UN-HABITAT, Regional and Technical Cooperation Division. Eritrea: National and Cities Urban PROFILE. 2020. Available online: https://unhabitat.org/sites/default/files/2020/10/eritrea_-_national_and_cities.pdf (accessed on 11 July 2023).
  41. Michael, M.; Tekleab, G.; Girma, B. Environmentally Conscious Least Cost Multi-Criteria Decision Making for Modeling Railway Network for Eritrea. Int. J. Sustain. Dev. Plan. 2021, 16, 427–436. [Google Scholar] [CrossRef]
  42. Edoardo, S.; Cheli, F. The road connecting Massawa to Asmara: Present Scenario and Future Perspectives for Increasing Road Safety. 2020, pp. 117–130, ISBN 9791280178176. Available online: https://re.public.polimi.it/handle/11311/1166216 (accessed on 11 July 2023).
  43. Zazzaro, C. The Ancient Red Sea Port of Adulis and the Eritrean Coastal Region: Previous investigations and Museum Collections; Archaeopress: Oxford, UK, 2013; ISBN 9781407311906. [Google Scholar]
  44. Azeria, E.T. Terrestrial bird community patterns on the coralline islands of the Dahlak Archipelago, Red Sea, Eritrea. Glob. Ecol. Biogeogr. 2004, 13, 177–187. [Google Scholar]
  45. Dansoh, C. The use of renewable energy for the provision of power to operate reverse osmosis desalination facilities at Massawa. In Desalination and Water Treatment; IntechOpen: London, UK, 2018. [Google Scholar]
  46. Green Vehicles. Cabinato FIAT Ducatomaxi. Technical Sheet. 2022. Available online: https://www.greenvehiclesitalia.com/minibus-elettrico/ (accessed on 11 July 2023).
  47. Anselma, P.G.; Huo, Y.; Roeleveld, J.; Belingardi, G.; Emadi, A. Slope-weighted energy-based rapid control analysis for hybrid electric vehicles. IEEE Trans. Veh. Technol. 2019, 68, 4458–4466. [Google Scholar] [CrossRef]
  48. Afsar Alam, M.; Kumar Mishra, N. Geo-archaeological endowments and the tourism development in Eritrea. Rev. Za Geogr. 2013, 8, 35–55. [Google Scholar]
  49. The AnyLogic Company. AnyLogic. Available online: https://www.anylogic.com/ (accessed on 11 July 2023).
  50. Kostopoulos, E.D.; Spyropoulos, G.C.; Kaldellis, J.K. Real-world study for the optimal charging of electric vehicles. Energy Rep. 2020, 6, 418–426. [Google Scholar] [CrossRef]
  51. Khalid, M.; Alam, M.; Sarwar, A.; Asghar, M. A Comprehensive Review on Electric Vehicles Charging Infrastructures and their Impacts on Power-Quality of the Utility Grid. eTransportation 2019, 1, 100006. [Google Scholar] [CrossRef]
  52. Globar Solar Atlas. Global Horizontal Irradiation, Sub-Saharan Africa. 2022. Available online: https://globalsolaratlas.info/download/sub-saharan-africa (accessed on 11 July 2023).
  53. Homer Energy. Homer Pro. 2022. Available online: https://www.homerenergy.com/ (accessed on 11 July 2023).
  54. Yan, Q.; Zhang, B.; Kezunovic, M. Optimized Operational Cost Reduction for an EV Charging Station Integrated With Battery Energy Storage and PV Generation. IEEE Trans. Smart Grid 2019, 10, 2096–2106. [Google Scholar] [CrossRef]
  55. Liu, Z.; Chen, Y.; Zhuo, R.; Jia, H. Energy storage capacity optimization for autonomy microgrid considering CHP and EV scheduling. Appl. Energy 2018, 210, 1113–1125. [Google Scholar] [CrossRef]
  56. Prăvălie, R.; Patriche, C.; Bandoc, G. Spatial assessment of solar energy potential at global scale. A geographical approach. J. Clean. Prod. 2019, 209, 692–721. [Google Scholar] [CrossRef]
  57. Tirunagari, S.; Gu, M.; Meegahapola, L. Reaping the Benefits of Smart Electric Vehicle Charging and Vehicle-to-Grid Technologies: Regulatory, Policy and Technical Aspects. IEEE Access 2022, 10, 114657–114672. [Google Scholar] [CrossRef]
  58. Mello, I.M.; Faustino, F.J.; Melo, J.D.; Feltrin, A.P. Greenhouse Gas Reduction Through the Introduction of Electric Vehicles in Urban Zones. In Proceedings of the 2020 IEEE PES Transmission & Distribution Conference and Exhibition—Latin America (T&D LA), Montevideo, Uruguay, 28 September–2 October 2020; pp. 1–6. [Google Scholar] [CrossRef]
  59. Bragatto, T.; Bucarelli, M.A.; Carere, F.; Santori, F. Transition to Electric Vehicles in a Company’s fleet: Design and Policy on a Case Study. In Proceedings of the 2022 7th International Conference on Smart and Sustainable Technologies (SpliTech), Split/Bol, Croatia, 5–8 July 2022; pp. 1–6. [Google Scholar] [CrossRef]
  60. Zammit, E.; Convello, A.; Leone, C.; Longo, M.; Yaici, W.; Foiadelli, F. Cost and Emission Comparison of Long-Distance Travel and Life-Cycle for EV and ICE Vehicle: A Case Study. In Proceedings of the 2022 IEEE International Conference on Environment and Electrical Engineering and 2022 IEEE Industrial and Commercial Power Systems Europe (EEEIC/I&CPS Europe), Prague, Czech Republic, 28 June–1 July 2022; pp. 1–6. [Google Scholar] [CrossRef]
  61. Brenna, M.; Foiadelli, F.; Leone, C.; Longo, M. Utilization of E-Bus Applied to Urban Lines. In Proceedings of the 2019 International Conference on Clean Electrical Power (ICCEP), Otranto, Italy, 2–4 July 2019; pp. 651–655. [Google Scholar] [CrossRef]
Figure 1. Massawa–Asmara Road connection, with points of interest.
Infrastructures 08 00121 g001
Figure 2. (a) Massawa–Asmara Road slope profile, with stops; (b) Asmara–Massawa road slope profile, with stops.
Infrastructures 08 00121 g002aInfrastructures 08 00121 g002b
Figure 3. Massawa–Asmara Road with stops and CSs.
Infrastructures 08 00121 g003
Figure 4. Forces acting on a vehicle in motion.
Infrastructures 08 00121 g004
Figure 5. Profile energy consumption (black line) and SoC (blue line), Massawa–Asmara, Scenario 1.
Infrastructures 08 00121 g005
Figure 6. Profile energy consumption (black line) and SoC (blue line), Massawa–Asmara, Scenario 2.
Infrastructures 08 00121 g006
Figure 7. Profile energy consumption (black line) and SoC (blue line), Massawa–Asmara, Scenario 3.
Infrastructures 08 00121 g007
Figure 8. Profile energy consumption (black line) and SoC (blue line), Asmara–Massawa.
Infrastructures 08 00121 g008
Figure 9. (ae) PV plant position for CS supply.
Infrastructures 08 00121 g009
Table 1. Electric minibus characteristics.
Infrastructures 08 00121 i001CharacteristicsValue
Length [m]5.7
Width [m]2.05
Hight [m]2.50
Full load mass [tons]5
Seats22
Li-ion battery [Ah] × [V]160 × 3.3
Battery voltage range [V]180 ÷ 380
Nominal power [kW]30
Peak power [kW]60
Auxiliaries [kW]4
AC power charging [kW]22
DC power charging [kW]150
Maximum current [A]400
Maximum speed [km/h]80
Nominal range [km]120
Table 2. Electric minibus characteristics.
Charging StationCharging TimeSoC Target after Charging Phase [%]
C S 2 , Ghinda02:02:2580
C S 3 , Asmara01:57:0180
Table 3. Charging times and SoC target, scenario 2.
Charging StationCharging TimeSoC Target after Charging Phase [%]
C S 2 : Gathelay01:02:5480
C S 3 : Ghinda01:00:2380
C S 4 : Nefasit00:59:2580
C S 5 : Asmara00:57:4680
Table 4. Charging times and SoC target, scenario 3.
Charging StationCharging TimeSoC Target after Charging Phase [%]
C S 2 : Gathelay00:29:4460
C S 3 : Ghinda01:00:2360
C S 4 : Nefasit00:59:2580
C S 5 : Asmara01:29:5180
Disclaimer/Publisher’s Note: The statements, opinions and data contained in all publications are solely those of the individual author(s) and contributor(s) and not of MDPI and/or the editor(s). MDPI and/or the editor(s) disclaim responsibility for any injury to people or property resulting from any ideas, methods, instructions or products referred to in the content.

