1. Introduction
The railway infrastructure is essential for promoting energy-efficient transportation, economic development, and reducing carbon emissions. However, bridges and viaducts, which are essential railway infrastructure assets, face issues due to age, overloading, lack of maintenance, and insufficient inspection. In order to compete with other means of transportation, railway infrastructure must be safe and reliable; therefore, digitalized bridge inspection and monitoring, especially in terms of geometry assessment, is crucial.
Traditional methods for bridge geometry assessment often rely on discrete dimensional measurements to verify any variations. These measurements are usually made when the noticeable movement of a structural component or visible damage is observed [
1]. However, this approach can be time-consuming and may not capture all potential points of interest in the structure. On the other hand, cutting-edge reality capture technologies provide a continuous dimension checking of all points of the structure, offering a comprehensive and detailed mapping of the bridge geometry. By rapidly and accurately capturing a vast number of data points, they minimize the need for multiple site visits and manual measurements, saving time and reducing labor costs [
2,
3].
To enhance inspection efficiency, robotics and remote sensing offer non-destructive, contact-free techniques for recording 3D as-is infrastructure conditions. Advances in robotics have resulted in low-cost and high mobility unmanned aerial vehicles (UAVs), boosting their usage in real-world applications such as civil engineering. UAVs provide remote visual inspections of large-scale civil engineering structures or 3D model generation [
4,
5,
6,
7].
Active and passive vision systems are both used in cutting-edge reality capture technologies. Active systems rely on their own light source for making measurements, while passive systems utilize the surrounding ambient light, images from multiple points of view, and geometry [
8,
9]. Each technique possesses unique strengths and limitations concerning speed, resolution, and scene depth. A hybrid system can integrate the advantages of both systems to maximize their benefits. Active systems are divided into techniques based on light detection and ranging (LiDAR) [
10,
11], triangulation [
12,
13,
14] and time-of-flight [
15,
16,
17]-based technologies. Passive systems include multi-view stereo [
18,
19] and structure-from-motion (SfM) [
20,
21] technologies.
Recent works are giving more emphasis to LiDAR and SfM systems [
9,
20,
22,
23]. LiDAR employs a laser to illuminate a target, and the sensor measures the time taken for the reflected light to return. Terrestrial laser scanning (TLS), also known as terrestrial LiDAR, is used to mitigate occlusion and involves the scanning of a structure from multiple angles. TLS has proven to be useful for surveying applications such as landslide characterization [
16,
17]. However, this method is more expensive, time-consuming, and challenging in comparison to passive systems, doing it less suited for geometry monitoring.
Structure from motion (SfM) creates a 3D model by merging a sequence of 2D images captured by a camera sensor from different locations and estimating the relative camera positions and orientations [
24]. Creating a 3D scene using CRP involves camera calibration, sequential picture capture, feature matching, spatial relationships, dense alignment, surface reconstruction, and texture matching [
9,
20]. SfM is less time-consuming than active systems for acquisition but takes more time for 3D reconstruction [
9]. SfM can achieve the point resolution similar to LiDAR but depends on the camera resolution and the quantity of images employed for 3D modeling.
The fusion of TLS- and CRP-based UAV techniques [
22,
23] helps to collect precise data, resulting in accurate 3D image-based representations of complex shapes. No single system can provide complete information on large-scale and complex structures. Therefore, the integration of TLS- and CRP-based UAV technologies enables the creation of complex-shaped models by using each technology with precise parameters that provide the best operational performance. Data from these technologies can be used to generate dense point clouds that offer a digital representation of the physical object.
Popescu et al. [
9] conducted a study to test the performance of TLS and CRP based on UAV, and infrared scanning integrated in a 3D camera, for the 3D geometric modeling of existing concrete railway bridges. The results indicated that all three methods could generate 3D models to varying degrees of completeness, with TLS and photogrammetry producing denser data than infrared scanning. Although denser point clouds offer better visualization, they require more processing time and storage. The study concluded that photogrammetry was the most cost-effective technology.
Khaloo et al. [
20] used the CRP-based UAV approach to generate a 3D model of a bridge for inspection surveys and accurate anomaly detection, as well as comparing the results with those obtained from models developed with TLS. The study found that the UAV inspection technique outperformed TLS in terms of comprehensiveness and resolution, producing superior 3D models with the accuracy required for infrastructure management. While TLS can record consistent point clouds without requiring specialist engineering expertise, CRP-based UAVs can measure distant spots not accessible by TLS or terrestrial photographs. Additionally, it can fill breaks in point clouds if the sections of objects are only evident from one measurement technique. The higher resolution of images compared to LiDAR could lead to an enhanced textured 3D model.
Chatzistamatis et al. [
22] and Luhmann et al. [
23] developed a hybrid approach combining CRP-based UAV and LiDAR to create an precise 3D model of a historic church for damage assessment. The study found that, for inaccessible locations, UAVs had a considerable advantage over TLS. However, no research was found on the use of hybrid processing systems on railway bridges.
When it comes to using CRP-based UAV for data collection on railway bridges, there is a unique challenge since an upward-facing camera is needed to capture images underneath the bridge’s deck, and very few UAVs meet this requirement. However, TLS sensors do not have this limitation as long as there is ground support under the bridge and the sensor is within range, although TLS over the deck is often not permitted due to safety concerns [
25].
Another method for digital 3D representation is that of bridge information modeling (BrIM), which is based on building information modeling (BIM) and composed of graphical and non-graphical information. The goal of bridge modeling is to create a digital model that records information for conservation and safe operation, as well as to provide a virtual tool for successful repair solutions [
10]. However, the BrIM model remains a static representation of the bridge and lacks real-time data.
To achieve the dynamic representation of the bridge, a digital twin (DT) can be used, which includes a management model that acts as a link between the physical and virtual counterparts [
26,
27,
28]. Alternatively, visual inspection or structural repair can be considered, although they require offline involvement [
29]. A functional DT should be capable of simulation, learning, and management [
28] and allow practical applications for bridge management systems (BMSs) [
30]. Chiachío et al. [
28] observed that there is no standardized viewpoint on the concept of DT in the field of structural engineering. They highlighted that most of the research conducted in this area focuses on using BIM models to provide the accurate geometric representations of physical assets and complement them with structural health monitoring (SHM) data. Jeong et al. [
26] and Adibfar and Costin [
27] developed a system that integrates BrIM with SHM to enhance bridge monitoring by collecting, storing, and analyzing data from sensors.
One of the interesting aspects is the interaction between the existing model generated by an active or passive vision system and the model offered by the design [
31]. Previous studies have shown the effectiveness of this approach in assessing local damages and failures, such as out-of-plane deformation on bridge components and using deviation analysis [
32,
33]. Moreover, it can detect any generic unintentional deficiencies in a bridge structure, such as gaps and loss of material. For quality assurance, the 3D as-designed model can be connected to a reality capture model.
This work aims to innovate the assessment of concrete railway bridge geometry using advanced reality capture technologies. Emphasizing the importance of thoroughly evaluating bridge geometry, considering current and historical data, provides valuable insights into the effectiveness and applicability of these cutting-edge technologies in accurately capturing and analyzing bridge structures. The specific focus areas of this work are included in the below list.
- -
The implementation of a reality capture framework using a hybrid vision system in railway bridges, for which practically no applications were identified in the current bibliography. Usually, the railway circumstances pose new challenges to reality capture due to the strict safety restrictions as well as the limited accessibility to railway corridor and the bridge components.
- -
The development of a precise geometric and high-quality 3D image-based model representing the current condition of an existing railway bridge, through the fusion of CRP-based UAV and TLS, taking advantage of the potential of both technologies.
- -
The precise detection of geometric deviations between the as-is and as-designed 3D models to the case of existing railway bridges.
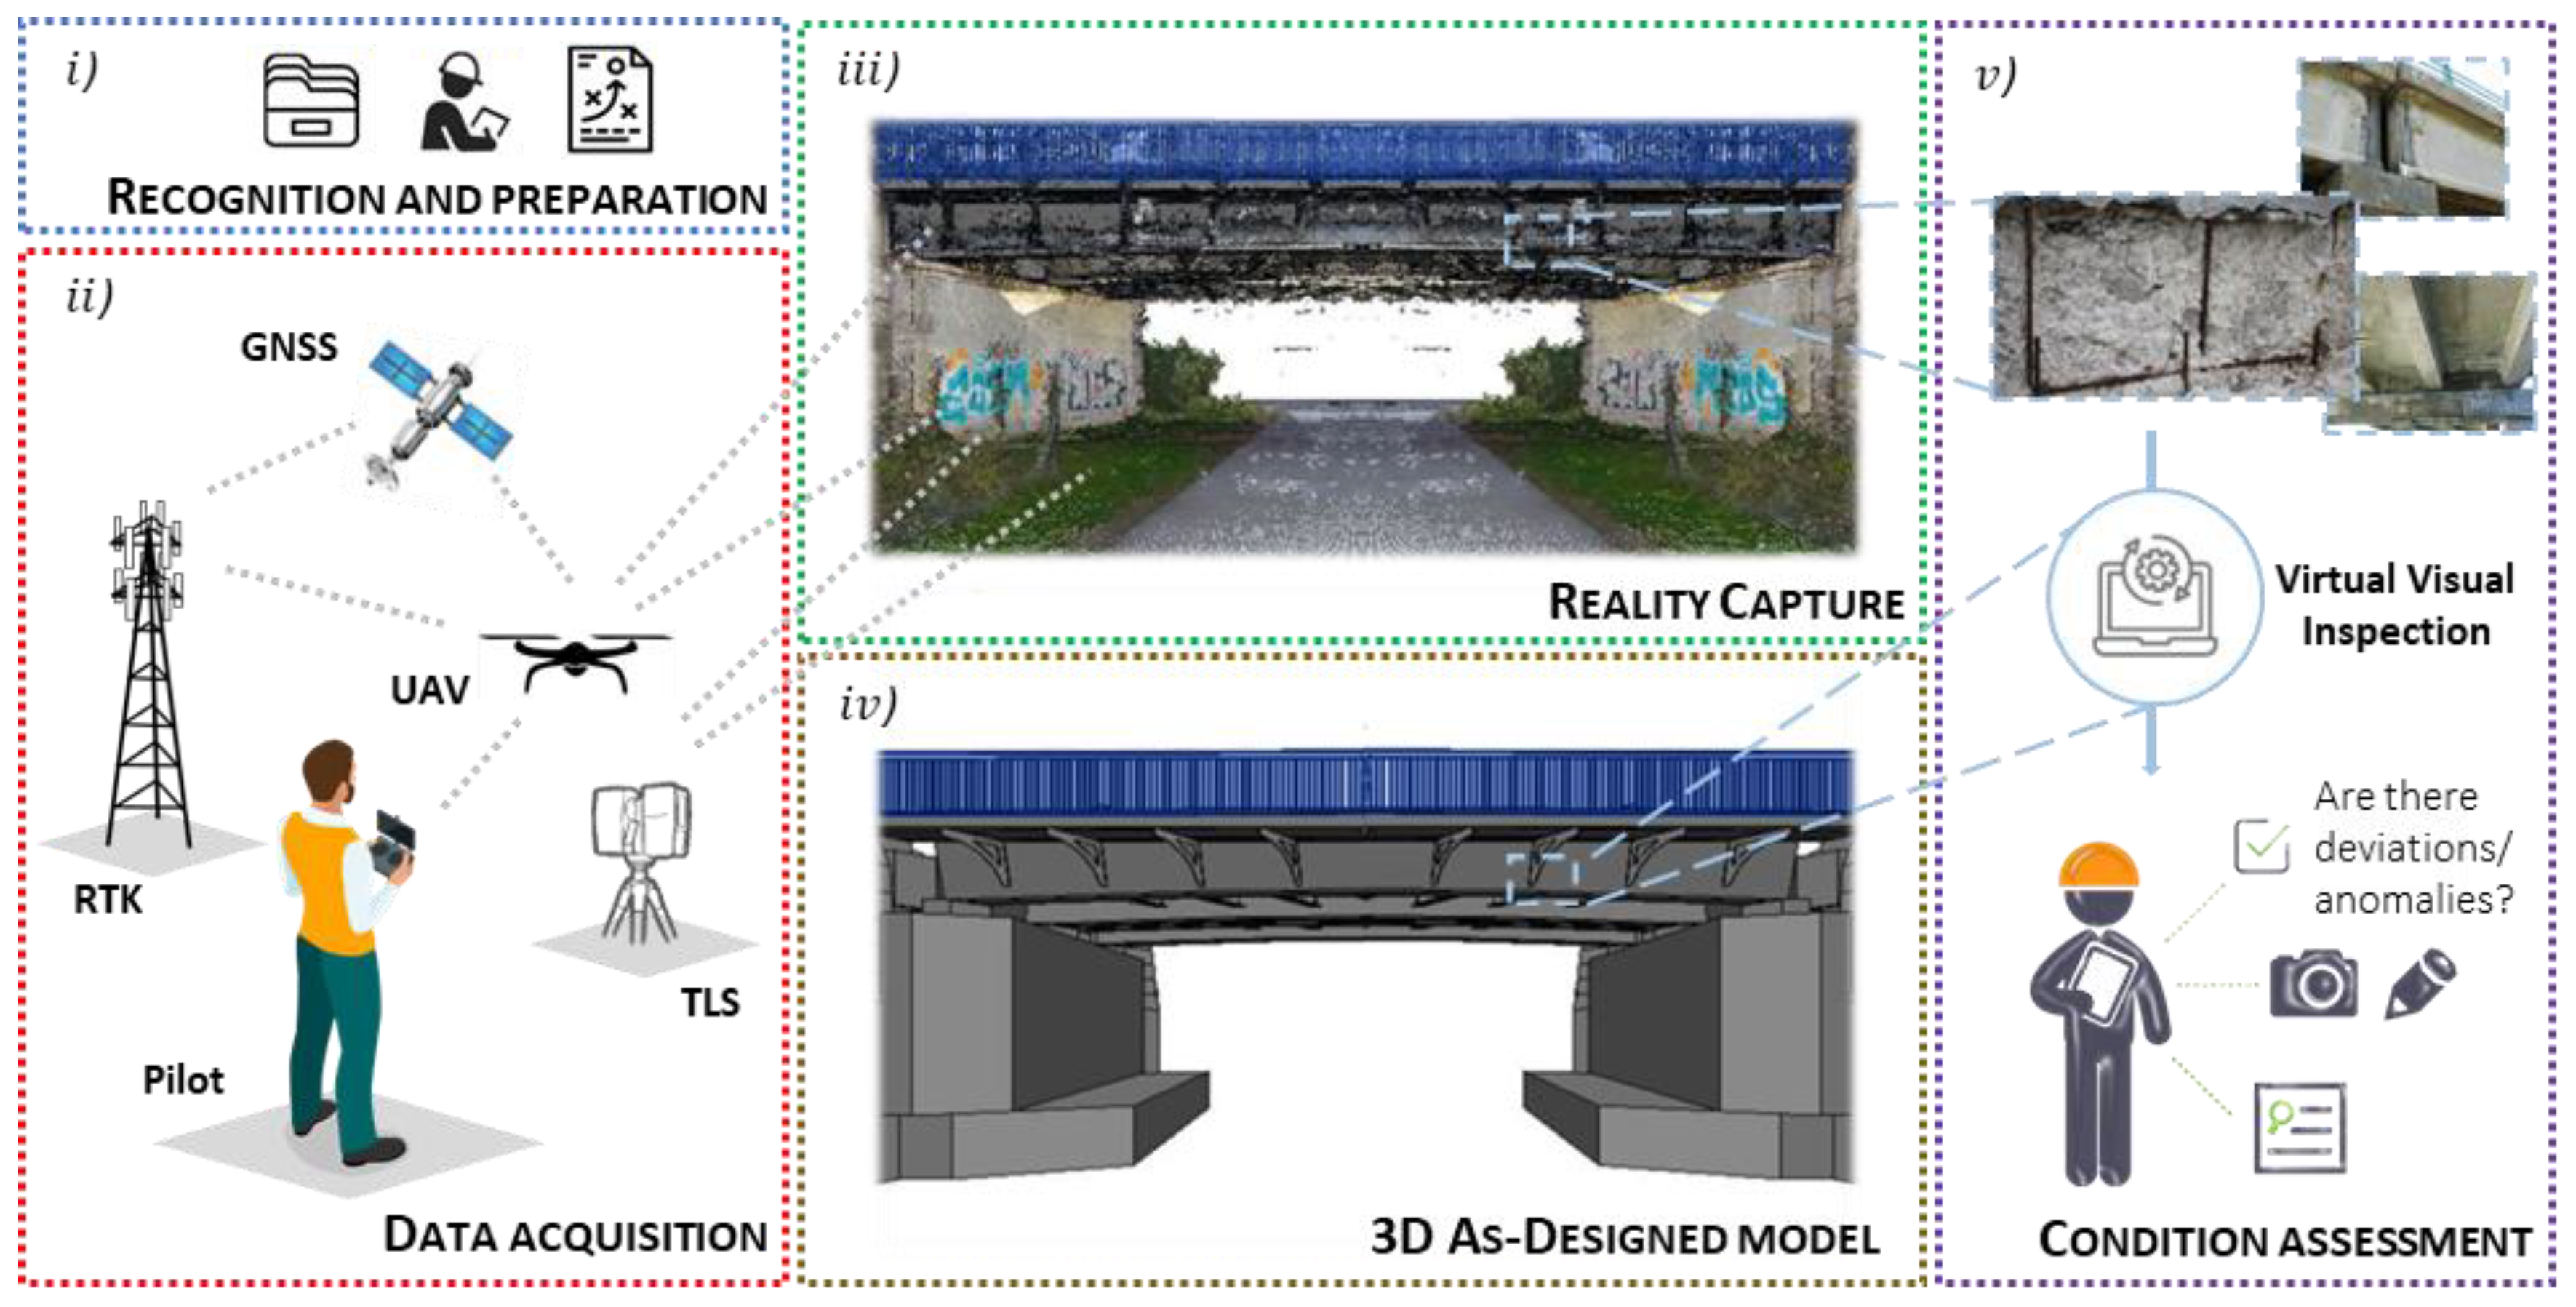
2. Methodology
The methodology proposed for railway bridge inspection combines active and passive vision systems, along with a 3D as-designed model, and comprises five phases that are illustrated in
Figure 1.
The first phase, referred to as recognition and preparation, involves gathering project-specific details and evaluating the inspection history of the target structure. It also includes assessing the location for any potential restrictions, selecting technical staff and equipment such as TLS and UAV, and developing an acquisition strategy that outlines the necessary processes and approvals.
The second phase, data acquisition, begins with a precise topographic survey of the structure’s control points, which is crucial for georeferencing and calibrating point cloud data. Control points are established throughout the entire structure using supplemental targets or notable points on the structure, and their coordinates are collected using GNSS receivers with RTK capability and an electronic theodolite. The point cloud is then acquired with TLS as long as there is ground support under the bridge, and photos are captured with the UAV. To ensure high-quality point clouds and photos, the TLS must meet specific criteria, while the UAV should have significant autonomy, obstacle collision avoidance, RTK positioning accuracy, and high-resolution cameras. Both data collections should be performed safely and as close to the structure as possible to achieve higher image resolution and accuracy. It is mandatory to verify the presence of any flight restrictions, in the case of the UAV, or required authorizations in the inspection area, as well as consider weather conditions such as wind speed, precipitation, temperature, visibility, and sun direction for both cutting-edge reality capture technologies.
The third phase, the digital railway bridge model, involves aligning the TLS point clouds and reconstructing a 3D geometric model of the structure using georeferenced photos collected by the UAV with SfM algorithms. The resulting 3D as-is model point cloud is registered and exported to the relevant format, namely the point densified cloud (PDC), texture map (mesh), and/or orthophoto, with nearby objects and background noise removed.
The fourth phase entails modeling a 3D as-designed model based on the design phase to establish a high-precision graphical representation of all components.
The fifth and final phase involves the railway bridge condition evaluation performed by an expert. Surface anomalies may be easily viewed over the reality capture model, and deviations from the theoretical 3D as-designed model can be identified, enabling the virtual inspection of the railway bridge. Finally, a condition assessment report of the bridge is also prepared.
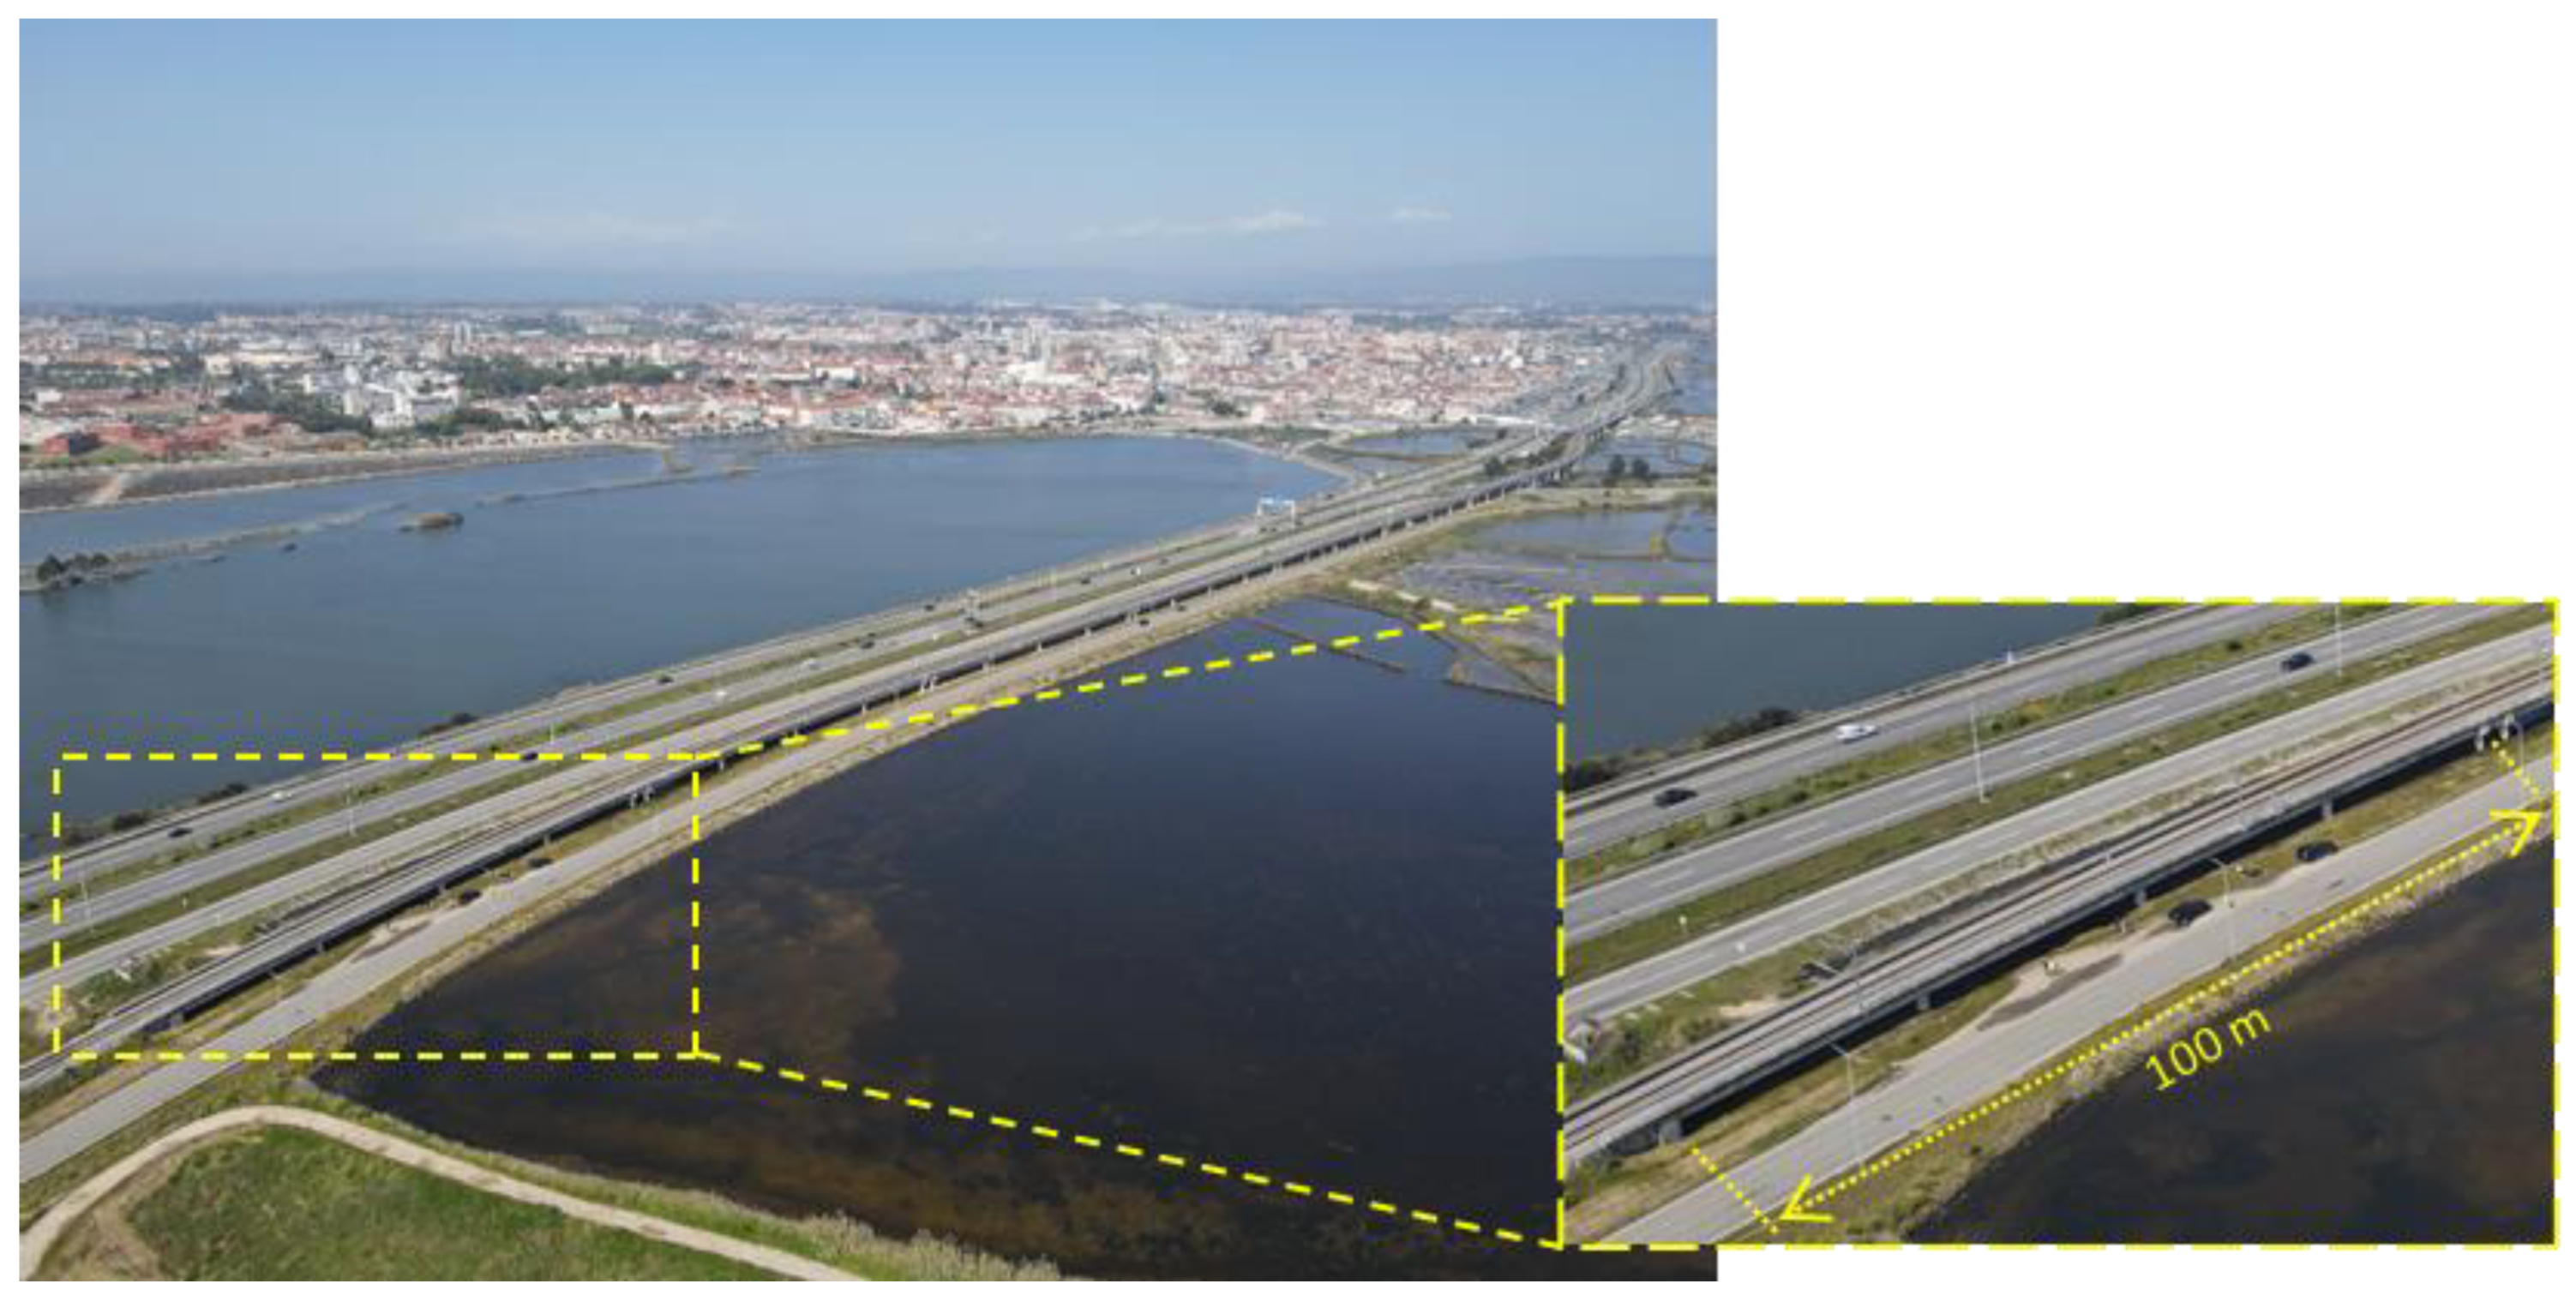
4. Case Study: Access Viaduct to Pirâmides Railway Bridge
4.1. Description
The case study for the application of the proposed methodology, for railway bridge geometry assessment supported by cutting-edge reality capture technologies and 3D as-designed models, is an end module of the west access viaduct connecting to the Pirâmides bridge in Aveiro, Portugal, inserted in a railway extension providing access to the port of Aveiro. As shown in
Figure 4, the module is composed of four 25 m continuously supported spans with a total length of 100 m.
4.2. Data Acquisition
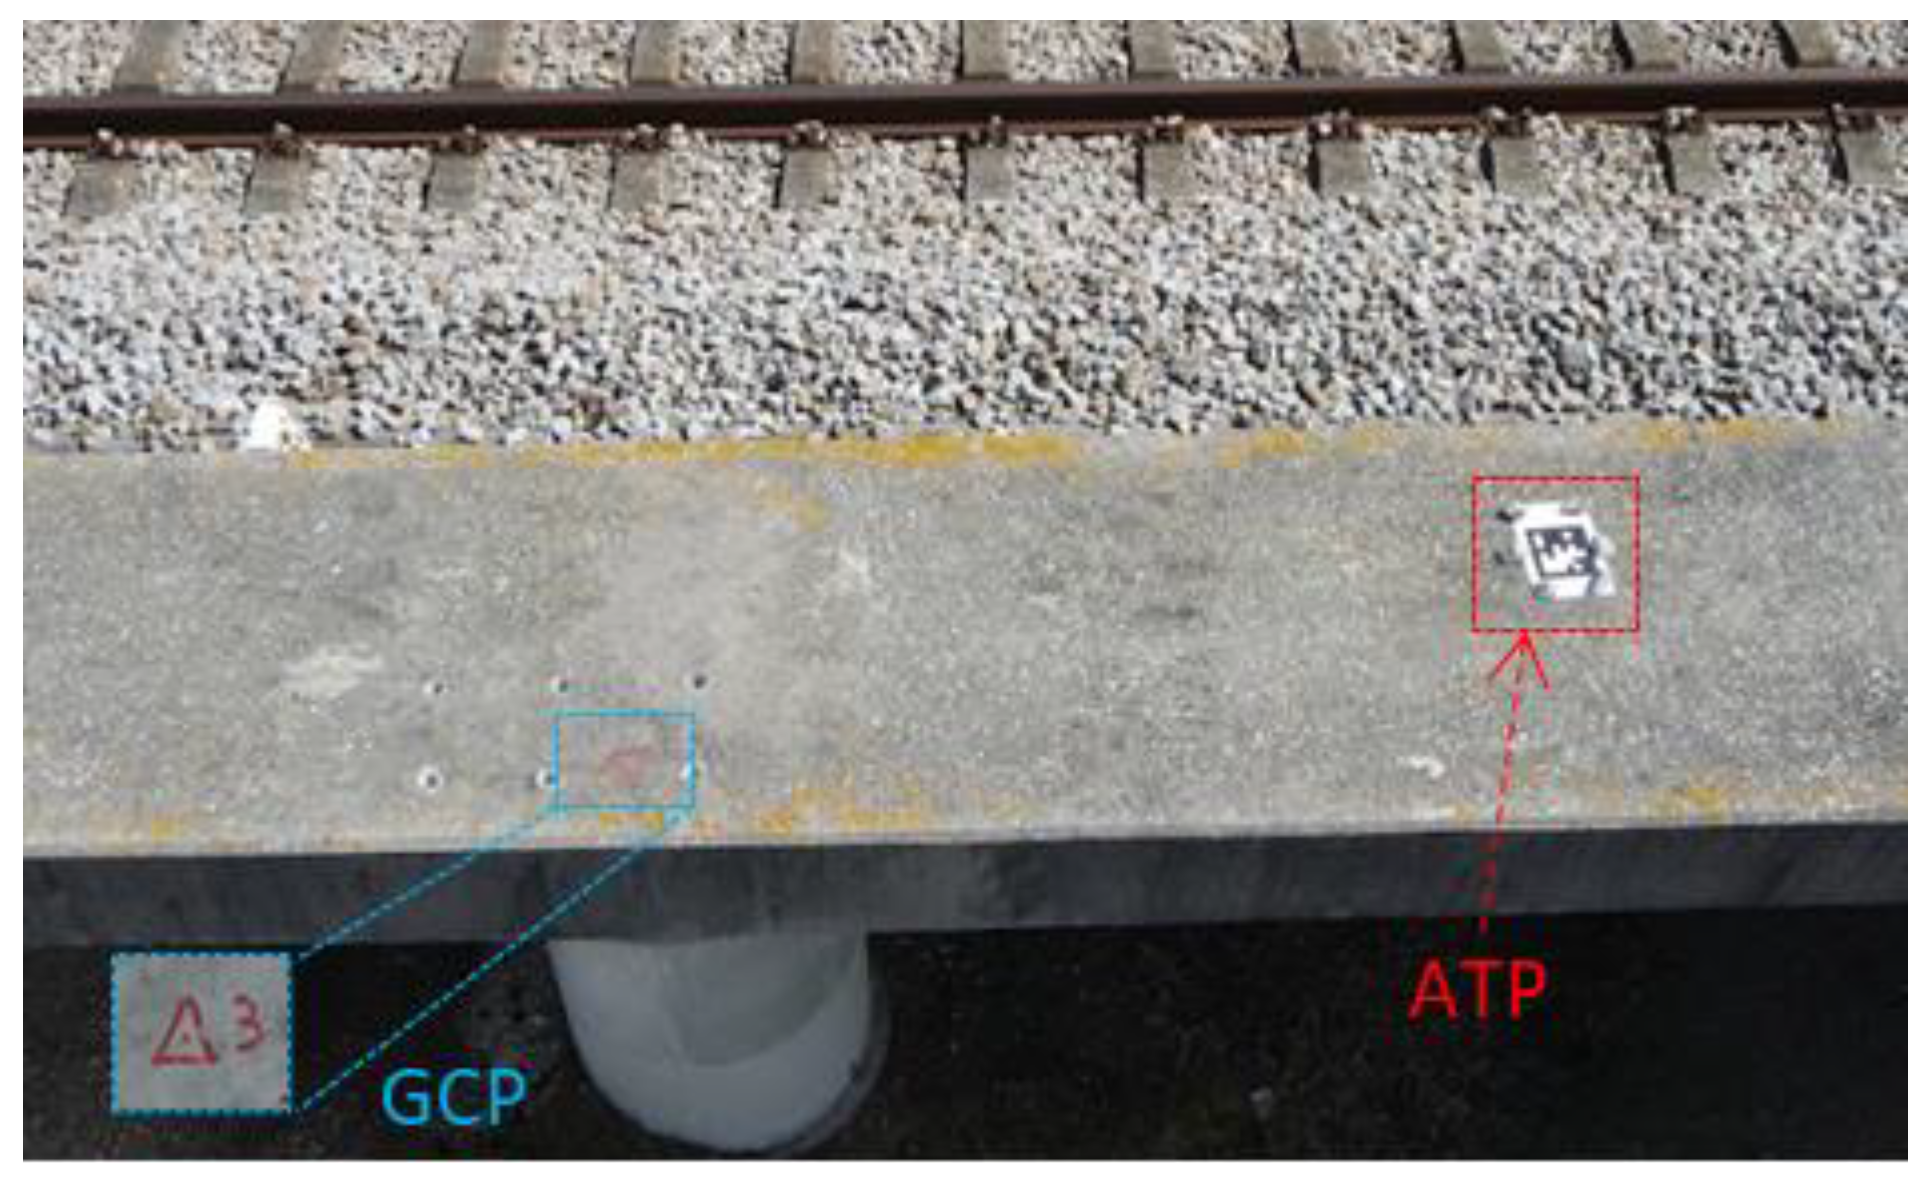
For georeferencing and photogrammetry, the railway bridge was identified utilizing 50 ground control points (GCPs) and 8 automatic tie points (ATPs). As seen in
Figure 5, these targets were directly placed on the concrete surface of both the columns and the deck. The GCPs were measured utilizing topographic assistance, guaranteeing the precise and feasible dimensions, while the ATPs enabled automated image recognition in ContextCapture.
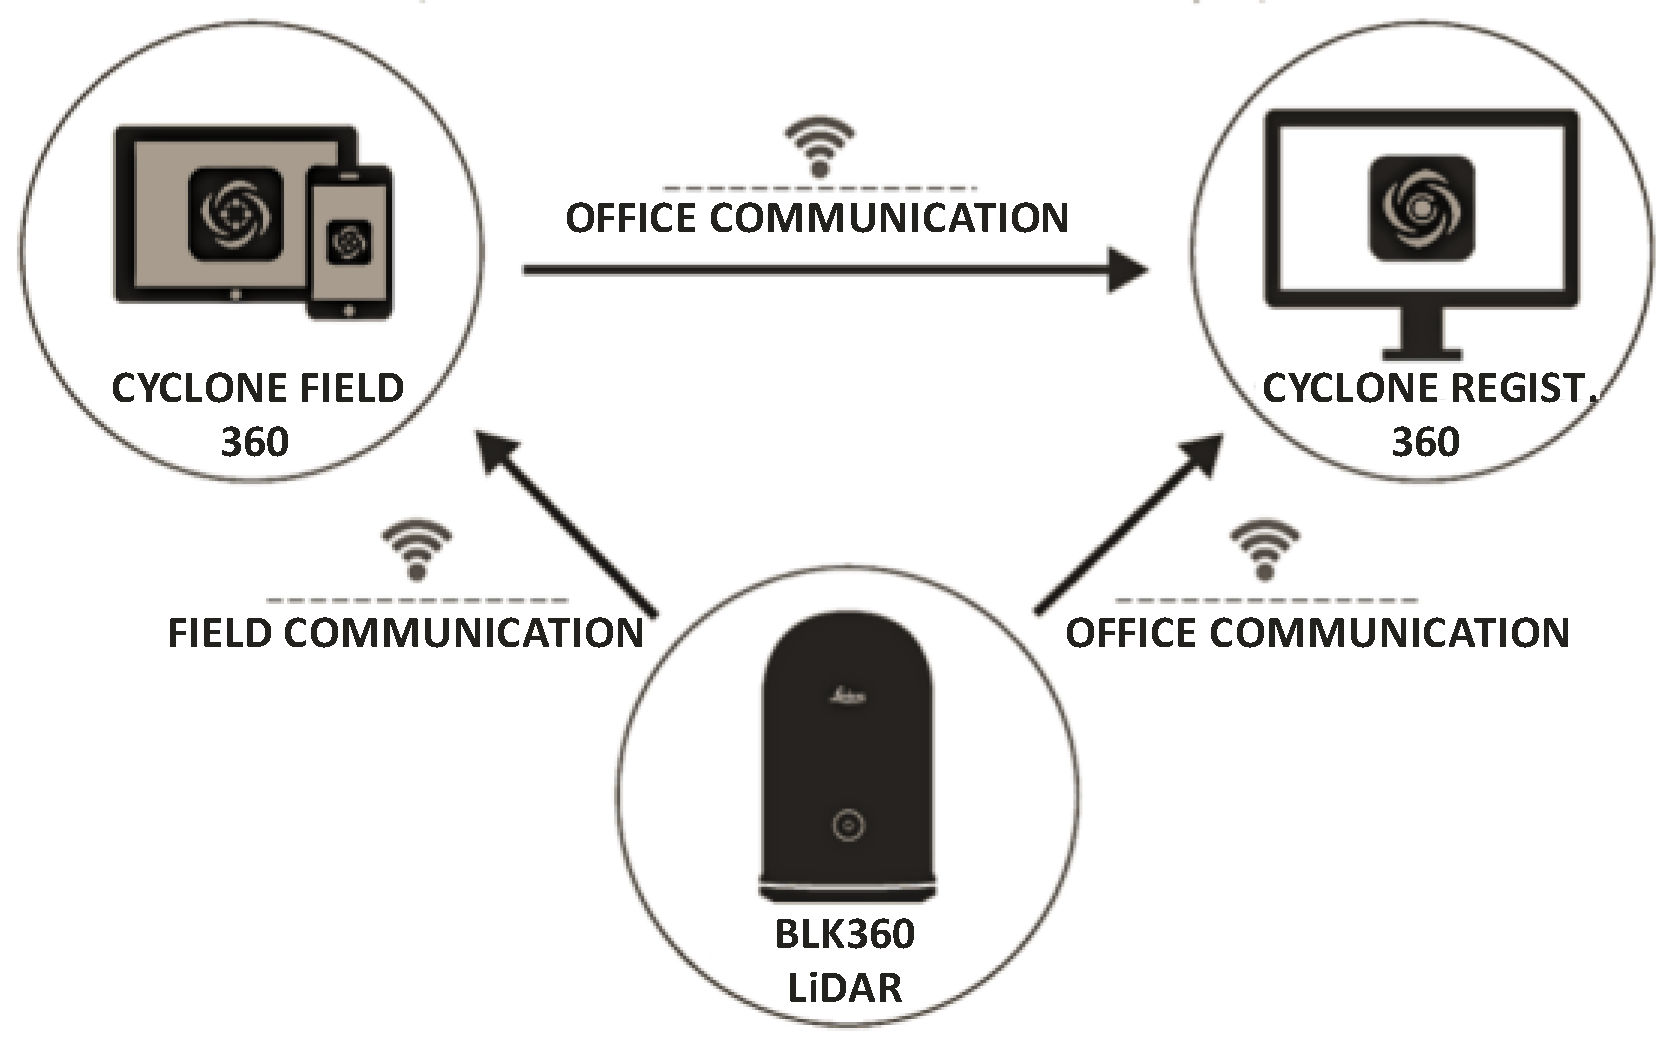
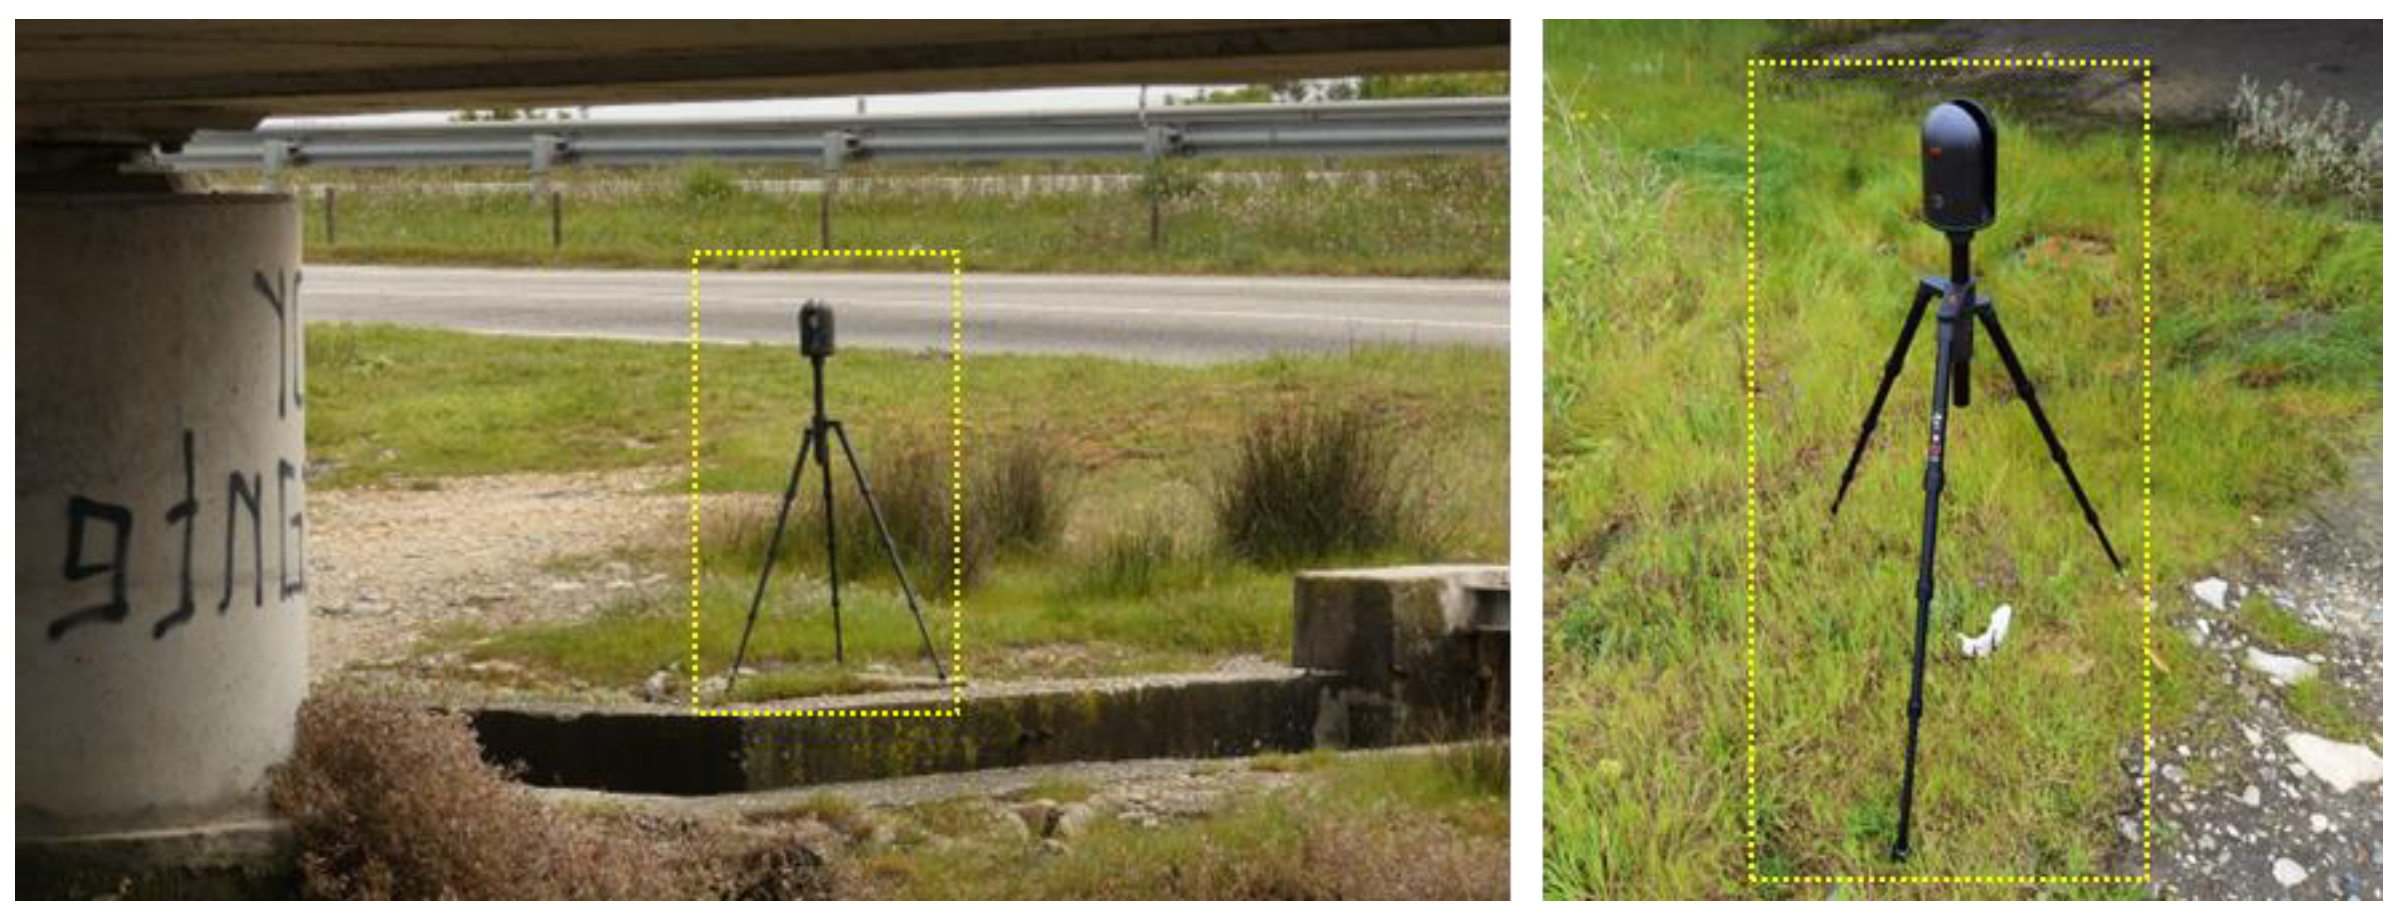
Laser scanning was executed using a high-density mode, leading to point density of 5 mm per 10 m. Consequently, the scanning setup was positioned within a distance of less than 10 m from the structure for each acquisition. In this mode, a complete scan, involving panoramic image capture, takes roughly 5 min due to the length of the bridge, and data collecting took over 12 h.
Figure 6 displays the LiDAR system in operation.
Table 1 specifies an overview of the collected data.
The data registration was manually performed, and then the iterative closest point (ICP) technique was used to optimize it. The ICP algorithm is a well-known method for rigid registration. It alternates between querying the target set for the nearest point and minimizing the distance between related points and guarantees convergence to the locally optimal alignment. The final registration stated an average mean inaccuracy of approximately 17 mm.
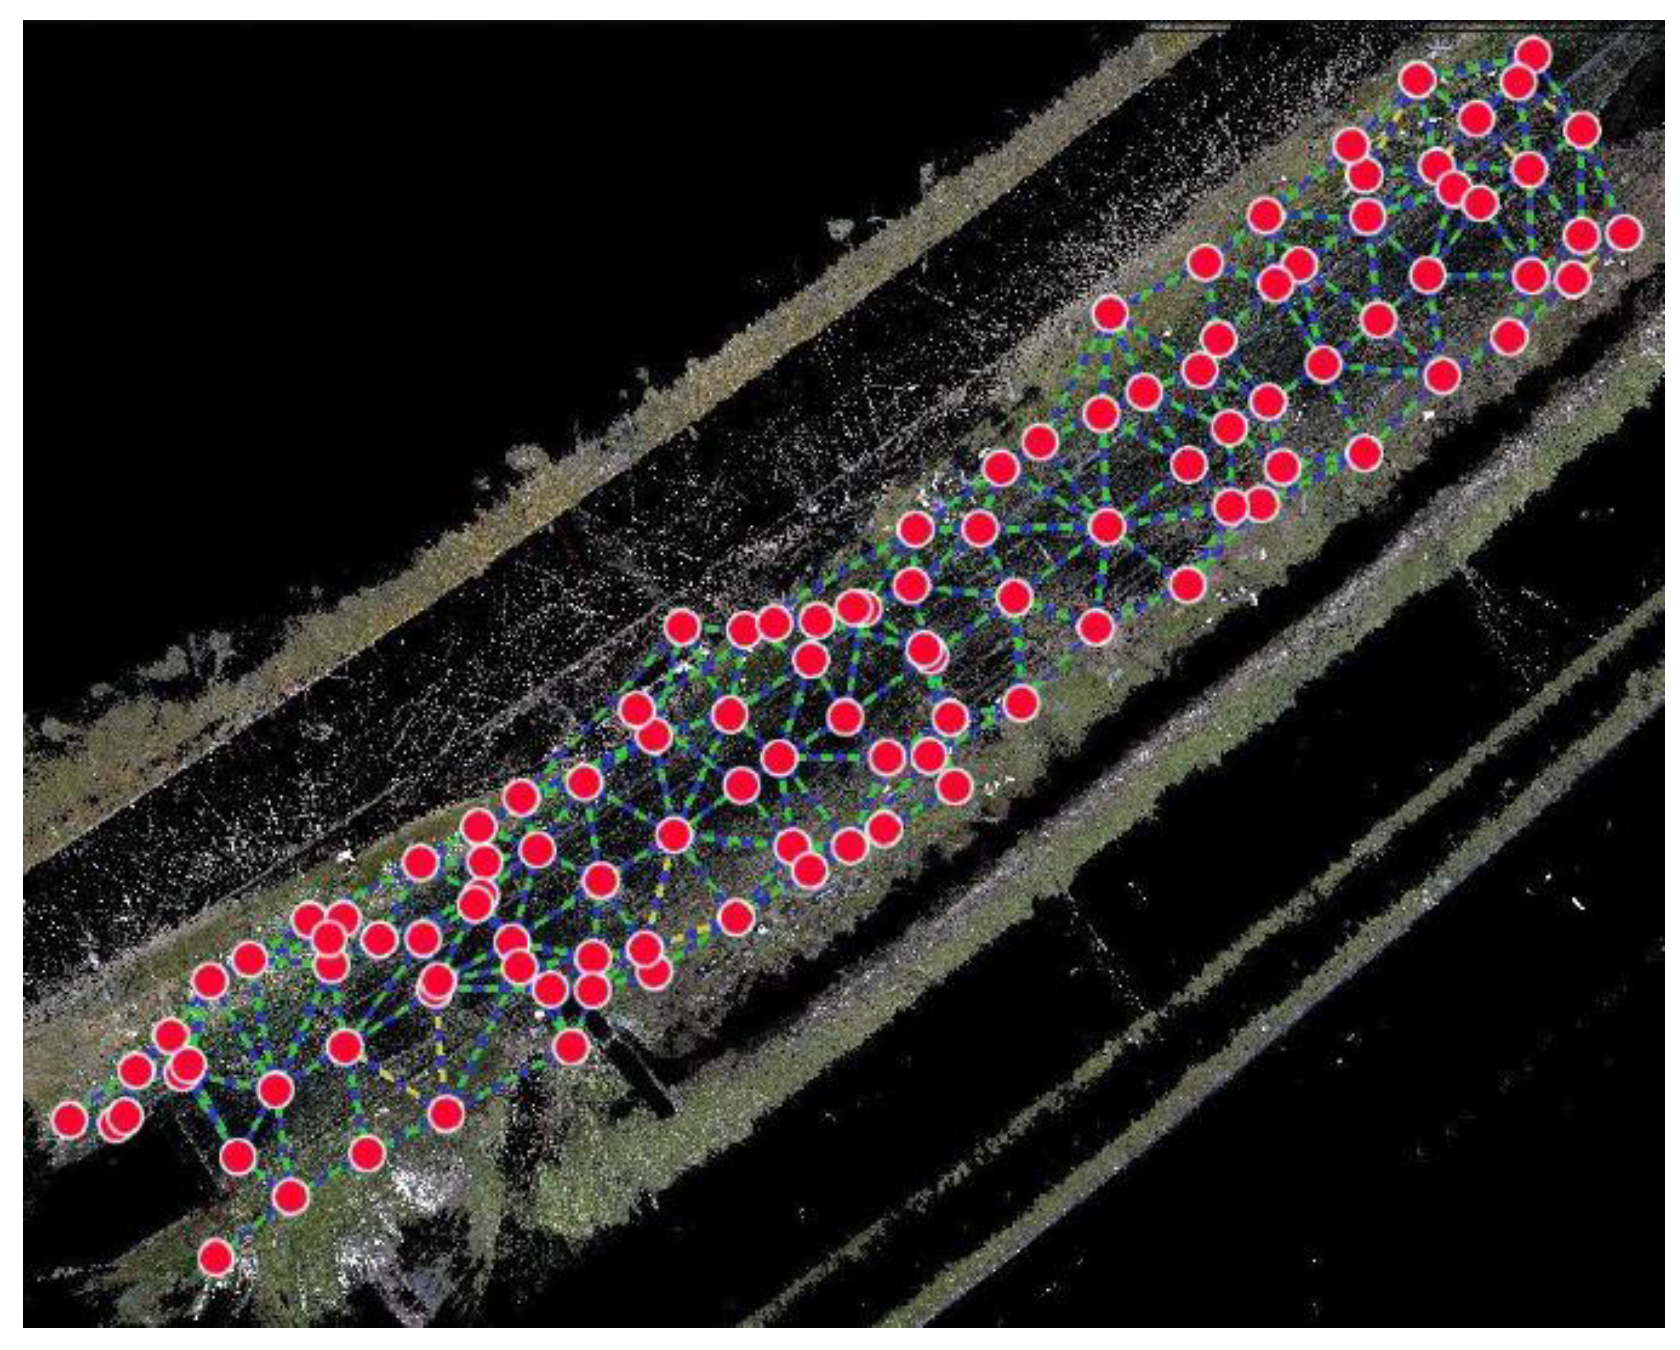
Figure 7 depicts the point cloud that was registered, illustrating the spatial arrangement of the scanning stations. The distribution of these stations was deliberately executed to encompass diverse perspectives. Specifically, the lateral girder necessitated a minimum of three scans within each span, as well as an additional three scans surrounding each column. Similarly, beneath the deck, a minimum of five scans along the longitudinal axes were conducted per span.
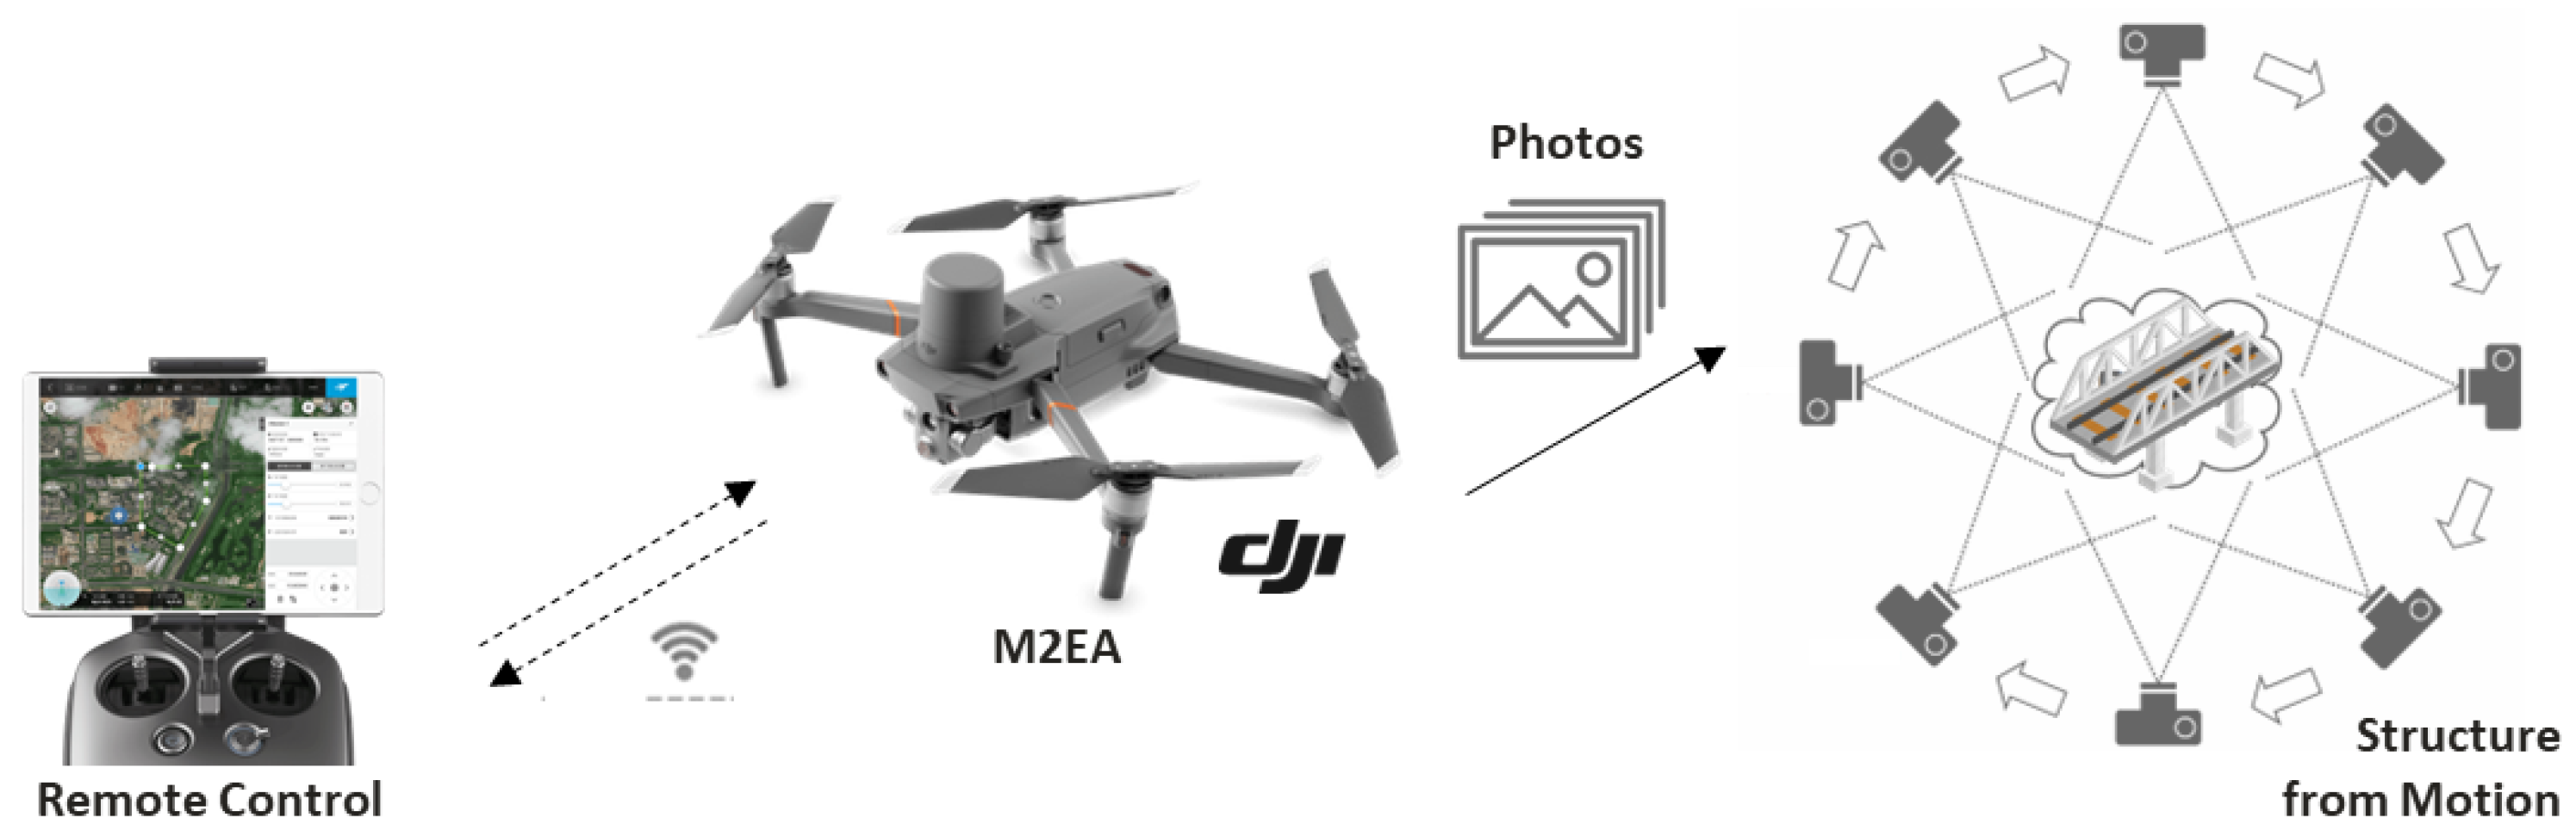
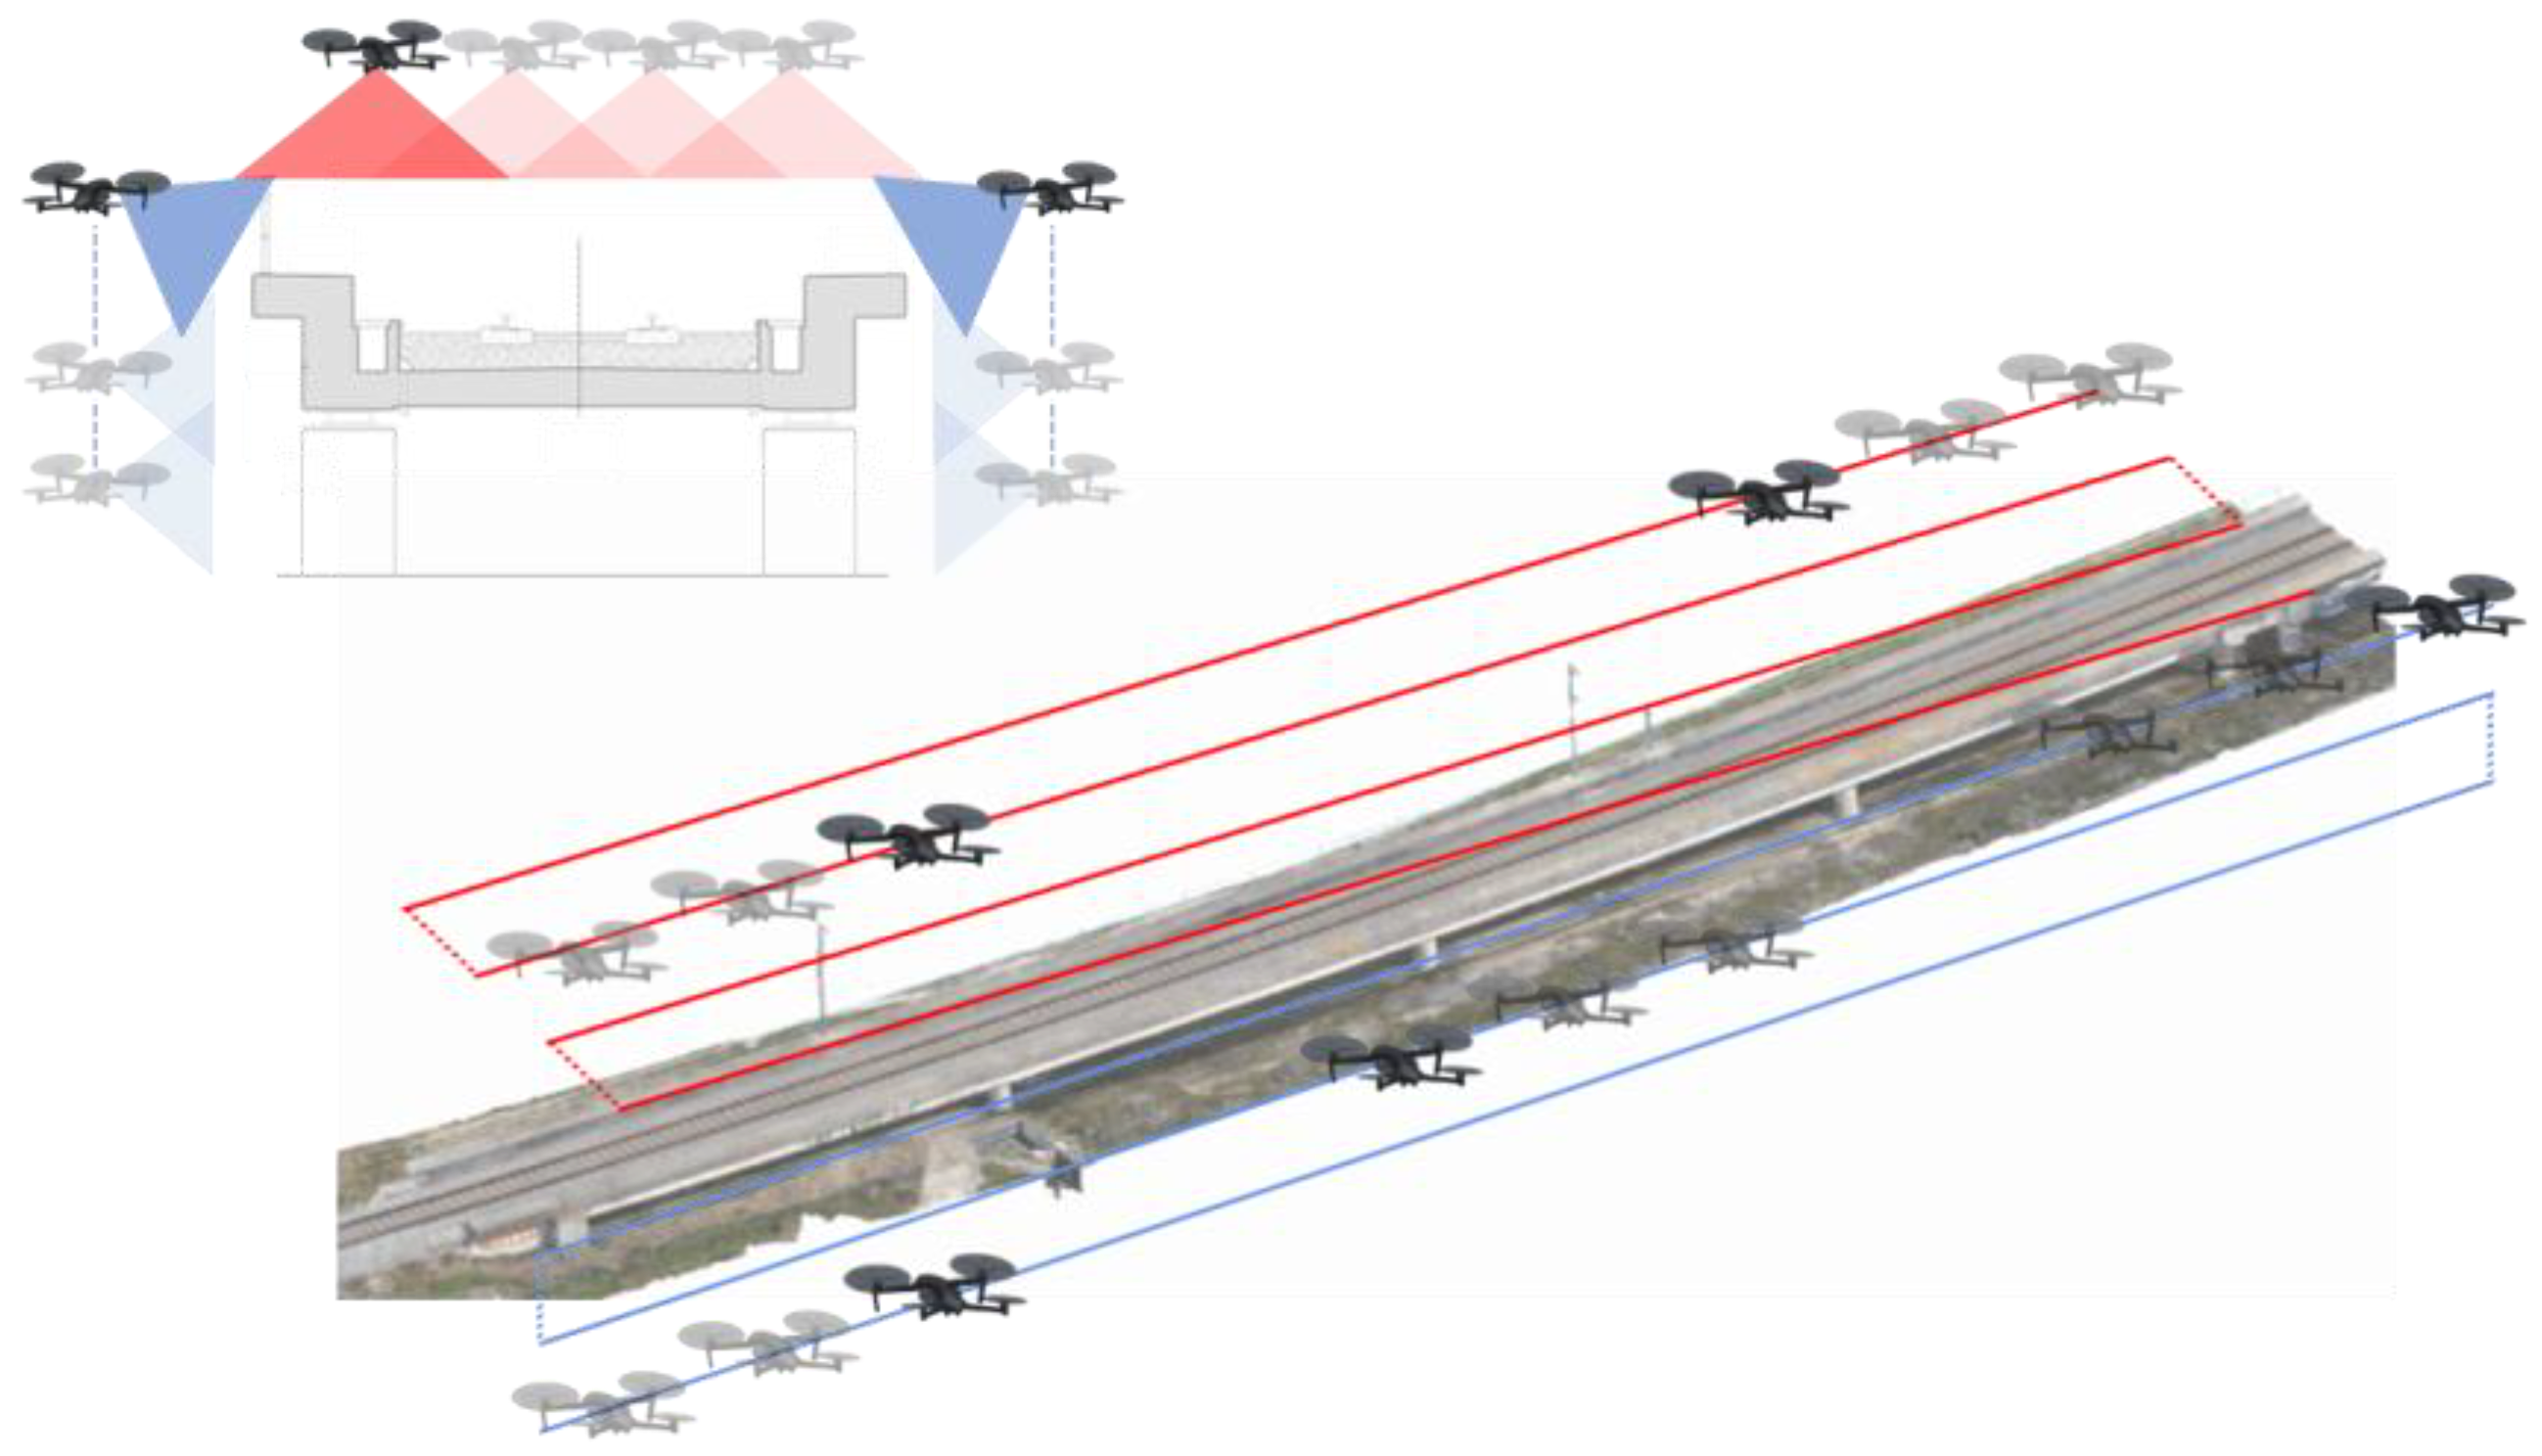
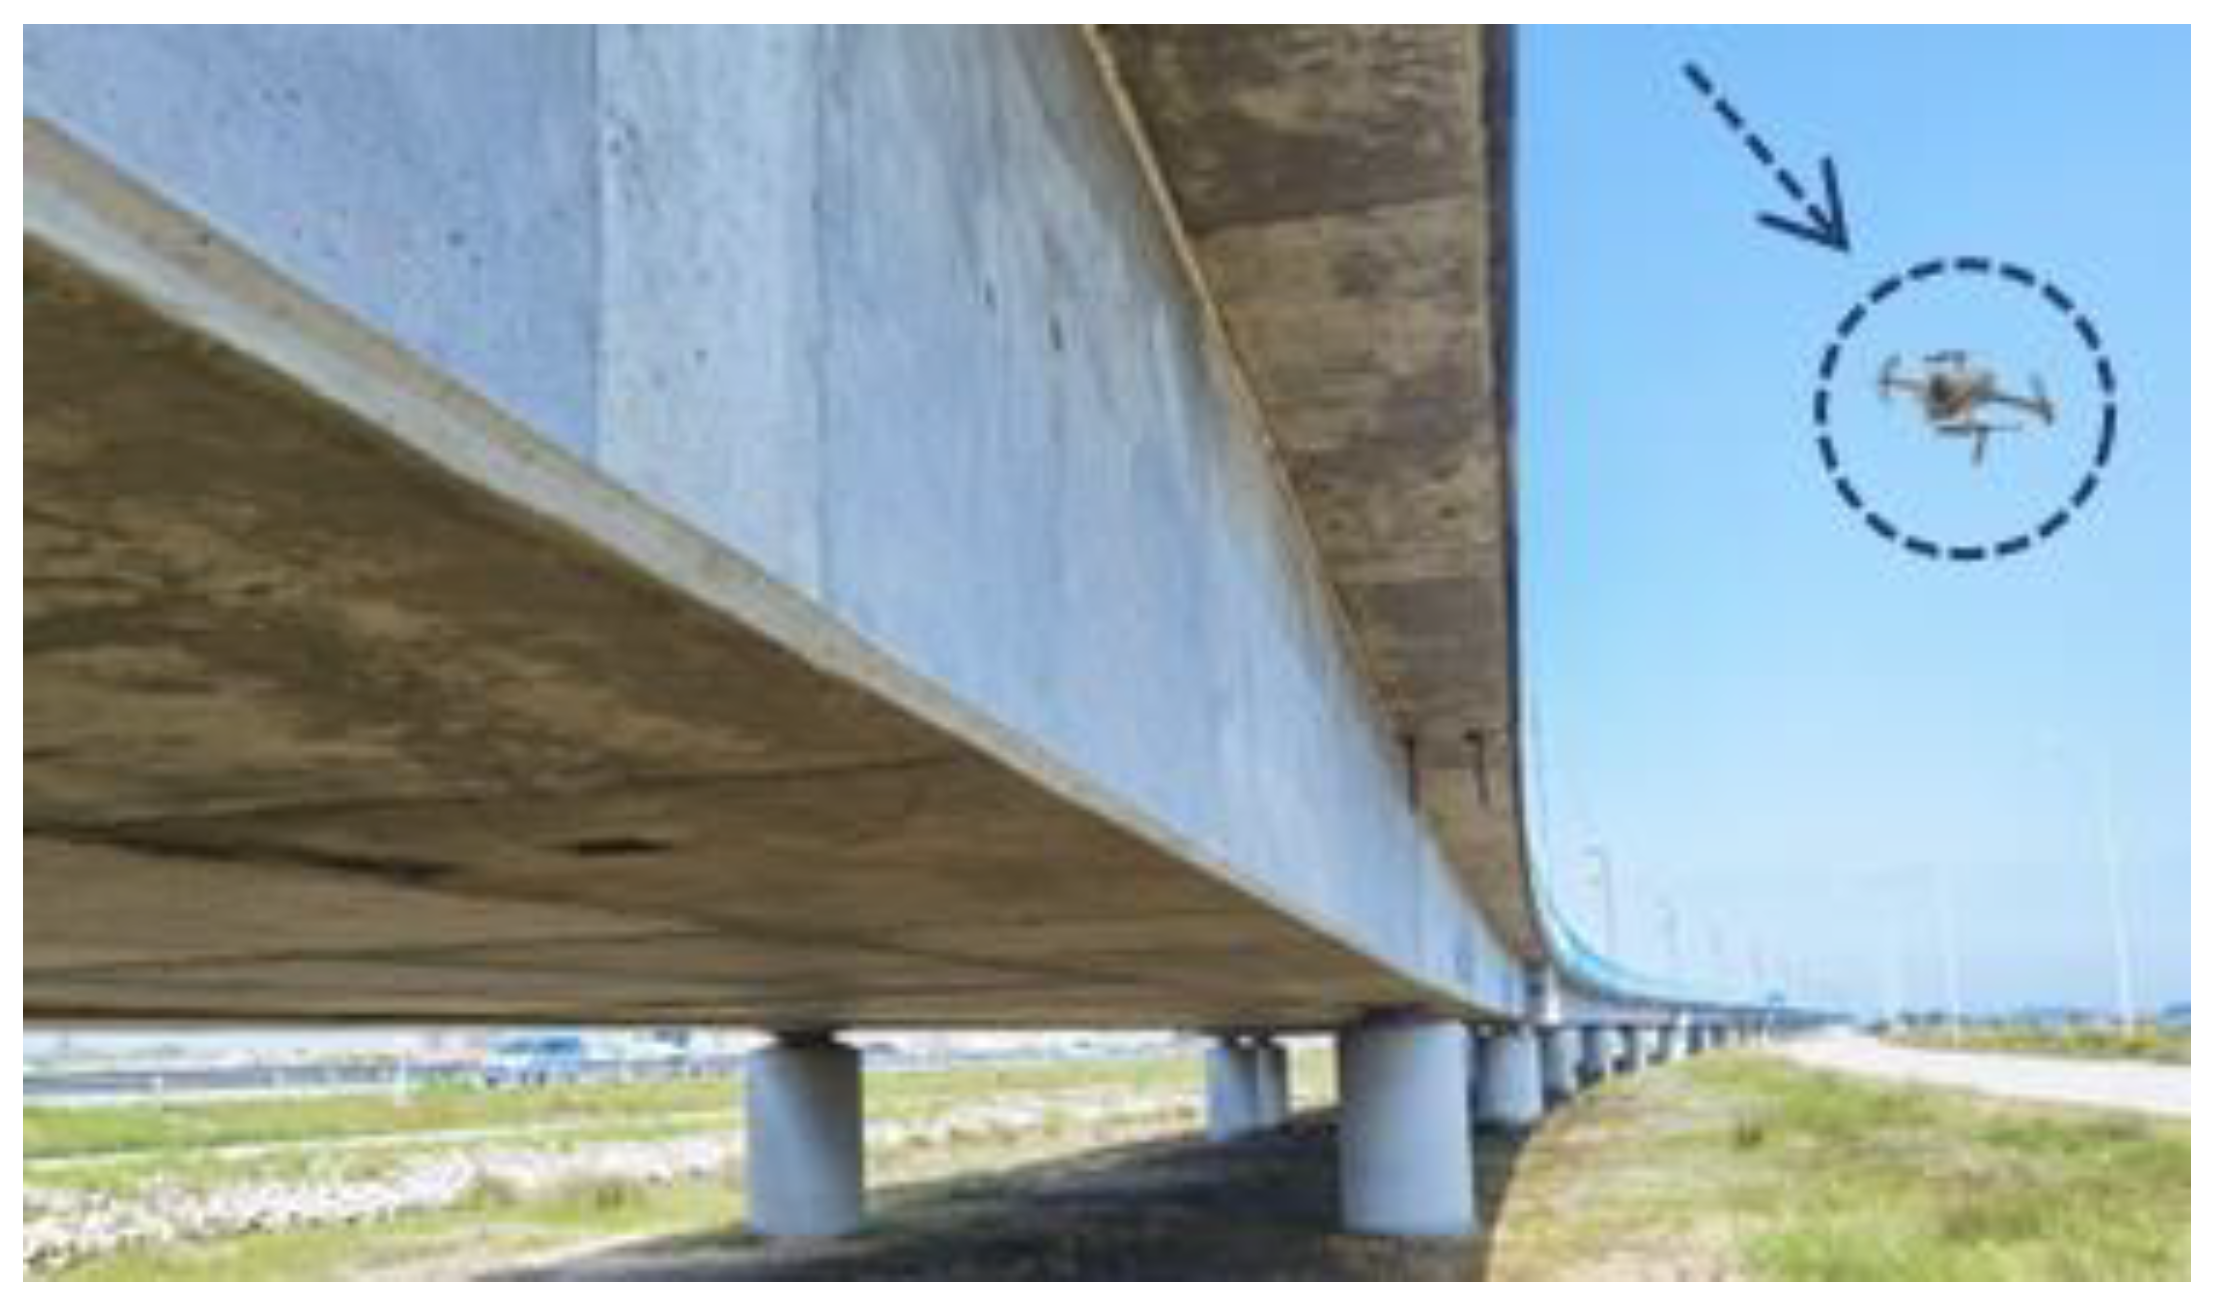
The UAV M2EA possesses a maximum flight time duration of approximately 30 min and was operated by an experienced pilot in a stop-and-go mode, which permitted for stable image recording. Aerial surveying was conducted using a flight trajectory that encompassed nadir images and oblique views, as illustrated in
Figure 8, capturing imagery from a distance of approximately 3–4 m from the lateral surface and 20 m from above the upper deck components. The acquisition operation took over 8 h over the 100 m length, equal to 16 flights restricted by the battery charge.
Figure 9 shows the UAV in operation.
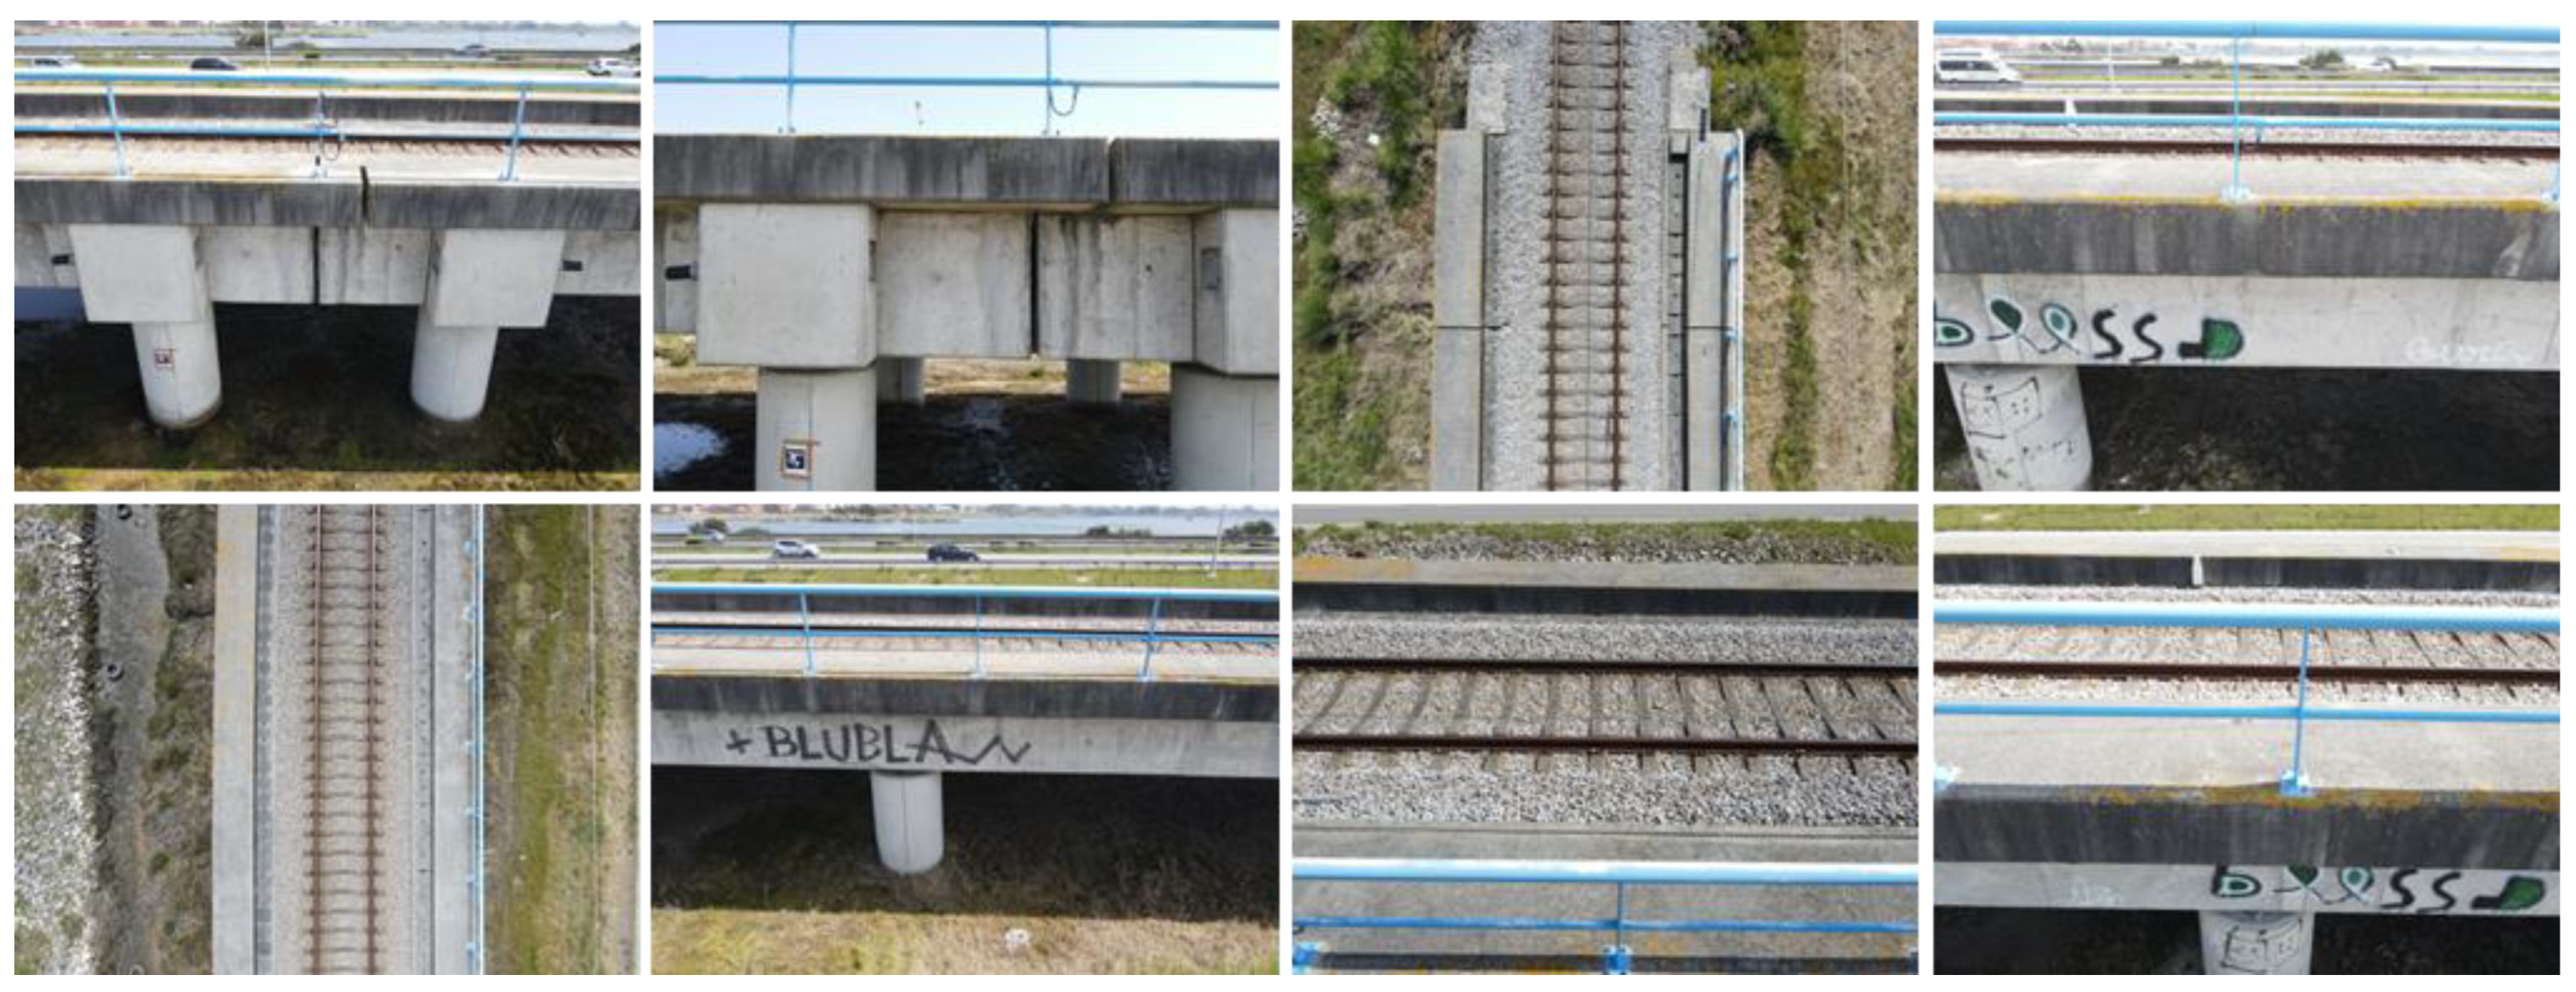
Table 2 presents a concise overview of the fundamental flight data. Overall, the image quality obtained from the UAV flights was satisfactory in terms of clarity and exposure, as demonstrated in
Figure 10. However, some of the photos were overexposed, particularly in areas with excessive contrast, such as the lower bridge deck surface. Regardless, the photogrammetric processing was successfully performed, as stated by the superior ground sample distance (GSD) image quality of 1.04 mm per pixel. GSD refers to the dimensions of a single pixel in an image, as measured on the orthogonal images.
4.3. As-Is Model
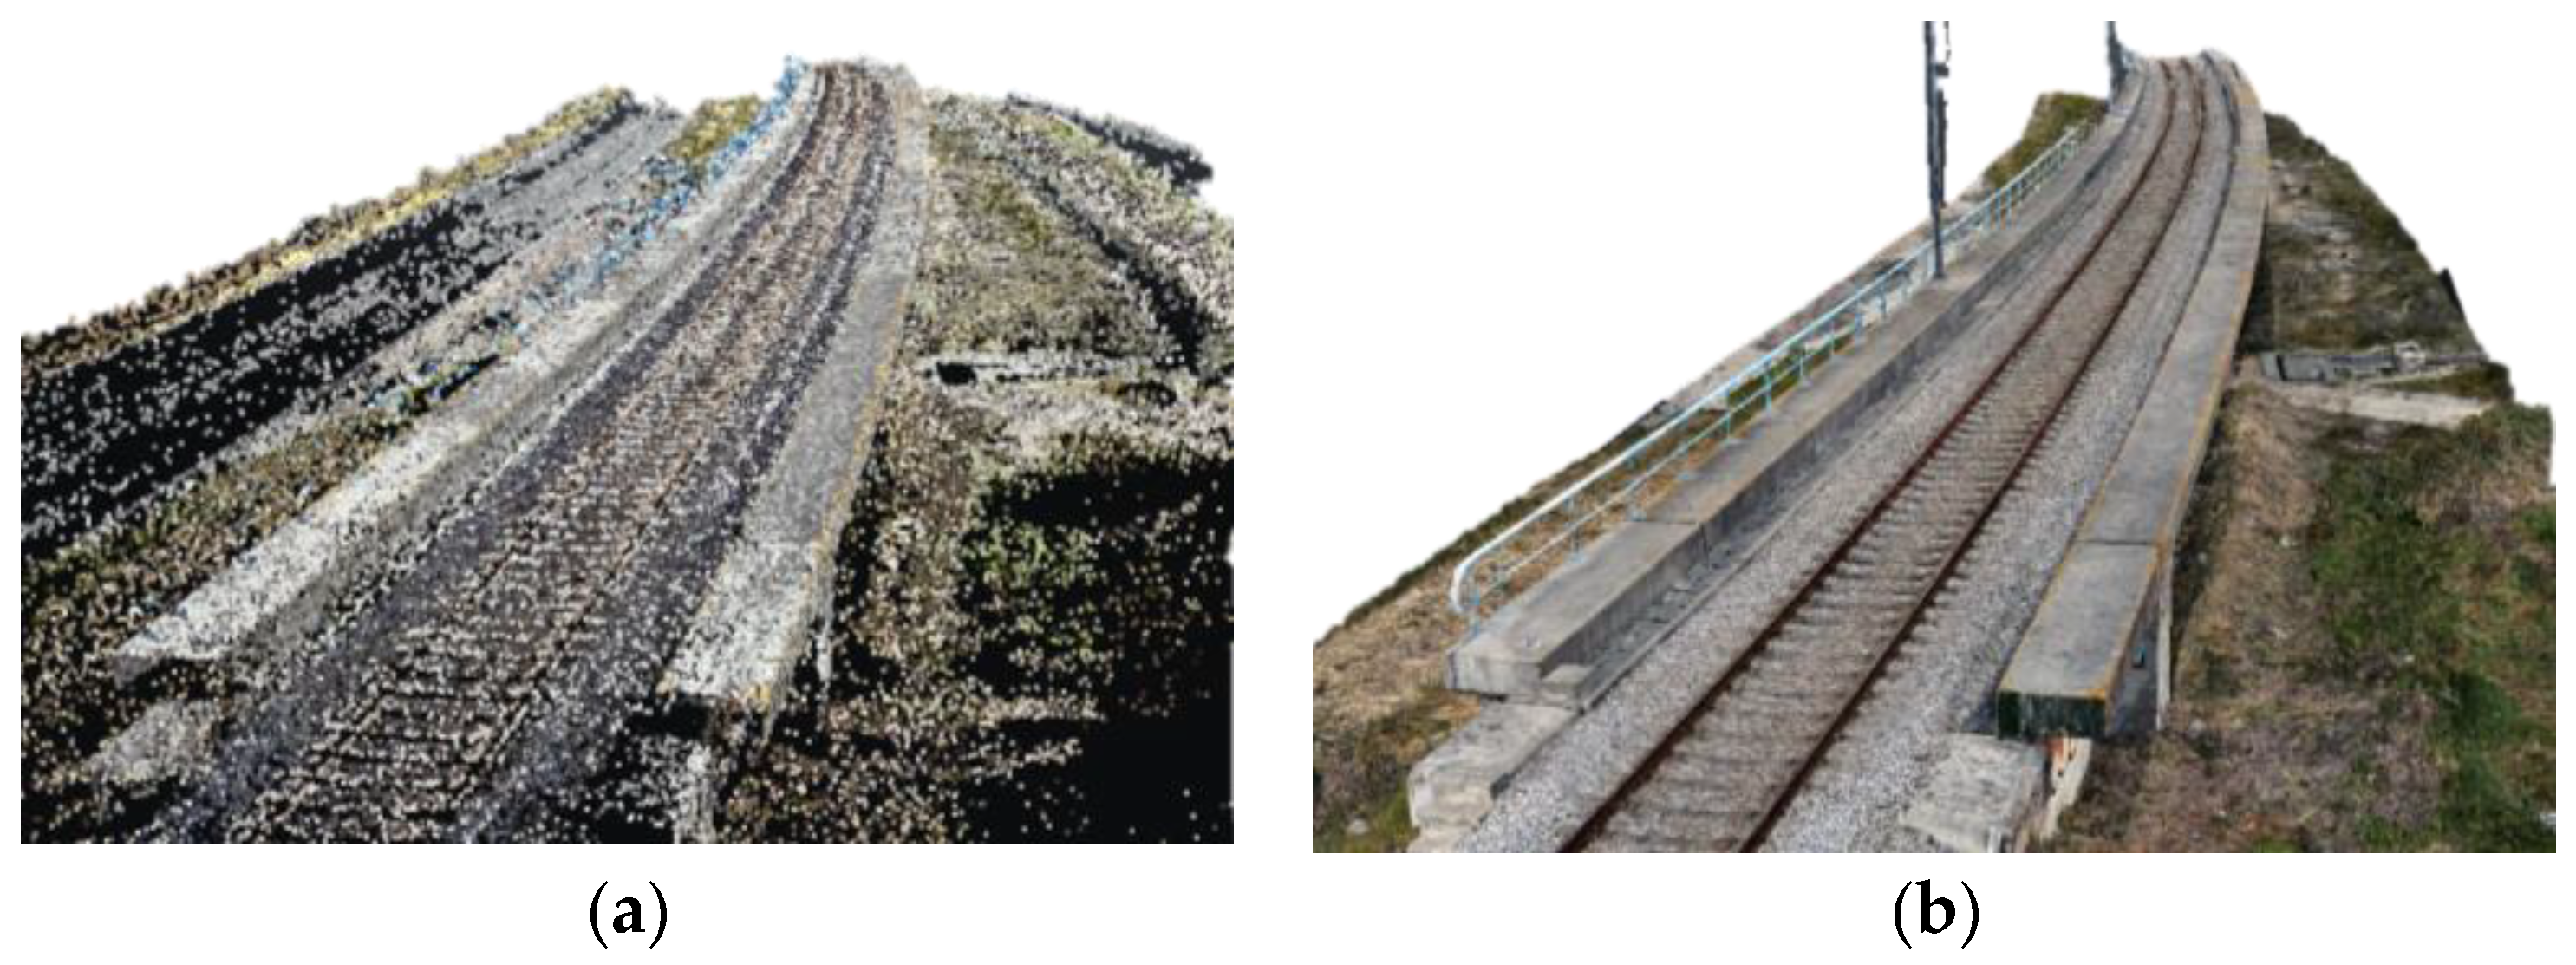
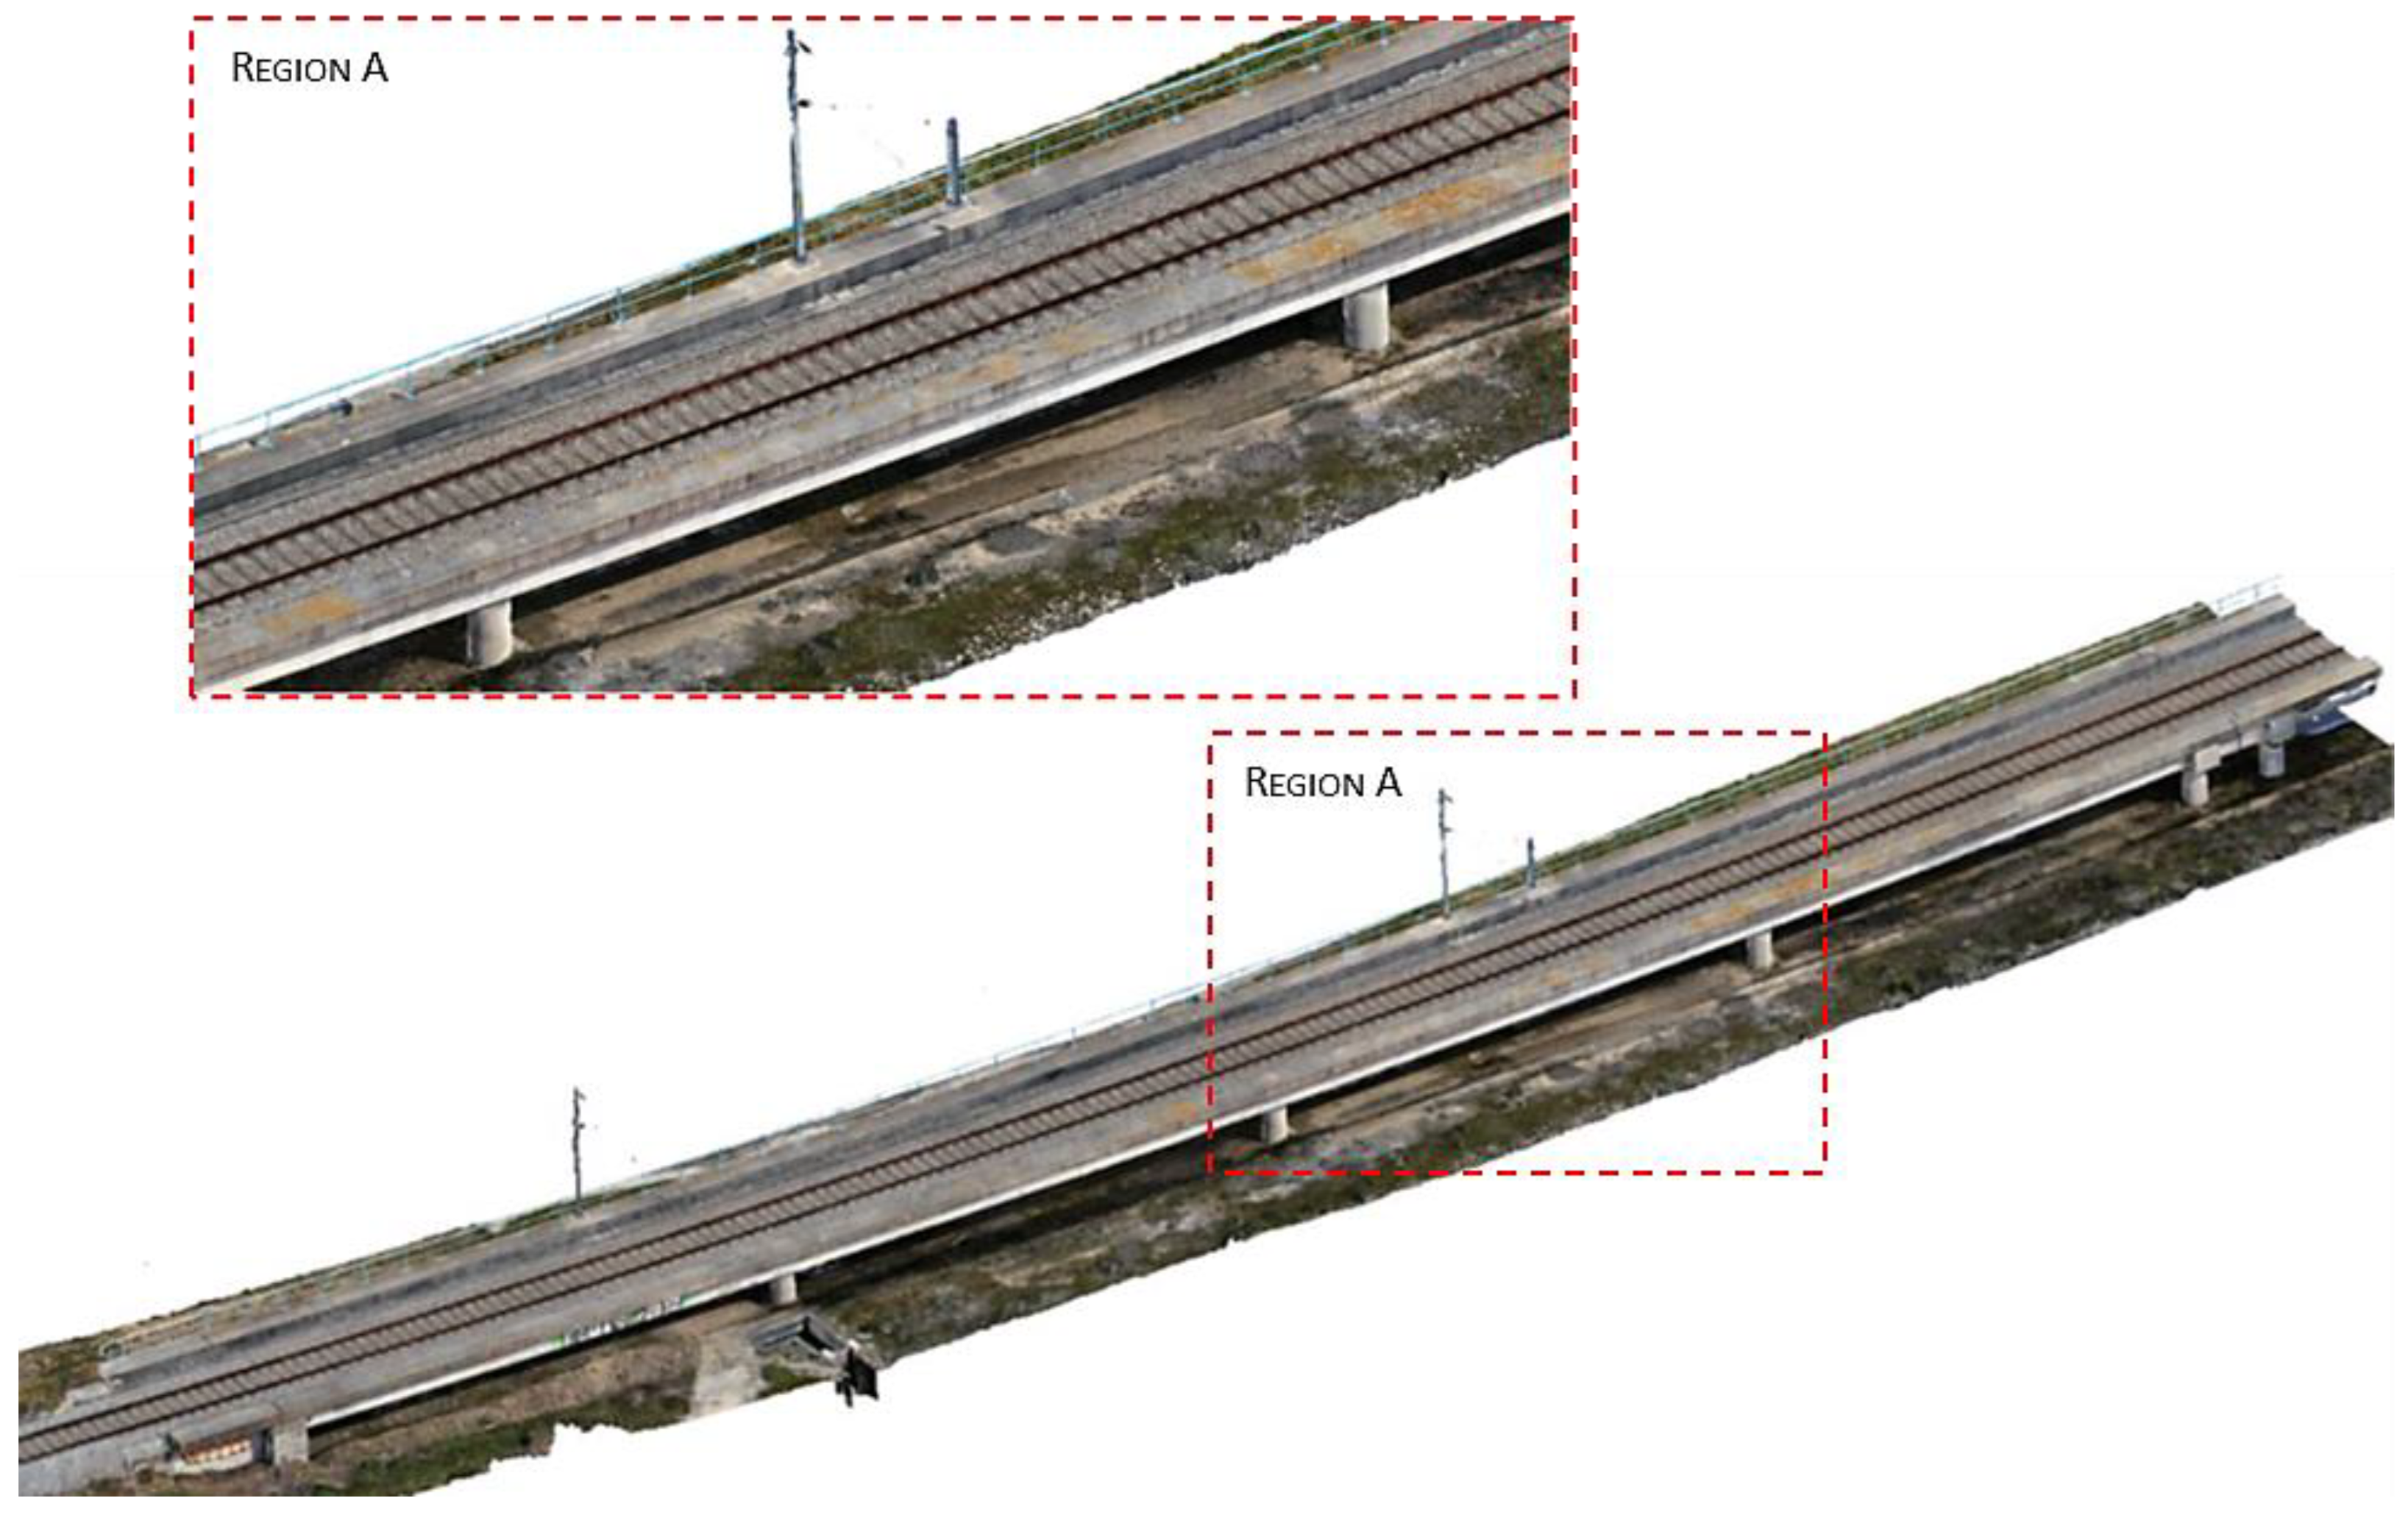
The data processing results in both a dense point cloud (
Figure 11a) and a texture mapping (
Figure 11b). Texture maps enable the incorporation of components in scene reconstruction that are shorter than the distance between points in a dense point cloud. A high-performance computer is required for data fusion. In this scenario, an Intel i7-11700 eight-core processor, with 32 GB RAM and an Nvidia GeForce RTX 3090 24 GB graphics card, was used.
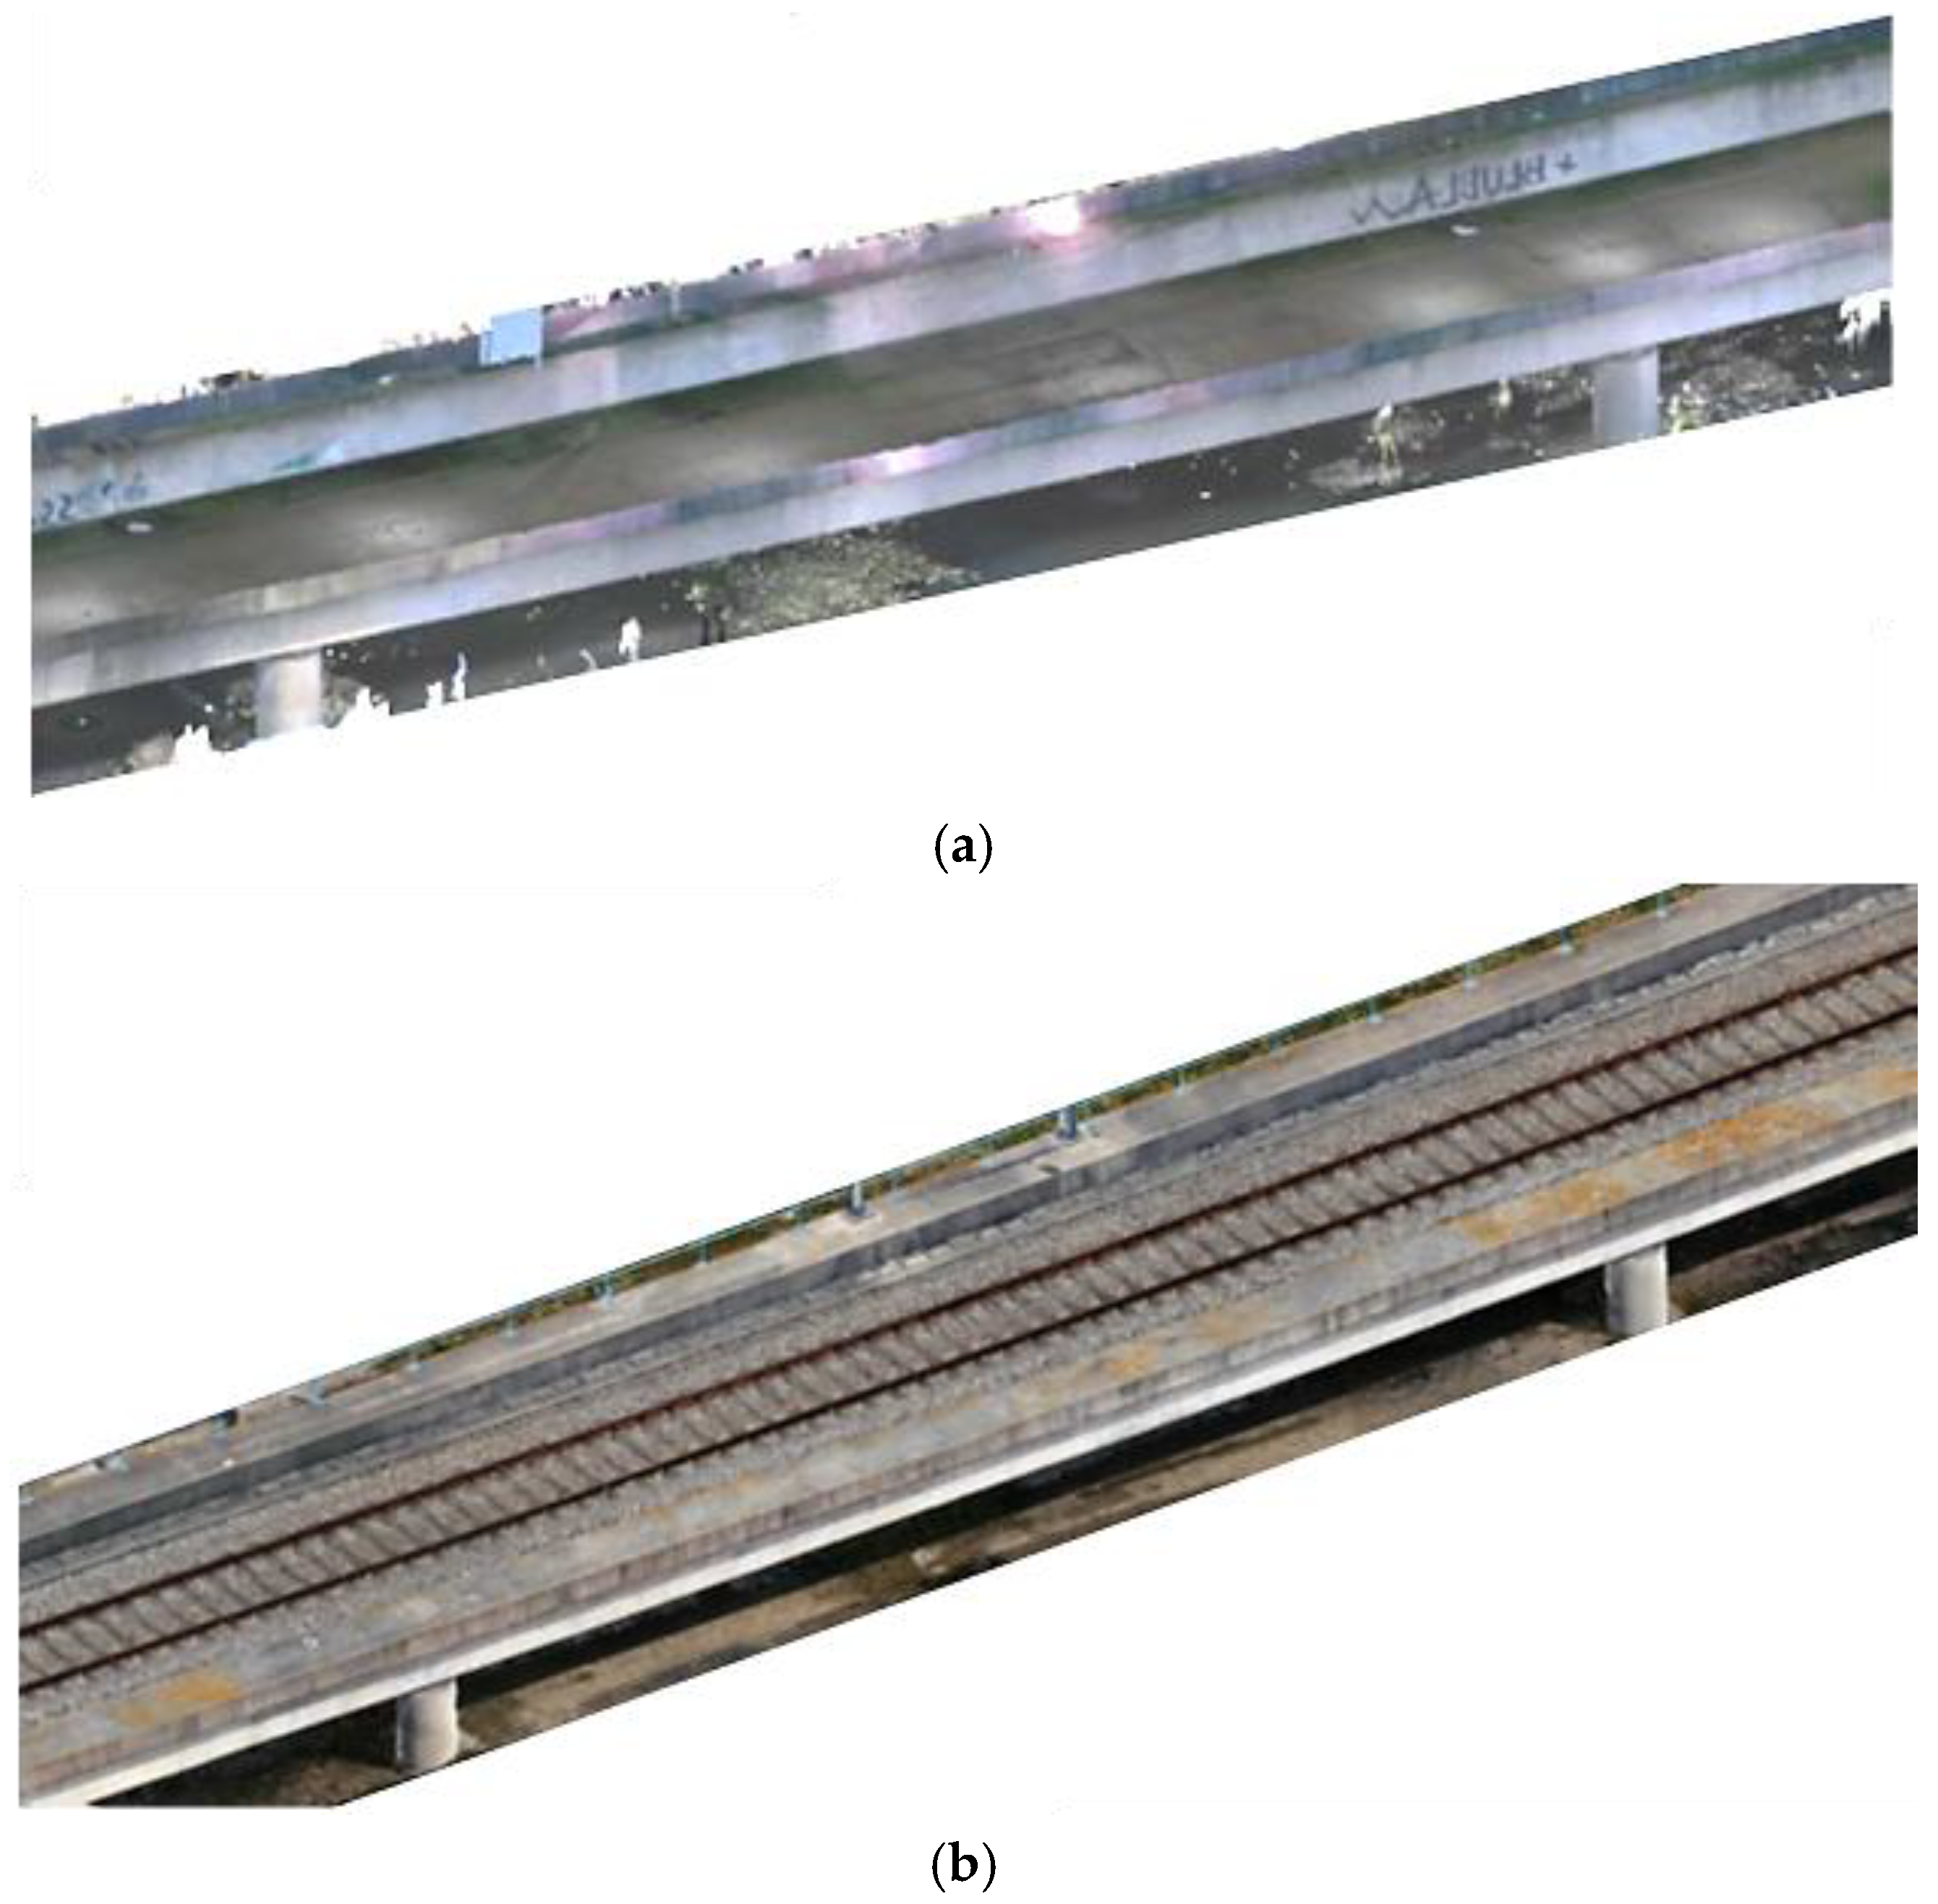
The model created in ContextCapture using TLS data includes the lateral and bottom deck components of the railway bridge and has a high level of accuracy (LOA), including the catenary wires (
Figure 12a). The model built in ContextCapture using UAV image data, on the other hand, includes the lateral and upper deck components and has a a significant level of texture intricacy (
Figure 12b).
As a result, the objective was to create a model that included both vision system technologies in order to perform a data fusion and to be able to design the entire deck. LiDAR technology generated a detailed point cloud representation of lateral and bottom deck portions of the railway bridge, along with the terrain beneath the deck, with a mean resolution of 9 mm, equivalent to LOA30. Complementary, photogrammetry generated highly textured lateral and upper deck portions with a mean Ground Sample Distance (GSD) of 1.04 mm/px, equivalent to LOA40.
The hybrid registration of LiDAR and UAV photogrammetry technologies enables the creation of complete models of complex objects by employing each one in settings that provide the best operating circumstances. However, when acquiring a spatial model, one of the objectives is to create the point cloud model with the highest possible accuracy for the modeling stage [
37]. As a result, robust registration algorithms were proposed to merge LIDAR technology with SfM-based UAVs in such specialized platforms [
19,
20], e.g., ContextCapture, RealityCapture, Metashape, and CloudCompare.
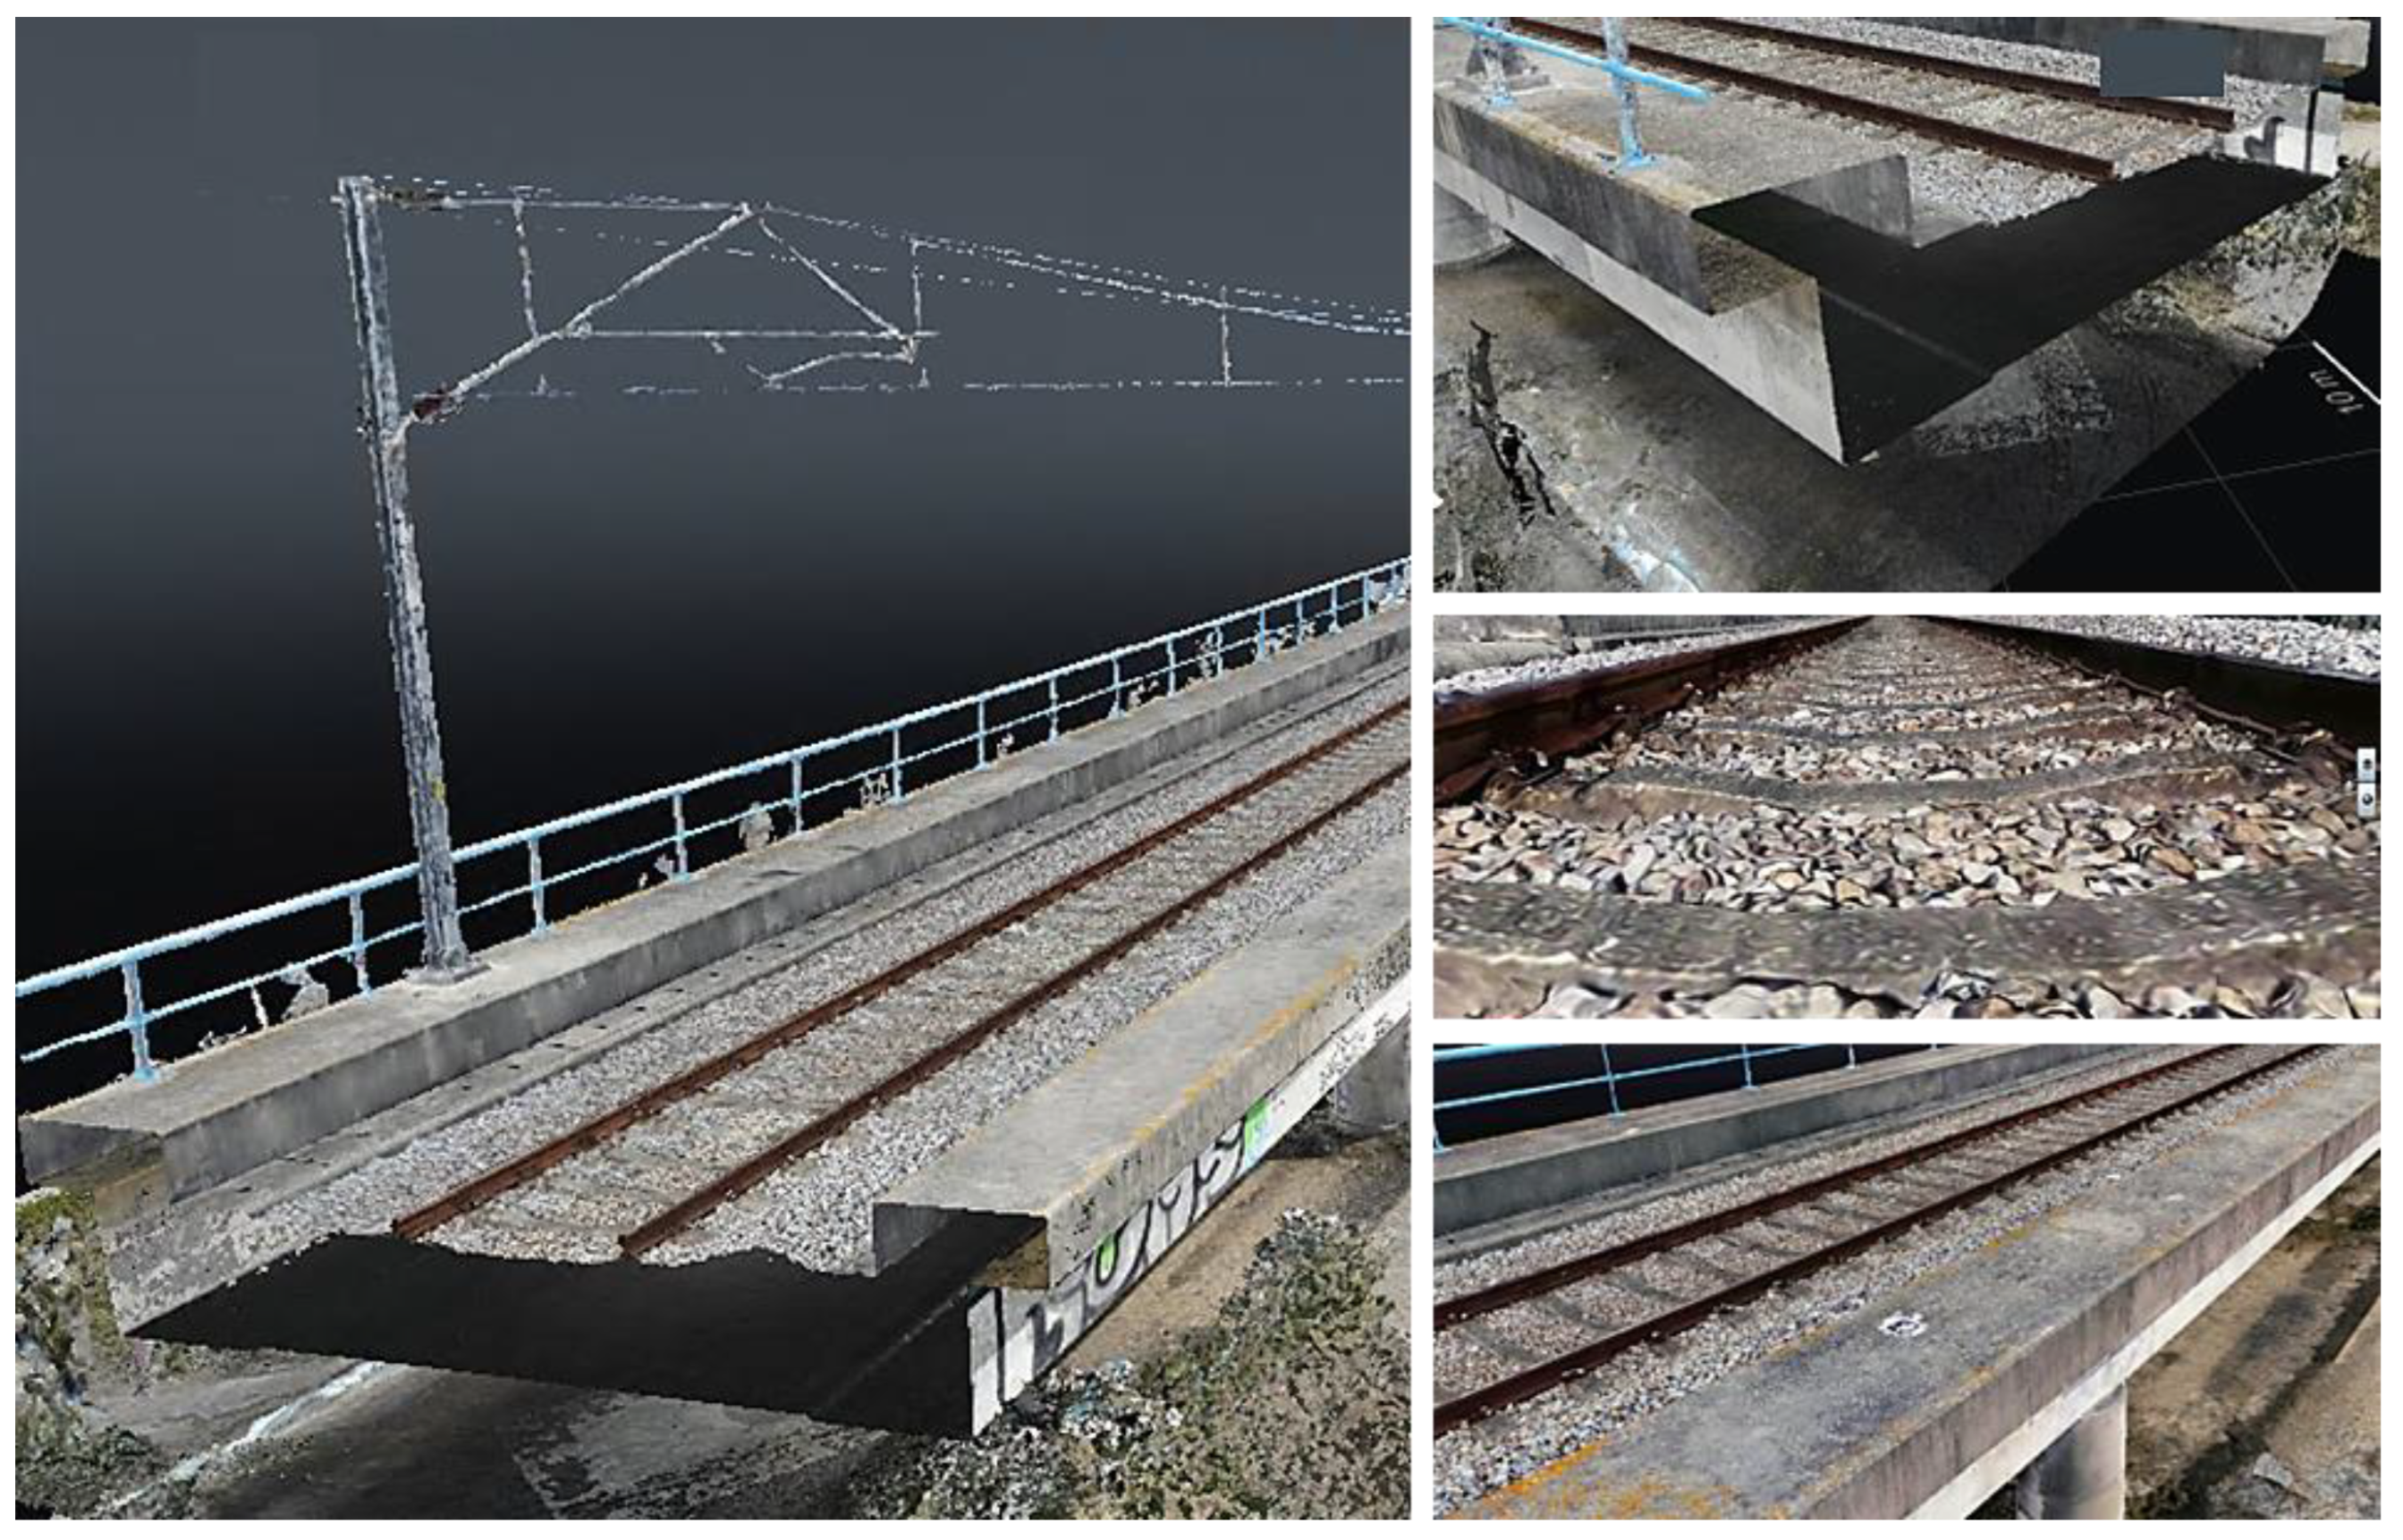
Figure 13 illustrates the mesh model results obtained from ContextCapture software, and several close-up photographs are provided in
Figure 14. The hybrid point cloud was meticulously cleaned to retain only the bridge components, resulting in a total of 1,026,722 points. It is crucial to emphasize that the outcomes of this study carry substantial industry implications, as they offer a robust tool for surveying and monitoring extensive infrastructure projects.
Such a digital model can be used for inspection purposes to identify single and numerous anomalies, often related to concrete cracks and delamination; material loss, water leakage; exposed steel rebars, and bearing deterioration. Also, the experimental data may be used to develop, update, and validate the FE numerical models of bridges under service trains, creating a trustworthy and accurate BrIM and DT.
4.4. As-Designed Model
The as-designed model was manually created based on the design project [
35]. The steps are discussed below and will focus on representing the graphical parameters of the bridge components.
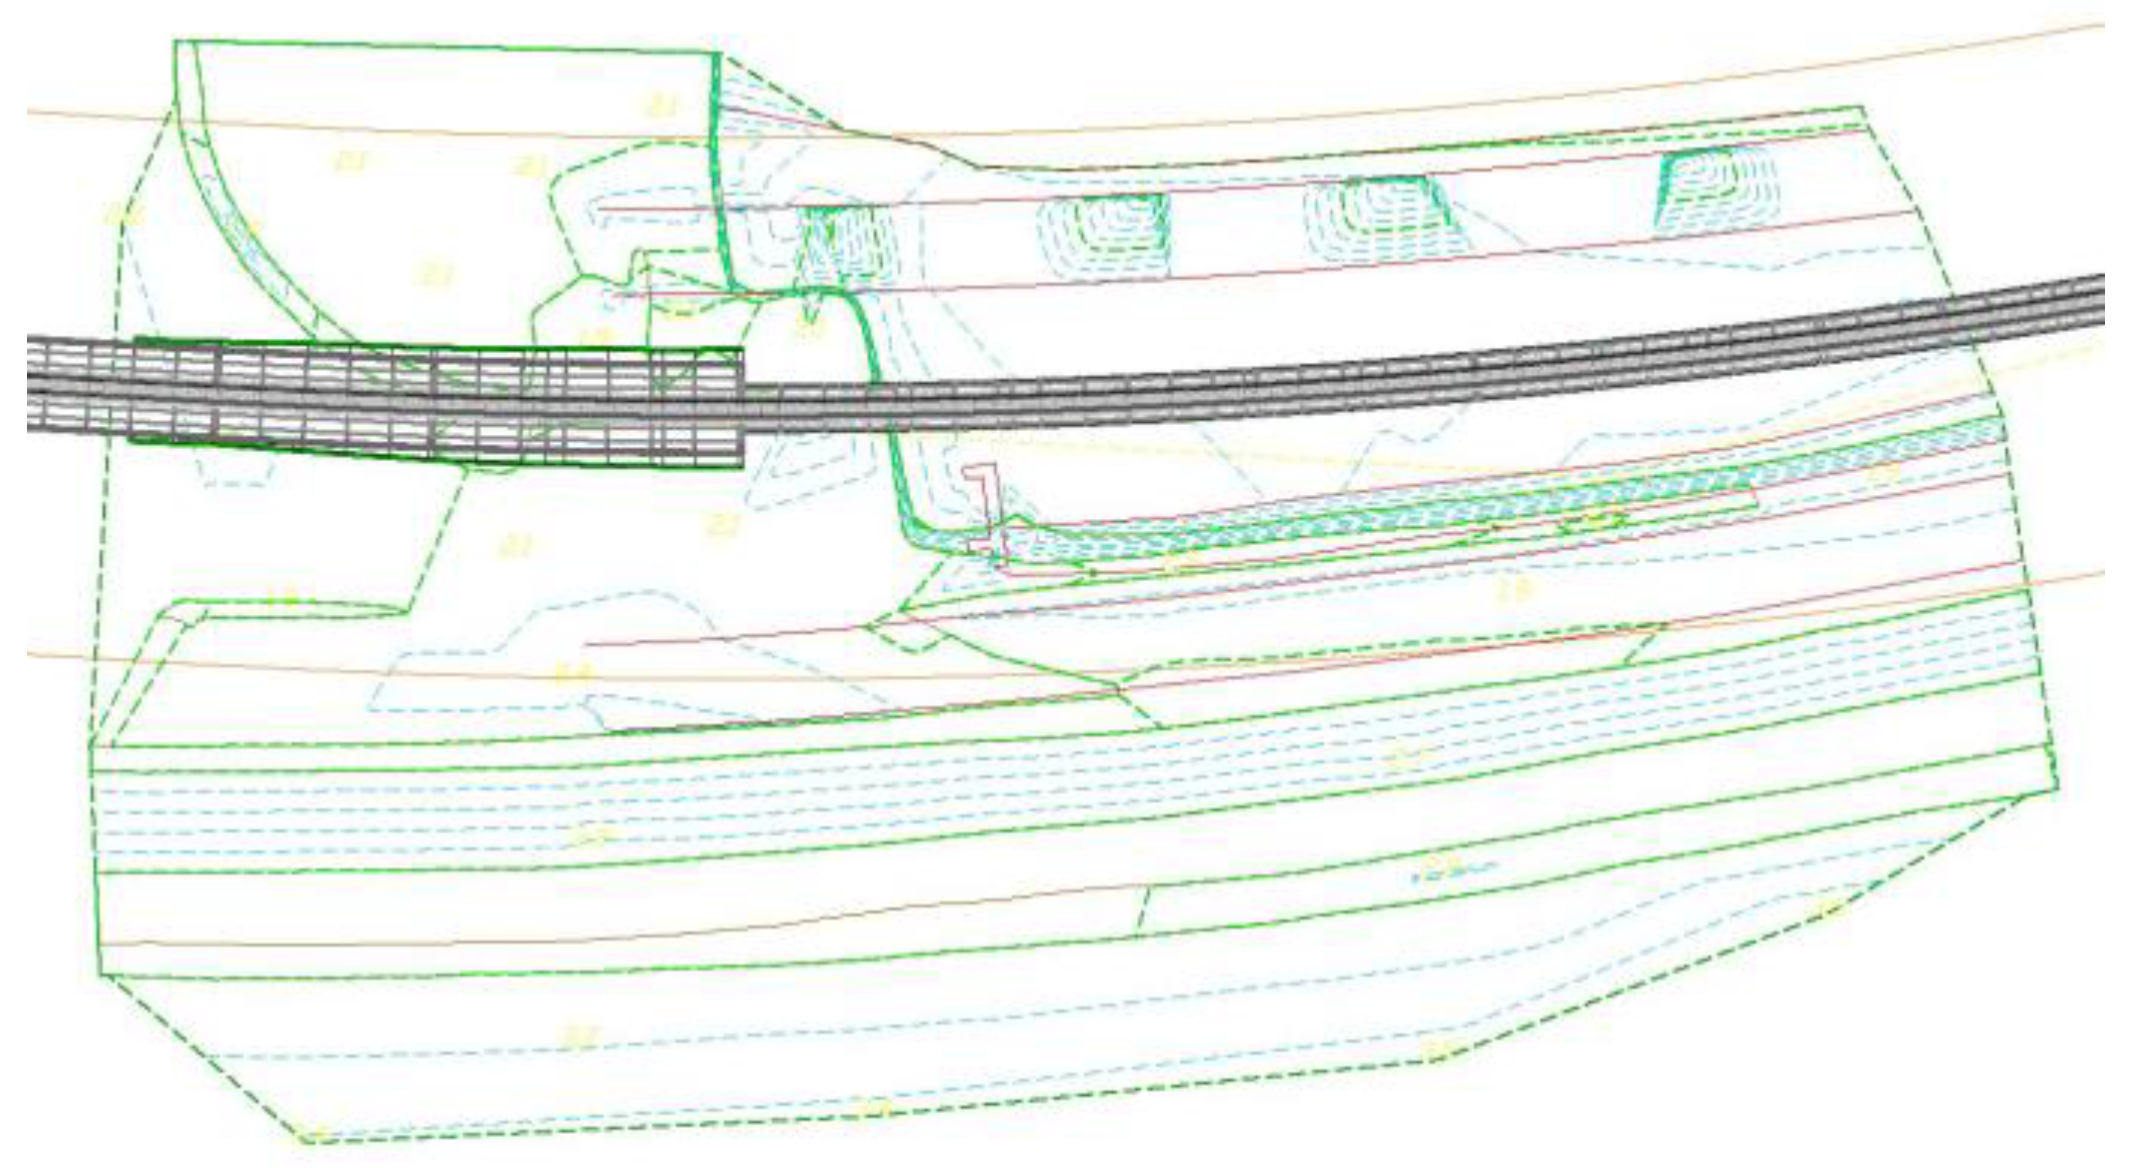
The process of development begins with modeling the surrounding landscape based on the volumetry of the current landscape. The railway line’s centerline was projected in a plan at the coordinates specified in the design project using the terrain model. With this modeled information, a longitudinal profile along the terrain’s centerline was created, as well as the railway track.
Based on these data, it was feasible to create a corridor with the terrain and platform geometry while following the planimetric and altimetric layout described in the railway design, according to the results presented in
Figure 15.
Furthermore, three templates for the cross-section of the deck were implemented along the longitudinal profile, as well as other components, such as a pier, piles, and abutments are set accordingly to the design project. The components are strictly parametric and were linked to each other, for example, the height of the top of the piers is given as a distance to the bottom face of the deck and is dynamically restricted to that face.
Finally, the as-designed model is successfully saved in OBJ format, which includes only geometric and material information for the 3D model. This result was subsequently explored in the CloudCompare software, which is a free, open source point cloud, and mesh processing software.
4.5. Analysis of Geometric Deviations
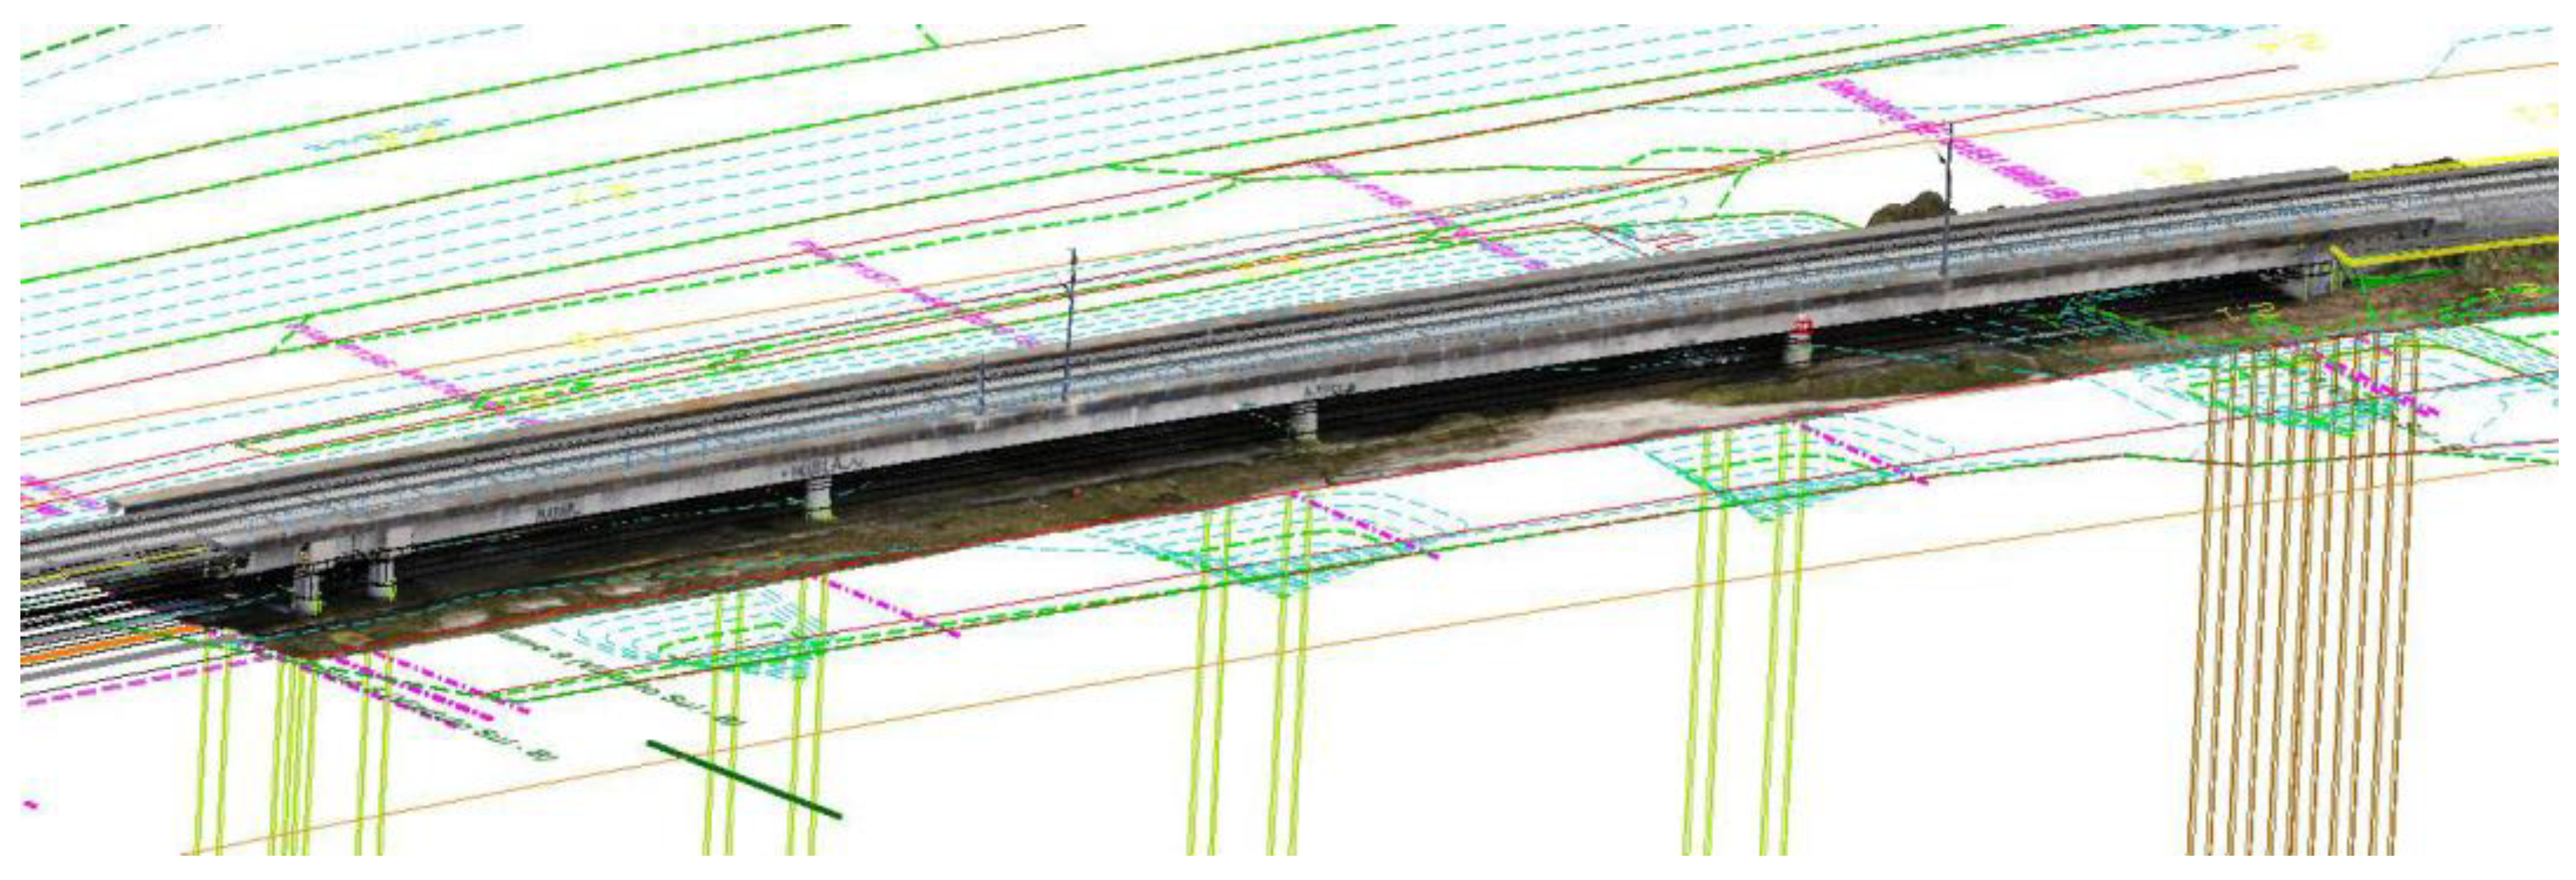
One of the outputs produced is a comparison between the as-is reality-captured model and the as-designed model. Additionally, a virtual visual inspection of the high-resolution textured as-is model is performed with no significant damage detected. The use of reality capture technology allows for the efficient and comprehensive recording of the condition state of an existing bridge, aiding in project quality inspection and acceptance by detecting geometric deviations. The combination of information from both representative models has been demonstrated to be highly effective, resulting in a unified georeferenced model, as shown in
Figure 16.
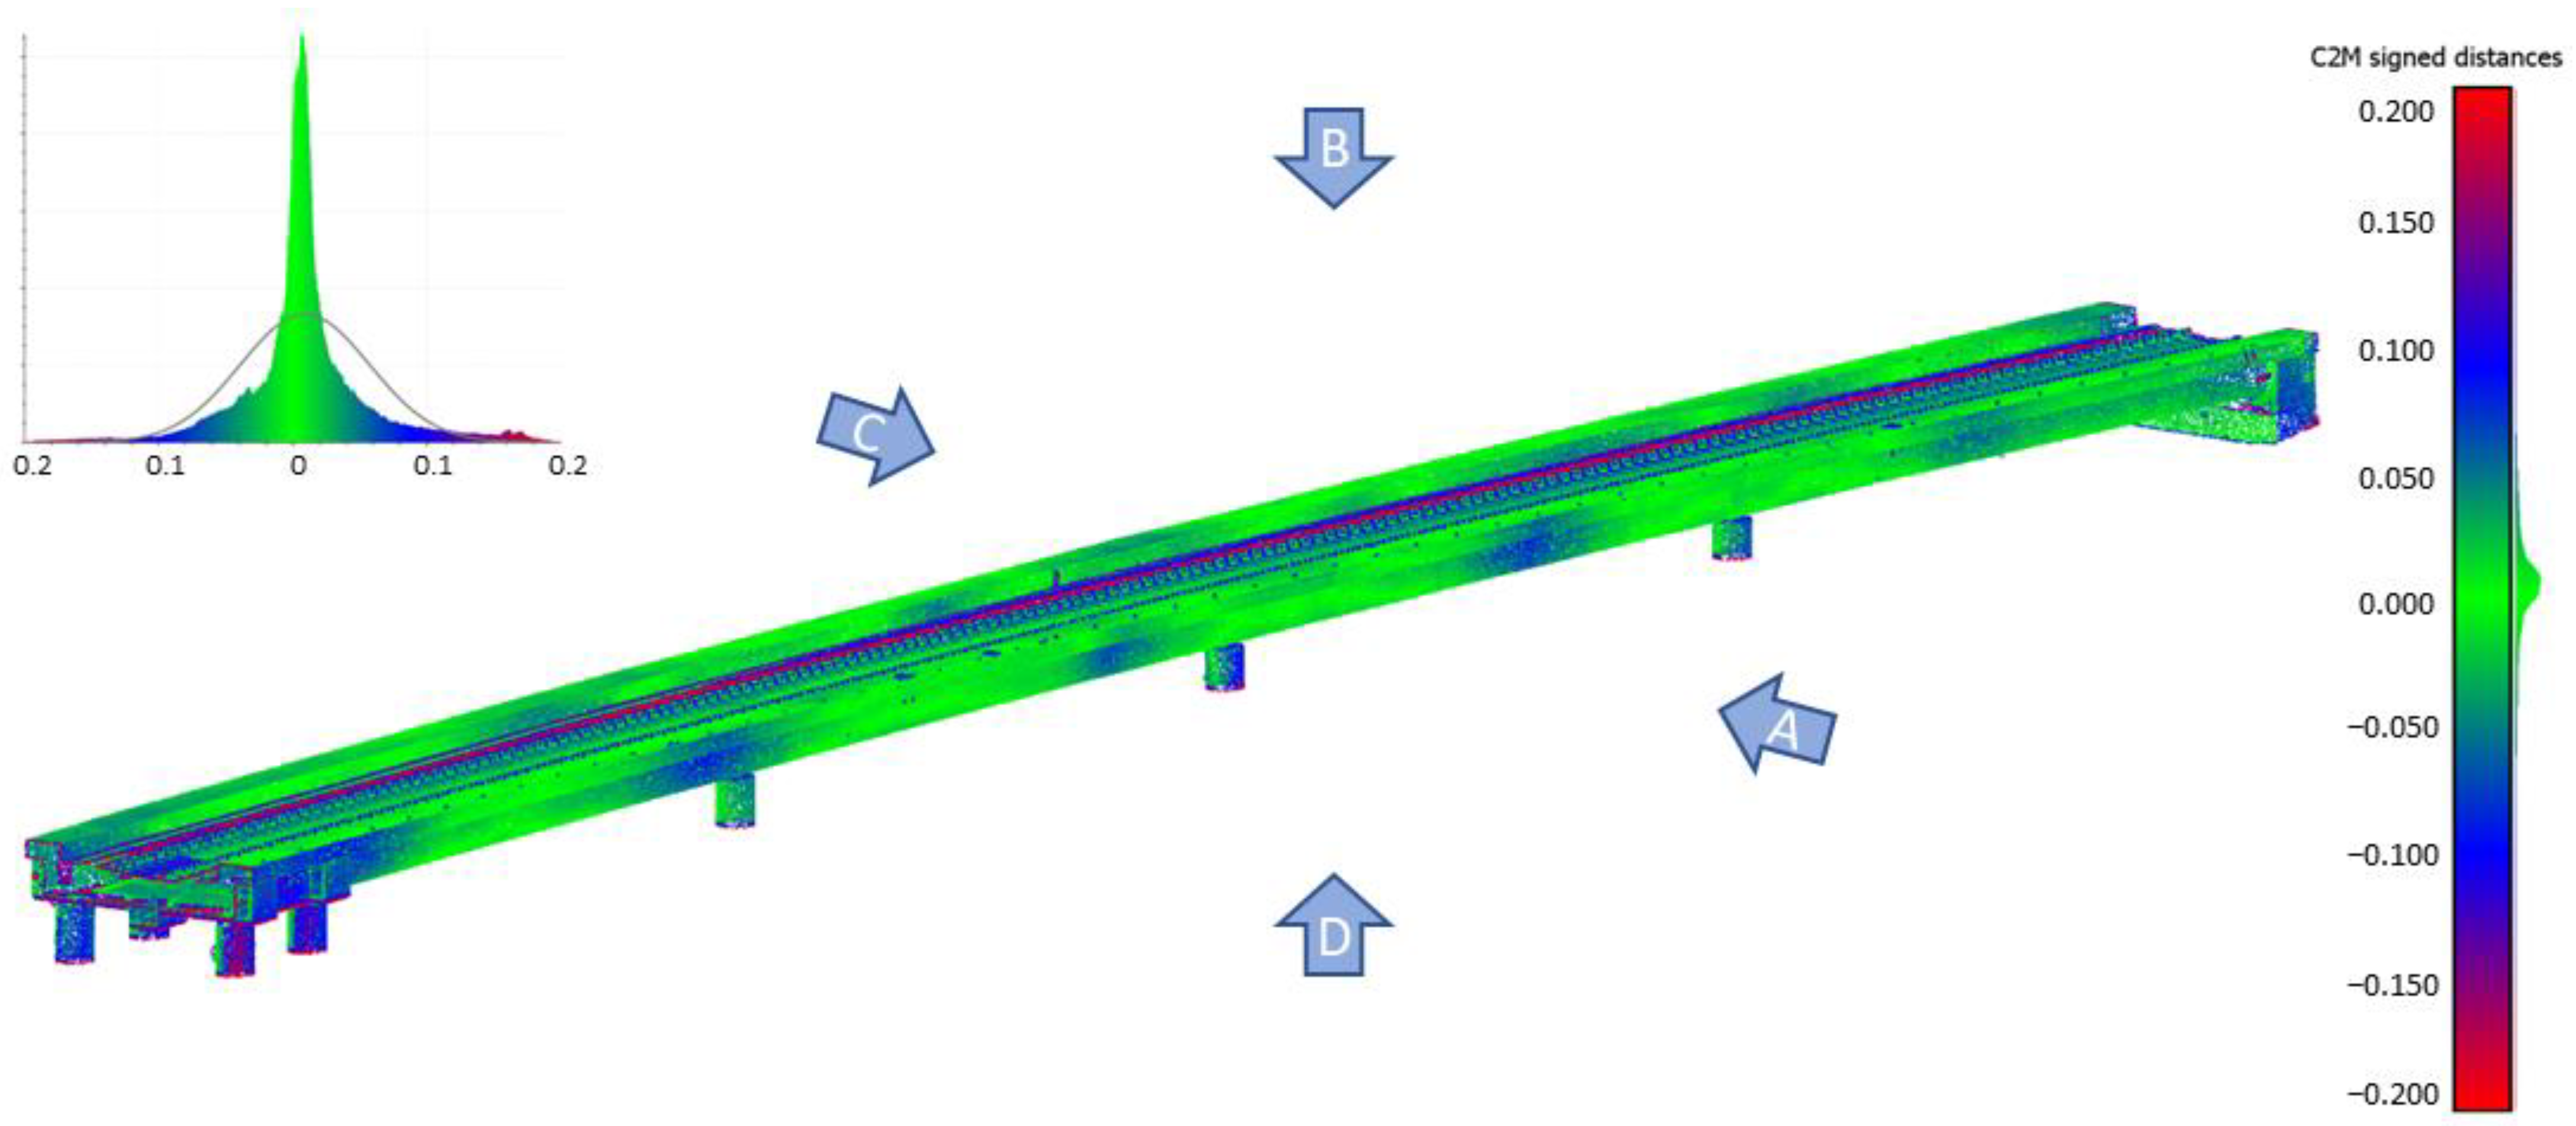
To calculate the absolute distance between both models, the bridge deck (which is 100 m long) and piers were isolated and considered separately. The prerequisite input for the proposed process is an as-designed OBJ and as-is point clouds in order to be mutually comparable. The results are depicted in
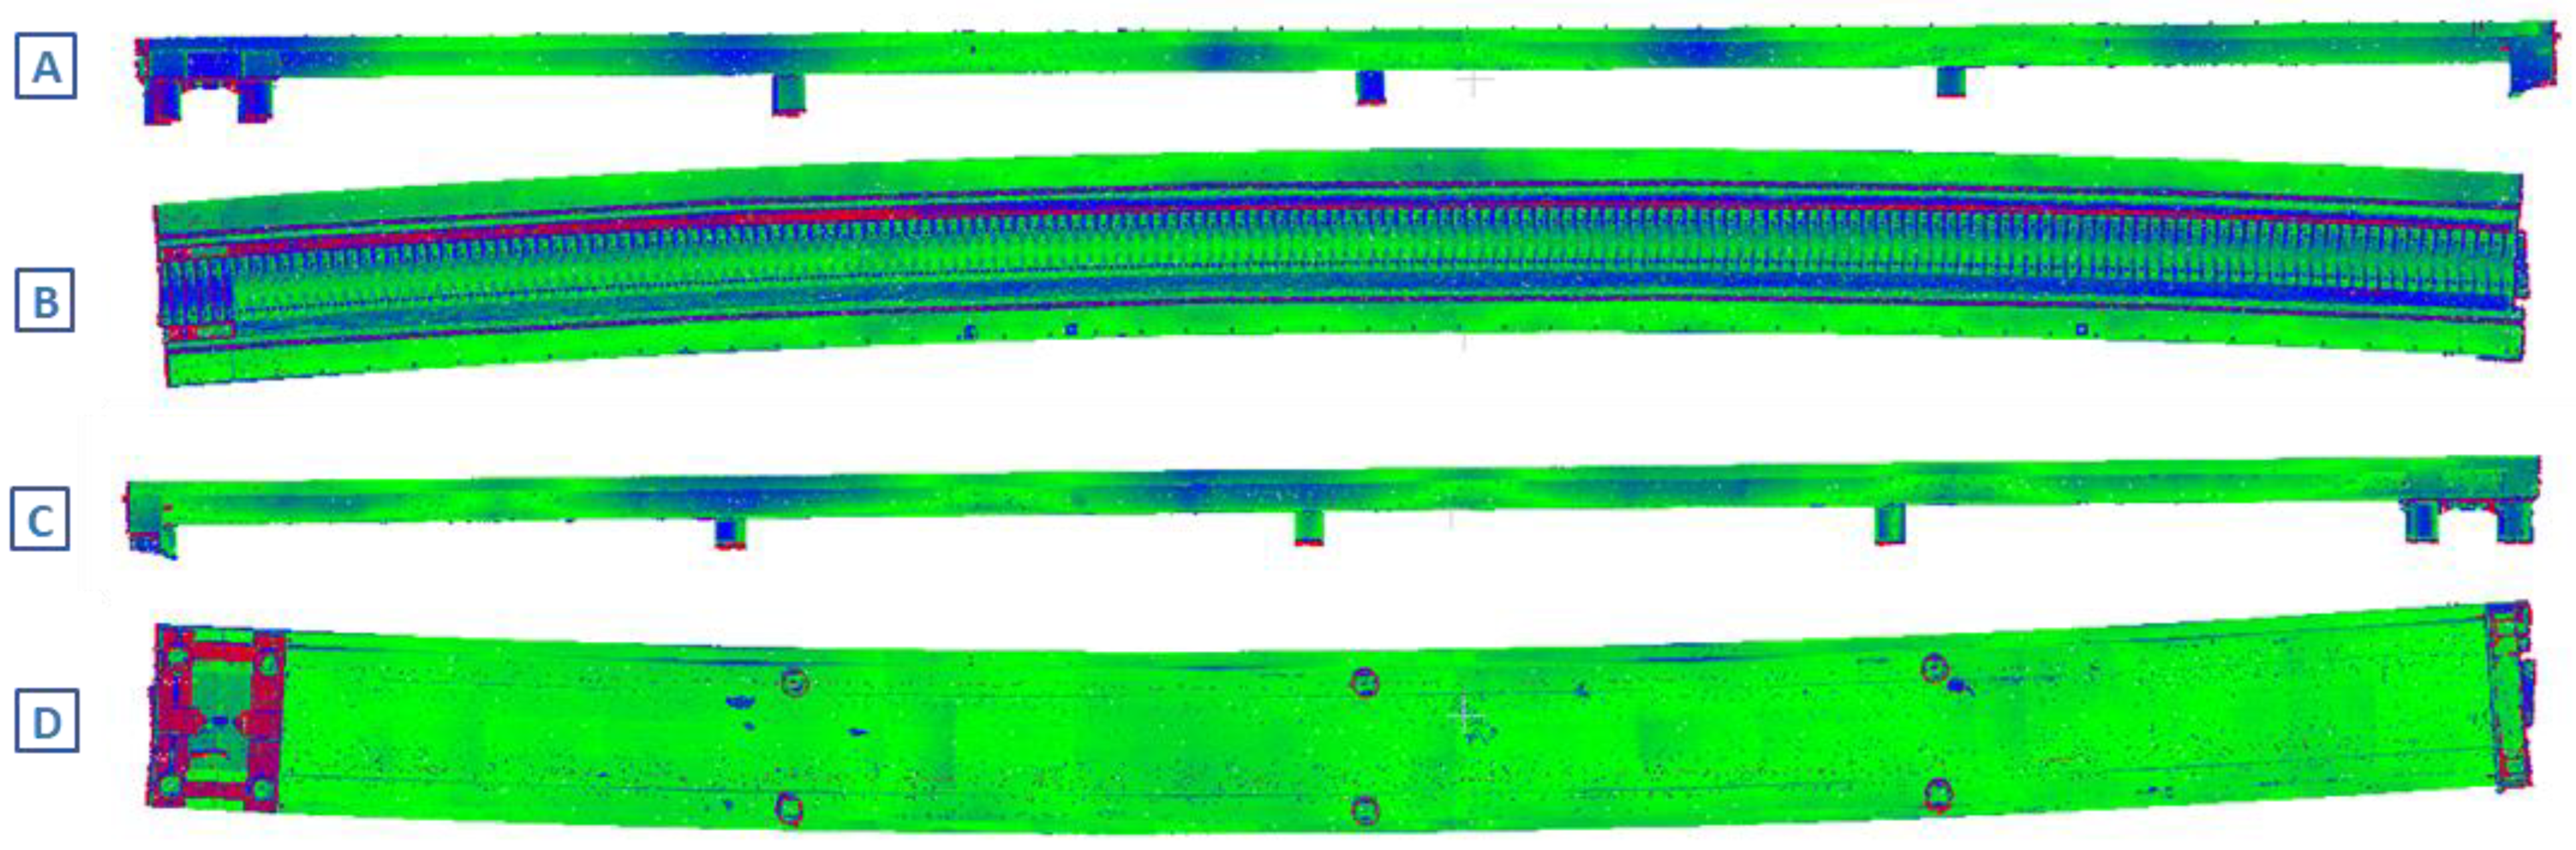
Figure 17 using a color scale that ranges from −200 mm to 200 mm and revealing a global slight deviation with an average value of 9 mm and a standard deviation of 48 mm. This calculation involves dividing the sum of all values in a dataset by the number of values, while considering the true (orthogonal) distance to the reference. Furthermore, each view from the deviation analysis is depicted in
Figure 18. The highest values are observed in the piers, bridge transition zone, and ballast.
The current state of the bridge is reflected in the as-is model. However, it is common for the actual geometry of the railway bridge to deviate from the intended design due to on-site geometric adjustments during construction and a lack of updates to the design geometry. Additionally, concrete bridges may have imperfections resulting from construction inaccuracies, such as slight formwork displacement or deformation from the weight of the fresh concrete, so foundation settlement can also be a less frequent factor [
38].
4.6. Statistical Analysis of Bridge Geometry
When evaluating existing railway bridges, advanced statistical analyses such as the probabilistic method are used to account for the variability in the applied load and load-carrying capacity (related to material, geometry, and analytical model parameters) [
39]. To apply the probabilistic method, it is necessary to determine the variability of the parameters that affect the action (load) and load-carrying capacity of the structure (resistance). There are three main sources of uncertainty in load capacity: material properties, fabrication, and analysis, as noted in the reference [
40,
41].
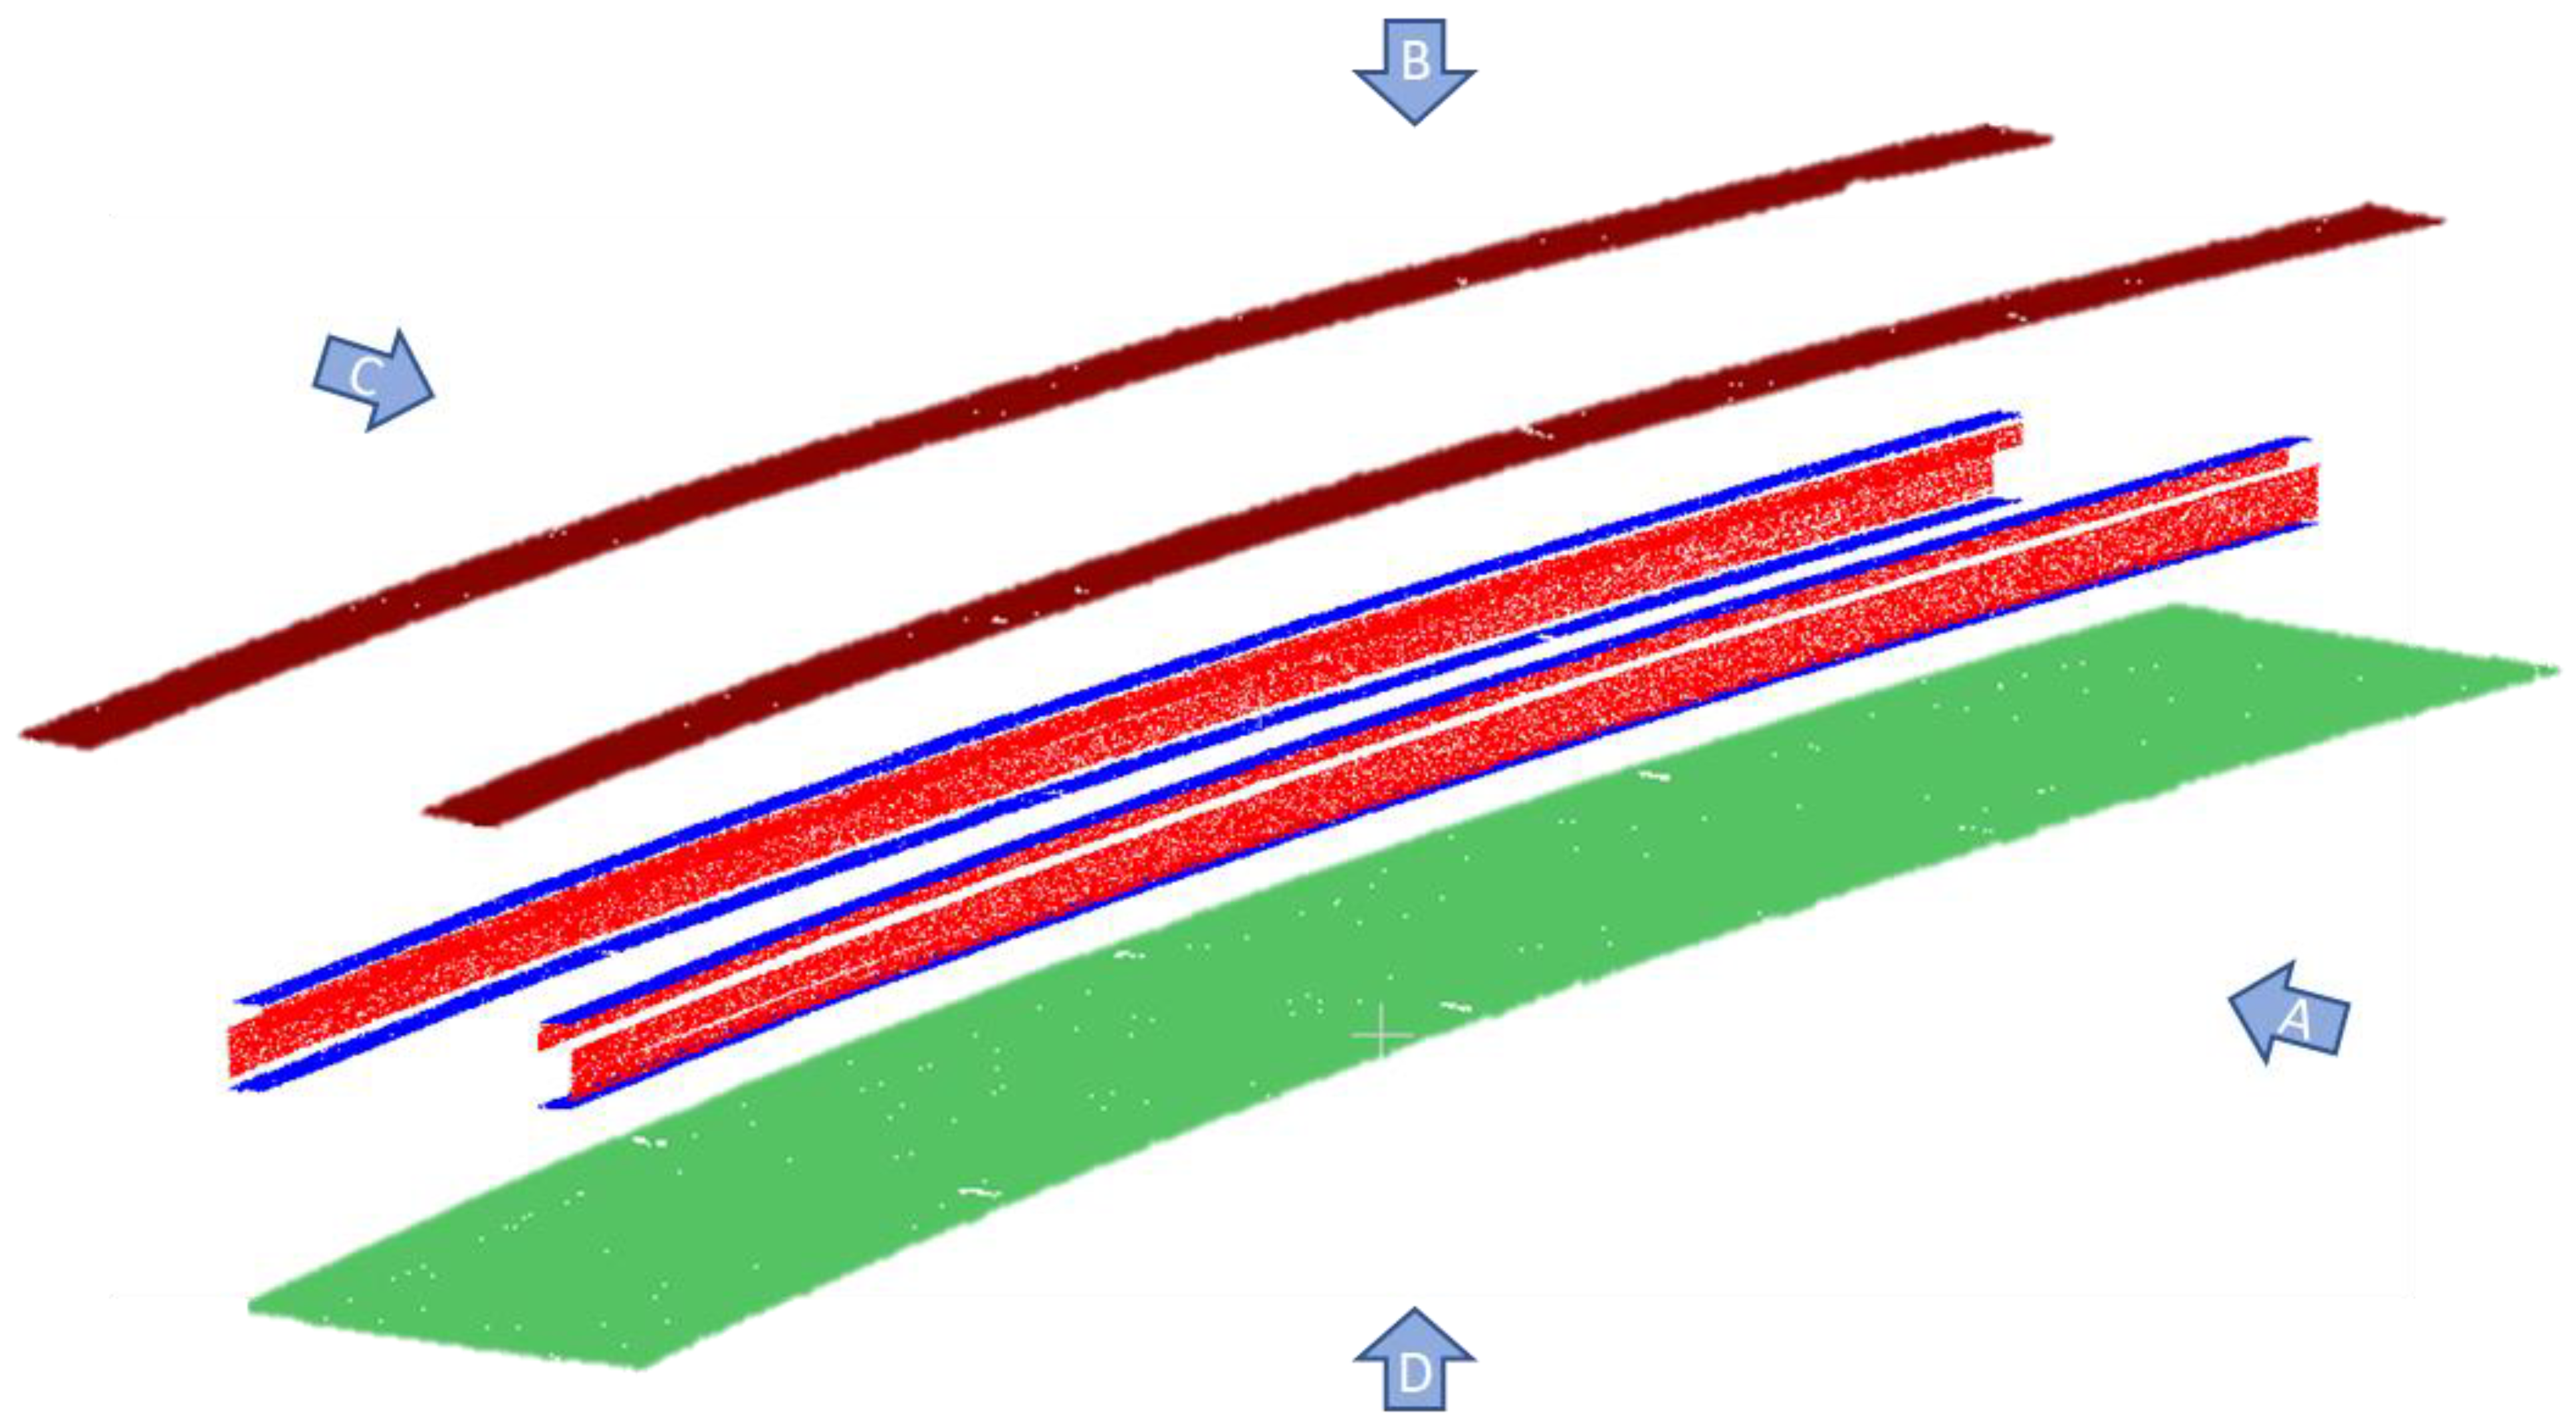
To address the uncertainty related to fabrication, the as-is reality captured model can be used to extract geometry properties. In order to perform the dimension statistical analysis, the surfaces of the as-is reality captured model are distinguished with the help of the RANSAC algorithm [
42], and the segmentation is manually fine-tuned. The result is illustrated in
Figure 19.
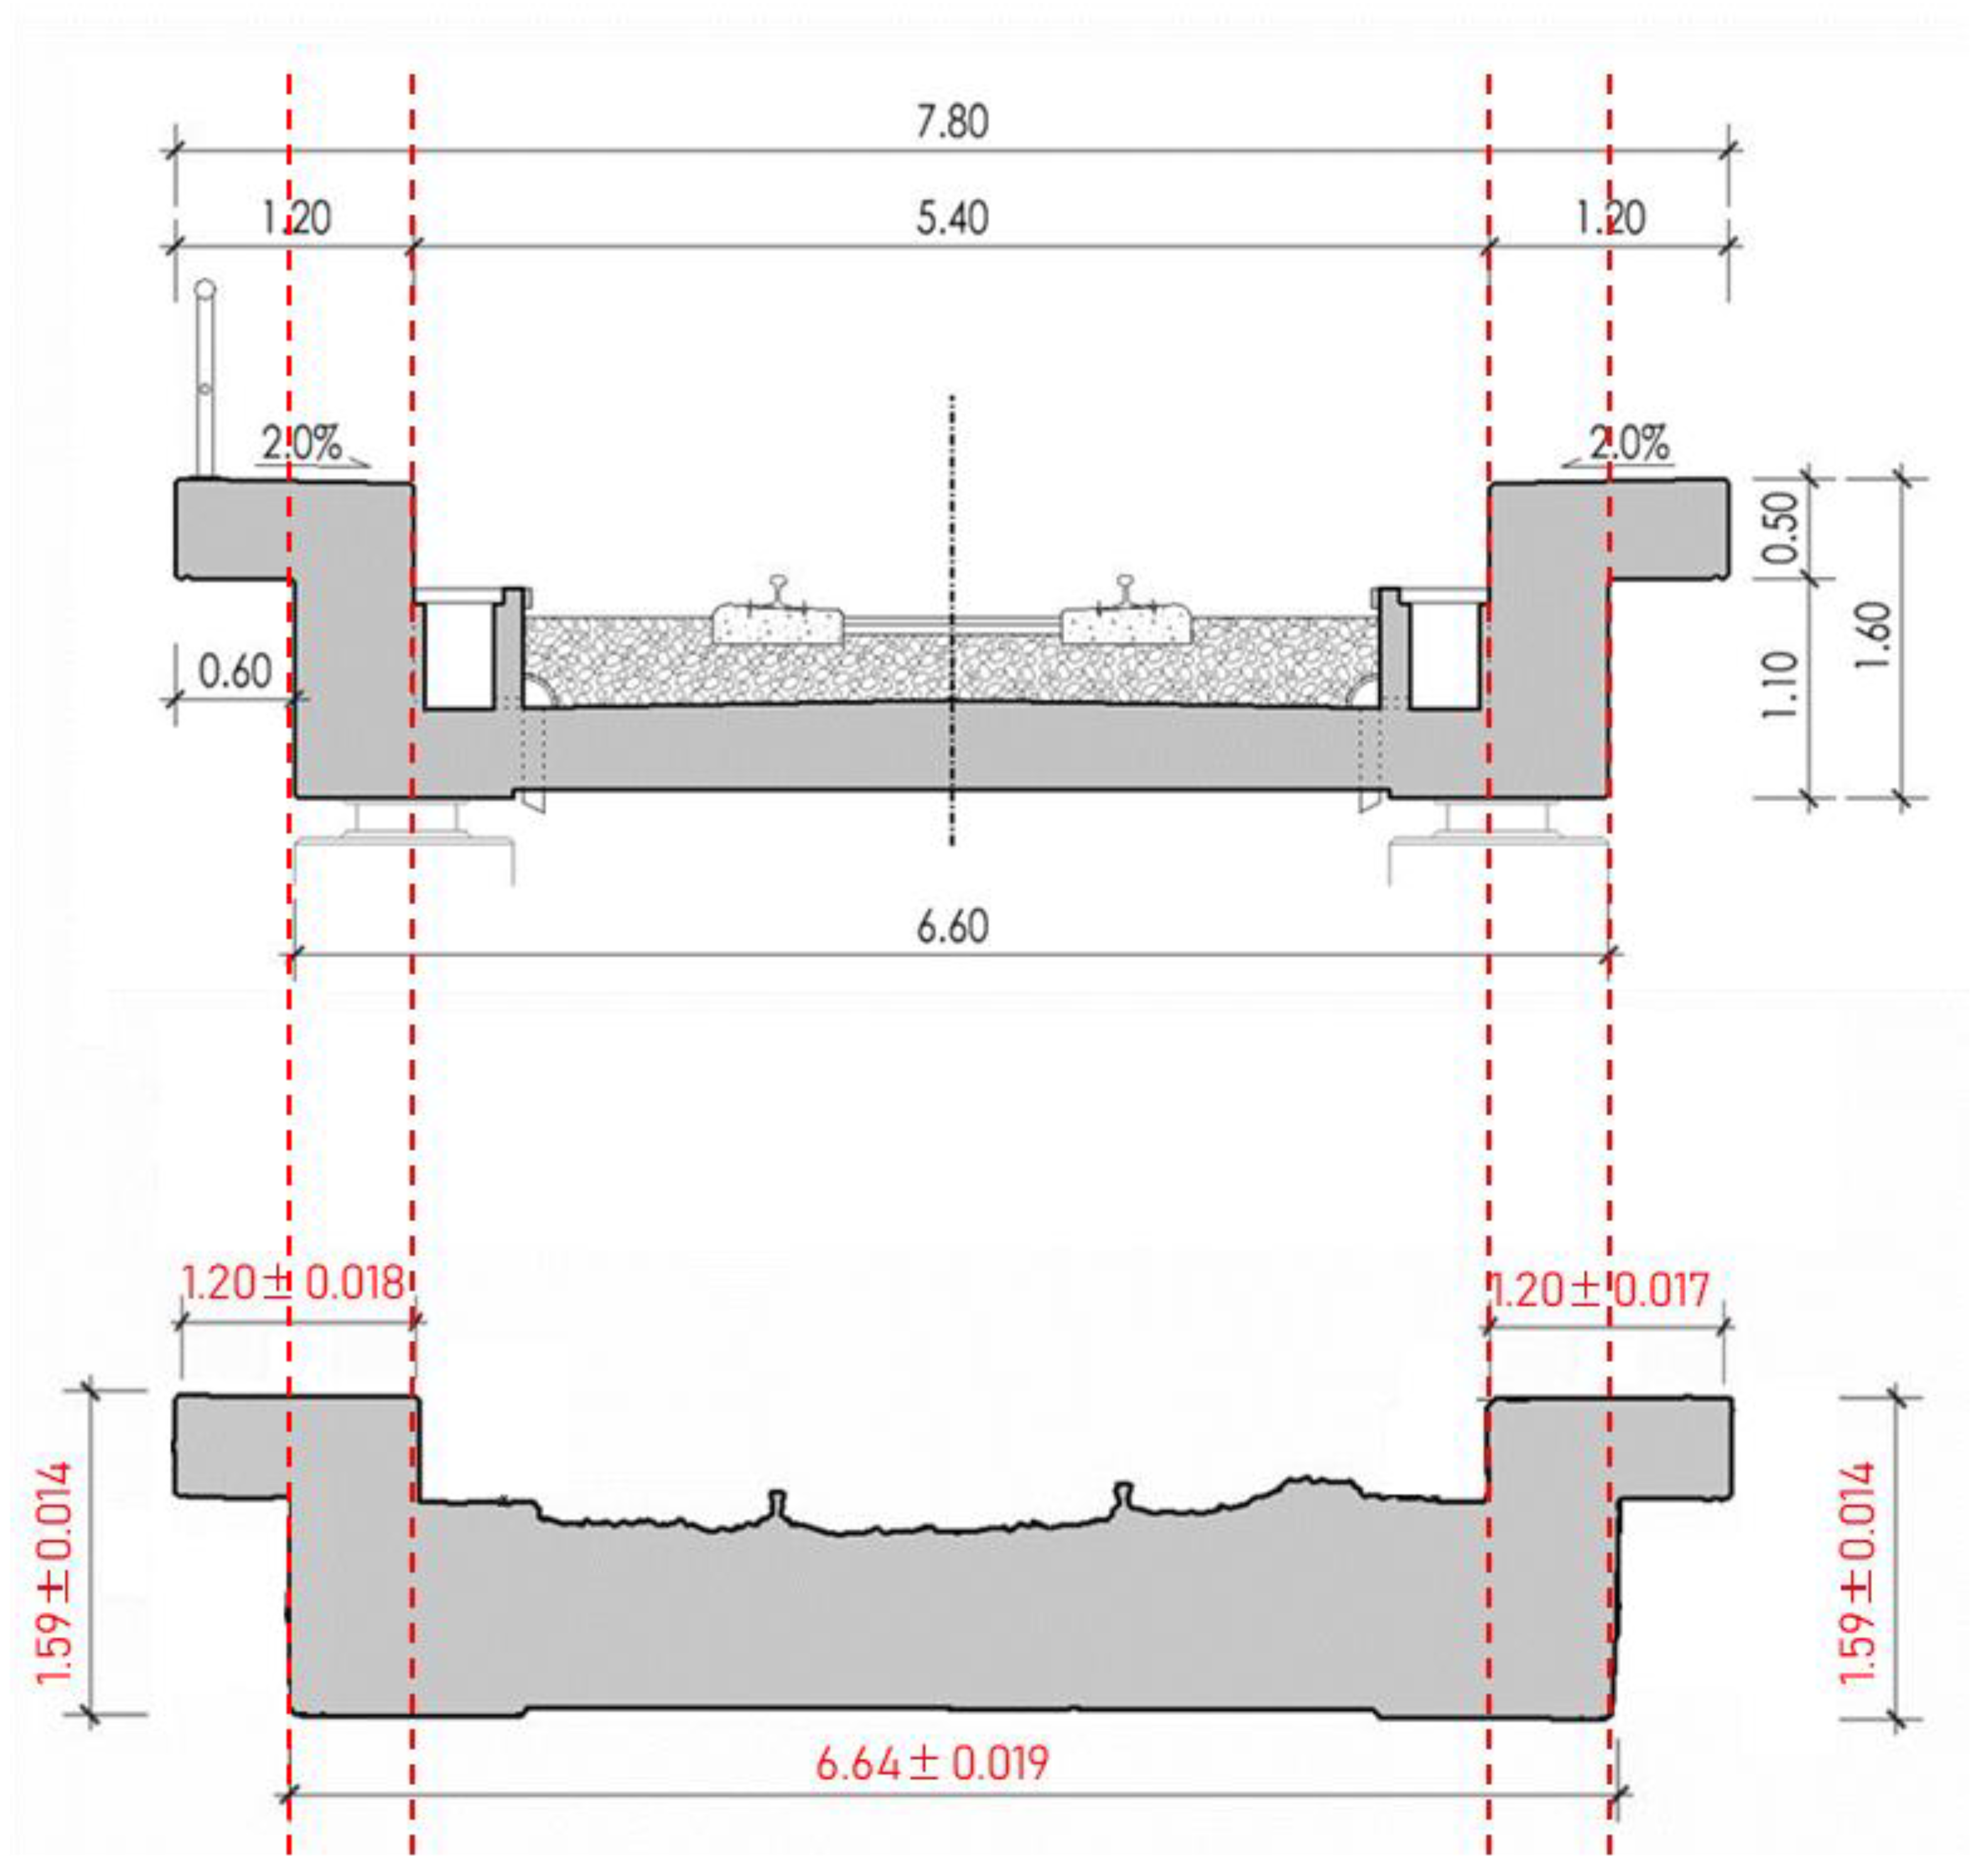
Additionally, a comparison was made between a general as-designed and as-is cross-sectional geometry of the deck, as well as the average and standard deviation of the dimension values along the 100 m length plotted in
Figure 20. This computation entails dividing the total sum of values within a dataset by the count of values, considering the orthogonal distance to the reference as the true measurement.
The results of the main geometry dimensions of girders show that the mean value of the height is slightly smaller than the nominal, while the width is larger than nominal. Both sets of data have small variability. The mean value of slab width is above the nominal width with a small variation. The statistical analysis shows that the normal distribution can reasonably fit the data; however, best-fit distribution analysis reveals that the Weibull distribution better fits the height data, and the Burr distribution better fits the width data. The as-is reality capture model demonstrates the accuracy of the methodology and technologies used in this study.
This section covers the variability of the geometry of the main structure. Further research is going to be performed to evaluate the variability of the material and then a complete reliability analysis could be performed.
Moreover, the utilization of advanced reality capture technologies can potentially aid in the early identification of structural issues, thereby preventing further damage and costly repairs in the future. While there may be an initial investment required for acquiring such equipment and training personnel, the long-term benefits in terms of efficiency, accuracy, and early issue detection make the proposed methodology a cost-effective solution compared to traditional approaches for bridge geometry assessment.
5. Conclusions
This study describes the use of TLS and CRP-based UAV technologies for surveying and creating a 3D model of a railway bridge. The goal was to create an accurate and realistic 3D image-based model of a railway bridge for structural inspection and geometrical deviation checking. The use of cutting-edge reality capture technologies technology has the potential to help in the early detection of structural defects, consequently avoiding potential future damage and costly repairs. However, the side and bottom sections of the deck surfaces were scanned using TLS, while the side and top sections of the deck and the track were captured using a CRP-based UAV. The data fusion of both models resulted in an accurate 3D representation of the entire railway bridge.
Furthermore, a 3D as-designed model was created based on the design documentation. The comparison of both models revealed slight global deviations in structural dimensions with an average value of 9 mm. Regarding the statistical analysis, the girders as the slab, have small variability (below 20 mm) compared to the nominal.
The authors proposed several areas for further research, including evaluating the methodology in a reduced-scale model with known dimensions, performing automated UAV flights, automating tie points to speed up the registration process, incorporating artificial intelligence for local automated damage identification, and an automated and robust surface segmentation algorithm. These research efforts aim to improve the assessment of concrete railway bridge geometry using advanced reality capture technologies, thoroughly evaluating bridge geometry, considering current and historical data, to gain valuable insights into the effectiveness and applicability in accurately capturing and analyzing bridge structures.


 ,
, 


