Article

A Reliability-Based Framework for Damage Accumulation Due to Multiple Earthquakes: A Case Study on Bridges

1
Department of Infrastructure Engineering, University of Melbourne, Melbourne, VIC 3010, Australia
2
School of Engineering, RMIT University, Melbourne, VIC 3000, Australia
3
School of Engineering, University of Southern Queensland, Toowoomba, QLD 4350, Australia
*
Author to whom correspondence should be addressed.
Infrastructures 2023, 8(6), 106; https://doi.org/10.3390/infrastructures8060106
Submission received: 17 April 2023 / Revised: 2 June 2023 / Accepted: 16 June 2023 / Published: 20 June 2023

Abstract

:
Damage accumulation due to multiple seismic impacts over time has a significant effect on the residual service life of the bridge. A reliability-based framework was developed to make decisions in bridge maintenance activities. The feature of the framework enables quantifying the time-dependent probability of failure of bridges due to the impact of multiple earthquakes and progressive deterioration. To estimate the reliability of the bridge systems, the probability of failure of the bridge was used. Two case studies were utilised to demonstrate how the method can be applied to the real world. Results show that the accumulated damage caused by multiple earthquakes and progressive deterioration significantly impact the remaining useful life of the bridge. Furthermore, the soil conditions predominantly influence the progressive deterioration and reduce the service life of the bridge. Overall, the proposed framework enables the sustainable decision-making process for bridge maintenance activities. The results reveal the necessity of including the combined impact in the bridge maintenance system and that there is a more than 40% increase in the probability of failure, due to the combined effect of progressive deterioration and earthquake impacts, compared to the impact only due to seismic loads for the considered case study bridge.

1. Introduction

Earthquakes cause significant damage to infrastructure, human lives, the economy, and the environment. Multiple earthquakes can have compounding impacts, as they can exacerbate the effects of previous earthquakes and lead to cumulative damage. If bridges have already been weakened by previous earthquakes, subsequent earthquakes can cause further damage and lead to collapse, resulting in loss of life and economic losses. Post-earthquake damages illustrate the failures of structures due to damage accumulation [1,2]. Abdelnaby and Elnashai [3] explored the effects of repeated earthquakes on the failure of the Folingo Tower, which survived the main shock on 26th September but failed due to aftershocks on 14th October. Similarly, Bradley and Cubrinovski [4] compared the failure of structures in New Zealand due to earthquakes in September 2010 and February 2011, respectively. Their study found that the damage to most of the structures caused by the earthquake in September 2010 contributed to their partial or full collapse during the earthquake in February 2011. This indicates that multiple low seismic impacts during the service life of bridges can lead to severe damage.
During the service life, bridges could experience multiple earthquake impacts and the damages due to these multiple earthquakes accumulate with time. Severe structural damage or structural collapse due to the accumulation of damage under multiple seismic actions is possible. Some available past earthquake histories highlighted that repeated earthquakes create damage accumulation [5], which induced structural damage and the collapse of infrastructure [3,4]. The reduction in stiffness due to multiple earthquakes is a significant factor [6] and some researchers have examined the accumulated damage to structures by treating multiple seismic events as repeated cyclic loading [7,8,9,10,11]. Furthermore, studies by Amadio et al. [12] and Di Sarno [1] investigated the behaviour of structures under multiple earthquakes by assuming a structure as a single-degree-of-freedom system to identify the factors, such as structural period, type of earthquake pulse, and level of available ductility, which may influence the damage accumulation. The aging of bridges due to corrosion is one of the major problems, and there have been many studies conducted in order to develop models [13] to predict the impact of corrosion fatigue [14,15,16,17,18]. A recent study showed the importance of damage accumulation in bridges considering the corrosion of bridge structures and the framework for quantifying the damage due to multiple earthquakes [2,19,20]. However, the effect of the uncertainties of the return periods and magnitudes of earthquakes, in terms of the damage accumulation of bridge structures, on decision-making regarding maintenance is not fully understood. Furthermore, many studies were conducted to predict ground motion depending on the soil condition [21,22,23,24,25,26,27]. Although damage accumulation models are available in the reported literature [18,28,29], the prediction of the life cycle performance of bridges and the vulnerability of bridges subject to repetitive earthquakes is limited.
The life cycle performance of bridges is an important element in sustainable engineering practice [30,31]. Modelling the damage accumulation mechanism in the life cycle cost analysis is challenging and few analytical models were proposed to account for the damage accumulation in structures due to extreme events [32,33,34]. The time-dependent performance of bridges under multiple earthquake impacts can be presented with a stochastic model to incorporate the uncertainties associated with the parameters [33]. Generally, seismic structural vulnerability is affected by cumulative damage due to repeated seismic events [33,35]. Earthquake occurrence rate and the extent of damage are the two parameters that are used to describe earthquake characteristics probabilistically.
In this study, a reliability-based model was developed to predict the vulnerability of bridges under multiple earthquake impacts in a long-term period, considering earthquake impacts are instantaneous impacts compared to the service life of bridges. The proposed reliability-based analysis framework is established with finite element analysis (FEA) and statistical analysis, which account for the critical parameters (i.e., earthquakes occurrence interval and magnitude and soil conditions) that influence the damage accumulation. The proposed framework can predict the damage accumulation due to multiple moderate earthquake impacts during the service life of a bridge, and this model can be used to calculate the remaining structural performance of the bridge at any time. Generally, the damage caused due to minor and moderate earthquake impacts is not visible compared to severe earthquake damages. Therefore, this framework is mainly useful in the decision-making process of bridge maintenance activities, where decisions are made for repair work.
Australia is located in a low to moderate earthquake region and the damage accumulation caused by these earthquakes on bridges might not be visible compared to the damage caused by strong earthquakes. Although Australia is not located in a high seismic region, repetitive low-intensity earthquakes can accumulate damage and can cause detrimental damage to structures with time [36]. Furthermore, these minor damage in bridges would not be possible to identify during inspections. Two case study bridges located in Australia with different soil conditions were selected to validate the proposed framework to ensure its effectiveness. The life cycle structural performance of bridges under multiple earthquakes is predicted and presented in this paper.

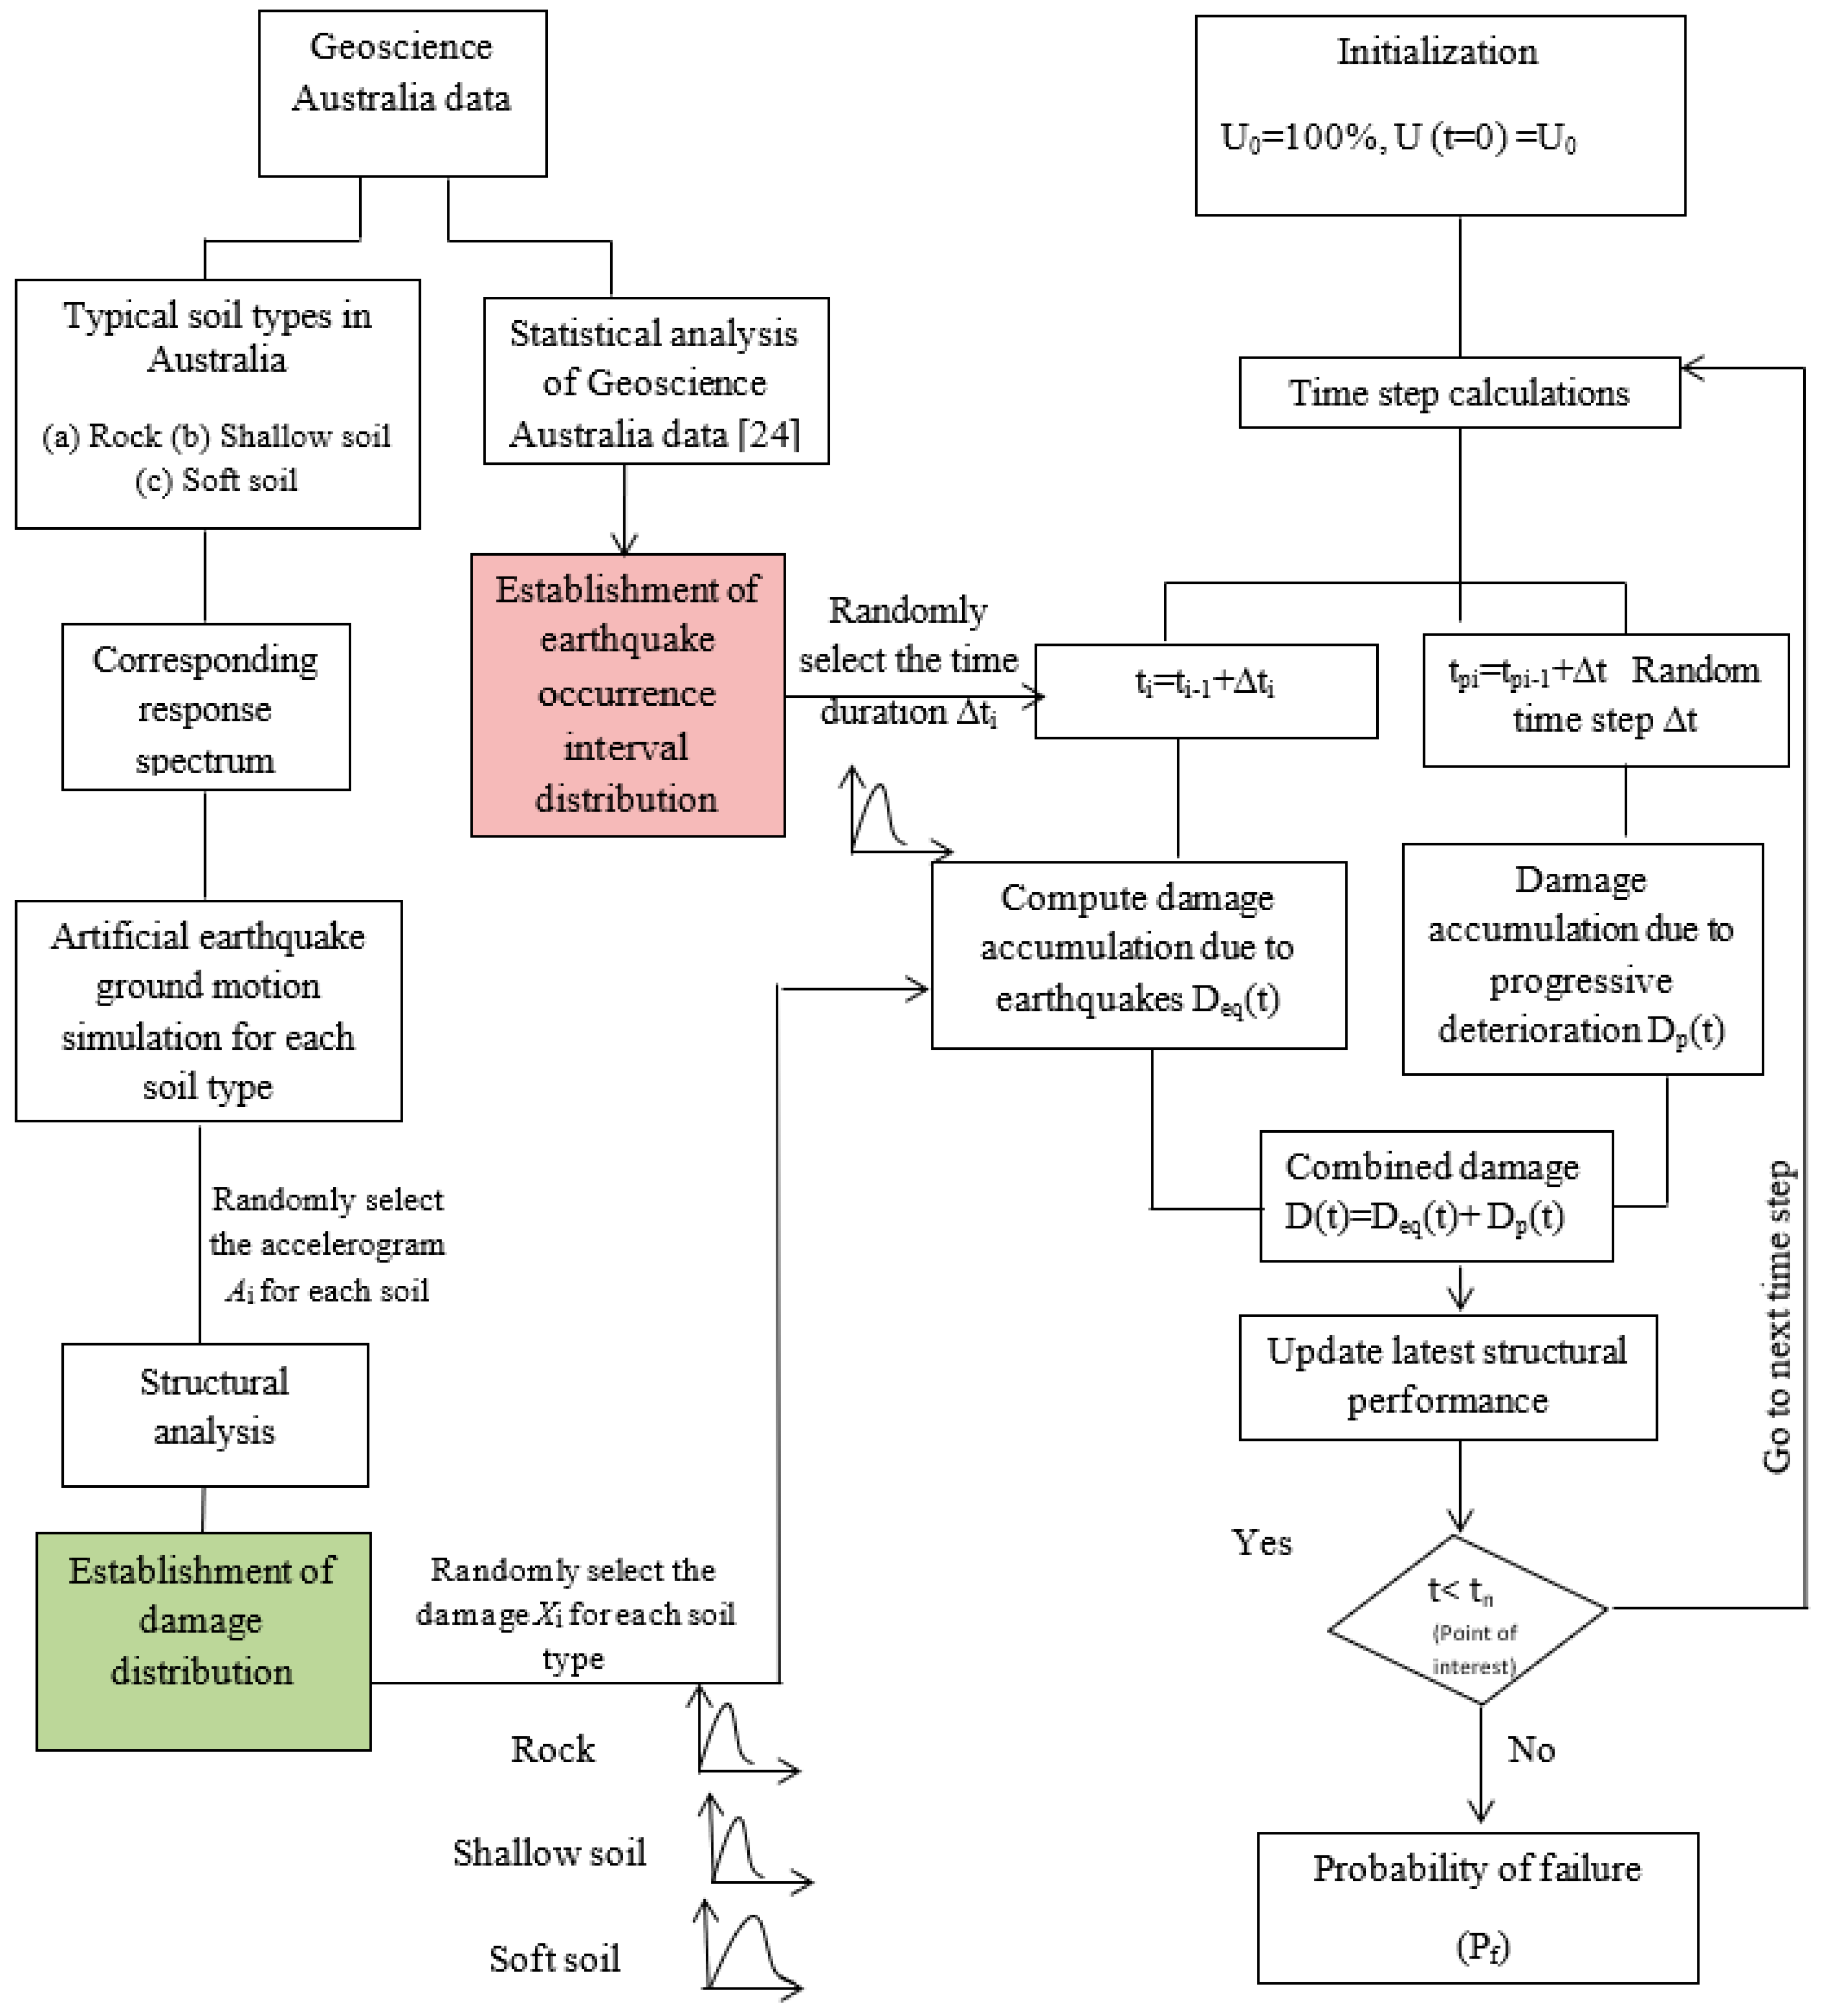
2. The Proposed Framework

The developed reliability-based framework comprises a few key elements. The calculation of damage accumulation due to progressive deterioration, damage due to earthquake impact, and the development of the numerical framework are the main elements. The details of each of these elements are described below.

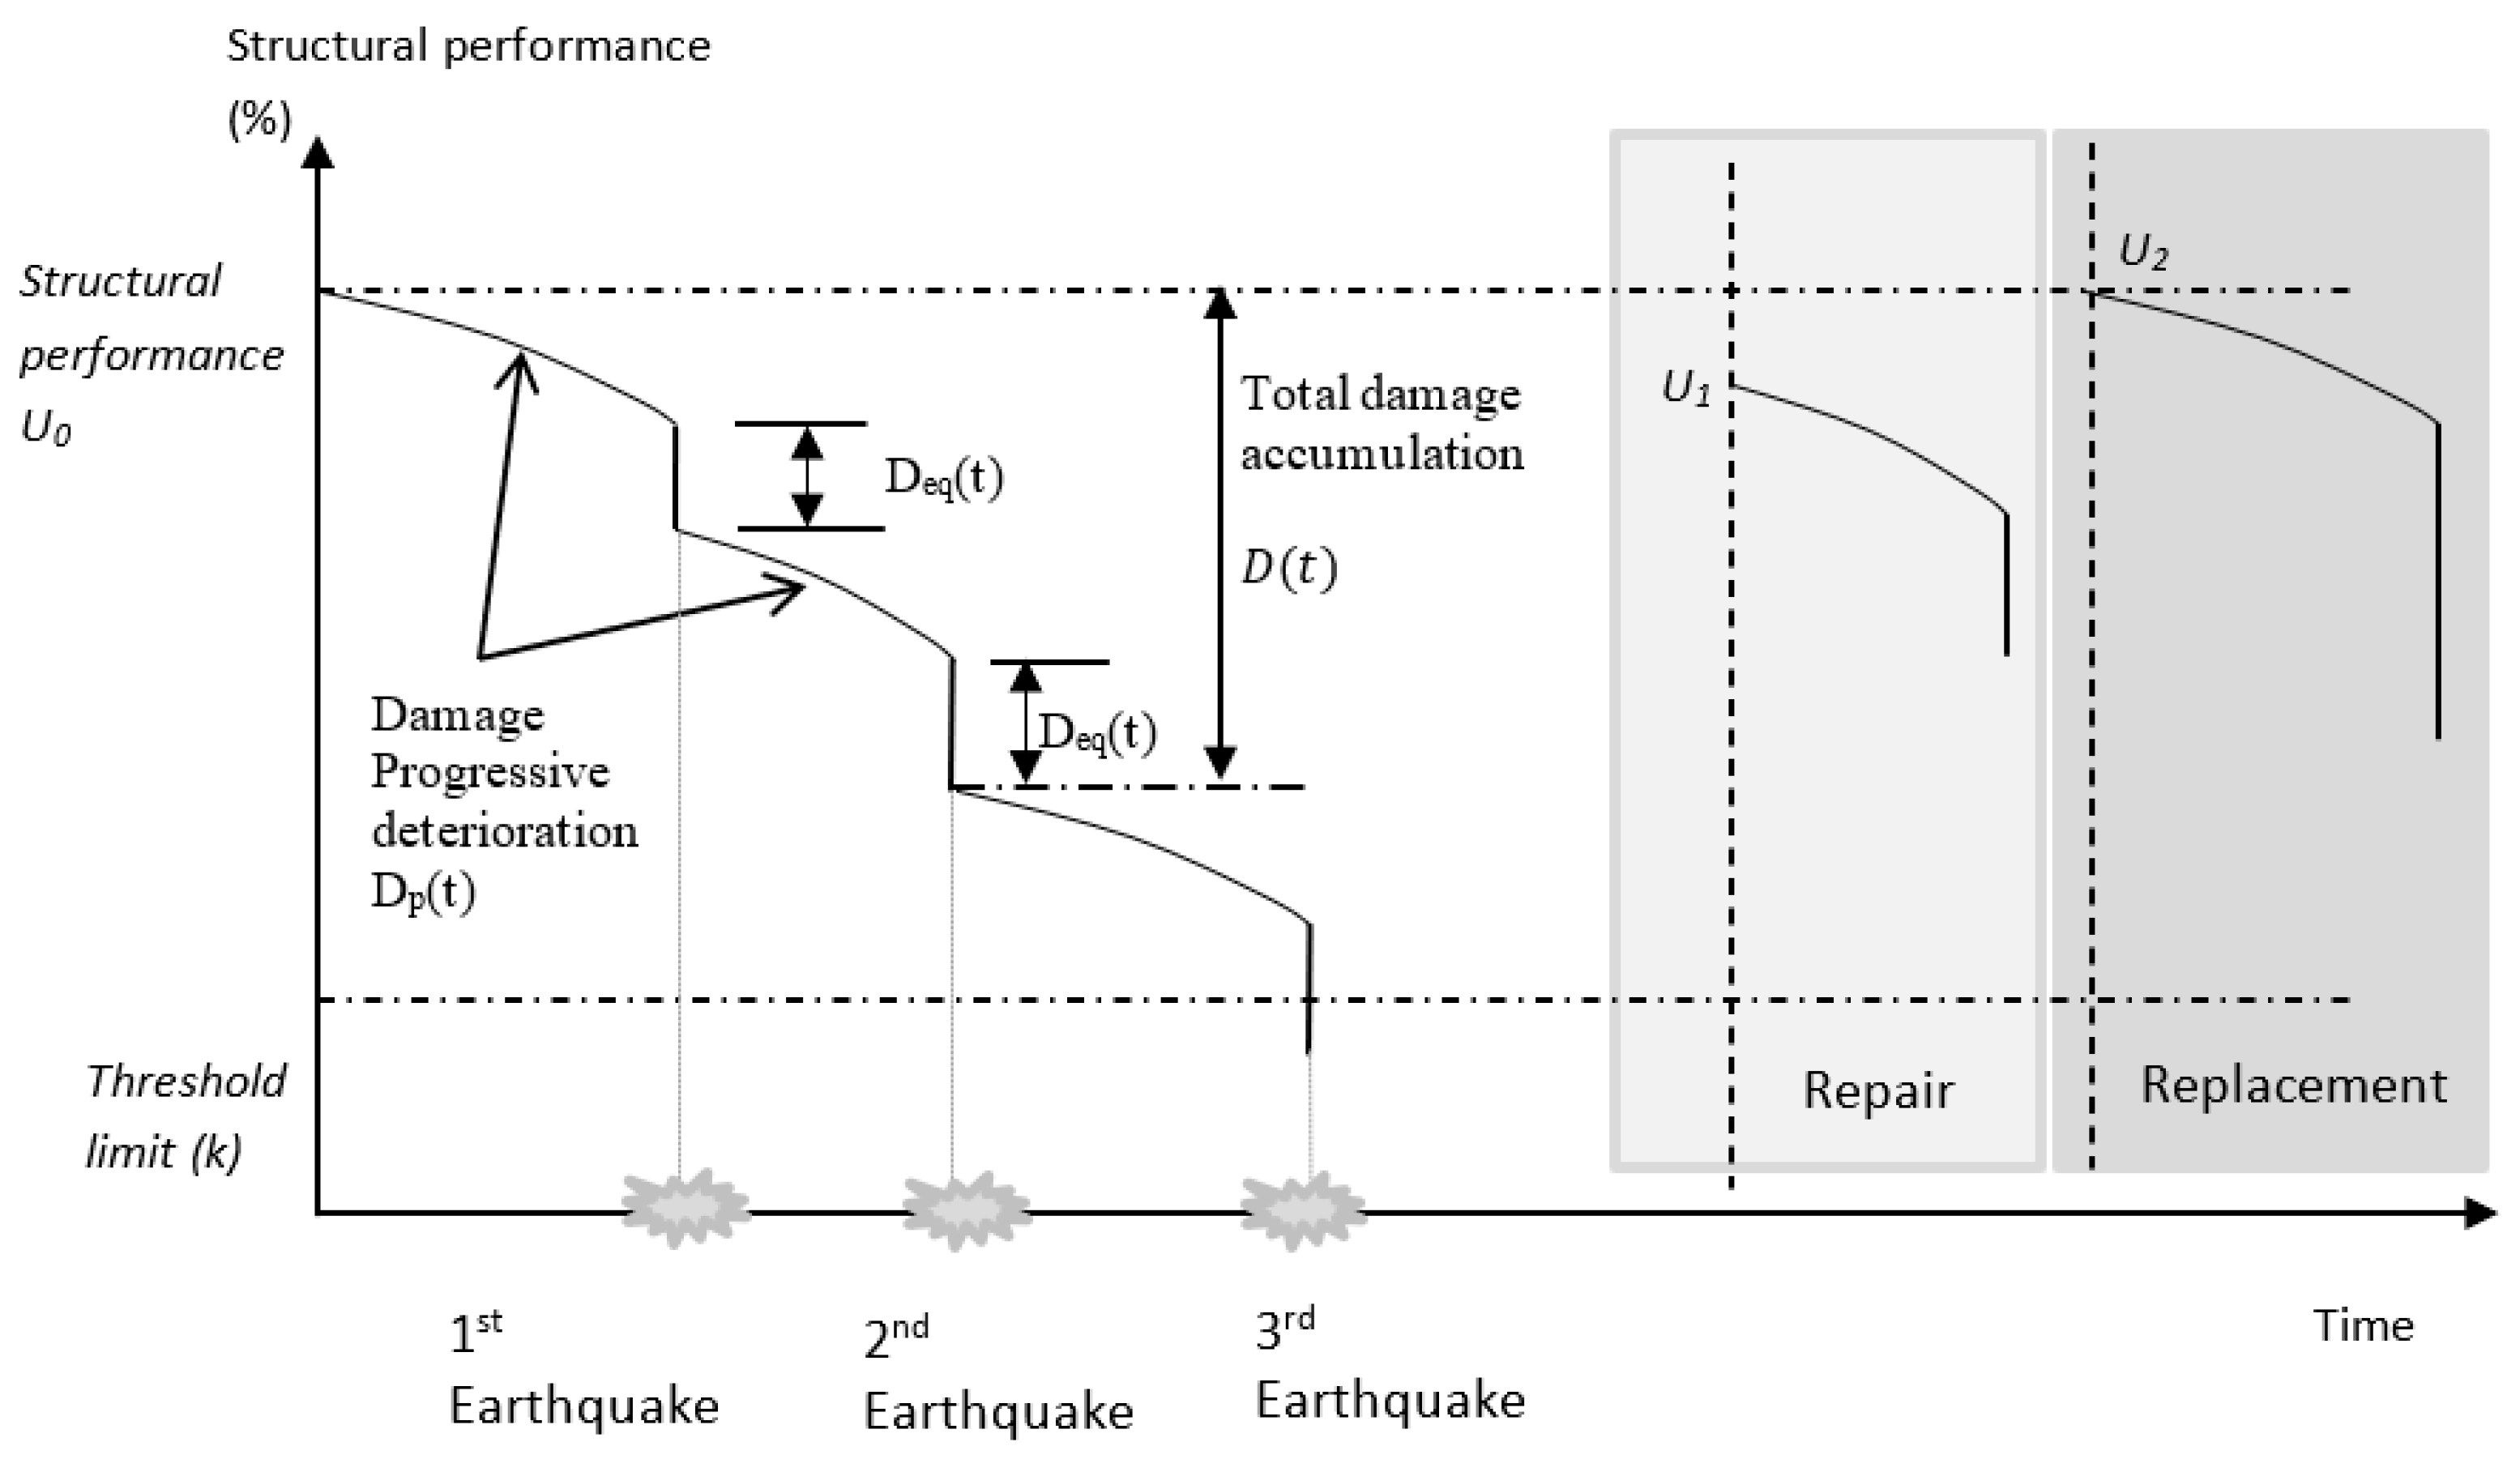
2.1. Damage Accumulation in Bridges

The life cycle performance of structures is described during their lifetime and the performance is influenced by several parameters such as load effects, material degradation, and damage occurrences [31]. When a structure is exposed for operation, the damage accumulation starts due to progressive deterioration caused mainly due to aging, environmental conditions, and damage due to shock impacts, such as earthquakes, truck impacts, etc. In this study, the damage caused by continuous degradation and sudden impacts are considered and a simple presentation of the performance is shown in Figure 1 [33]. The structural performance of the bridge gradually reduces with time due to progressive deterioration and is instantly reduced due to earthquake impacts. During the service life of a bridge, maintenance activities are carried out at different stages. Once the structural performance falls below the performance threshold, either repairs or the replacement of the bridge is expected. As shown in Figure 1, U1 and U2 are the performance levels of the bridge after repair and replacement. The performance of the bridge can be slightly lower than the original performance after a major repair or it can be the same performance as a new bridge when a replacement has occurred. However, the interventions (repairs or replacements) undertaken during the service life of the bridge is out of the scope of the study and only the degradation caused by aging and seismic impacts is considered here. The details of progressive deterioration, seismic impact, and the combination of both these degradation mechanisms are described separately in the following sections.

2.2. Cumulative Damage Due to Progressive Deterioration

Progressive deterioration is a slow continuous process, which depends on time. The degradation that occurs due to wear, fatigue, corrosion, etc., can be modelled using a continuous degrading phenomenon [33].
When progressive deterioration is expressed probabilistically, the uncertainties associated with the process need to be considered and the representation of these uncertainties using a jump process is a good approximation [33]. In this proposed model, the continuous process of progressive deterioration is simulated using a jump process with variable jump sizes in definite time intervals. The loss of structural performance ( D P t ) at a given time ( t ) can be written as
D P t = j = 0 m Y j
where m is the number of impacts used to simulate the progressive deterioration within time t and Y j is the loss of structural performance due to progressive deterioration.
Then, the structural performance at time t can be written as
U t = U 0 D P ( t )

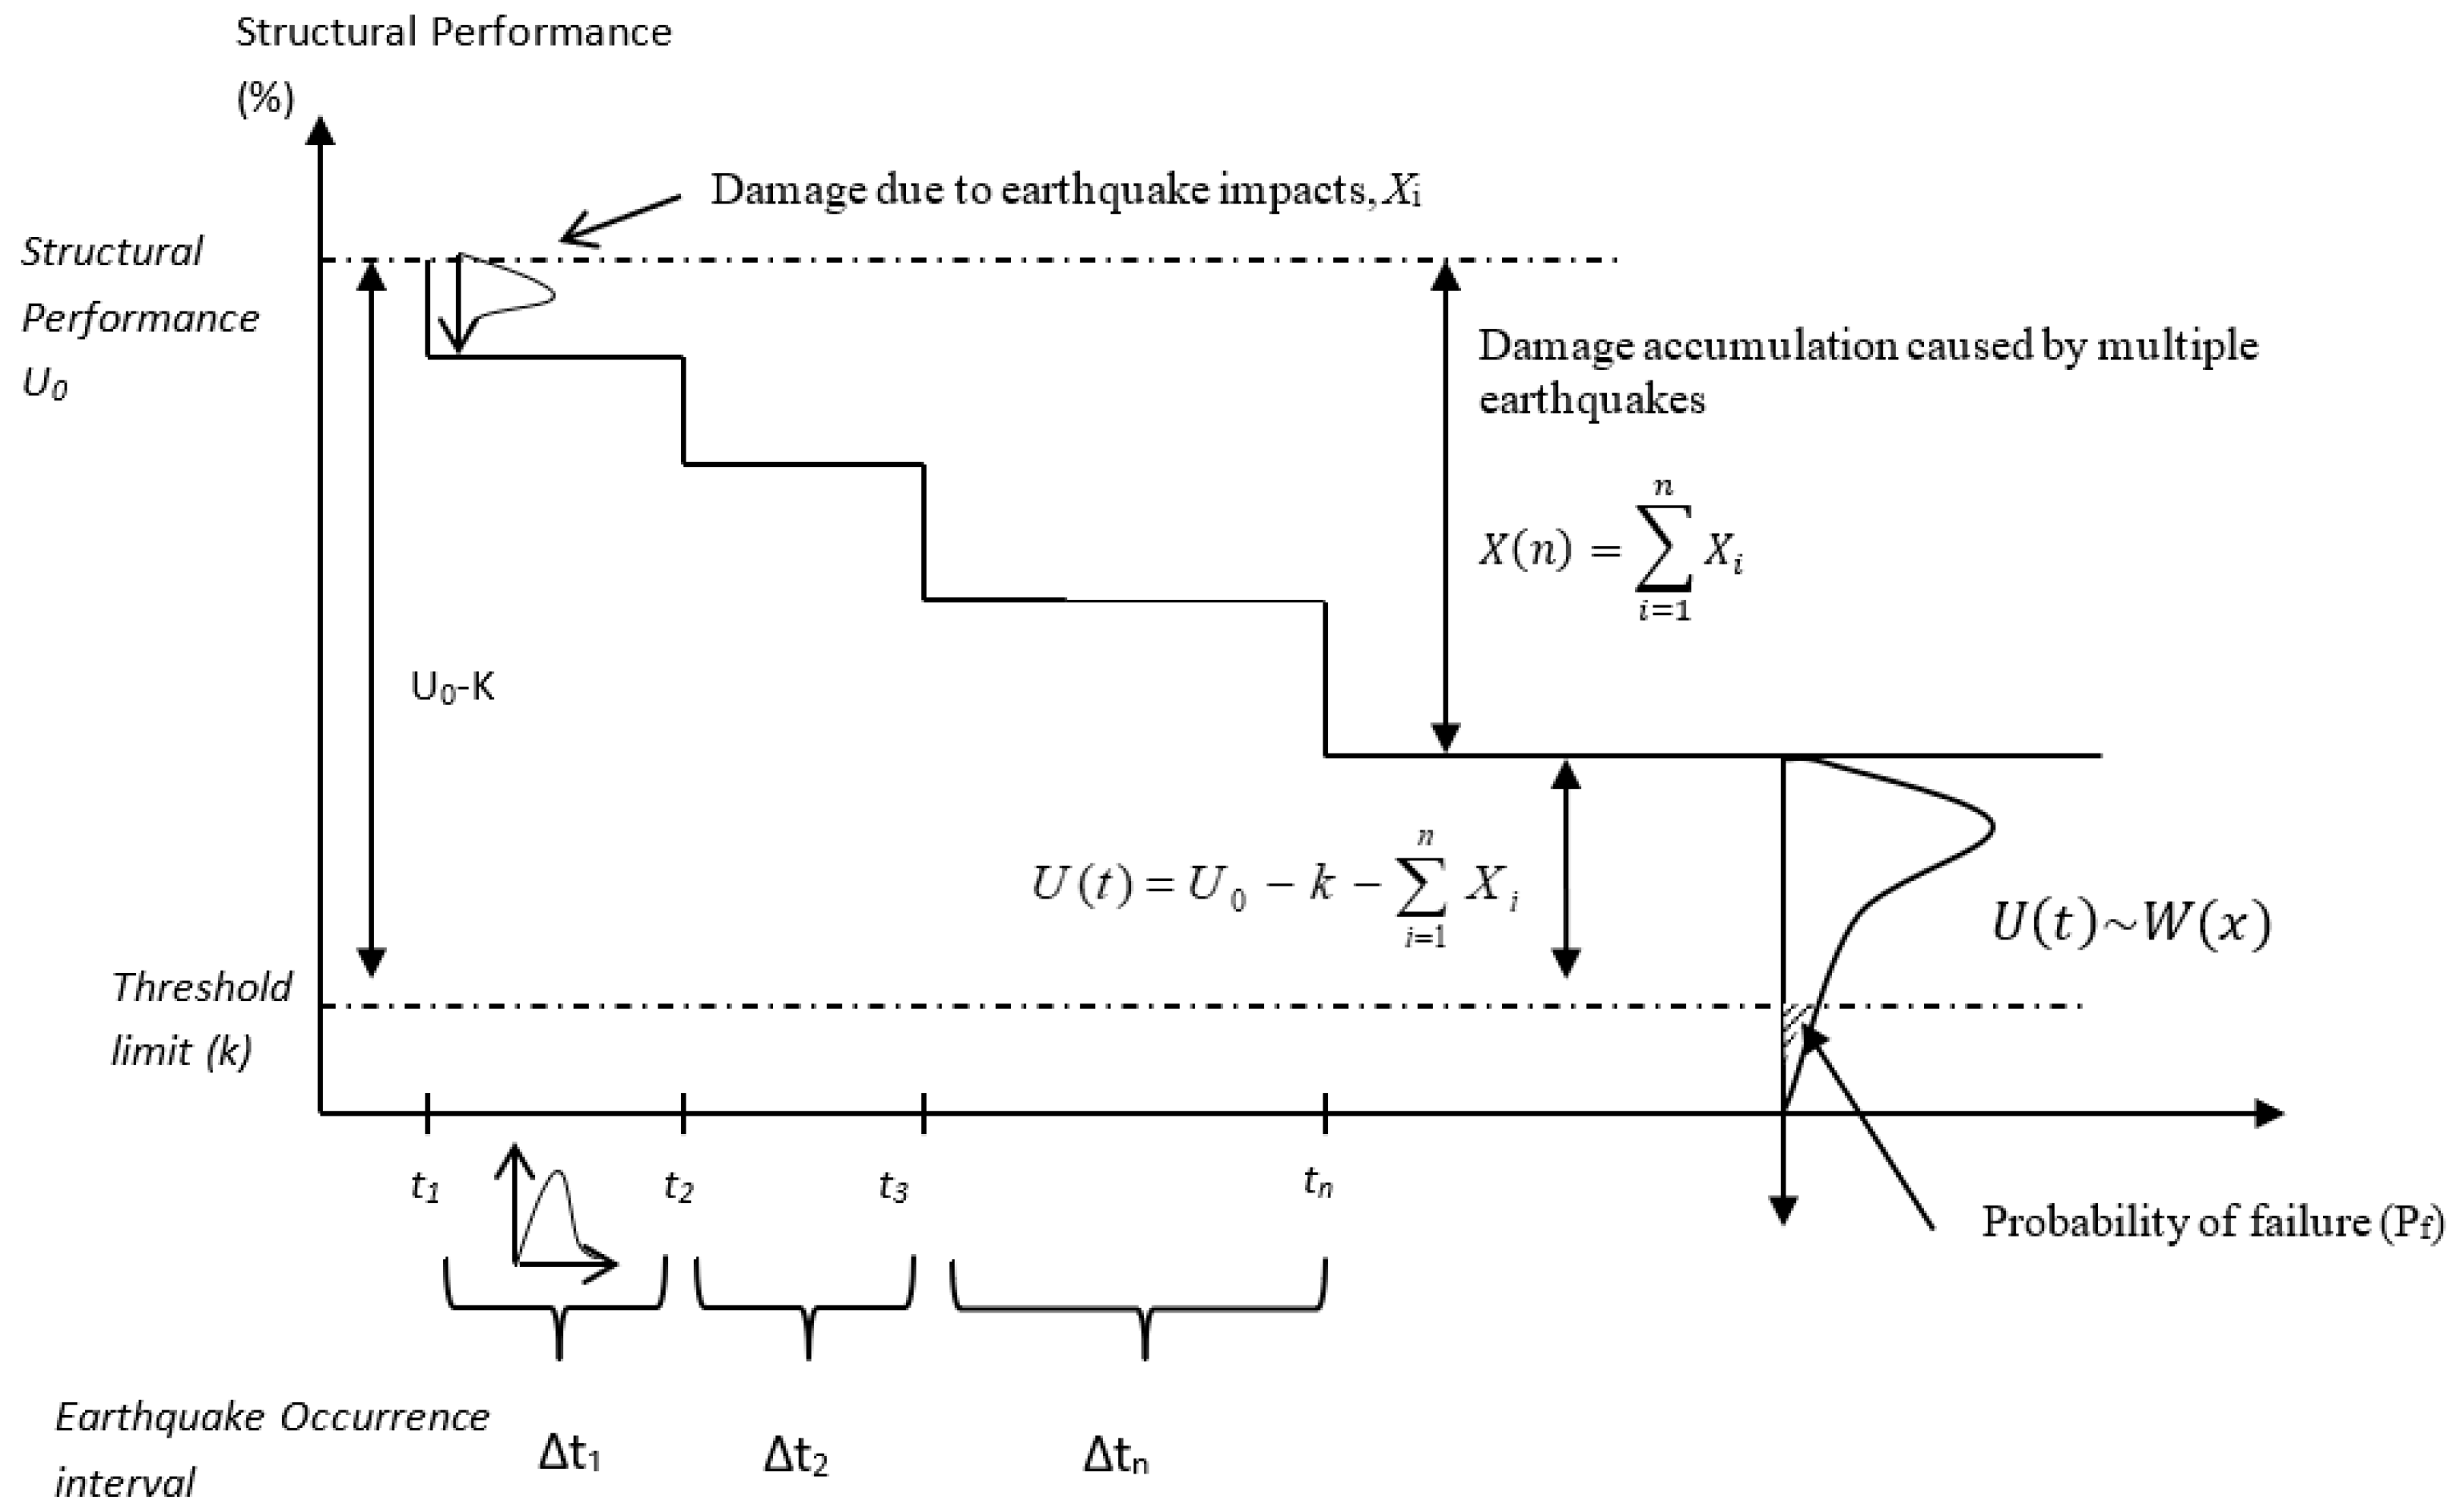
2.3. Cumulative Earthquake Damage

Considering the accumulation of damage in a bridge due to multiple earthquake impacts, the following numerical framework is proposed, as shown in Figure 2. In engineering systems, the probabilistic representation of seismic structural performance degradation using the gamma process or exponential distributions is considered an appropriate method to characterise this effect [37,38]. The proposed framework considers that each impact is associated with the amount of damage represented by a random variable ( X i ). In developing the proposed framework, the following assumptions were made:
  • Damage accumulates with multiple seismic impacts over time.
  • Damage caused (Xi) by the impact is independent and identically distributed. At the time of each impact, structural performance is reduced through the damage associated with the impact.
  • The time interval between consecutive earthquakes (i.e., occurrence interval, Δti) is independent and identically distributed.

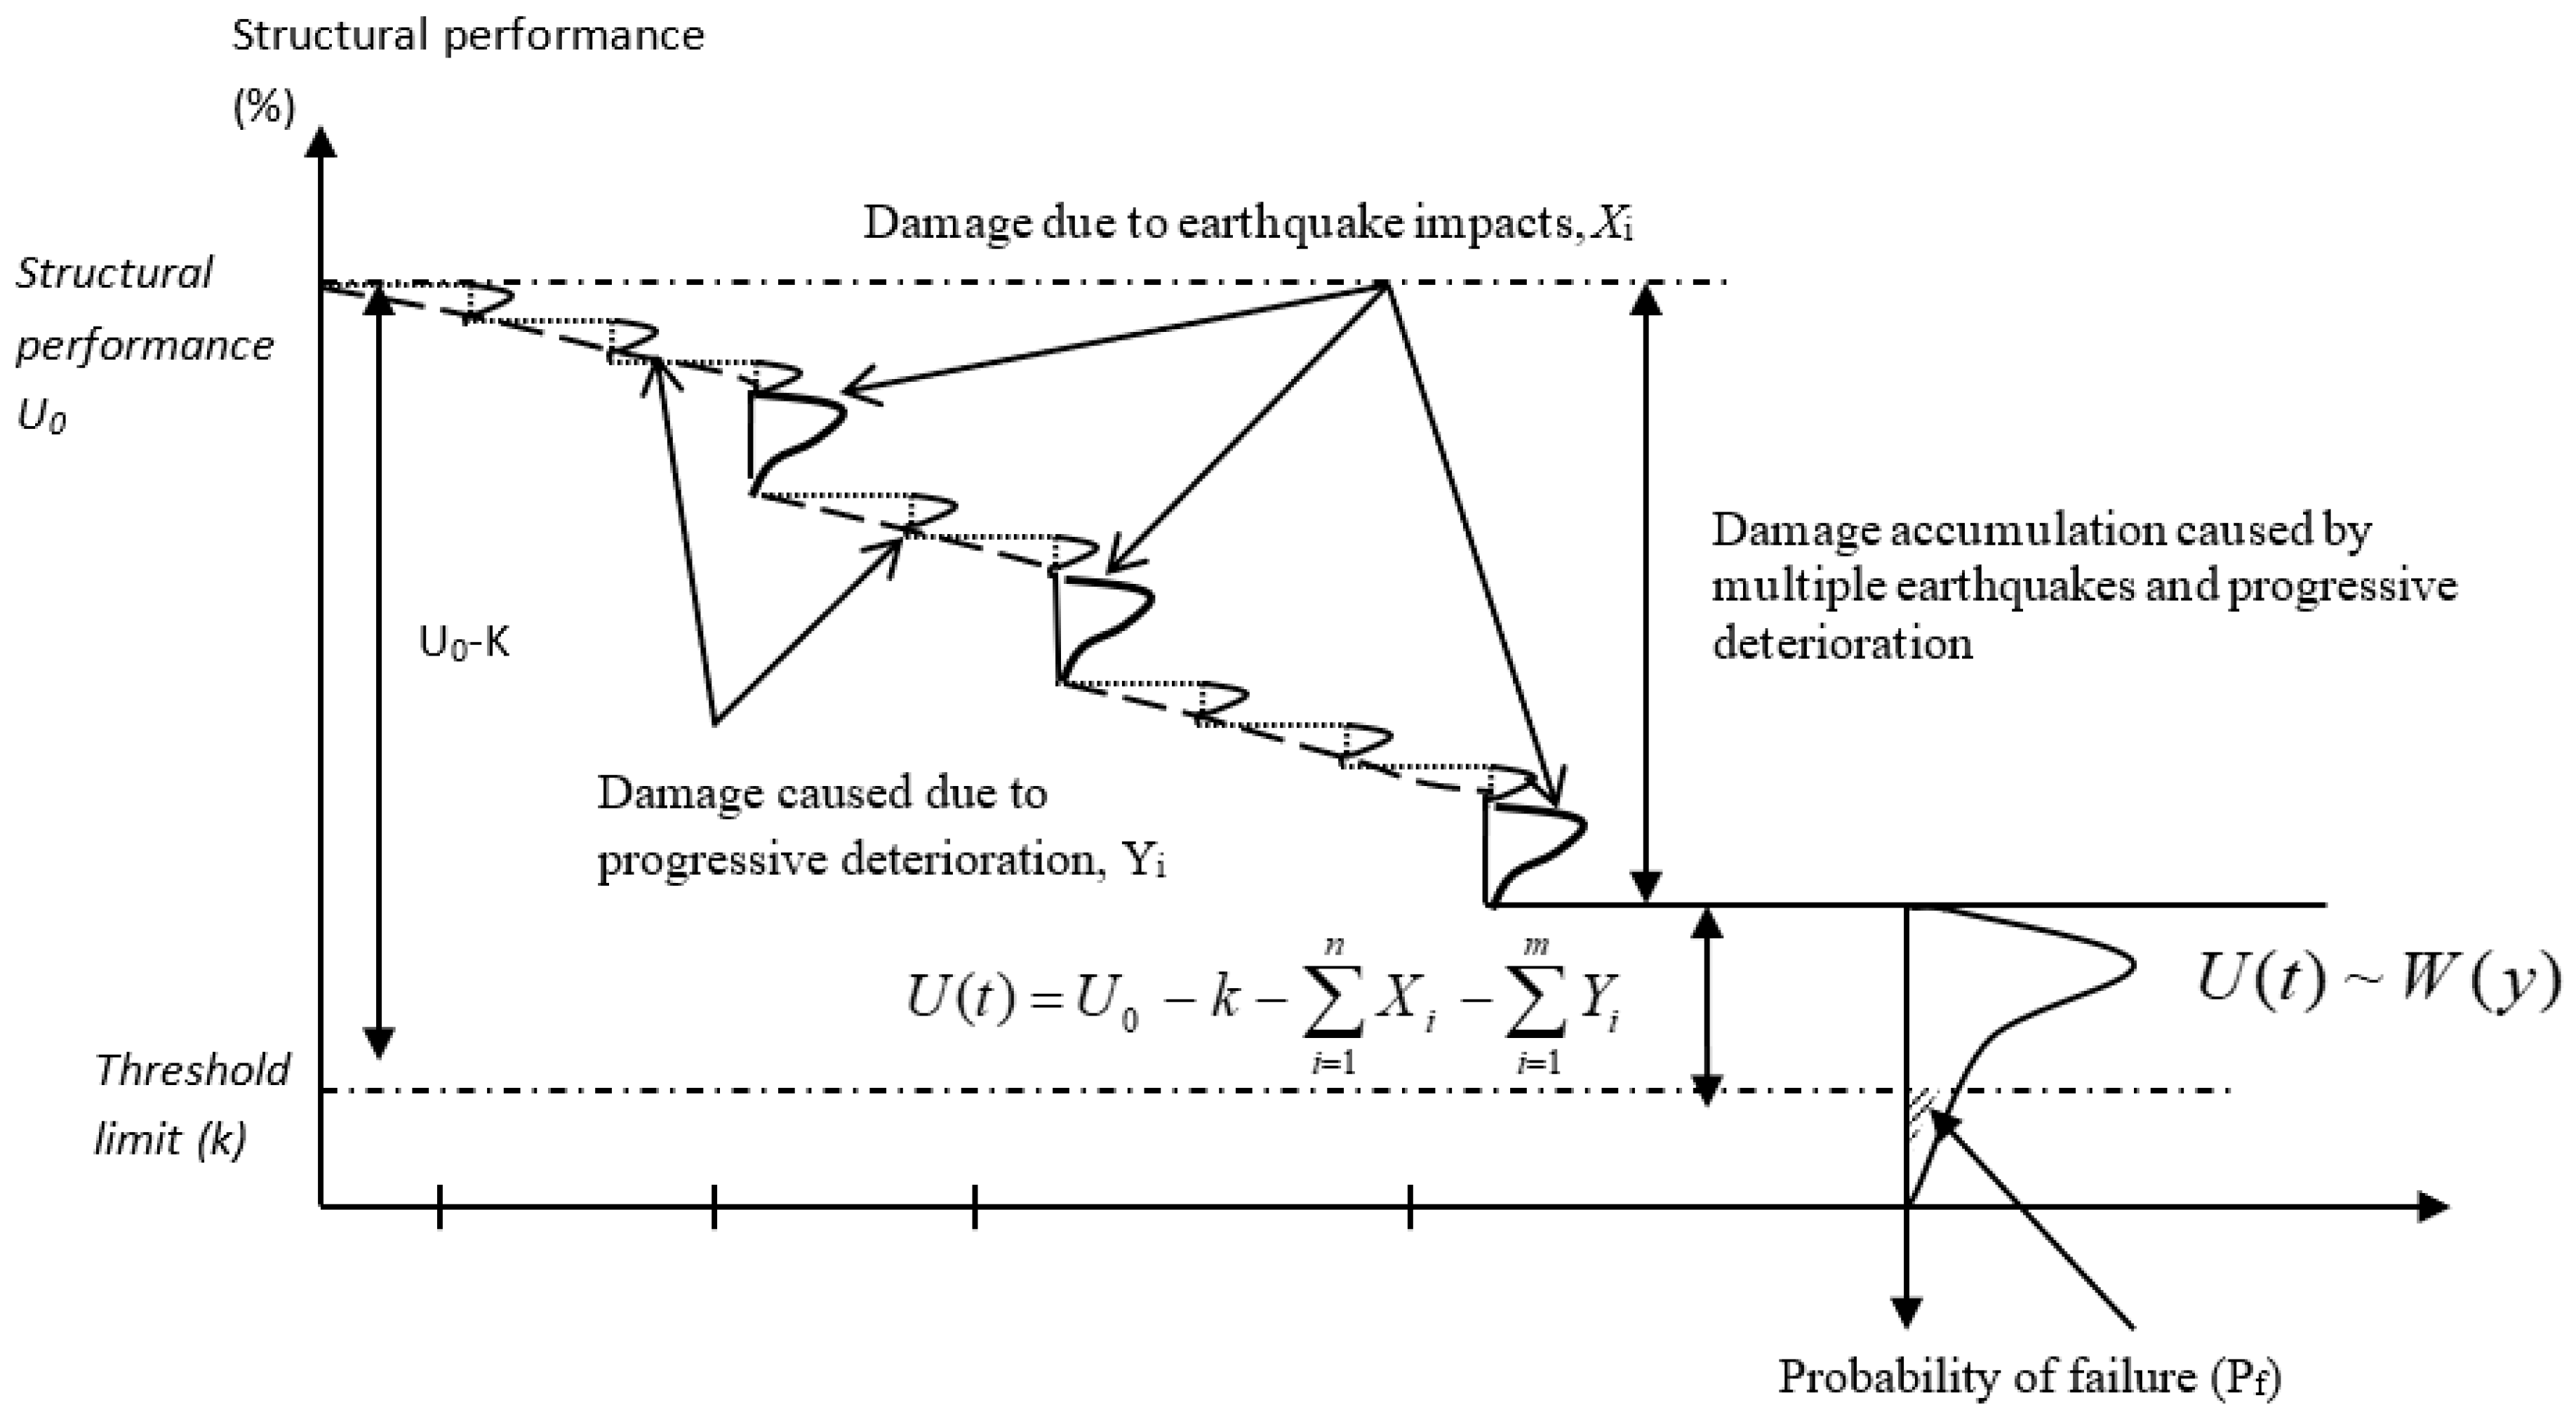
2.4. Combined Progressive Deterioration and Earthquake Damage

The initial structural performance of the structure is assumed to be U0, and the total damage caused by earthquake impacts and progressive deterioration at time t are given as D ( t ) . Therefore, the structural performance of the structure by time t before the failure can be written as
U t = U 0 D ( t )
D t = D e q t + D P ( t )
where D e q t is the damage caused by earthquake impacts and D P ( t ) is the damage caused by progressive deterioration at time t .
In this framework, the damage caused by progressive deterioration and earthquake impacts are considered independent events. Since the damage of a particular shock impact is dependent on the damage caused by the previous impacts, this study uses damage probability distributions in the framework. The change of capacity reduction is accounted in the proposed framework and more details on damage distributions can be found in Section 2.5. Therefore, it was assumed that progressive deterioration and seismic impacts should be considered independent variables in the probabilistic framework. Other available models in the literature have shown the applicability of this concept [37].
As given in Figure 3, assuming that the structure is exposed to progressive deterioration and sudden earthquake impacts, the deterioration by time t can be calculated as
D t = j = 1 m Y j + i = 1 n X i
where n is the number of impacts by time t , X i is the loss of structural performance due to earthquake impacts, and Y j is the loss of structural performance due to progressive deterioration. Combining Equations (3) and (4), the remaining structural performance at time t can be expressed as
U t = U 0 D e q t + D P t
U t = U 0 j = 1 m Y j + i = 1 n X i
The operating threshold value ( k ) is an important feature in the proposed framework and depending on the structural performance level, the threshold level is changed. This threshold value represents the minimum acceptable operational level and indicates the requirement for the maintenance activities of the structure. Assuming k is the damage threshold, the remaining structural performance of a bridge can be defined as
U t = U 0 k j = 1 m Y j + i = 1 n X i
In this framework, the structure is considered to have failed when the remaining structural performance of the system is lower than the threshold limit ( k ). If the remaining structural performance is distributed as W ( x ) [33], then
U t ~ W ( x )
The probability of failure (i.e., U t < 0 as shown in Figure 3) due to seismic impact is calculated below [33].
P U t < 0 = U ( t ) W x d x
where W is the probability distribution function of U(t), which can be rewritten as Equation (11).
P U t < 0 = 1 0 U ( t ) W x d x

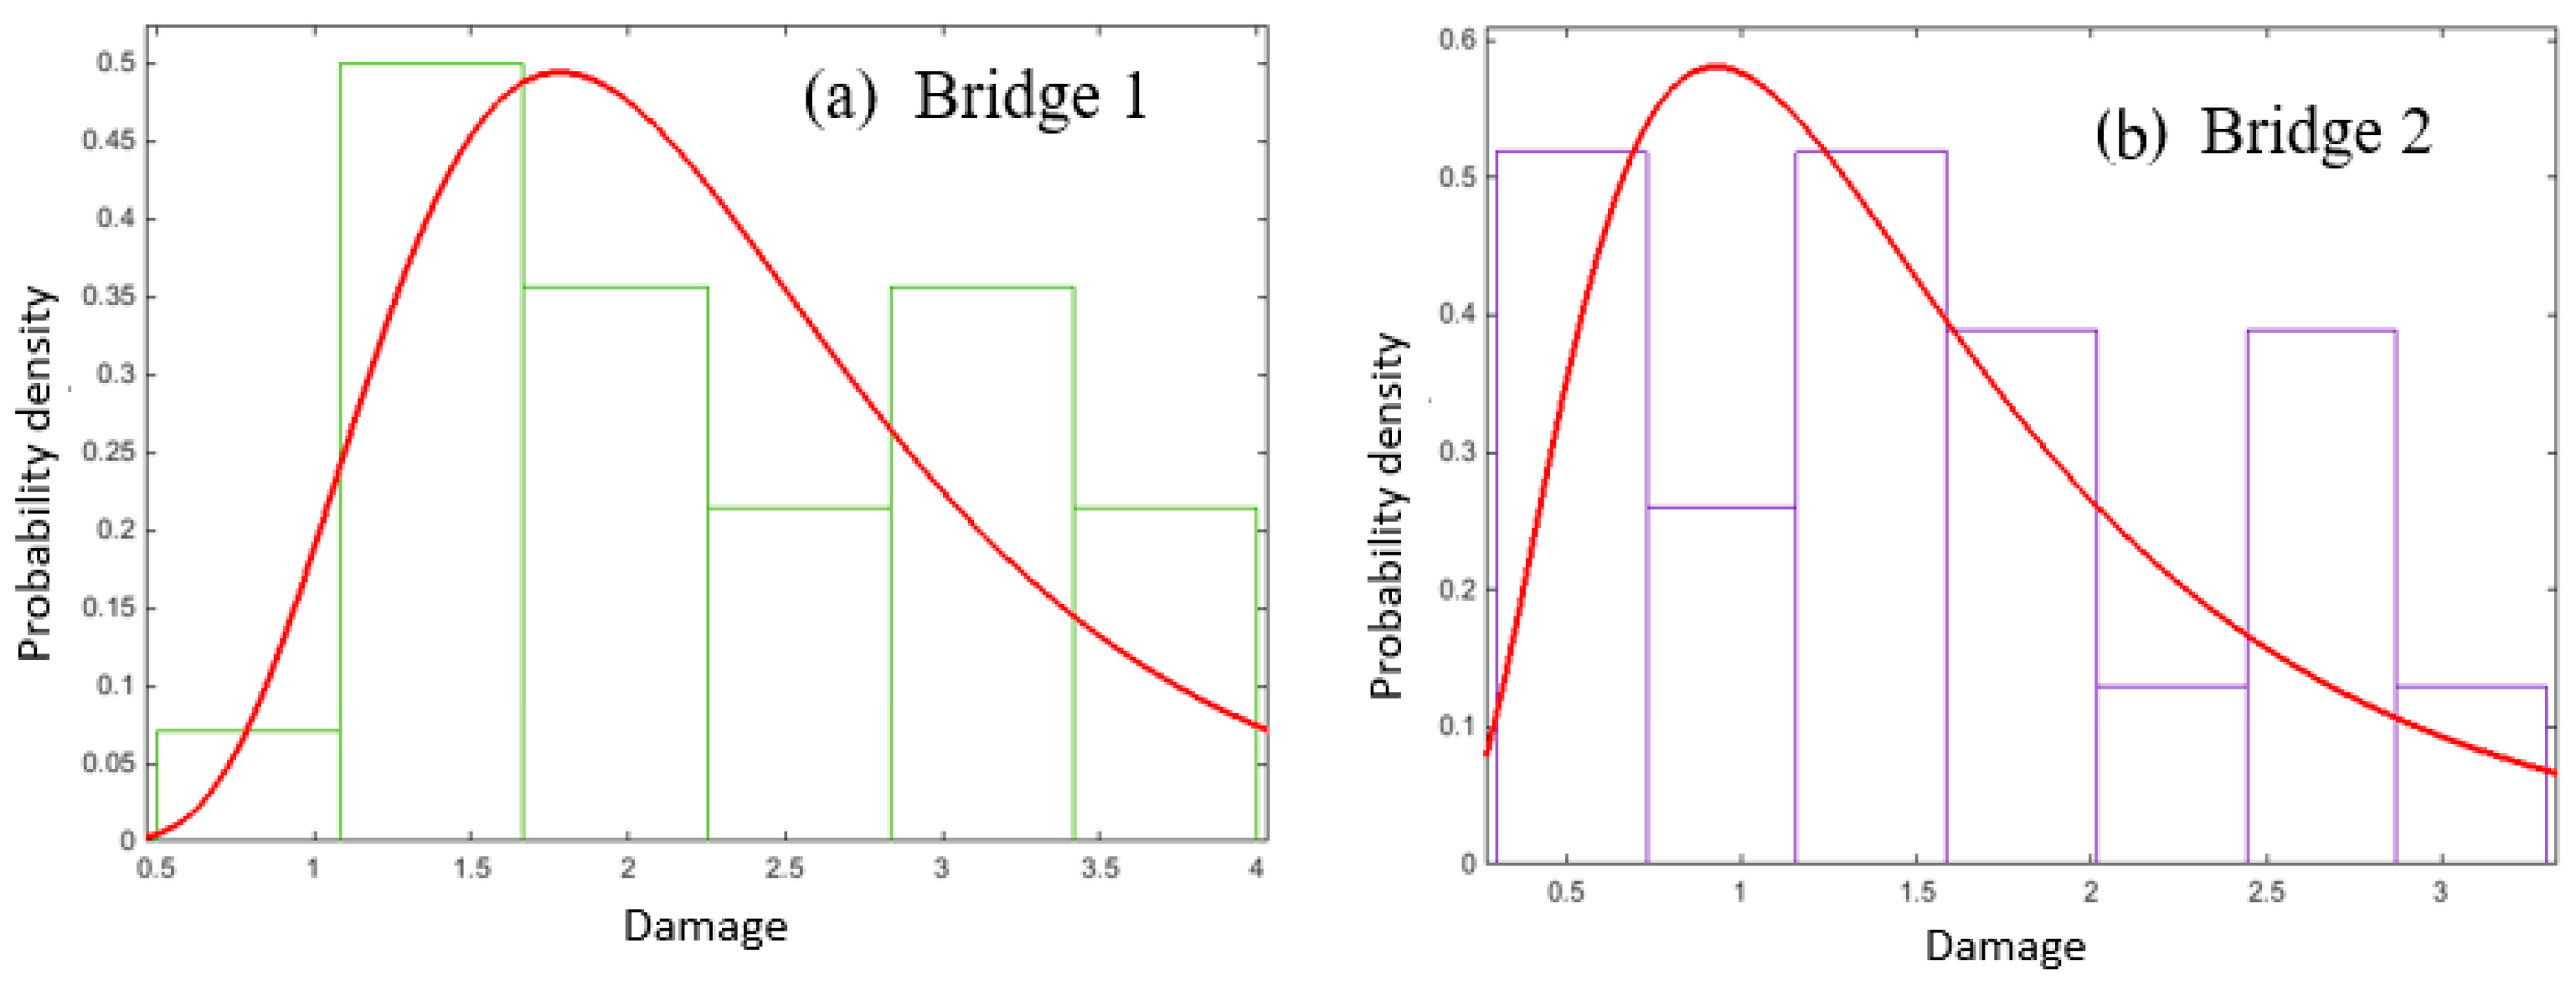
2.5. Damage Distributions

Damage distributions for the bridge represent a critical parameter in the proposed framework. The presentation of damage using a correct parameter is essential to accurately describe the damage in a structure. Different damage indicators have been defined in the literature and there are two main damage-related classifications. They are deformation-related and energy-related damage indices [39]. Depending on the maximum displacement demand or drift demand [40], damage indicators are defined in the first category and the second category is based on hysteresis energy dissipation [41]. Furthermore, the combination of deformation and energy dissipations [42] are also available in the literature. In this study, deformation-related damage was considered.
Simulation-based methods, regression-based methods, and the Markovian method are some of the most common methods used in damage prediction. Seismic hazard using probabilistic method and finite element analysis are used in simulation-based methods to predict the damage [43]. The regression-based method proposed by Ghosh [35] provides the probabilistic distribution of damage at the end of each earthquake impact. The probability distribution depends on the intensity of the nth earthquake and is given as [35]
l n D n I M n , D n 1 = a n + b n l n D n 1 + c n l n D n 1 + d n l n D n 1 l n I M n + ε n
where a n , b n , c n , d n are the regression coefficients, D n is the damage at nth earthquake impact, I M n is the intensity measure of the nth earthquake impact.
The Markovian method presents the damage considering transition probability matrix. Any of these methods can be used in estimating the accumulated damage in bridges caused by earthquake impacts ( X i ) .
There are many mathematical models and algorithms available to predict progressive deterioration (aging) of bridges. The Markov chain process, artificial neural network (ANN) and Bayesian method are some of the most common methods available in the literature. The probability distribution of damage caused by progressive deterioration using any of these methods could be used in the proposed framework to estimate the loss of structural capacity due to ageing ( Y i ) .

3. Case Study

The framework presented in Section 2 was implemented for multiple earthquake impacts for two bridges located in Australia. In Australia, many bridges were constructed before 1970, leading to unsatisfactory seismic requirements as per the current design standards. Therefore, the cumulative progressive deterioration of these bridges is significant. In addition, the visibility of damages to the bridges can be limited due to low to moderate seismic conditions and can therefore be overlooked during maintenance activities, which could lead to significant impacts in the long term. To verify the effectiveness of the proposed framework, a numerical simulation using the finite element model (FEM) was conducted in order to obtain the input parameters for the case study bridges. A mathematical simulation of the framework using MATLAB software was conducted for the case study bridges using the input parameters obtained. The interpretation of the input variables and the numerical simulations are presented in Section 3.1.

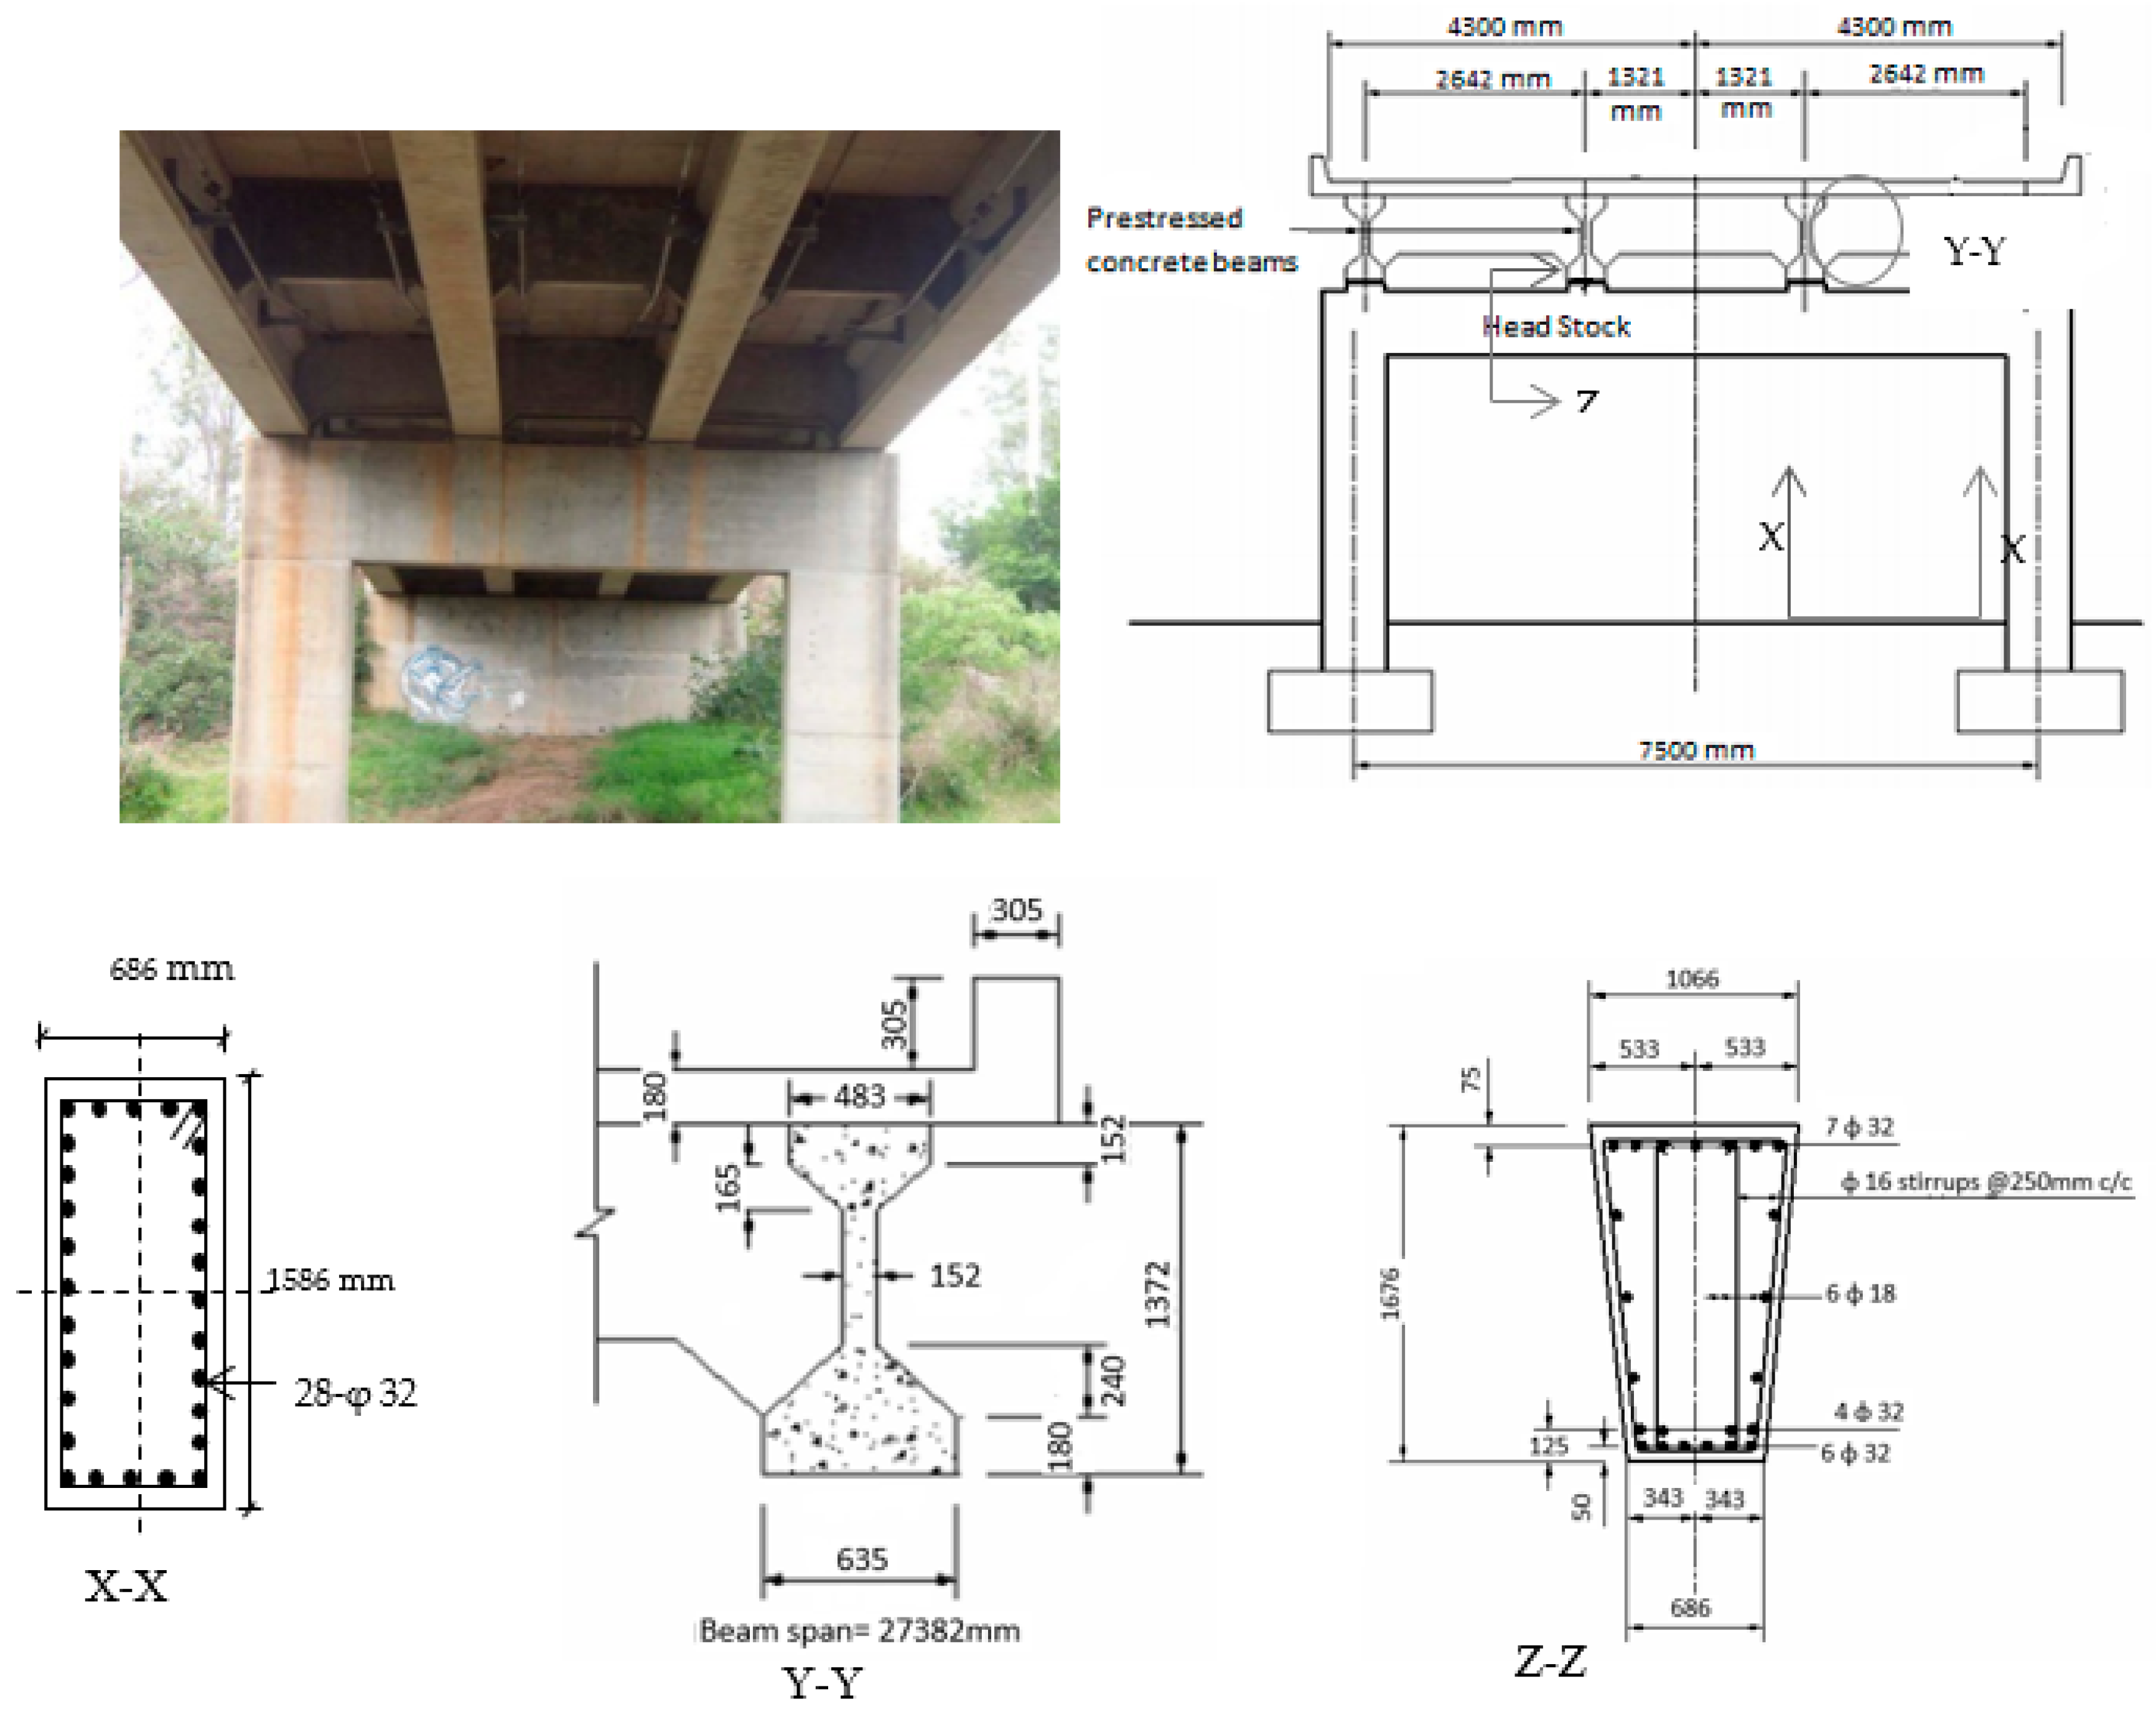
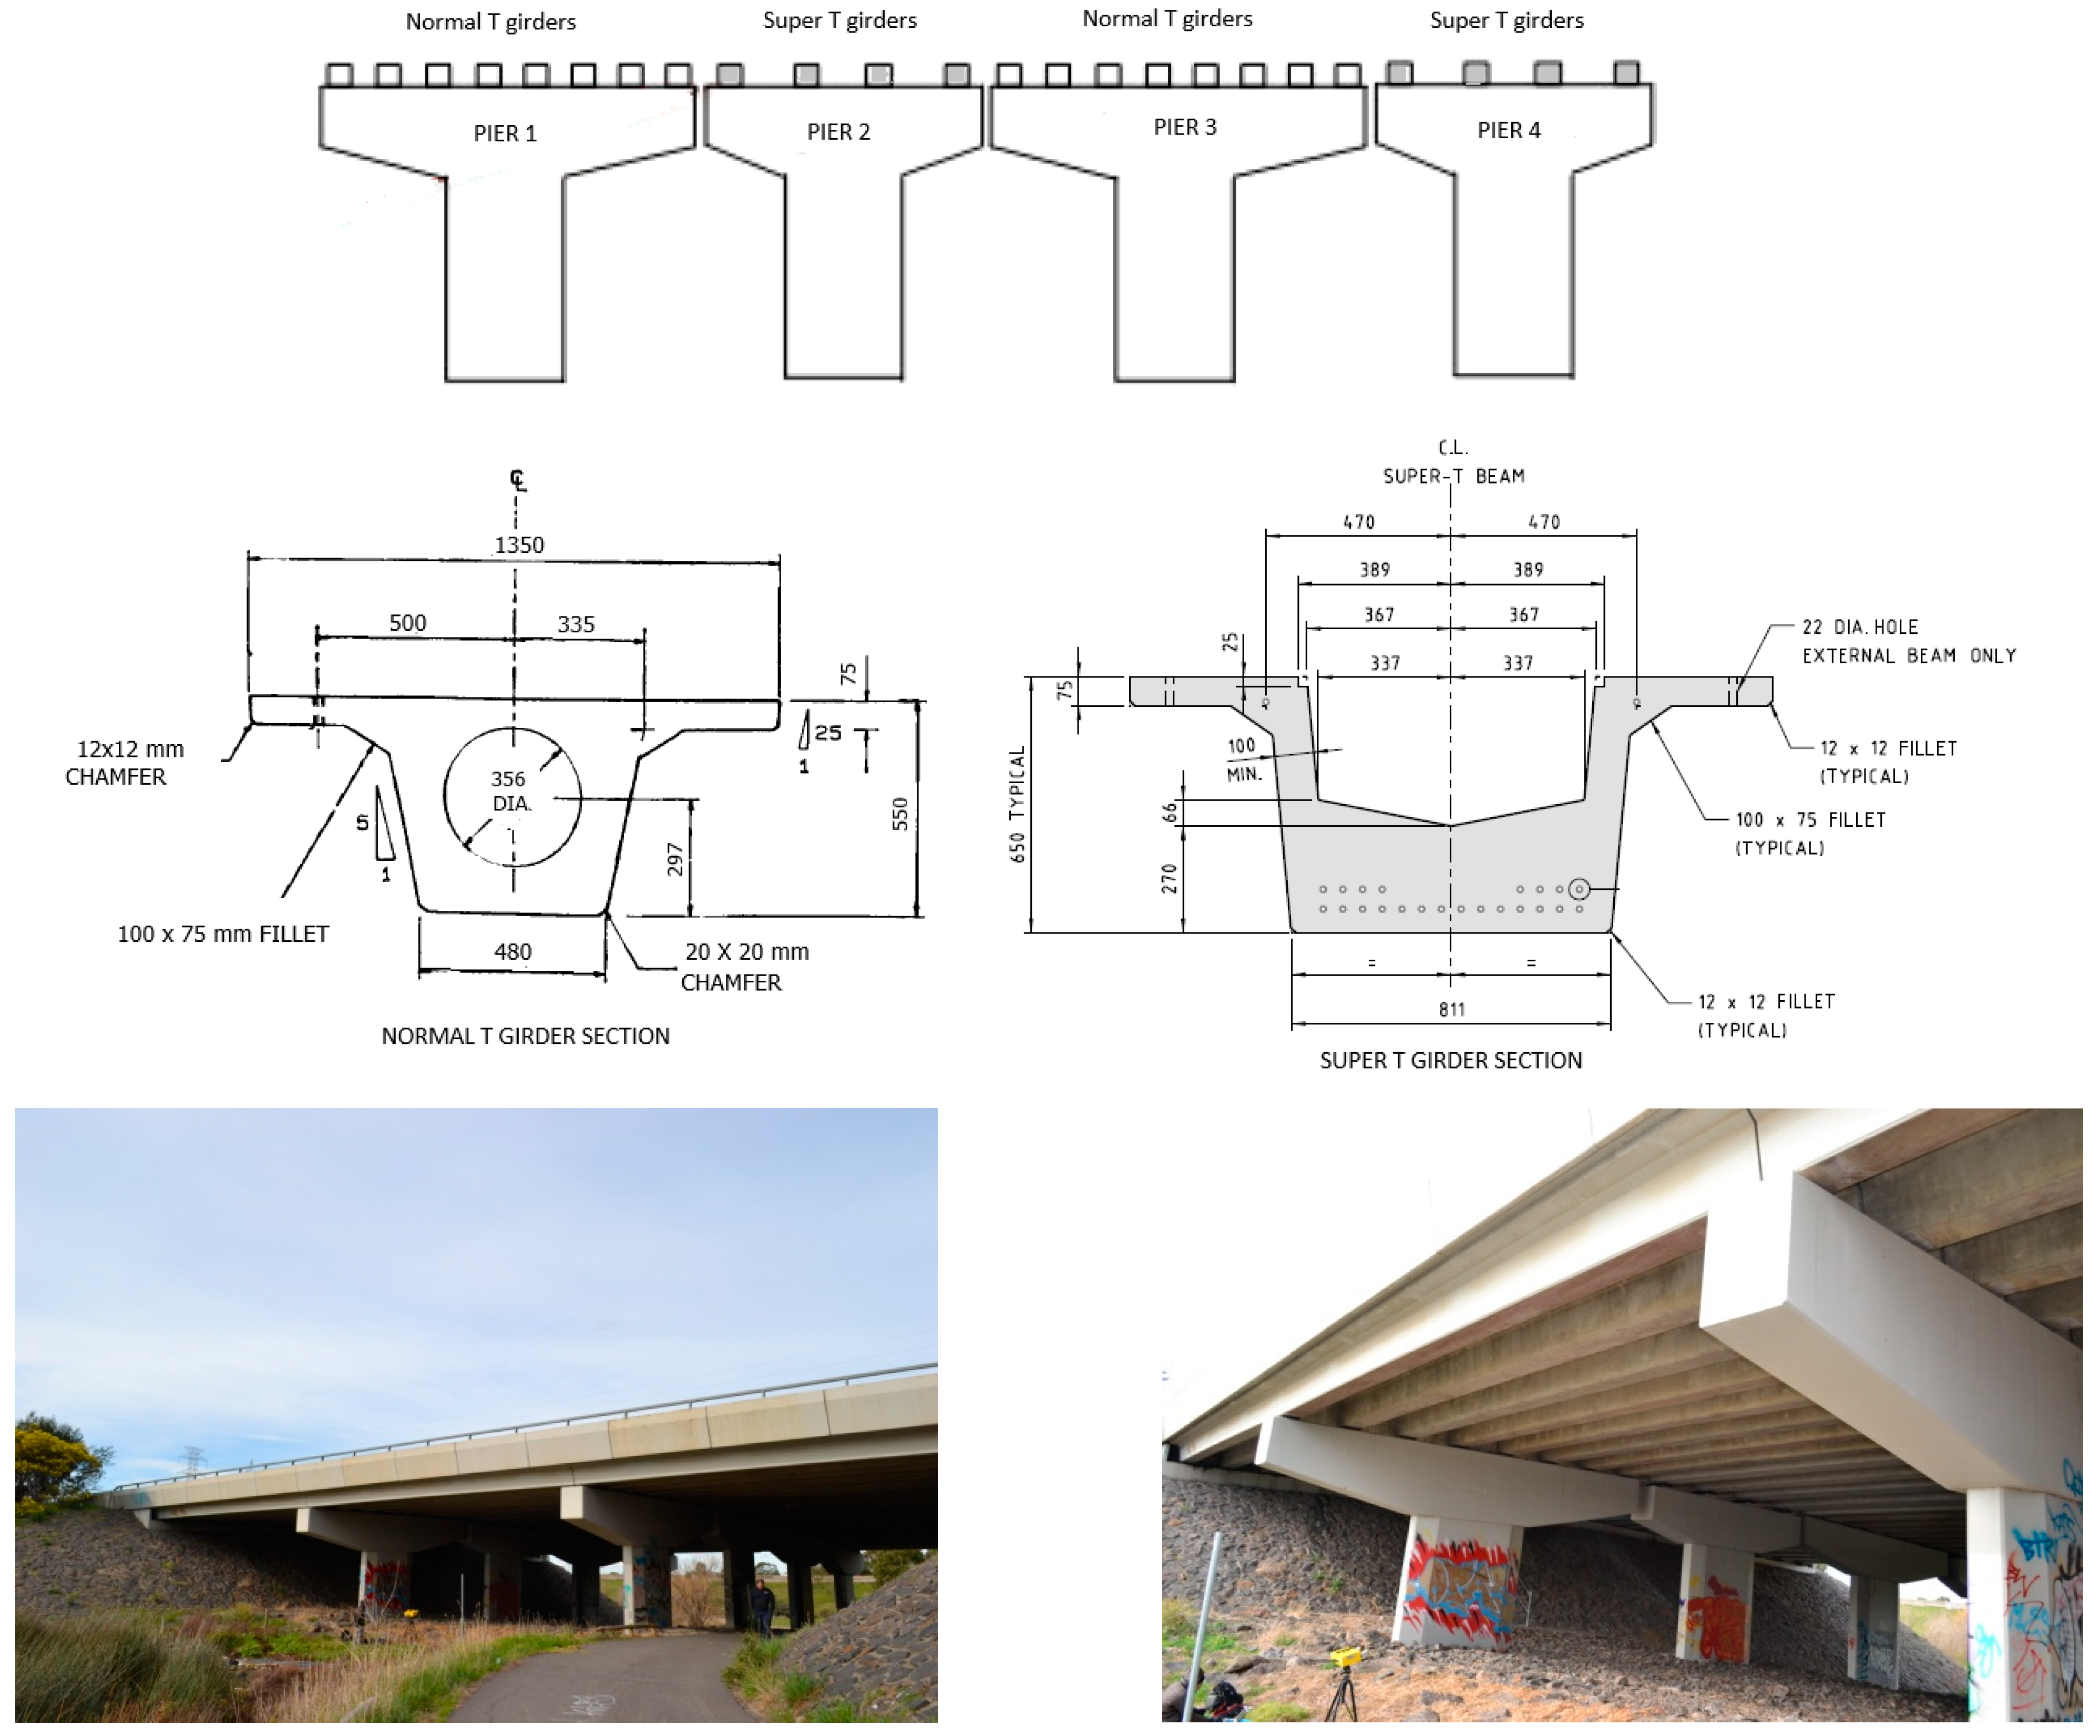
3.1. Numerical Representation

The schematic chart of the procedure proposed in the framework is shown in Figure 4. Input parameters, such as the probability distributions of earthquake occurrence interval and damage distributions are the main parameters that should be obtained before the application of the framework.
Statistical analysis was conducted using available earthquake data [44] to obtain the probability distribution of earthquake occurrence intervals in Australia. The probability distributions of damage caused by earthquake impacts were determined through a structural analysis of the bridges. The details of the probability distributions of earthquake occurrence and damages are discussed in detail in the following sections.
The following seven steps were imposed in the numerical procedure:
Step 1: Initialise parameters: damage accumulation, D ( t = 0 ) = 0; initial structural performance, U ( t = 0 ) = U 0 ; remaining structural performance, maximum iterations N, i = 0, n = 0.
U ( t ) = U 0 k ,   t 0 = 0
Step 2:
t i = t i 1 + Δ t i
∆ti is randomly selected from the established occurrence interval distribution for earthquake impact.
∆ti is a fixed-time step for progressive deterioration.
Step 3: Randomly select the damage size (Xi) from the established damage distribution for the selected soil type.
Step 4: Randomly select the damage size for the progressive deterioration from the probability distribution.
Step 5: Calculate the latest structural performance U(t) at time ti as a result of the combined impact of earthquakes and progressive deterioration.
Step 6: Return to Step 2 until the particular point of interest (tn) is reached.
Step 7: Calculate the probability of failure (Pf) at time tn.
The parameters required for the numerical calculations are obtained as described in the following sections.

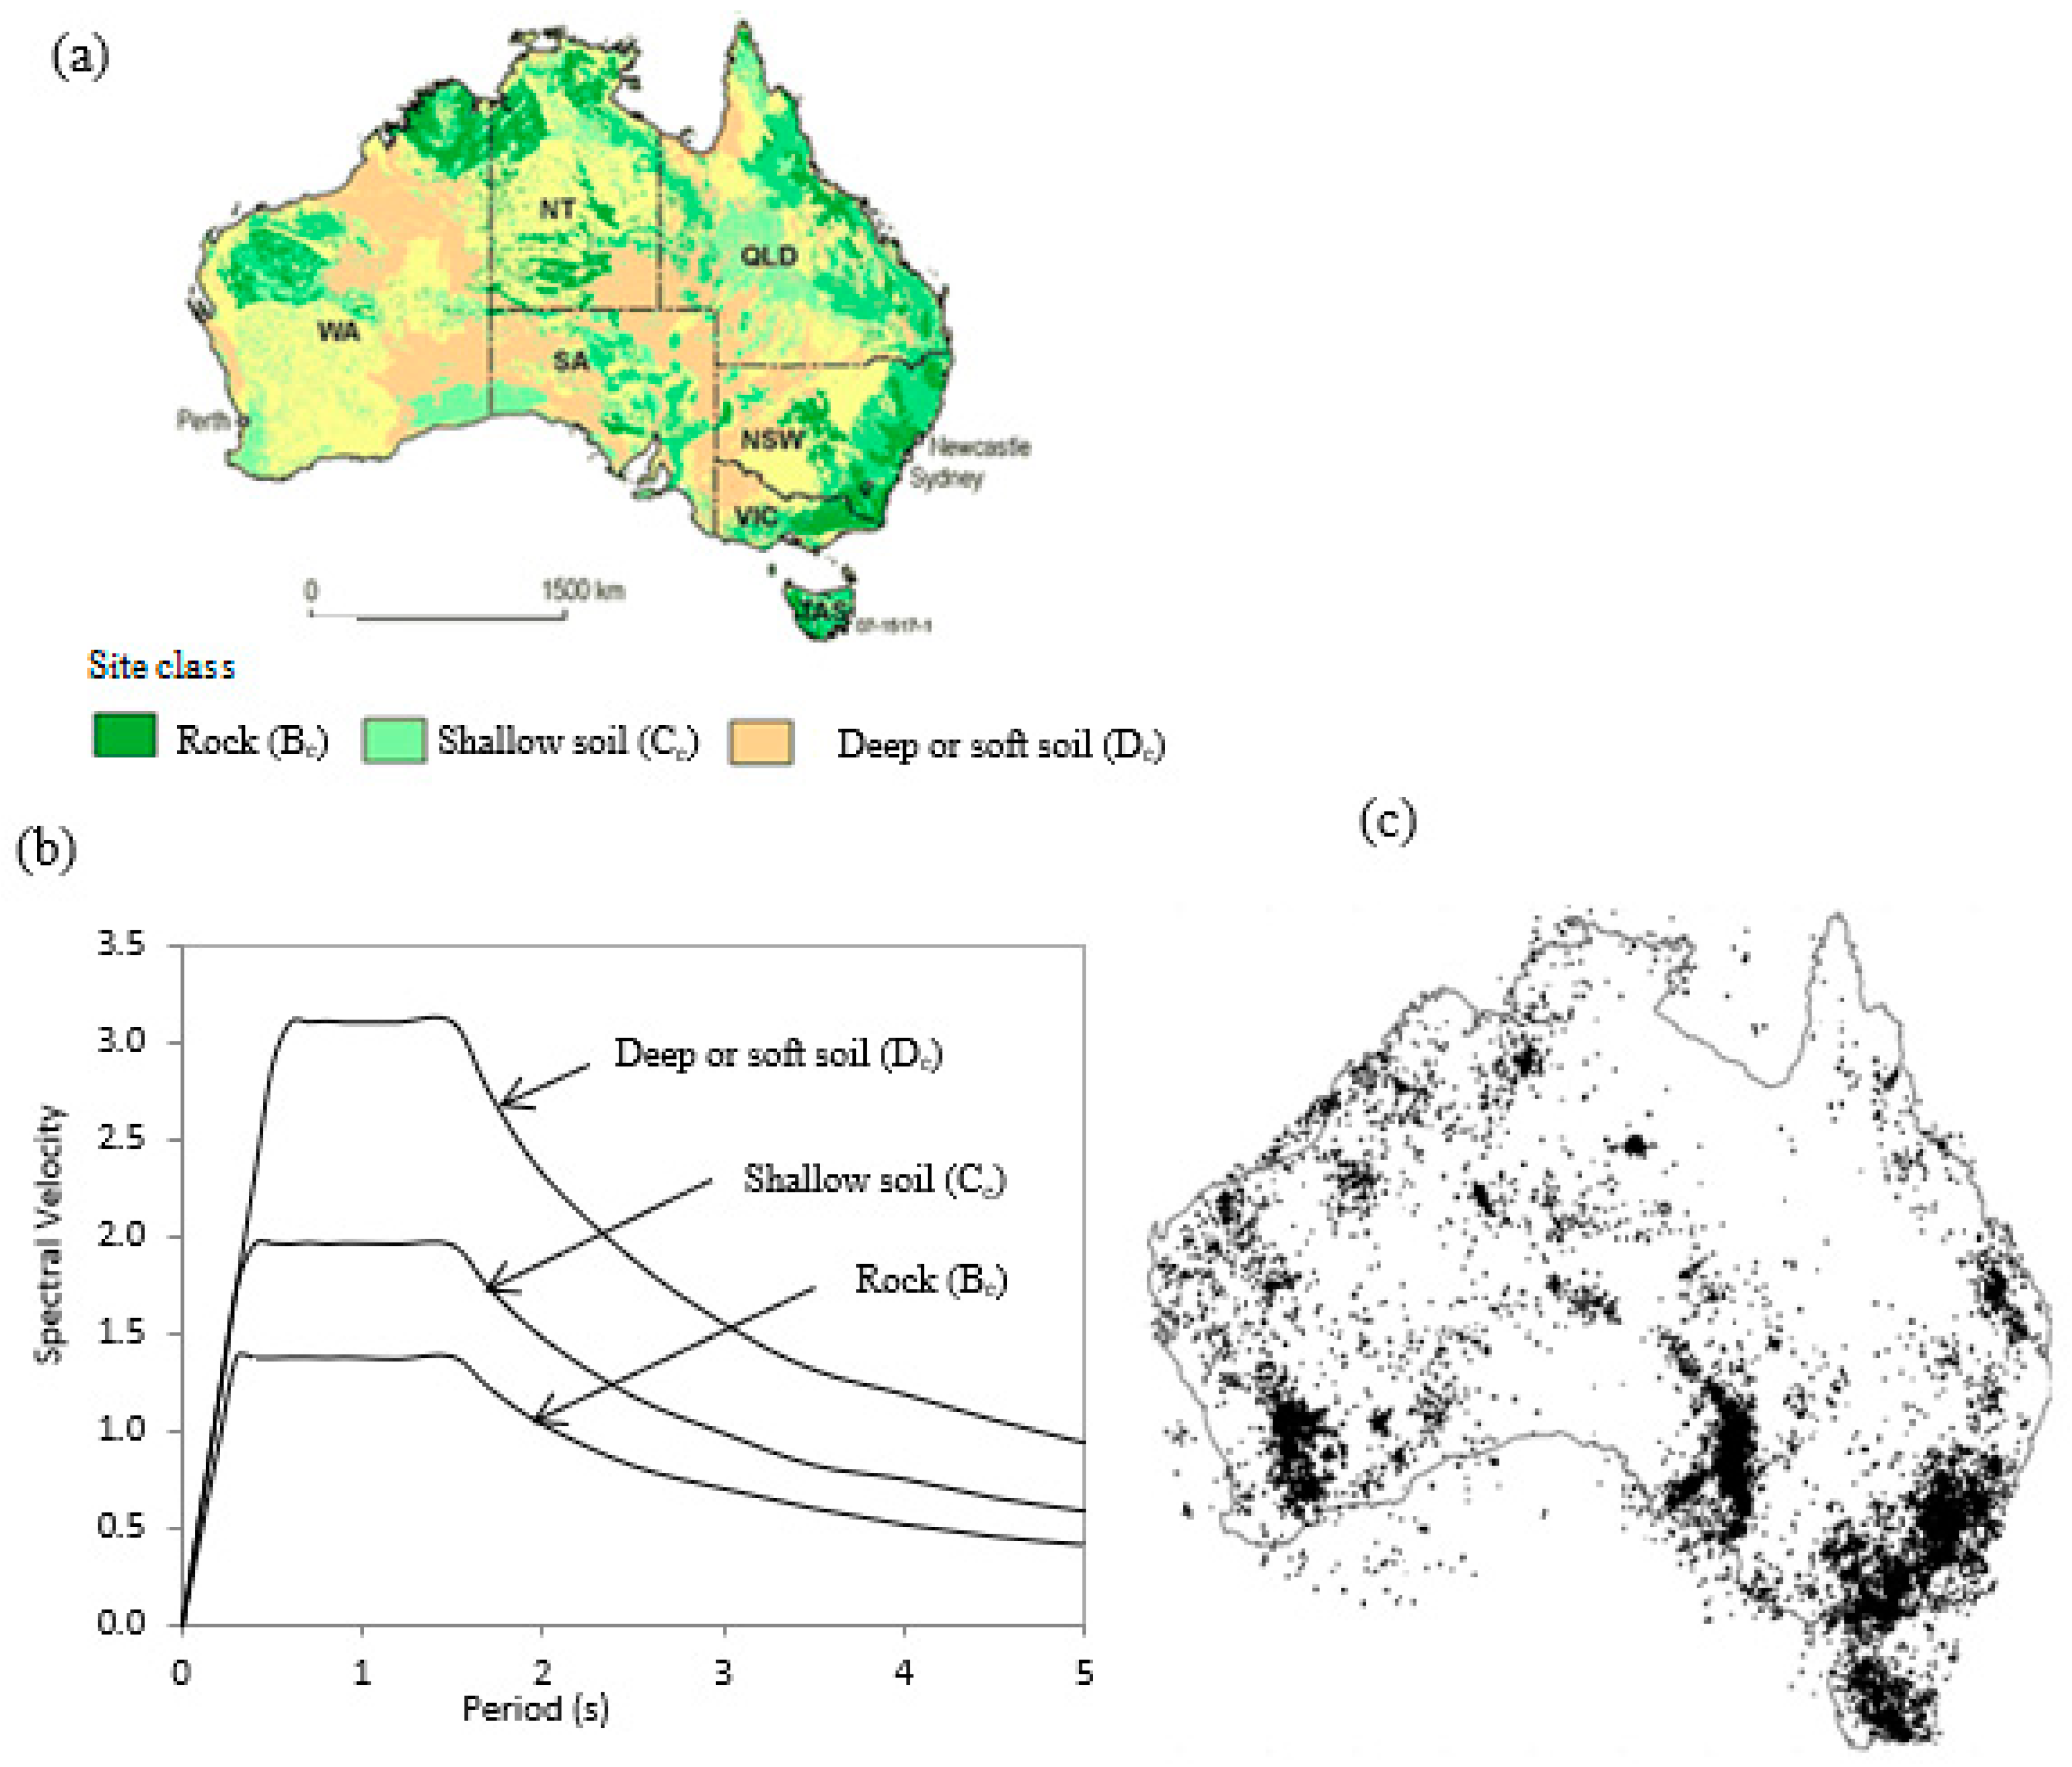
3.2. Seismic Ground Conditions in Australia

Seismic ground characteristics, also known as side effects, are a key component in earthquake design, and many seismic codes [27,45,46,47] have accepted the significance of this parameter and attempt to incorporate the influence by using different methods. As per the Australian standard, there are some recommendations for site classes and corresponding site factors and different response spectrums are provided for different soil classifications. As per AS1170.4 [47], there are mainly five soil types defined for Australian ground conditions, from strong rock (Ae) to very soft soil (Ee). The soil properties vary greatly from strong rock to very soft soil in terms of compressive strength, shear wave velocity, etc. In this study, only three soil properties were considered (Be, Ce, and De). The spatial distribution of the soil conditions [44] and the response spectrums for each of the soil classifications [47] are shown in Figure 5.
The stochastic simulation of ground motions is one of the methods used to simulate artificial accelerograms. The seismological model generally controls the frequency content of the simulated accelerograms, and different software or programs are used for the development of ground motion prediction expressions (GMPE). GENQKE is a program developed for the stochastic simulation of the seismological model and this program has contributed to research and consultancy practices in Australia for more than 20 years [48]. The accelerograms developed from GENQKE were used in this study and more information on the program can be found in [48,49]. A total of 36 accelerograms in each category were used in the analysis and some examples of accelerograms for rock, soil De, and soil Ce with a magnitude of 5.5 and a radius of 17 km are shown in Figure 6.
Improved response spectrums have been predicted from a stochastic attenuation model named the component attenuation model (CAM), developed by Lam, Wilson, Chandler, and Hutchinson [24]. CAM is capable of predicting the response spectra for Australia with expected peak ground velocity associated with different soil conditions. The response spectrum developed based on CAM was utilised in this study and different combinations as listed in Table 1 for earthquake magnitudes (M) and epicentral distances (R) were used for three soil types with 60 mm/s peak ground velocity. The ground motion time history results were generated artificially for the response spectrum obtained from CAM [24]. The response spectrums obtained for each time history accelerogram for each soil type with M = 7 and R = 90 km combination are shown in Figure 7.

3.3. Statistical Analysis of Geoscience Australia Data

The seismic vulnerability of structures is mainly influenced by the attributes of the earthquake and their sequence. To account for the impact of these parameters, stochastic models are used, and probabilistic seismic hazard analysis (PSHA) is one of the standard methods to predict such hazards. Considering Australia as the study region, a comprehensive statistical analysis was performed to obtain the occurrence intervals of earthquakes using the available data.
The analysis of time intervals between successive earthquakes is a significant element in implementing the proposed framework, and different approaches are available to predict the probability distribution [50]. To examine the probability distributions of earthquake occurrence in Australia, a total of 24,747 earthquakes that occurred from 1900 to 2016 [44] were statistically analysed. The data consist of different earthquake magnitudes ranging from 0 ML to 6 ML and earthquake depths from 0 km to 35 km. The geological distribution of all the considered earthquakes is shown in Figure 5. The occurrence interval between two consecutive earthquakes in Australia can be expressed as an exponential distribution with a mean value of 2.6 years, as shown in Figure 8.
f ( Δ t : λ ) = 0.39 e 0.39 ( Δ t ) 0 Δ t 0 Δ t < 0

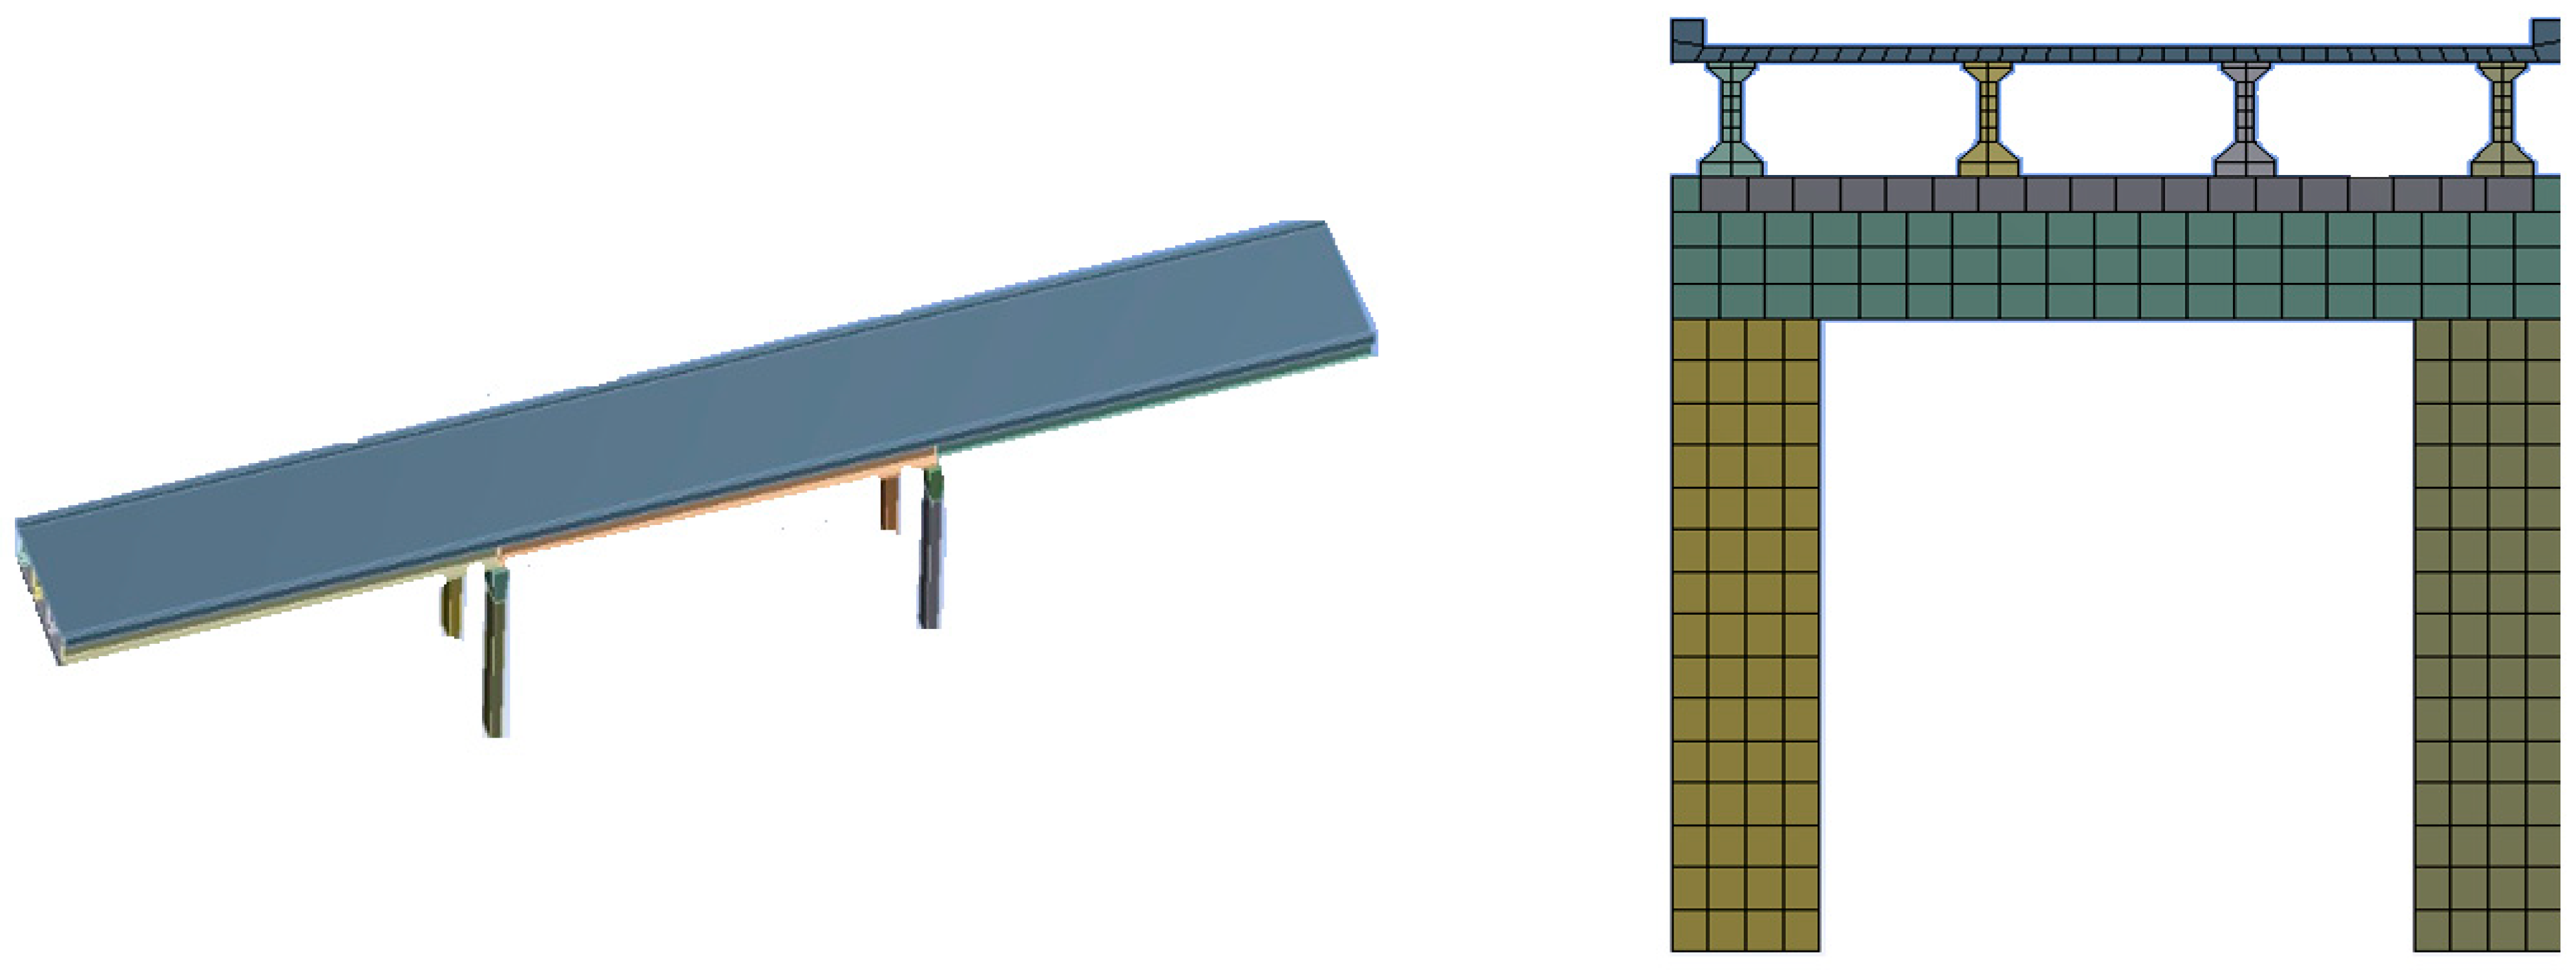
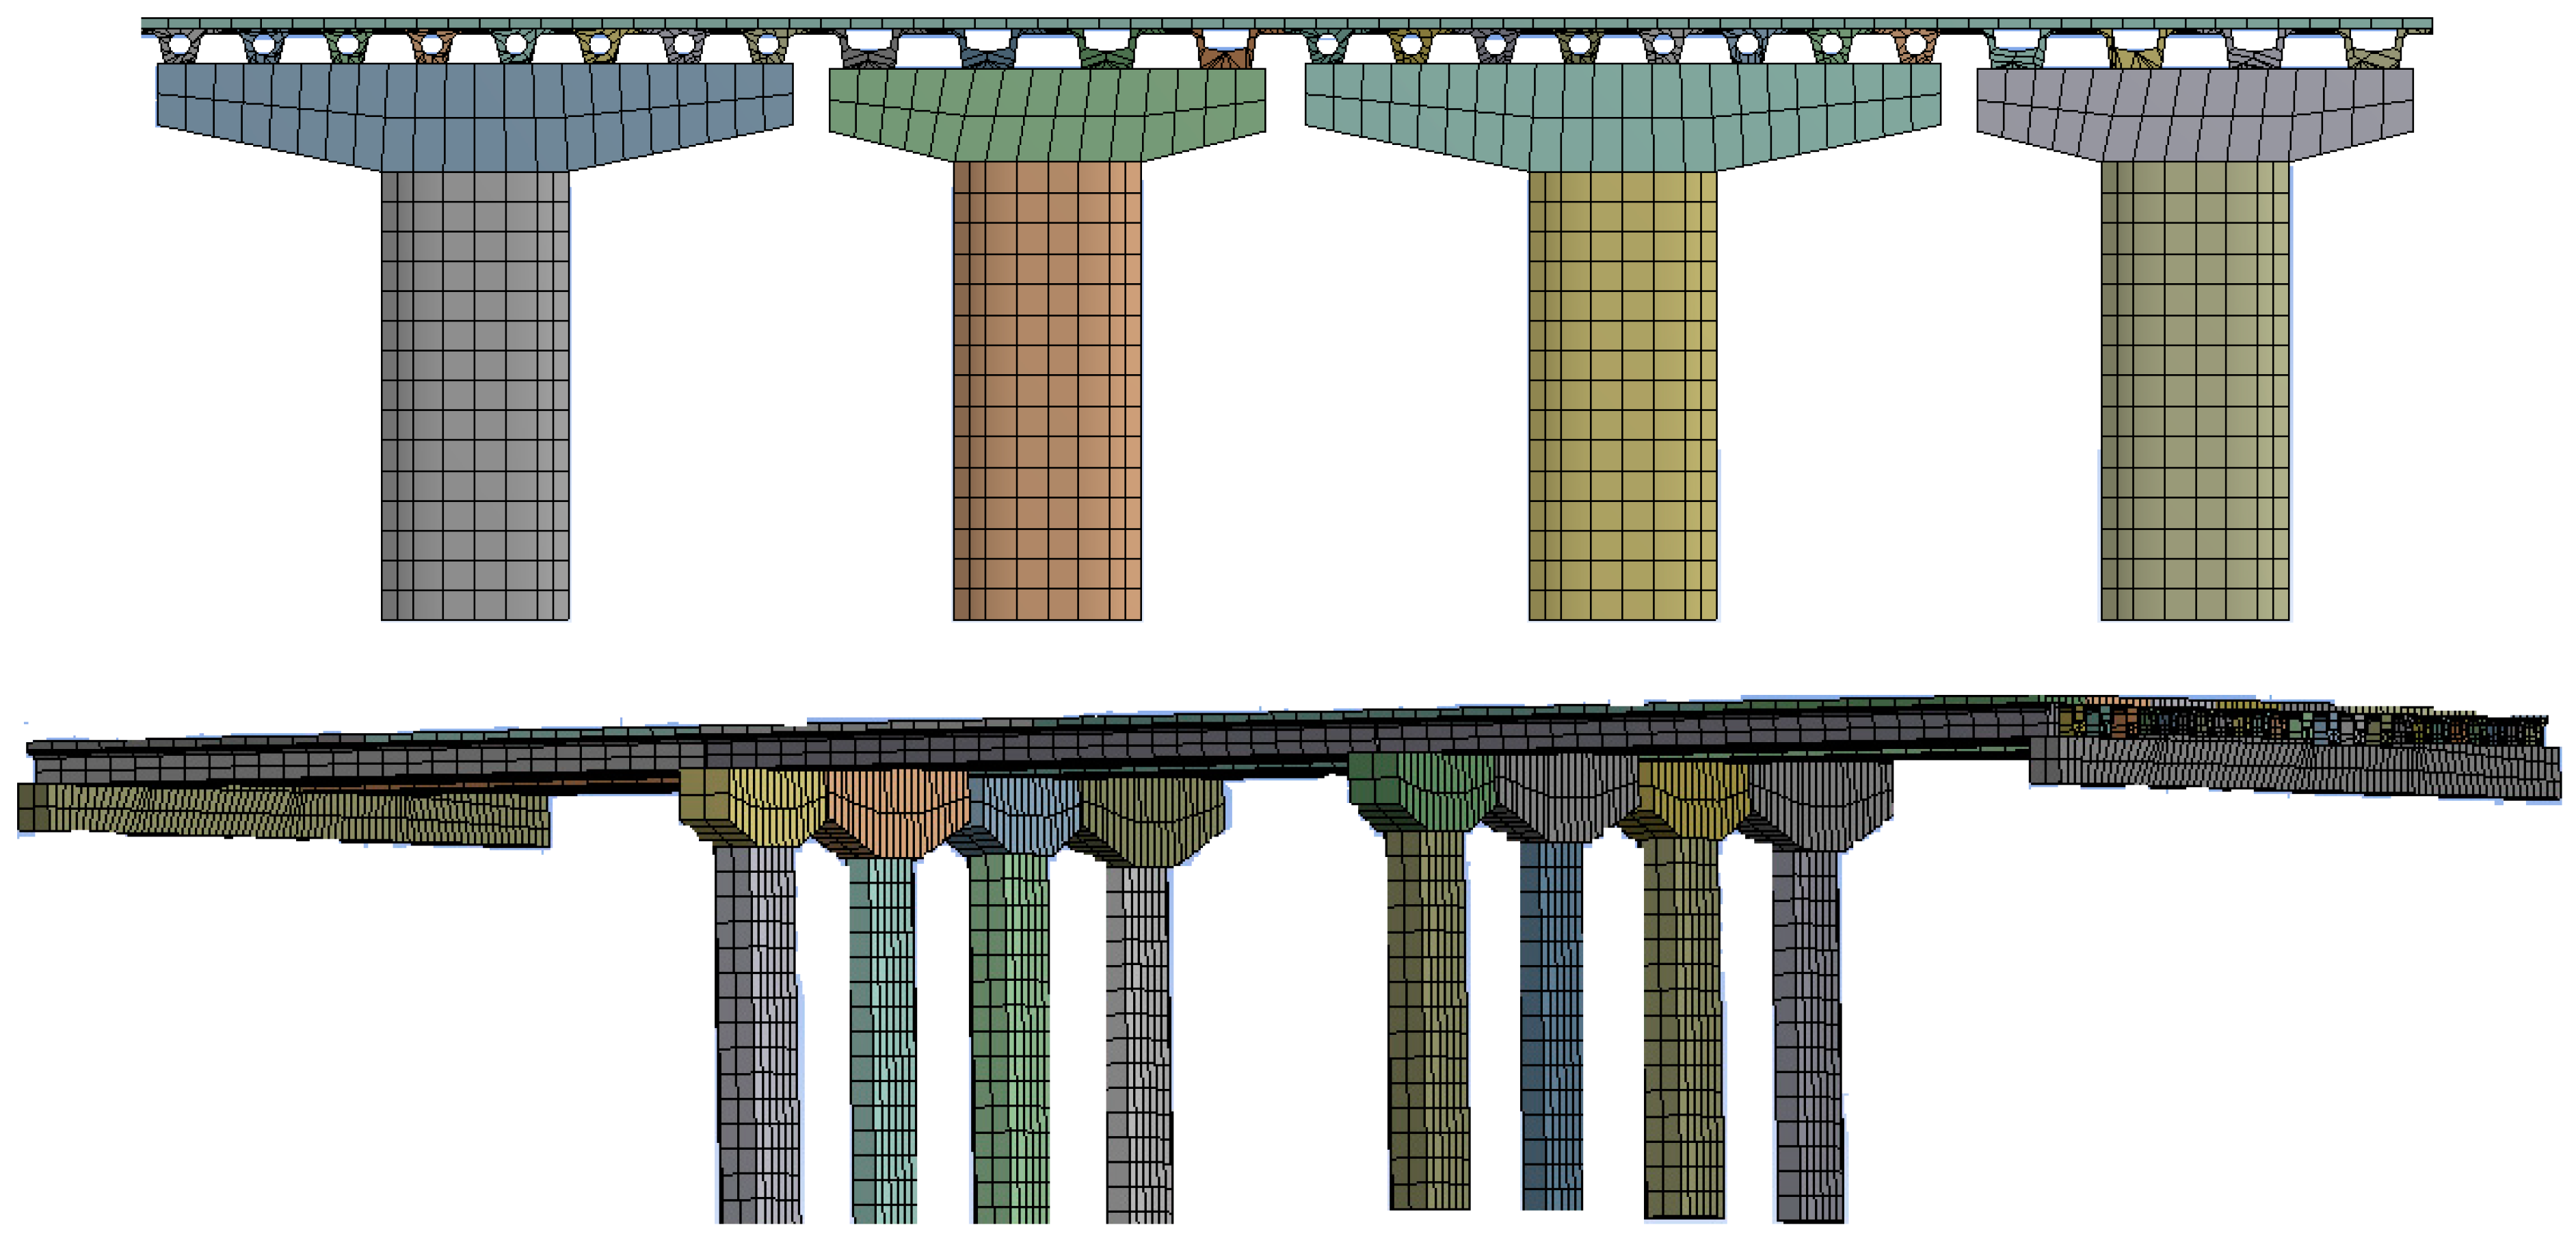
3.4. Finite Element Modelling (FEM)

To apply the proposed methodology, two case study bridges were selected. Bridge 1 is a typical reinforced concrete bridge located in Queensland, built in the 1970s and Bridge 2 is a prestressed concrete bridge located in Victoria. Bridge 1 is 82.15 m long and 8.6 m wide, and there are a total of 12 pre-stressed girders to support the bridge. These twelve pre-stressed reinforced concrete girders (27.38 m long each) comprise over three spans. Two abutments and two headstocks support these girders. The details of the bridge are shown in Figure 9. Nominal concrete compressive strength of 40 MPa was used for this bridge.
Bridge 2 is a super Tee girder bridge supported on two rows of piers (four piers in each row) and the abutments. The total length of the bridge is approximately 40 m and each span of the girders is approximately 13 m. There are two types of piers in each row of piers, supporting pre-stressed concrete girders. Piers 1 and 3 support eight pre-stressed normal T girders and piers 2 and 4 support four super T girders, as shown in Figure 10. The nominal compressive strength of 40 MPa was considered for all the elements in the bridge.

Finite Element Model Development

Three-dimensional finite element models (FEMs) were developed for both Bridge 1 and Bridge 2 using finite element package Ansys 14.5 (ANSYS 2015) using “As built” construction drawings of the bridges to identify the displacements and reactions caused by multiple earthquakes. As suggested by previous studies [52], SOLID65 and LINK180 elements available in ANSYS were used to develop the concrete and reinforcement, respectively. The material properties of concrete and reinforcement were detailed in Table 2. A perfect bond was assumed for the bond between reinforcement and the concrete. The pier and girder were connected with a bearing with four M16 bolts. This connection was represented by spring elements with a stiffness of 79 kN/mm, which was obtained from the study [53] and the manufactured specification [54]. A convergence study was conducted to find the optimal mesh size. Based on the influence of mesh size on the lateral displacement and computational time, mesh sizes of 50 mm and 150 mm were selected for girders and piers, respectively.
Depending on the size of the cross-sections as described earlier, both coarse and fine meshes were used in the model considering the analysis time. Since the damage caused by earthquake impacts is considered ‘minor’ damage (crack width < 0.2) [2], the model was developed to conduct elastic analysis using response spectrum analysis. The bilinear isotropic hardening model with a nominal yield stress of 40 MPa for concrete and 500 MPa for steel was used in the analysis. Fixed support was assumed at the base of the piers and horizontal displacements were allowed at abutments using roller supports. The Ansys model elevations and sections are shown in Figure 11 and Figure 12. Response spectrum analysis was then conducted using the derived response spectrums using Component Attenuation Model (CAM) [24] for Australia for different soil conditions as per AS1170.4 [47]. The response spectrums for these soil conditions were derived based on different shear wave velocities for different soil types Ae to Ee with appropriate soil amplification factors [55], as shown in Figure 7. The response spectrums for each soil type were included in the software to calculate the corresponding displacements and other parameters for the relevant soil type.
Assuming that the bridges could be located anywhere around Australia, different soil types (rock, shallow soil, and soft soil) available in Australia were considered for the analysis. Response spectrum analyses were conducted for both bridges using the response spectrums, which were generated to be compatible with the response spectrums obtained from the component attenuation model (CAM) developed by Lam et al. [25] for the Australian response spectrum, as discussed earlier. Analysis was performed considering only the short span direction (unidirectional) of the bridge considering the most vulnerable direction under seismic actions. The finite element models were used to calculate the damage distributions in each bridge caused by each individual earthquake impact, considering different intensities mentioned in Table 1. As shown in Section 2.5, Equation (12), the probability distribution of damage depends on the accumulated damage and the intensity measure of the earthquakes [35]. Therefore, in this case study, the damage probability distributions for the possible intensities of earthquakes were obtained from the finite element analysis Equations (12) and (16). The current probability distribution of damage was obtained considering the damage accumulation caused by the different intensities of earthquakes and the previous damaged state of the bridge. Random variables with obtained damage distribution parameters were incorporated into the numerical MATLAB program to calculate the damage accumulation at the corresponding time. The displacements and other response parameters were obtained from the finite element analysis, as given in Section 3.4.

3.5. Damage Distributions Using FEM

The damage distribution of the bridge is a significant parameter in the proposed method. The FEM is developed using an available finite element package and damage distributions are obtained based on the model results. In the performance-based design, it is common to use ductility, drift ratio, or concrete strain in quantifying the damage level under a given seismic action. As explained in Section 2.5, different damage levels are proposed by many researchers [56,57,58]. In this study, the damage caused by seismic action was determined based simulation-based method considering the maximum horizontal deflection at the top of the bridge. A 2.5% drift for the important damage state described by Ghobarah [58] was used in this study as the ultimate limit state requirement for the displacement of the column of the bridge pier. The percentage of damage was calculated using Equation (15).
P e r c e n t a g e   o f   d a m a g e = Δ D Δ C · 100 %
where ∆C is the maximum allowable horizontal deflection at the top of a bridge under ultimate limit state requirements (i.e., 2.5% drift, as per Ghobarah [58]) and ∆D is the top horizontal deflection obtained from FE analysis.
As explained earlier, the simulation-based method was adopted in this study to estimate the damage distribution of bridges caused by seismic impacts. Equation (16) was used to calculate the bridge damage from different earthquake impacts. The combination of different intensity earthquakes, as shown in Table 1, were used in the analysis, and the damage distributions for each soil type were obtained.
The probability distributions obtained from the finite element model results indicate that damage distributions at rock and soft sites possess lognormal distributions while shallow sites possess a normal distribution. The probability distributions for Bridge 1 and Bridge 2 are shown in Table 3 and Figure 13.
For the case study bridges, a 100-year service life was assumed with a constant rate of annual structural degradation due to ageing. The degradation due to traffic loading was assumed to be 0.05% annually, considering the reasonable validation of the experimental investigations carried out for bridges with the change in natural frequencies [59].
Following a single shock, the damage assessment of multiple seismic events is important. Damage from earthquake impacts is a combined effect of monotonic structural deformation or ductility and hysteresis energy dissipation. Applying a time-dependent earthquake occurrence rate λa(t), and assuming that the aftershocks usually deteriorate to an insignificant level [60,61], the probability distribution of aftershocks was computed using the time-varying hazard rate and the characteristics of the non-homogeneous Poisson’s process, as given below [35].
P n , t = [ 0 t λ a ( t ) ] n n ! e 0 t λ a ( t )
where P n , t is the probability of the damage of the bridge at time t caused by the nth seismic event, and n and t are the number of seismic events and time, respectively.
The application of the method to real bridges will require input parameters such as the initial capacity of the bridge, the damage distribution caused by earthquake impacts, damage distribution of progressive deterioration, earthquake return period, etc., as given in Section 3.1, Section 3.2, Section 3.3 and Section 3.4. These parameters are used in the reliability framework developed in Section 2.1, Section 2.2, Section 2.3 and Section 2.4 to obtain the probability of failure of the bridge. The numerical model developed in MATLAB was used to predict the reliability of the bridge.

4. Results and Discussion

4.1. Case Study Results

To assess the life cycle performance of bridges in Australia under seismic impacts, a statistical data analysis was conducted. Australia is located in a low to medium seismic region, where not much significant earthquake impact is possible. Generally, the impacts caused by these types of earthquakes are not visible. However, there is a recent interest in addressing the risks of these small earthquakes by exploring the aspects of conventional earthquake engineering, since these earthquakes have recently caused severe damage [62]. These types of multiple earthquake-impact on bridges over a longer period of time have shown that the probability of failure is significantly increased [2,19]. In Australia, earthquake magnitudes that are greater than 2 ML occur with a mean interval of 2.56 years, following an exponential distribution.
The remaining service life of a bridge is significantly reduced as a result of the impact of multiple earthquakes. Bridges are managed using bridge management systems that use the stochastic processes of visual inspection data. As stated in Section 2.5 (numerical solution), the input parameters for the developed framework are obtained in the first step. The probability distributions for earthquake occurrence, damage distributions for progressive deterioration, and damage distributions for the two case study bridges under different soil conditions were obtained as input parameters for the proposed framework. Furthermore, random samples were generated for several impact occurrences with random time intervals during the service life of the bridge. Similarly, random samples were generated based on probability distributions obtained earlier and limit state requirements, as specified in AS 3600 [63] for concrete elements, in order to predict the probability of failure of bridges based on threshold limits. The developed MATLAB program based on the framework (Section 2.1, Section 2.2, Section 2.3, Section 2.4 and Section 2.5) and steps shown in the numerical solution (Section 3.1) was utilised to predict the probability distributions of the two bridges using randomly generated variables based on the input parameters.
The probability of failure of Bridge 1 due to multiple earthquake impacts and the average and the worst-possible probability of failure are shown in Figure 14. As per Figure 14, the average probability of failure of the bridge rapidly increases with time, and the 100-year service life is reduced to 80 years as a result of the impact of multiple earthquakes. Additionally, the framework indicates the existing condition of the bridge compared to the as-built condition, considering the multiple earthquake impacts over time.
A similar probability of failure of Bridge 2 was also observed. Combining the visual inspection data with the proposed framework will provide a better bridge rating system and a management system that could be developed in future.
In addition to the impact of multiple earthquakes, the impact of the type of soil was evident in the study. The result from the study shows that damage due to earthquake impacts accumulates with time, leading to a significant increase in the probability of failure. The probability of failure of bridges located in soft soils was higher than in bridges located in shallow and rock soils (Figure 15).
There is a remarkable difference in the bridge performance under different soil conditions. The probability of failure of a bridge located on rock and shallow and soft soils after 20 years post-construction was 6%, 39%, and 100%, respectively. This clearly shows the impact of earthquakes on bridges in soft soil conditions. Bridges on soft soil are more vulnerable to the degradation of structural capacity and there is a 32% reduction in service life in soft soils compared to rock sites due to multiple earthquake impacts. Based on the numerical simulations, the worst-case scenario caused by the impact of earthquakes in different soils indicates that there is a possibility of bridge failure in the initial stage of operation. The remaining useful life of a bridge located on rock soil reduces the service life from the designed 100-year life to 80 years, and this could be further reduced to 50 years in the worst case. Similarly, the probability of failure of the same bridge located on shallow soil and soft soils shows a significant reduction in service life compared to the bridge located on rock sites. The service life of the bridge located on shallow soil and soft soils is reduced to 34 and 25 years, respectively.
Figure 16 shows the rapid increase in the probability of failure due to the combined effects of earthquake impact and aging. The useful life of the bridge is reduced from 72 years to 40 years when progressive deterioration occurred. Therefore, progressive deterioration was a significant parameter in the assessment of the life cycle performance of bridges.
The results shown in Figure 16 reveal that there is a significant effect from the combined impact due to progressive deterioration and seismic impact, revealing an exponential increase. The probability of failure due to multiple earthquakes is at least 40% higher in both average probabilities of failure graphs and worst-case scenarios for the life cycle of the bridge. Panchireddi, B., and Ghosh, J. [2], have also revealed that there is a 110% increase in median seismic loads after three earthquake shocks.

4.2. Numerical Framework Validation

Although the experimental validation of the proposed model is highly valuable, there are some challenges in obtaining the required data for the model. Challenges in conducting large-scale testing or non-destructive methods throughout the life cycle of the bridges and capturing specific seismic impacts through controlled experiments, there are no experiment data available in the literature to validate this framework. Therefore, authors used certain theoretical validations together with application of the framework for two case study bridges and a parametric study. All the theorical values used in the framework were supported by the available literature and similar studies conducted by other researchers were used to validate the obtained results. A study conducted by Panchireddi and Ghosh [19] encompassed the deterioration of bridges via corrosion and repeated earthquake impacts, and the framework was applied to a concrete box-girder bridge in California. Similar results have been obtained. Furthermore, Mortagi and Ghosh [64] studied the seismic vulnerability of ageing bridges in relation to climate change and observed similar results as the observations made in this study. It was found that the seismic performance of the bridges will be exacerbated with age due to climate change. Similar studies have been conducted by many researchers [33,65,66] and the results obtained from these studies have shown similar results.

4.3. Parametric Study

The initial capacity of a newly built bridge is different to the capacity of an existing bridge (i.e., relatively low U0). Monitoring the performance of the bridge over time depends on the capacity at the time of inspection. To identify the impact of the current capacity of the bridge on the performance, a sensitivity analysis was conducted. The average probabilities of failure of bridges with an initial capacity of 100%, 90%, and 80% were compared in different soil conditions, and the results are shown in Figure 17. The results show that the initial capacity affects the probability of failure of bridges.
In the sensitivity analysis, it is shown that a 10% reduction in the initial capacity of the bridge located on rock soils has resulted in reducing the service life by 10%. Similarly, the 20% reduction in initial capacity has reduced the service life by approximately 25%. Shallow and soft soil conditions have also shown similar patterns related to the reduction in the initial capacity of the bridge. Unlike the damage reduction caused by a single earthquake impact, the capacity reduction from multiple earthquakes has a significant impact on damage accumulation. It has been shown that there is a clear relationship between capacity reductions and the probability of failure due to the accumulation of damage. Therefore, a correct estimate of the capacity of bridges is vital in maintenance activities.

5. Conclusions

A reliability-based framework was proposed to make decisions based on the prediction of damage accumulation in bridges caused by the combined effect of multiple earthquake impacts and progressive deterioration. This framework can be used in the decision-making process in bridge maintenance activities.
The probability of the failure of bridges was described in terms of the performance of two case study bridges located in Australia in different soil conditions. The following conclusions were made based on the case study analysis:
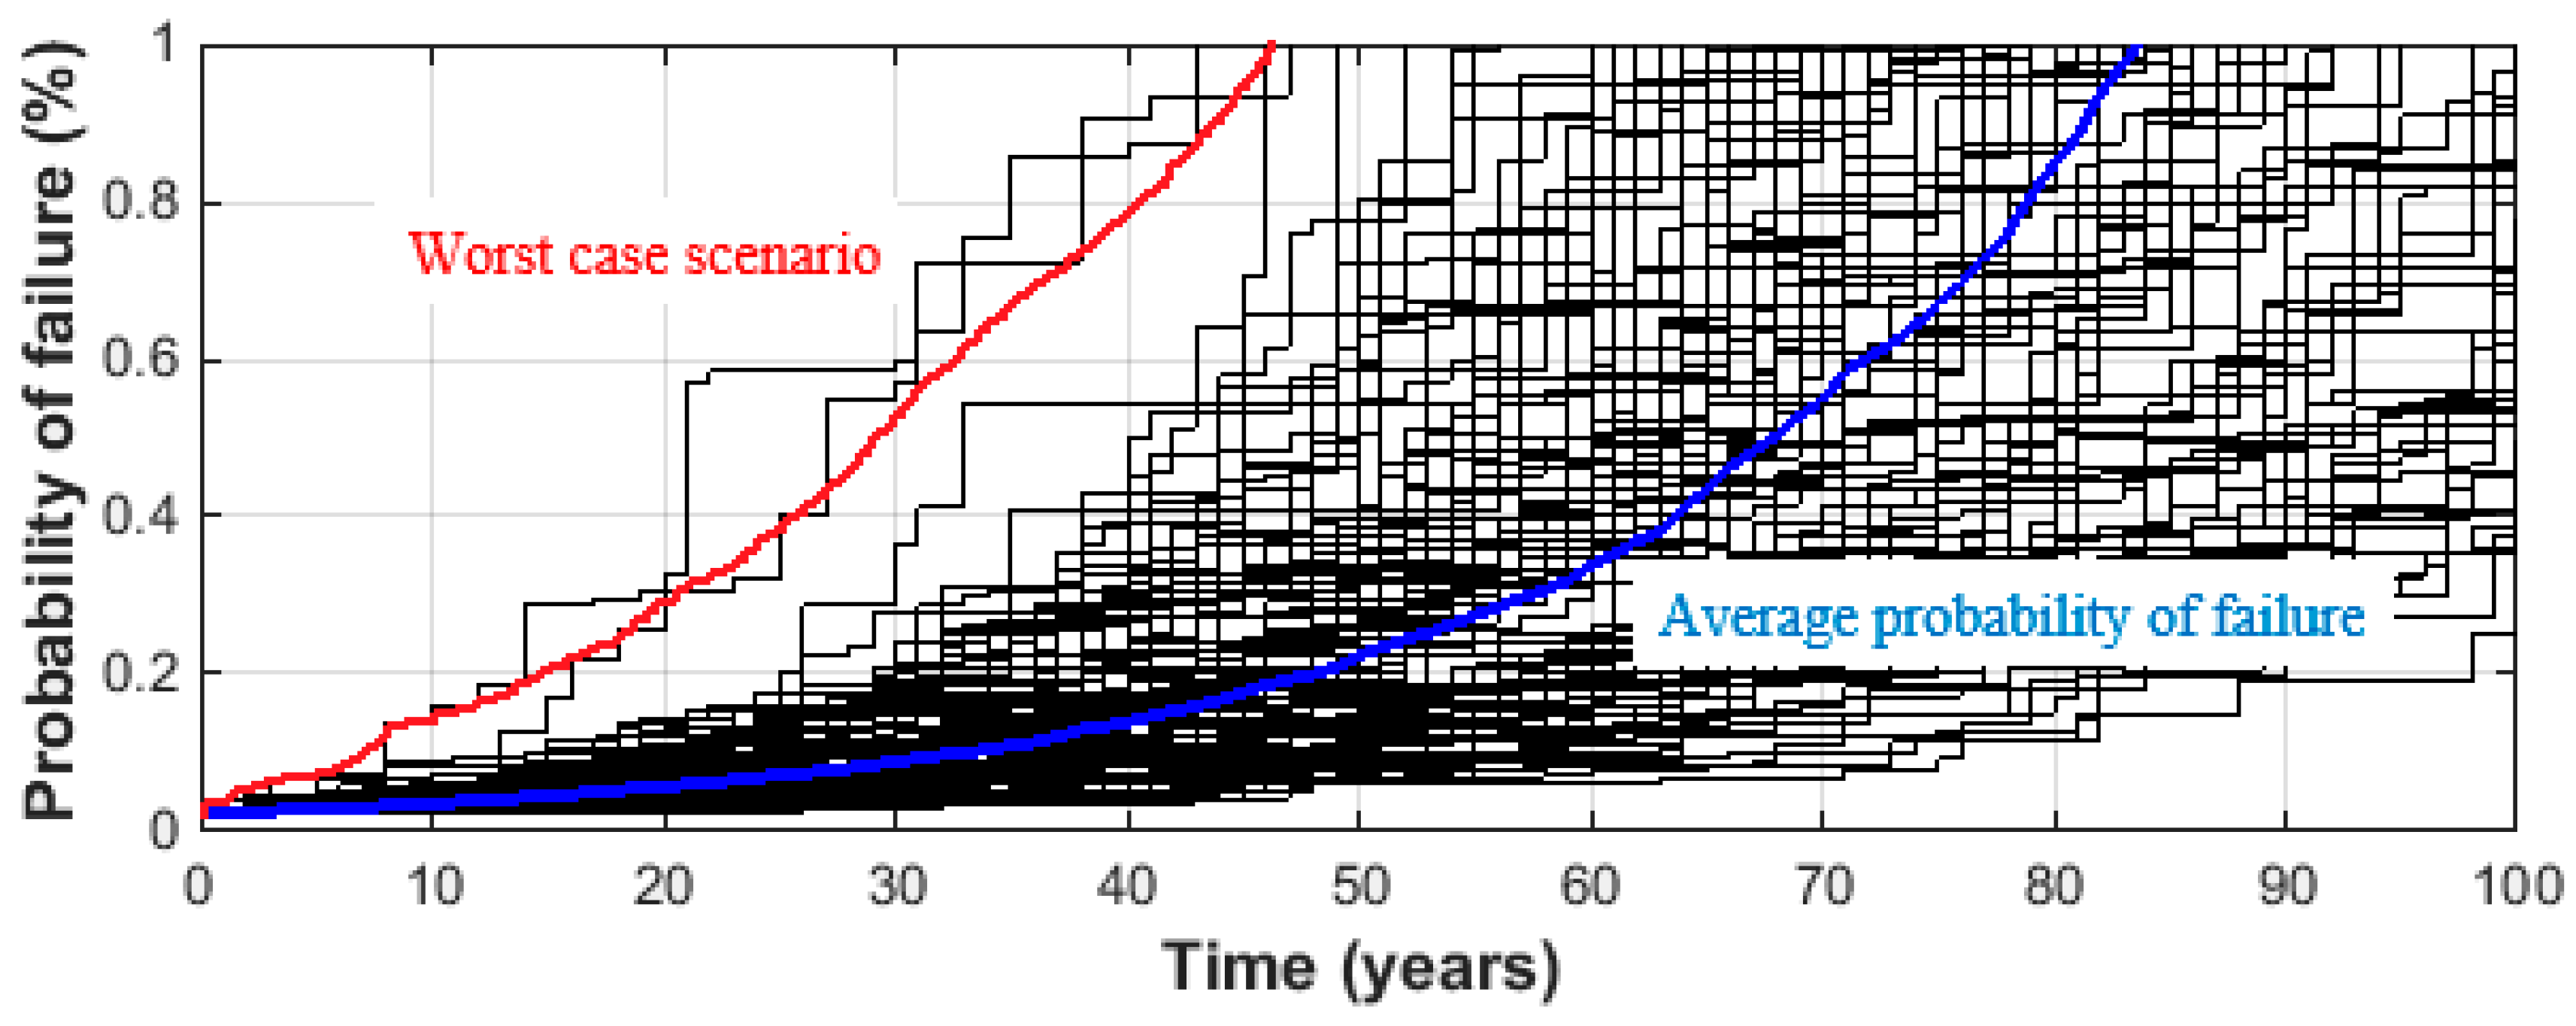
  • The proposed framework is capable of predicting the time-dependent probability of bridge failure under earthquake impacts and progressive deterioration. It can provide useful information on the decision-making process in the maintenance regime for bridges.
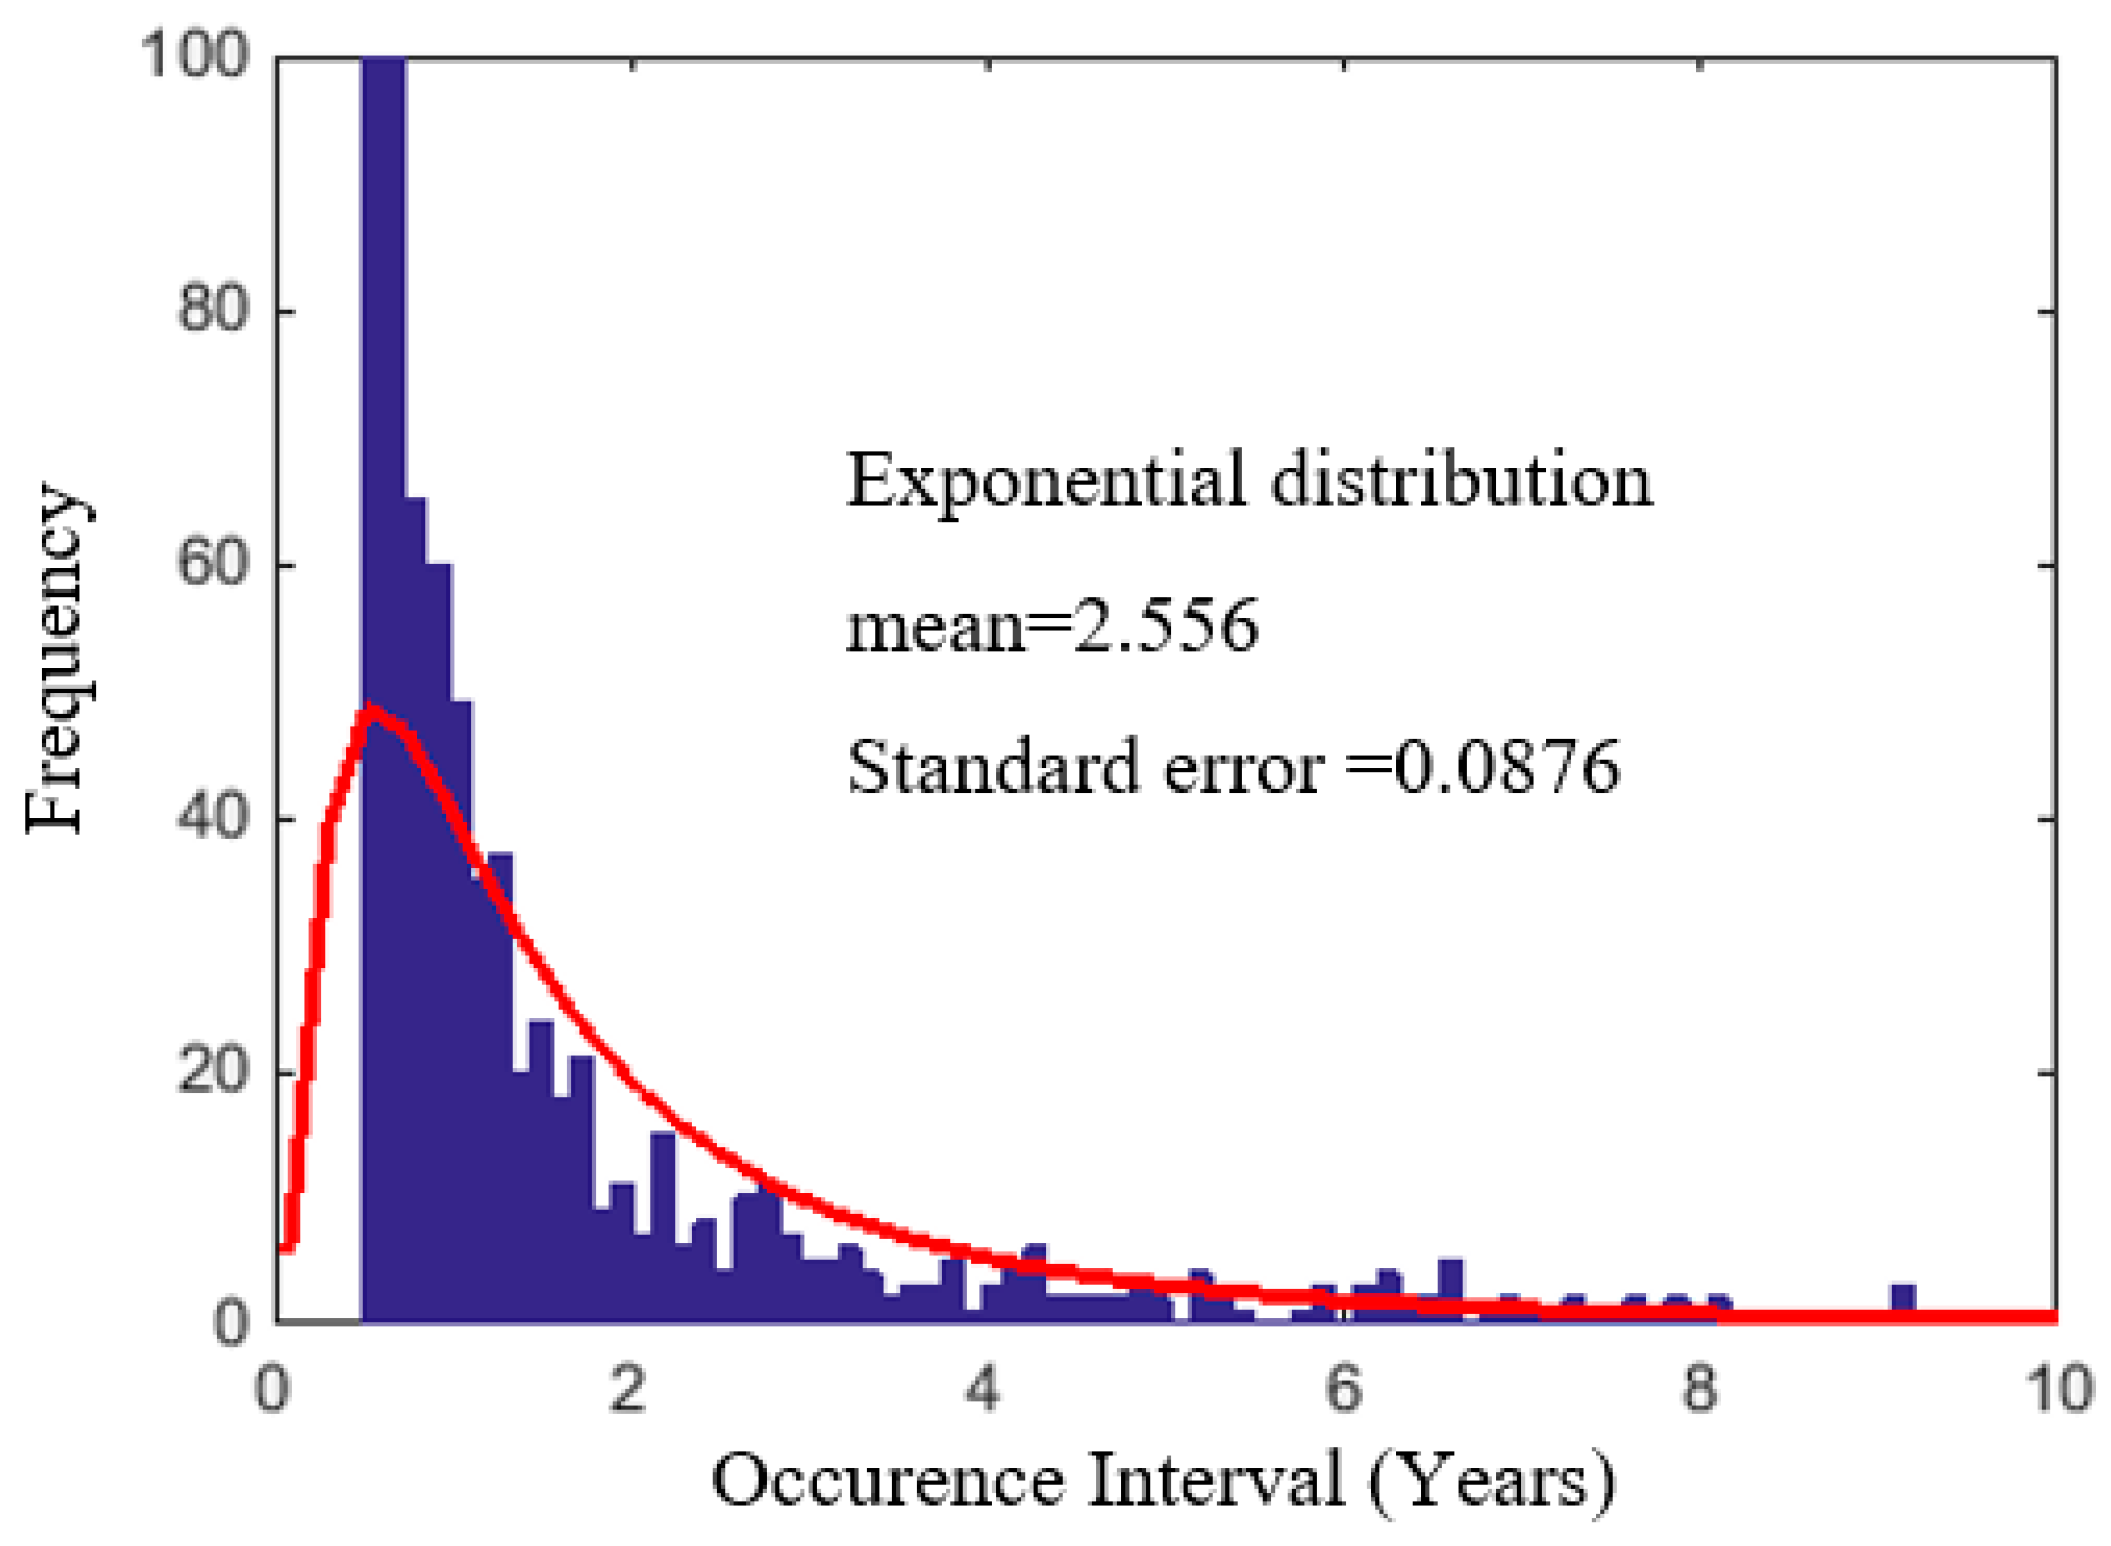
  • The earthquakes greater than 2 ML that occurred in Australia possess an exponential distribution with a mean value of 2.6 years.
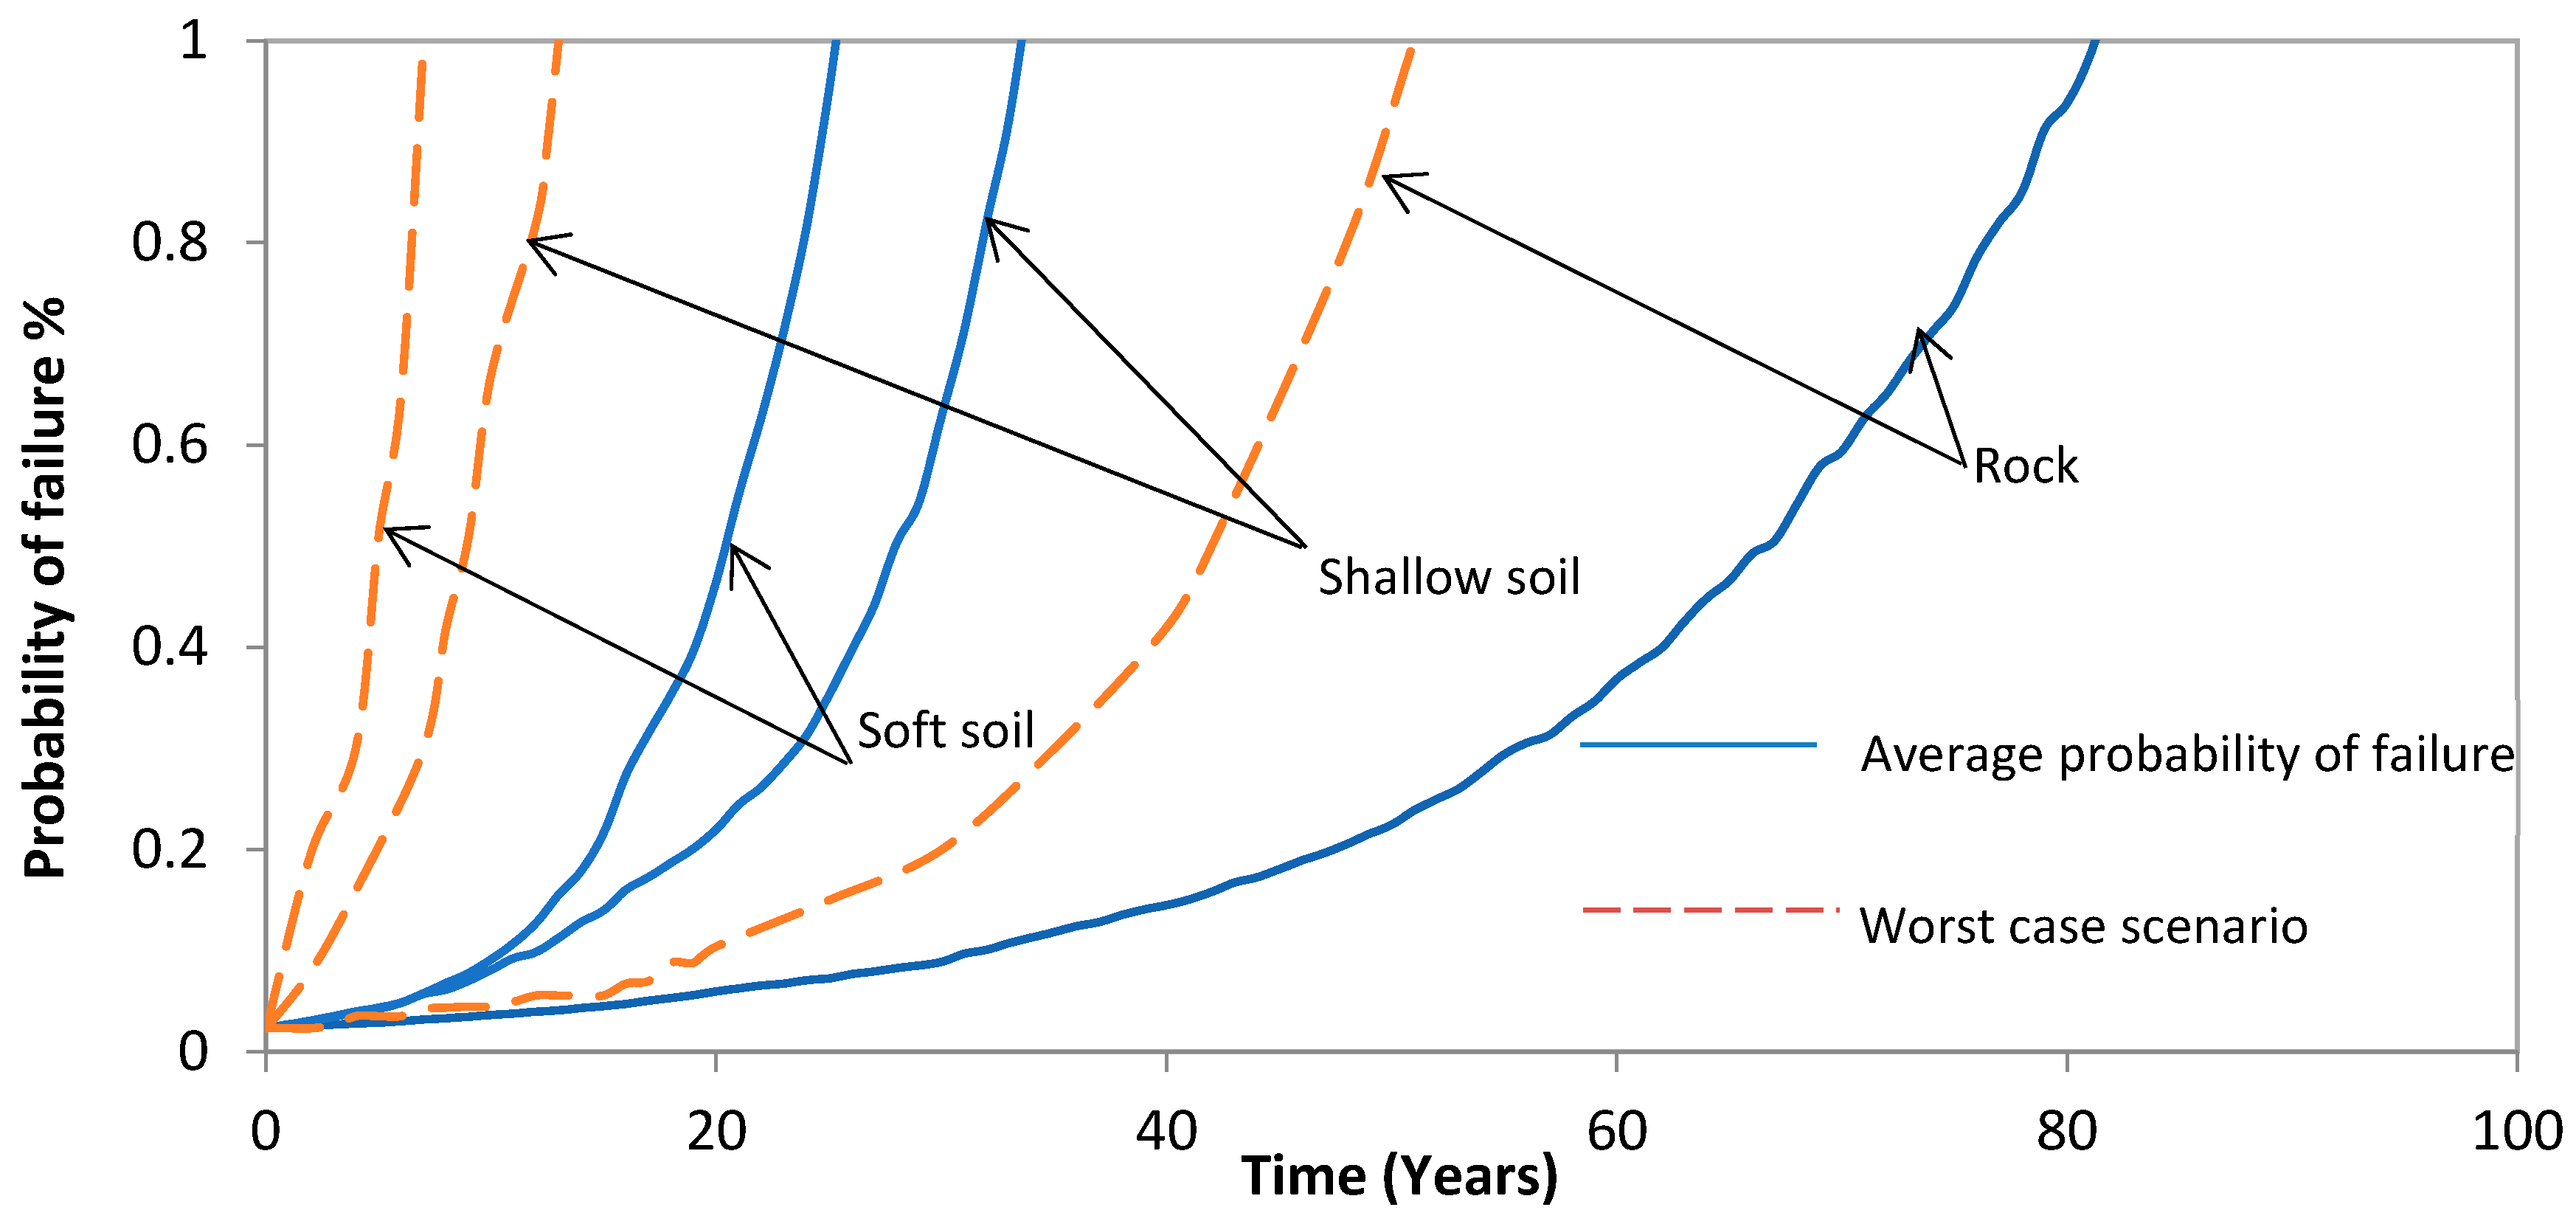
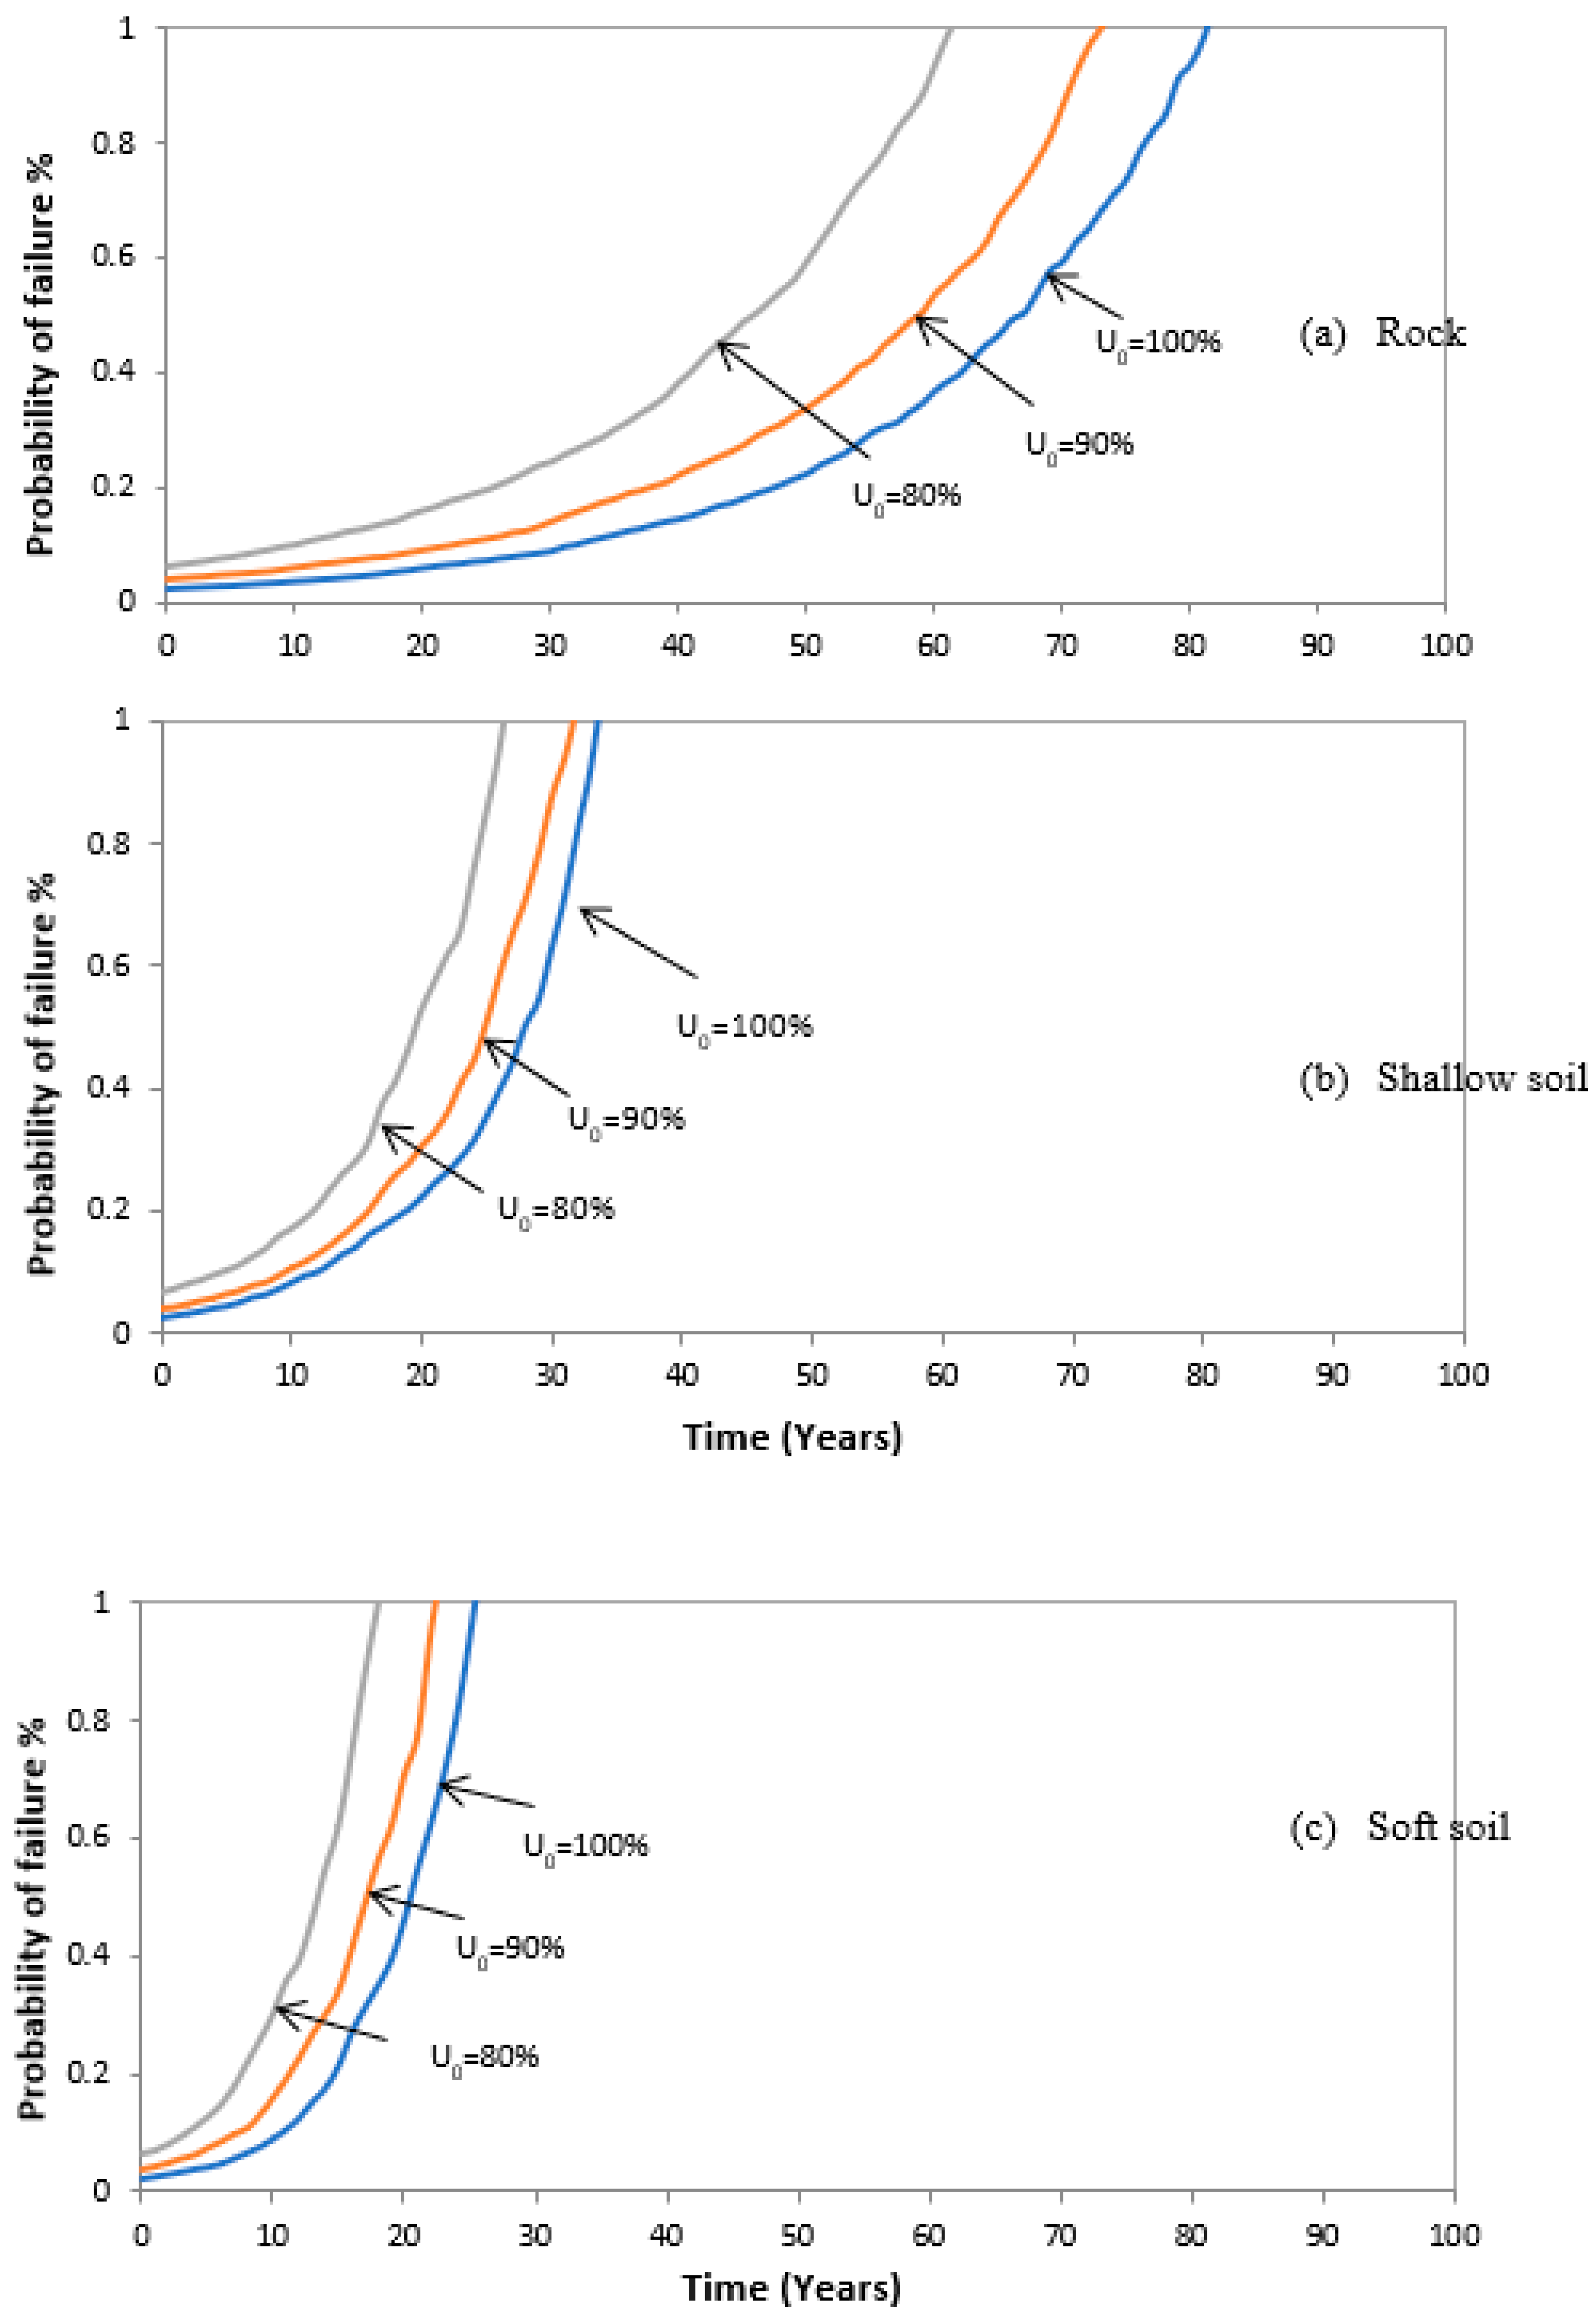
  • Soil conditions significantly influence the residual service life of a bridge affected by multiple earthquake impacts.
  • After multiple earthquake impacts, the average reduction in the service life of a bridge located on rock soil could be reduced to 80%, or up to 50% in the worst-case scenario. Similarly, service life could be reduced to 30% and 20%, respectively, of its designed operational years in shallow and soft soil conditions. Furthermore, there is at least a 40% increase in the probability of failure due to the effect of multiple earthquakes in aging bridges during the service life of the case study bridges.
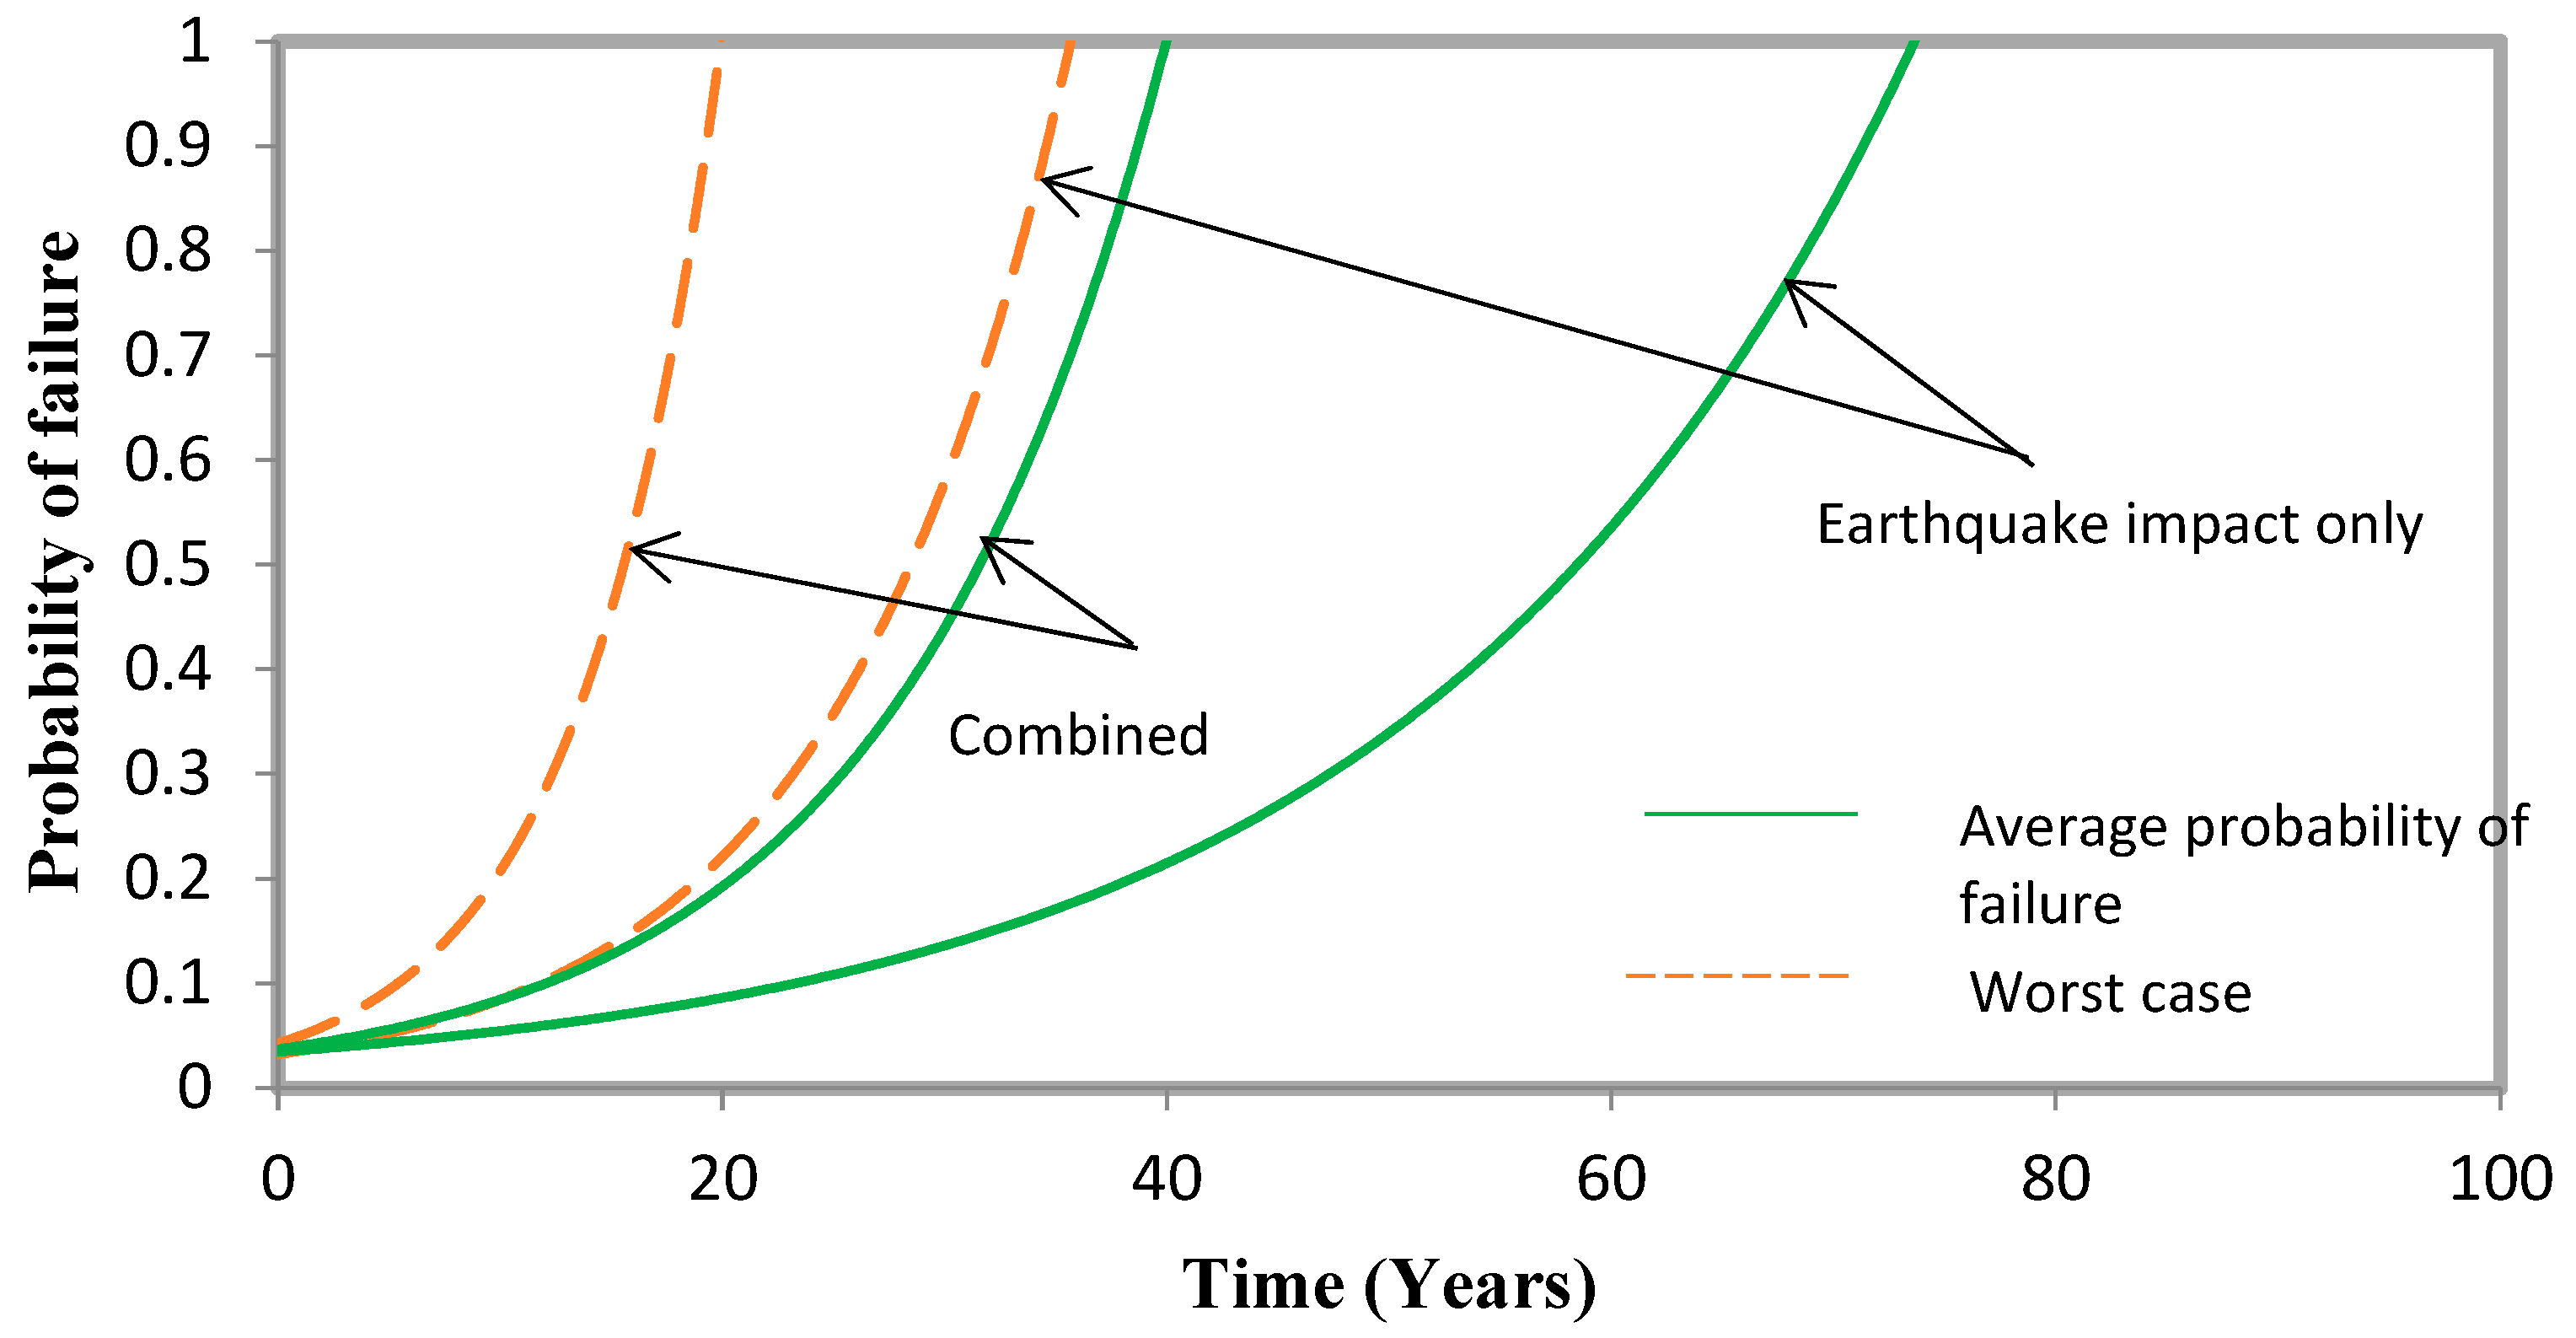
  • At rock sites, the average probability of failure for a bridge due to the combined effects of deterioration and earthquakes is 44% greater than earthquake impacts alone.
  • The failure rate of bridges located in shallow and soft soils is much higher compared to bridges located at rock sites. The probability of bridge failure located in rock, shallow, and soft soils at 20 years after construction is 6%, 39%, and 100%, respectively.
The developed model is a simplified version of the reliability-based framework for multiple earthquake impacts and the progressive deterioration of bridges. This tool can be used by decision makers to identify whether repairs are required and what the necessary time frames for reparations are, depending on the probability of failure of the bridge. There are some limitations of this framework. The impacts of the foundations and soil–structure interactions were out of the scope of the study. However, the proposed framework could be extended as a further study to predict the impact of the foundations and soil–structure interactions. Furthermore, repairs and replacements that occurred during service life can change the structural capacity, and these parameters should be included in the evaluation of cumulative damage in bridges. While repairs that occurred during service life were not considered in the proposed framework, it could be refined accordingly. Finally, the proposed framework was examined based on bridges and earthquake impacts in an Australian context, but it could be applied generally for any bridge under any seismic conditions by adjusting the required parameters in the framework regarding bridge maintenance activities.

Author Contributions

N.H.: conceptualization, methodology, data curation, formal analysis, investigation, software, visualization, writing—original draft. L.Z.: methodology, writing—review and editing. P.M.: funding acquisition, supervision. S.N.: validation, writing—review and editing. W.L.: validation, writing—review and editing, S.S.: funding acquisition, supervision. All authors have read and agreed to the published version of the manuscript.

Funding

This research was funded by the Bushfire and Natural Hazards Cooperative Research Centre research grant on “Enhancing Resilience of Critical Road Structures: bridges, culverts and Floodways under natural hazards”, Australian Research Council (ARC IH150100006).

Data Availability Statement

Data available upon request.

Acknowledgments

The authors would like to thank the Bushfire and Natural Hazards Cooperative Research Centre RMIT University and The University of Melbourne for their support.

Conflicts of Interest

The authors declare no conflict of interest.

References

  1. Di Sarno, L. Effects of multiple earthquakes on inelastic structural response. Eng. Struct. 2013, 56, 673–681. [Google Scholar] [CrossRef]
  2. Panchireddi, B.; Ghosh, J. Probabilistic seismic loss estimation of aging highway bridges subjected to multiple earthquake events. Struct. Infrastruct. Eng. 2021, 17, 1155–1174. [Google Scholar] [CrossRef]
  3. Abdelnaby, A.E.; Elnashai, A.S. Performance of Degrading Reinforced Concrete Frame Systems Under the Tohoku and Christchurch Earthquake Sequences. J. Earthq. Eng. 2014, 18, 1009–1036. [Google Scholar] [CrossRef]
  4. Bradley, B.A.; Cubrinovski, M. Near-source Strong Ground Motions Observed in the 22 February 2011 Christchurch Earthquake. Seismol. Res. Lett. 2011, 82, 853. [Google Scholar] [CrossRef] [Green Version]
  5. Loulelis, D.; Hatzigeorgiou, G.D.; Beskos, D.E. Moment resisting steel frames under repeated earthquakes. Earthq. Struct. 2012, 3, 231–248. [Google Scholar] [CrossRef]
  6. Lee, D.H.; Kim, B.H.; Kim, J.J.; Kim, W. Cumulative Damage Evaluation of RC Bridge Piers subjected to Multiple Earthquakes. Shock Vib. 2020, 2020, 15. [Google Scholar] [CrossRef]
  7. Ballio, G.; Castiglioni, C.A. An approach to the seismic design of steel structures based on cumulative damage criteria. Earthq. Eng. Struct. Dyn. 1994, 23, 969–986. [Google Scholar] [CrossRef]
  8. Elnashai, A.S.; Bommer, J.J.; Martinez-Pereira, A. Engineering Implications of Strong-Motion Records from Recent Earthquakes. In Proceedings of the 11th European Conference on Earthquake Engineering, Paris, France, 6–11 September 1998; p. 59. [Google Scholar]
  9. Oggu, P.; Gopikrishna, K. Assessment of three-dimensional RC moment-resisting frames under repeated earthquakes. Structures 2020, 26, 6–23. [Google Scholar] [CrossRef]
  10. Ghasemi, M.; Khorshidi, H.; Fanaie, N. Performance evaluation of RC-MRFs with UHPSFRC and SMA rebars subjected to mainshock-aftershock sequences. Structures 2021, 32, 1871–1887. [Google Scholar] [CrossRef]
  11. Jeong, G.D.; Iwan, W.D. The effect of earthquake duration on the damage of structures. Earthq. Eng. Struct. Dyn. 1988, 16, 1201–1211. [Google Scholar] [CrossRef]
  12. Amadio, C.; Fragiacomo, M.; Rajgelj, S. The effects of repeated earthquake ground motions on the non-linear response of SDOF systems. Earthq. Eng. Struct. Dyn. 2003, 32, 291–308. [Google Scholar] [CrossRef]
  13. Han, X.; Frangopol, D.M. Life-Cycle Risk-Based Optimal Maintenance Strategy for Bridge Networks Subjected to Corrosion and Seismic Hazards. J. Bridge Eng. 2023, 28, 12. [Google Scholar] [CrossRef]
  14. Sun, B.; Zheng, Y.; Li, Z. A Multi-scale Corrosion Fatigue Damage Model of Aluminum Alloy Considering Multiple Pits and Cracks. Acta Mech. Solida Sin. 2018, 31, 731–743. [Google Scholar] [CrossRef]
  15. Sun, B. A continuum model for damage evolution simulation of the high strength bridge wires due to corrosion fatigue. J. Constr. Steel Res. 2018, 146, 76–83. [Google Scholar] [CrossRef]
  16. Sun, B.; Zhaoxia, L. Multi-scale modeling and trans-level simulation from material meso-damage to structural failure of reinforced concrete frame structures under seismic loading. J. Comput. Sci. 2016, 12, 38–50. [Google Scholar] [CrossRef]
  17. Sun, B.; Li, Z. Adaptive concurrent three-level multiscale simulation for trans-scale process from material mesodamage to structural failure of concrete structures. Int. J. Damage Mech. 2016, 25, 750–769. [Google Scholar] [CrossRef]
  18. Sun, B.; Xu, Y.-L.; Wang, F.-Y.; Li, Z.; Zhu, Q. Multi-scale fatigue damage prognosis for long-span steel bridges under vehicle loading. Struct. Infrastruct. Eng. 2019, 15, 524–538. [Google Scholar] [CrossRef]
  19. Panchireddi, B.; Ghosh, J. Cumulative vulnerability assessment of highway bridges considering corrosion deterioration and repeated earthquake events. Bull. Earthq. Eng. 2019, 17, 1603–1638. [Google Scholar] [CrossRef]
  20. Panchireddi, B.; Shekhar, S.; Ghosh, J. Influence of ground motion duration on the seismic vulnerability of aging highway bridges. Struct. Infrastruct. Eng. 2021, 19, 1041–1063. [Google Scholar] [CrossRef]
  21. Herath, N.; Mendis, P.; Zhang, L. A probabilistic study of ground motion simulation for Bangkok soil. Bull. Earthq. Eng. 2017, 15, 1925–1943. [Google Scholar] [CrossRef]
  22. Petersen, M.D.; Dewey, J.; Hartzell, S.; Mueller, C.; Harmsen, S.; Frankel, A.; Rukstales, K. Probabilistic seismic hazard analysis for Sumatra, Indonesia and across the Southern Malaysian Peninsula. Tectonophysics 2004, 390, 141–158. [Google Scholar] [CrossRef]
  23. Esteva, L.; Villaverde, R. Seismic risk, design spectra and structural reliability. In Proceedings of the 5th World Conference on Earthquake Engineering, Rome, Italy, 25–29 June 1973; pp. 2586–2596. [Google Scholar]
  24. Lam, N.; Wilson, J.; Chandler, A.; Hutchinson, G. Response spectral relationships for rock sites derived from the component attenuation model. Earthq. Eng. Struct. Dyn. 2000, 29, 1457. [Google Scholar] [CrossRef]
  25. Lam, N.; Wilson, J.; Chandler, A.; Hutchinson, G. Response spectrum modelling for rock sites in low and moderate seismicity regions combining velocity, displacement and acceleration predictions. Earthq. Eng. Struct. Dyn. 2000, 29, 1491. [Google Scholar] [CrossRef]
  26. Kallinikidou, E.; Masri, S.F.; Nigbor, R.L.; Smyth, A.W.; Olsen, K.B. A probabilistic approach for the construction of regional earthquake response spectra. Probabilistic Eng. Mech. 2009, 24, 511–526. [Google Scholar] [CrossRef]
  27. Bi, K.; Hao, H. Modelling and simulation of spatially varying earthquake ground motions at sites with varying conditions. Probabilistic Eng. Mech. 2012, 29, 92–104. [Google Scholar] [CrossRef]
  28. Sun, B. Damage simulation algorithm for reinforced concrete structures under seismic loading. Proc. Inst. Civ. Eng.Struct. Build. 2021, 174, 91–98. [Google Scholar] [CrossRef]
  29. Tao, W.F.; Lin, P.H.; Wang, N.Y. Optimum life-cycle maintenance strategies of deteriorating highway bridges subject to seismic hazard by a hybrid Markov decision process model. Struct. Saf. 2021, 89, 11. [Google Scholar] [CrossRef]
  30. Val, D.V.; Stewart, M.G. Decision analysis for deteriorating structures. Reliab. Eng. Syst. Saf. 2005, 87, 377–385. [Google Scholar] [CrossRef]
  31. Bastidas-Arteaga, E. Reliability of Reinforced Concrete Structures Subjected to Corrosion-Fatigue and Climate Change. Int. J. Concr. Struct. Mater. 2018, 12, 13. [Google Scholar] [CrossRef] [Green Version]
  32. Ghosh, J.; Padgett, J.E. Probabilistic seismic loss assessment of aging bridges using a component-level cost estimation approach. Earthq. Eng. Struct. Dyn. 2011, 40, 1743–1761. [Google Scholar] [CrossRef]
  33. Sanchez-Silva, M.; Klutke, G.-A.; Rosowsky, D.V. Life-cycle performance of structures subject to multiple deterioration mechanisms. Struct. Saf. 2011, 33, 206–217. [Google Scholar] [CrossRef]
  34. Frangopol, D.M.; Kallen, M.J.; Noortwijk, J.M.v. Probabilistic models for life-cycle performance of deteriorating structures: Review and future directions. Prog. Struct. Eng. Mater. 2004, 6, 197. [Google Scholar] [CrossRef]
  35. Ghosh, J.; Padgett, J.E.; Sánchez-Silva, M. Seismic Damage Accumulation in Highway Bridges in Earthquake-Prone Regions. Earthq. Spectra 2015, 31, 115–135. [Google Scholar] [CrossRef] [Green Version]
  36. Taylor, O.-D.S.; Lester, A.P.; Lee, T.A.; McKenna, M.H. Can Repetitive Small Magnitude-Induced Seismic Events Actually Cause Damage? Adv. Civ. Eng. 2018, 2018, 2056123. [Google Scholar] [CrossRef]
  37. Iervolino, I.; Giorgio, M.; Chioccarelli, E. Gamma degradation models for earthquake-resistant structures. Struct. Saf. 2013, 45, 48–58. [Google Scholar] [CrossRef]
  38. Pandey, M.D.; van Noortwijk, J.M. Gamma process model for time-dependent structural reliability analysis. In Proceedings of the Bridge Maintenance, Safety, Management and Cost: Proceedings of the Second International Conference on Bridge Maintenance, Safety And Management (IABMAS), Kyoto, Japan, 18–22 October 2004; p. 101. [Google Scholar]
  39. Cosenza, E.; Manfredi, G. Damage indices and damage measures. Prog. Struct. Eng. Mater. 2000, 2, 50–59. [Google Scholar] [CrossRef]
  40. Aamir Baig, M.; Imteyaz Ansari, M.; Islam, N.; Umair, M. Damage assessment of circular bridge pier incorporating high-strength steel reinforcement under near-fault ground motions. Mater. Today Proc. 2022, 64, 488–498. [Google Scholar] [CrossRef]
  41. Gentile, R.; Galasso, C. Hysteretic energy-based state-dependent fragility for ground-motion sequences. Earthq. Eng. Struct. Dyn. 2021, 50, 1187–1203. [Google Scholar] [CrossRef]
  42. Park, Y.J.; Ang, A.H.S. Mechanistic seismic damage model for reinforced concrete. J. Struct. Eng. 1985, 111, 722–739. [Google Scholar] [CrossRef]
  43. Scozzese, F.; Tubaldi, E.; Dall’Asta, A. Assessment of the effectiveness of Multiple-Stripe Analysis by using a stochastic earthquake input model. Bull. Earthq. Eng. 2020, 18, 3167–3203. [Google Scholar] [CrossRef]
  44. Geoscience Autralia. Available online: http://www.ga.gov.au/earthquakes/searchQuake.do (accessed on 24 June 2021).
  45. IBC. International Building Code; ICC: Falls Church, VA, USA, 2006. [Google Scholar]
  46. EC8; Design Provisions for Earthquake Resistance of Structures, Part 1-General Rules, Seismic Actions and Rules for Buildings, and Part 2-Bridges. Commission of the European Union: Brussels, Belgium, 2004.
  47. AS 1170.4; Structural Design Actions-Earthquake Actions in Aiustralia. Standards Australia: Sydney, Australia, 2007.
  48. Lam, N.; Wilson, J.; Hutchinson, G. Generation of Synthetic Earthquake Accelerograms Using Seismological Modelling: A Review. J. Earthq. Eng. 2000, 4, 321. [Google Scholar] [CrossRef]
  49. Tang, Y.; Lam, N.; Lumantarna, E.; Tsang, H.H. Generation of Synthetic Earthquake Accelerogramsbased on up-to-date Seismological Ground Motion Models. In Proceedings of the Australian Earthquake Engineering Society 2016 Conference, Melbourne, Australia, 25–27 November 2016. [Google Scholar]
  50. Dargahi-Noubary, G.R. A Test of the Cyclicity of Earthquakes. Nat. Hazards 1997, 16, 127–134. [Google Scholar] [CrossRef]
  51. Nezamian, A.; Setunge, S. Comarison between ACI 440 and FIB 14 Design Guidelines in Using CFRP for Strengthening of a Concrete Bridge Headstock. In Proceedings of the 4th International Conference on Advanced Composite Materials in Bridges and Structures, Calgary, AB, Canada, 20–23 July 2004; pp. 1–9. [Google Scholar]
  52. Tahenni, T.; Bouziadi, F.; Boulekbache, B.; Amziane, S. Experimental and nonlinear finite element analysis of shear behaviour of reinforced concrete beams. Structures 2021, 29, 1582–1596. [Google Scholar] [CrossRef]
  53. Pavlović, M.; Marković, Z.; Veljković, M.; Buđevac, D. Bolted shear connectors vs. headed studs behaviour in push-out tests. J. Constr. Steel Res. 2013, 88, 134–149. [Google Scholar] [CrossRef]
  54. Hilti. Mechanical anchoring systems. In Heavy Duty Anchors|Medium Duty Anchors; Hilti: Brooklyn, NY, USA, 2014; pp. 243–330. [Google Scholar]
  55. Wilson, J.; Lam, N. A recommended earthquake response spectrum model for Australia. Aust. J. Struct. Eng. 2003, 5, 17–27. [Google Scholar] [CrossRef]
  56. Calvi, G.M.; Nigel Priestley, M.J.; Kowalsky, M.J. Displacement-Based Seismic Design of Bridges. Struct. Eng. Int. 2013, 23, 112. [Google Scholar] [CrossRef]
  57. Priestley, M.J.N.; Calvi, G.M.; Kowalsky, M.J. Displacement-Based Seismic Design of Structures; IUSS Press: Pavia, Italy; Fondazione Eucentre: Pavia, Italy, 2007. [Google Scholar]
  58. Ghobarah, A. Review Article: Performance-based design in earthquake engineering: State of development. Eng. Struct. 2001, 23, 878–884. [Google Scholar] [CrossRef]
  59. Maizuar; Akbar, S.J. Estimating Deterioration Rate of a Bridge Using Changes in Natural Frequencies. Proc. IOP Conf. Ser. Earth Environ. Sci. 2021, 708, 012071. [Google Scholar] [CrossRef]
  60. Federal Emergency Management Agency (FEMA). FEMA-352: Recommended PostEarthquake Evaluation and Repair Criteria for Welded Steel Moment-Frame Buildings; ATC Council: Washington, DC, USA, 2000.
  61. Luco, N.; Cornell, C.A.; Yeo, G.L. Annual limit-state frequencies for partiallyinspected earthquake-damaged buildings. Struct. Saf. 2002, 24, 281–296. [Google Scholar] [CrossRef]
  62. Nievas, C.I.; Bommer, J.J.; Crowley, H.; van Elk, J.; Ntinalexis, M.; Sangirardi, M. A database of damaging small-to-medium magnitude earthquakes. J. Seismol. 2020, 24, 263–292. [Google Scholar] [CrossRef] [Green Version]
  63. AS 3600; Concrete Structures. Standards Australia: Sydney, Australia, 2018.
  64. Mortagi, M.; Ghosh, J. Climate Change Considerations for Seismic Vulnerability Assessment of Aging Highway Bridges. ASCE-ASME J. Risk Uncertain. Eng. Syst. Part A Civ. Eng. 2020, 6, 04020005. [Google Scholar] [CrossRef]
  65. Zhong, J.; Mao, Y.; Yuan, X. Lifetime seismic risk assessment of bridges with construction and aging considerations. Structures 2023, 47, 2259–2272. [Google Scholar] [CrossRef]
  66. Ashrafifar, J.; Estekanchi, H. Life-cycle seismic fragility and resilience assessment of aging bridges using the endurance time method. Soil Dyn. Earthq. Eng. 2023, 164, 107524. [Google Scholar] [CrossRef]
Figure 1. Damage accumulation due to multiple earthquakes and representation of the structural performance after repair and replacement (source: reproduced from [33]).
Infrastructures 08 00106 g001
Figure 2. Damage accumulation as a result of multiple earthquakes.
Infrastructures 08 00106 g002
Figure 3. Damage accumulation due to the combined impact of multiple earthquakes and progressive deterioration.
Infrastructures 08 00106 g003
Figure 4. Proposed numerical procedure considering multiple earthquake impacts.
Infrastructures 08 00106 g004
Figure 5. (a) Soil classification in Australia [44]. (b) Response spectrums for different soil conditions. (c) Geological distribution of earthquakes that occurred in Australia from 1900 to 2016 [44].
Infrastructures 08 00106 g005
Figure 6. Different accelerograms used for the analysis with a 5.5 magnitude and a 17 km radius (a) rock sites (b) soil De, and (c) soil Ce.
Infrastructures 08 00106 g006
Figure 7. Velocity response spectrums for different soil conditions with M = 7 and R = 90 km and a combination for (ac).
Infrastructures 08 00106 g007
Figure 8. Probability distribution of earthquake occurrence interval obtained through statistical analysis.
Infrastructures 08 00106 g008
Figure 9. Structural details of Bridge 1 [51].
Infrastructures 08 00106 g009
Figure 10. Structural details of Bridge 2.
Infrastructures 08 00106 g010
Figure 11. Finite element model of Bridge 1.
Infrastructures 08 00106 g011
Figure 12. Finite element model of Bridge 2.
Infrastructures 08 00106 g012
Figure 13. Probability distributions of damage percentage for Bridge 1 and 2 in rock sites.
Infrastructures 08 00106 g013
Figure 14. Probability of failure of Bridge 1 located on rock sites due to earthquake impacts.
Infrastructures 08 00106 g014
Figure 15. Average and worst-case probability of failures of Bridge 1 under different soil conditions.
Infrastructures 08 00106 g015
Figure 16. Probability of failure of bridges over time under the impacts of multiple earthquakes.
Infrastructures 08 00106 g016
Figure 17. Time-dependent average probability of failure under different initial structural capacities of bridges (U0), representing various current bridge conditions in (a) rock, (b) shallow soil conditions, and (c) soft soil conditions.
Infrastructures 08 00106 g017
Table 1. Different combinations of earthquake magnitudes, epicentral distances, and peak ground accelerations used in the study.
MagnitudeRadius (km)Max Acceleration (PGA) (m/s2)
Rock Soil (Ae)Soil Class (Ce)Soil Class (De)
5.5171.5462.7631.088
1.4382.0010.770
1.5612.6190.653
6281.1272.2170.965
1.0691.8901.024
1.0592.5481.064
6.5400.7972.0080.935
0.7491.8520.839
0.7822.6440.880
7900.6741.8540.926
0.6881.6500.825
0.6651.9550.897
Table 2. Material properties used in the study.
Material Model NumberElement TypeMaterial Properties
1SOLID 65Elastic Modulus
Poisson’s ratio
38.7 GPa
0.2
2LINK180Elastic Modulus
Poisson’s ratio
Yield stress (elastic limit)
200,000 MPa
0.3
500 MPa
Table 3. Statistical information of calculated damage distributions for bridges.
Bridge 1Bridge 2
RockShallowDeep/SoftRockShallowDeep/Soft
DistributionLognormal distributionLognormal distributionNormal distributionLognormal distributionNormal distributionNormal distribution
Mean2.35.57.621.637.98.38
Std. deviation12.974.41.223.223.9
Std. Error0.0840.050.350.140.510.45
Disclaimer/Publisher’s Note: The statements, opinions and data contained in all publications are solely those of the individual author(s) and contributor(s) and not of MDPI and/or the editor(s). MDPI and/or the editor(s) disclaim responsibility for any injury to people or property resulting from any ideas, methods, instructions or products referred to in the content.

