Article

Impact Assessment of Implementing Several Retrofitting Strategies on the Air-Conditioning Energy Demand of an Existing University Office Building in Santiago, Chile

Departamento de Ingeniería Mecánica, Facultad de Ingeniería, Universidad de Santiago de Chile (USACH), Avenida Libertador Bernardo O’Higgins N°3363, Estación Central, Santiago 9170022, Chile
*
Author to whom correspondence should be addressed.
Infrastructures 2023, 8(4), 80; https://doi.org/10.3390/infrastructures8040080
Submission received: 15 March 2023 / Revised: 14 April 2023 / Accepted: 17 April 2023 / Published: 21 April 2023
(This article belongs to the Special Issue Smart, Sustainable and Resilient Infrastructures, 2nd Edition)

Abstract

:
This work analyzed the thermal behavior of an existing building, considering different retrofitting strategies. The methodology starts with an in-situ survey that allowed for obtaining information about occupation, work schedules, envelope materials, lighting, and equipment, which was vital to develop an energy model of the building. Then, the thermal analysis, employing simulations, demonstrates a higher relevance of heat flows through the building’s envelope than internal loads and higher cooling rather than heating demands. Afterward, several retrofit strategies focusing on modifying architectural elements were assessed. Finally, these strategies were compared based on their impact on the air-conditioning energy demand. A systematic review identified a lack of studies relating certification and energy policies to buildings retrofitting. Therefore, we assessed the energy performance of the building, when modified to meet the baseline requirements set on the Chilean certification requirements for sustainable buildings, to verify if the certification is a suitable method to assess the energy efficiency of an office building. Although the study only involves a single building, it aims to illustrate identified limitations using the energy policies for Chilean public buildings. The Chilean certification for sustainable buildings seems not to be suitable for the evaluation of energy consumption for the retrofit of existing buildings. Although this study does not demonstrate general trends, it presents a precedent for subsequent studies to evaluate the relevance of the Chilean certification guidelines.

Graphical Abstract

1. Introduction

The increasing issues associated with greenhouse gas emissions, fossil fuel depletion, and energy demands have led to the research and implementation of technologies that reduce energy consumption. In this context, buildings have a relevant role, making up a total of 36% of the global final energy demand [1], of which 38% corresponds to Heating, Ventilation, and Air Conditioning (HVAC) Systems [2]. Buildings are a relevant agent of CO2 emissions; therefore, climate change policies must consider their impact [3]. Considering that thermal comfort affects productivity in office buildings [4], the challenge is thus to reduce the energy consumed by HVAC systems while maintaining a high standard of the indoor thermal environment. Building retrofitting gives tools to enhance energy efficiency or decrease energy demand in existing buildings. Retrofitting refers to the modification of building components and the installation or incorporation of new elements not considered during the construction; in such a way, the building acquires new features which can improve its energy performance. Usually, retrofitting interventions aim to save energy and increase thermal comfort. The following sections describe the effect of the most commonly analyzed building components during retrofitting and how these components interact together in retrofit interventions.

1.1. Lighting

One of the most common retrofitting interventions is replacing traditional lighting technology with LED lighting. This intervention enhances energy efficiency and reduces operating costs. A study performed in South African schools [5] evaluated the impact of replacing fluorescent lights with LED lights. The study showed that lighting accounts for 31% to 57% of electrical energy costs. Replacing fluorescent tubes with LED lighting generates energy savings from 21% to 39%. A retrofitting based on incorporating LED lighting systems at selected University Tenaga Nasional (Malaysia) buildings focused on a cost-benefit Analysis [6]. The analysis revealed a 44% energy saving with a payback period of 4.01 years by the proposed retrofit. Other research aims to reduce the electricity consumption for exterior lighting at the Avsar Campus of Kahramanmaras Sütcü Iman University (Turkey) [7]; for that purpose, the authors considered three guidelines: the dimming method, optimization of lighting times, and incorporation of new lighting technologies, and seven strategies including dimming the lamps, installation of electronic timer switches, replacement of old technology lamps with LED lamps, and combinations of the later interventions. The authors obtained a reduction of 81.6% in energy consumption.

1.2. Windows

In the retrofitting strategies, windows play an essential role. Thermal transmittance and solar gains through windows significantly impact a building’s energy balance and, therefore, the heating and cooling loads. He, et al., [8] performed a theoretical study to evaluate energy efficiency enhancement in a typical high-rise residential building by window retrofitting. The authors considered three climatic zones: hot summer/warm winter, hot summer/cold winter, and cold climate, representing Hong Kong, Shanghai, and Beijing, respectively. They concluded that 6 mm Low-E double glazing with 13 mm air fill has the best performance to reduce energy consumption in all studied climatic zones. Additionally, tinted glass for hot summer/warm winter and hot summer/cold winter climates and clear glass for cold climates gave higher energy savings. Ahn, et al., [9] proposed a window retrofit strategy for residential houses based on the insulation level and WWR. The authors concluded that: (i) for houses with a small WWR, the air-conditioning energy demand decreases with increases of the envelope insulation, (ii) for a WWR between 50% and 70%, the solar gains increase, and therefore the total demand increases due to higher cooling demand, (iii) in poorly insulated houses, a reduction in window thermal transmittance (U-value) leads to a decrease in the total energy demand; however, when the house is well insulated, the effect of window U-value on the energy consumed is lessened, (iv) and in well-isolated houses with more oversized windows, the decreases in the solar heat gain coefficient (SHGC) lead to decreases in the total energy consumption due a reduction of solar gains. Mainini, et al., [10] evaluated different retrofitting strategies in office buildings with transparent envelopes in Italy; generally, such structures have high solar gains and internal loads. They found that applying a solar film on a double clear glass reduces energy consumption and improves thermal comfort, especially during the cooling season in hot climates. Double-pane Low-E and solar control windows are the best options for mixed cold and hot climates.

1.3. Roofing

Retrofitting strategies cover roofs as vital envelope elements since significant solar gains and heat transmission can occur through them. Therefore, roof characteristics such as slope angle, materials type, and thickness impact the building energy balance. In order to minimize HVAC power consumption, climate conditions play a fundamental role in the roof design/retrofit. In general, high-reflectance roof reduces the energy consumed in office buildings, except for cold weather. For low-reflectance roofs, thermal insulation highly affects the energy building performance [11]. For houses in hot climates, applying cool roof paint leads to energy savings compared with thermal insulation; besides, the environmental impact is lower with cool paint [12]. Chen, et al., [13] performed an uncertainty analysis to evaluate the efficacy of the roof insulation levels of a Building in Shanghai; in their analysis, they considered the urban heat island effect, building material, occupation, and operation. The authors found that the insulation levels have little impact on the cooling demand. Besides, increases in the insulation thickness led to decreases in HVAC total load; however, this effect decreases as the thickness increases, and adding excessive insulation is counterproductive.

1.4. Shading

Solar shading devices are another set of retrofit strategies that adequately control solar gains as a primary goal. An efficient solar shading device should reduce solar gains during summer, while, in winter, it should allow solar gains so that both cooling and heating demands diminish. Depending on their position concerning the windows, shading devices can be classified as internal, external, and intermediate; moreover, they can be fixed or movable. External shading devices are more practical for preventing solar gains since they block solar radiation before reaching windows avoiding radiation absorption. Movable shading devices are more effective than fixed ones since they adjust according to external conditions. However, fixed shading device design may consider the solar incident angles in summer and winter to avoid solar gains in summer, whereas solar gains are maximized in winter [14]. A study performed in a residential building in Ningbo, China, evaluated the implementation of movable solar shades considering thermal comfort, visual comfort, and energy savings [15]. The solar shade devices were controlled by occupants and made of PVC and polyester fiber; with such intervention, energy demand reached a reduction of 30.87%, including thermal and visual comfort improvements. Another study compared external solar shading devices in Mediterranean climates analytically and experimentally [16]; factors such as thermo-physical behavior, energy savings, natural lighting, thermal comfort, and environmental impact were considered and evaluated during the end of the summer and winter. The solar energy penetration strongly influenced the performances. Ventilated double-glazed windows enable light transmission; besides, due to a greenhouse effect, the internal glass presents overheating. Horizontal louvers diffuse the direct radiation reducing the internal glass temperature peaks. Aluminum-perforated screens absorb a significant fraction of the incident radiation, avoiding heating the internal glass. Concerning materials, louvered systems made of wood prevail over aluminum ones; since wood has a higher thermal capacity and insulation properties, the maximum temperature during the day decreases, whereas the minimum temperature during the night increases, which is a desirable behavior. Bellia, et al., [17] performed a simulation study of the influence of solar shading devices on the energy requirements of an office building in three Italian climates. The study found that: (i) the use of solar shading devices leads to higher energy savings in warm summer climates, (ii) the optimal overhang depends on the height of the windows, (iii) the effect of shading is negligible for uninsulated buildings in cold winter climates, (iv) the reduction on energy consumption related to solar shadings are higher in highly glazed buildings and (v) the thermal behavior depends on the orientation of the building.

1.5. Retrofit Interventions

The optimal design of retrofit interventions must consider earlier thermal assessments of comfortable thermal conditions and energy consumption. Detailed knowledge of the mechanisms involved in heat gains and losses, and energy consumption patterns, enables more targeted and efficient implementation of retrofit strategies. In households, the heating and cooling electricity consumption is affected by occupancy patterns, the socioeconomic level, and the age of the inhabitants, indicating that the socio-demographic and human aspects can be crucial in energy efficiency policies [18]. Indoor air temperature, heat flux measurements, and thermal-imaging surveys are valuable tools to determine the factors affecting thermal comfort inside buildings [19]. Several reports related to retrofitting interventions on existing or designed buildings include the simultaneous application of several strategies. The studies are conducted by simulations or by measurement of parameters such as indoor temperature and energy consumption. In general, the main aim is the reduction of total energy consumption without affecting thermal comfort. Below, we briefly describe some of these reports with their more relevant results. Sharma, et al., [20] evaluated the impact of three different retrofitting interventions on the reduction of energy consumption; the studied building is in the Motilal Nehru National Institute of Technology (MNNIT), Allahabad. A simulation model was validated experimentally and used to predict the energy demands under the different retrofitting interventions. The authors classified the interventions as minor, moderate, and major, including measures such as insulation of the external opaque envelope, improvements of windows insulation, reduction of intrusion rate, and ventilated walls. The reduction in energy consumption was 16.7%, 19.87%, and 24.12% for the minor, moderate, and major interventions. It was estimated that a payback period of 10.6 years for the investment of the major intervention.
Hamdaoui, et al., [21] evaluated the thermal performances of different buildings with intermittent occupancy patterns by simulations. The authors considered three construction scenarios and six Moroccan cities in different climatic zones employing TRNSYS software. The research shows that the appropriate interventions can achieve energy savings between 20% and 56%. The authors recommended natural ventilation to reduce cooling demands and highly glazed buildings for the zones with high heating demand. Windows protection could allow an appreciable decrease in air-conditioning demand, especially in buildings with high WWR. Energy savings are reachable since the reductions in cooling demands are higher than the increases in heating demands. However, windows protection increased heating demand due to reduced solar gains.
The effects of façade properties on the energy efficiency of office buildings in Tokyo, Japan, were evaluated by WUFI Plus simulations [22]. The authors found that to reduce total energy consumption for heating and cooling, the SHGC and window U-value should be low, whereas the opaque parts’ solar reflectance should be high. The most effective way to reduce energy consumption is by lowering the SHGC value of the windows. Goia, et al., [23] carried out a study to optimize the façade configuration of an office building in a temperate oceanic climate. Apart from the heating and cooling demands, the researchers considered the artificial lightning demand in calculating total energy demand. The authors concluded that the optimal WWR must be between 35% and45% regardless of the orientation. The north-exposed façade is the most affected if an inadequate WWR.
The headquarters of the ERGO insurance company (Milan, Italy) required an energy retrofit methodology [24]. The building dates from 1998, and it has poor characteristics in terms of thermal insulation and energy efficiency; therefore, there was a need to lower the HVAC demands. The retrofit interventions included: (i) all windows replacement with “extra clear” double-glazing panels filled with Argon, (ii) insulation of vertical opaque walls with rock wool, (iii) a polystyrene layer on the spandrels, (iv) roof insulation with glass wool, (v) shading system mechanically controlled by a system control; optimized blinds inclination according to the solar geometry and weather conditions and (vi) dynamic double skin facades that allow, according to their configuration, the refreshing of the façade in summer and the maximizing of solar gains during winter. With the implemented retrofit project, the authors found a reduction of 40% in primary energy consumption.
The challenges associated with greenhouse emissions, the energy crisis, and fossil fuels depletion have led governments to implement strategies to reduce energy consumption. Due to their enormous energy consumption, buildings have been the focus of energy policies. Under this context, several certification systems exist worldwide to evaluate buildings’ environmental and sustainability performances. Governments encourage building owners to implement retrofit strategies to achieve “green” or “sustainable” certification requirements. Once the implementation of retrofit strategies, a certification system must reduce energy consumption; detailed knowledge about energy savings is also necessary to develop more efficient energy policies and perform a cost-benefit analysis. In the United States, there are two voluntary green building certification systems: (1) Energy Star and (2) Leadership in Energy and Environmental Design (LEED). A study performed in Phoenix evaluated the impact of the Energy Star certification on building occupants’ energy consumption; for that purpose, the control group used three criteria: location, industry code, and pre-certification energy consumption. The researchers found that the certificated buildings consume 8% less energy, lower than the 10–35% of energy savings estimated by the environmental protection agency [25].
Regarding the LEED certification, the authors did not find significant differences in energy consumption between certified and non-certified buildings [26]. However, other research found that the energy consumption of LEED Gold buildings decreases. However, LEED buildings categorized as certified, and “silver” consume more energy than non-certificated buildings [27]. In Switzerland, a study found that “green”-certified buildings consume around 25% less energy [28]. From our perspective, few studies quantified the thermal behavior and energy savings associated with retrofitting “green”-certified buildings. One of the motivations of the present study is to assess the pertinence of the Chilean certification system. Only one building was analyzed, so this research does not intend to determine general trends; however, a precedent is presented for subsequent studies to evaluate the certification system. The following systematic literature review supports the contribution of the present work in building retrofitting.

1.6. Systematic Literature Review

The open-source software VOSviewer [29] allowed us to perform a systematic literature review using the Scopus database, based on Title-Abstract-Keywords fields (Figure 1), throughout the entire timespan, until 7 March 2023. The systematic review required two queries. Query 1 (Building AND Retrofitting AND Thermal AND Performance) focuses more on technical aspects, and Query 2 adds certification aspects (Building AND Retrofitting AND Thermal AND Performance AND Certification). Query 1 (985 documents) and Query 2 (12 documents) were limited to keywords with a minimum occurrence of 10 and 2, respectively. Therefore, Query 2 represents only 1.2% of the documents in Query 2.
Regarding Query 1, retrofitting, thermal insulation, energy performance, and computer software have the most occurrences, and the distance among them presents a closer relationship between these keywords. On the contrary, keywords of interest, such as energy audit, are practically unrelated to the main keywords. Query 2 reinforces that energy, retrofitting, and thermal insulation are the most common keywords. Moreover, the covered subjects in the present work, such as certification and energy policy, are loosely related to the main keywords. In recent years, topics such as energy performance, air renovation, life cycle, and heat storage have received more attention. The main contribution of this work lies in the assessment of the Chilean Sustainable Building Certification in the context of the energy retrofitting of an existing building located in Santiago, Chile. Moreover, the results help develop a more efficient certification system.
This paper presents the simulation results of the impacts of implementing different retrofit strategies on the total annual energy demand for air-conditioning of an existing office building. On-site inspections allowed us to obtain the data used to generate the model, generating one closer to the actual use conditions than the design stage model. The strategies were evaluated both individually and in different combinations among them. Considering adequate indoor thermal comfort conditions, the building energy balance estimated the heating and cooling demands. The presented results may be a guideline for retrofitting buildings with similar characteristics in similar climates.

2. Materials and Methods

2.1. Climate Conditions

The analyzed building is in Santiago, Chile (33°25′ S y 70°35′ W). According to Koppen’s classification, this city has a Csb climate, which corresponds to a Mediterranean climate with warm summers. On the other hand, according to the ASHRAE 90.1-2019 standard [30], Santiago of Chile presents a 3C climate type, corresponding to subtropical with dry summers. The EnergyPlus webpage provided the climatological data (CHL_Santiago.855740_IWEC.epw), representing the local conditions at the Arturo Merino Benitez airport.

2.2. Characteristics of the Analyzed Office Building

The University of Santiago of Chile headquarters is the selected building in this research (Figure 2). It is a 5-floor office building built in the 1960s and repaired in 1986 due o the damage caused by an earthquake. A representative model of the building was developed based on different sources. On-site building inspections provided information regarding the effective occupancy, installed lighting, equipment, and operation schedules. Besides, consultation of building plans and technical specifications allowed determining the constructive elements’ dimensions and characteristics.
There are no surrounding buildings to the headquarters. The glazed surfaces mainly face the north and south façade. The floors from −1 to 3 have a hallway separating the offices on the north and south side. The −2 floor has two non-connected parts; the east part is used as a cellar, whereas the west is for offices. Table 1 lists the configuration and materials of the envelope elements and their respective thermal transmittances. Table 2 shows the windows’ properties.
Windows cover 54% of the vertical building envelope. The north and south façades have 59% and 61.6% glazed surfaces, the most glazed sides of the building. On the other hand, the east façade has 20% of the windows, and the west façade is opaque. The building is mainly an office building with a meeting room and an auditorium. Table 3 shows the corresponding area to each space category and includes information regarding used air conditioning.
The building visits made it possible to gauge the amount of occupancy in each zone. Zones like the auditorium and the meeting room have sporadic use and fewer operating hours than the offices; therefore, the usage schedule allows for determining the effective number of occupants. Table 3 shows the effective number of occupants in each building zone, the occupancy density, and the heat gains per person according to their activity [31].
The work schedule of the offices is Monday through to Thursday, from 9 a.m. to 6 p.m., and Friday, from 9 a.m. to 5 p.m. The building operates throughout the entire year except during summer vacations in February. Regarding the lighting, the building inside has fluorescent lamps. Except for in February, during the workday, the lighting was believed to be on completely. Besides, we have considered reported operation schedules to estimate the average lighting power density in the zones with sporadic use. Table 3 shows the building’s average lighting and equipment power density for each zone type. Printers and computers in the offices are available all year except for in February. The building does not have a mechanical ventilation system, so windows are opened according to the requirements of the occupants.

2.3. Interventions according to the “Sustainable Building Certification” Guidelines

CES (Certificacion Edificio Sustentable) stands for Sustainable Building Certification in Spanish. CES is a Chilean national building sustainability certification program for public-use buildings, and for government- or privately-owned buildings [32]. The program has been designed jointly by the government, private sector, and academic sector for buildings below 5000 m2, but this does not preclude its use in larger buildings. The certification aims to define an objective framework for the building performance evaluation. Unlike the framework with the building owner and design team, in this objective framework, a third party evaluates the building’s performance. The certification process considers compulsive minimum requirements and a variable number of voluntary requirements. A maximum of 100 voluntary points can be reached, with a building requiring at least 30 points to reach certification.
The certification focuses on the building’s need to generate a certain level of indoor environmental comfortable conditions for its occupants. Passive characteristics of the building are analyzed, followed by the required complement by the active systems to reach the comfort level required. The focus is reducing the building’s energy and water consumption, gas emissions, and waste generation to the required indoor environmental comfort conditions. CES allows evaluation of the energy demand savings due to the building’s passive elements and the energy use savings due to the building’s active systems. For the certification evaluation, the percentual energy savings reached by the proposed building compared to the baseline case allows for reaching different points thresholds, which increase as the energy savings increase. In this case, to evaluate the energy use of the baseline case and its associated cost, it has been defined using the requirements for evaluating energy demand and consumption savings. The energy consumption of the baseline case allows for comparison with the constructed building and the proposed energy savings measures.
This work considered retrofit interventions based on the CES guidelines. This set of interventions aims to represent the features of a building built in Chile that do not have implemented intensive energy-saving measures in both the envelope and the active systems (lighting and HVAC); therefore, the representation of a regular building in Chile. This guideline sets a maximum of 40% for the window-to-wall area ratio. The modification of the building occupancy followed the guidelines. The other parameters relative to the building use, such as schedules and performed activities, were maintained without modifications when simulating this set of retrofit strategies.
The guidelines for sustainable building certification also consider restrictions for the thermal transmittance of the envelope elements. The maximum allowed thermal transmittance follows the geographical zone of the building’s location. The building is in Chile’s denominated central interior zone; Table 4 shows the upper limits of the envelope’s thermal transmittance and includes the thermal transmittance’s current values.
The building’s geometric model was modified to satisfy the WWR requirement of the baseline case by reducing the window area to 825 m2. In addition to the maximum permitted thermal transmittance of the windows (see Table 4), the guidelines demand a shadow factor according to thermal transmittance; for windows with 3.6 W/m2K of thermal transmittance, the shadow factor must be 0.77. The guidelines for sustainable building also fix requirements for maximum lighting density power. Table 5 shows the lighting density power established in the guidelines and the current lighting density power in various locations inside the building.

2.4. Retrofit Interventions

A series of proposed retrofit interventions aim to reduce the energy consumption associated with heating and cooling. The interventions consider incorporating or modifying architectural elements and replacing lamps with more efficient ones, considering the building’s absence of an overall air-conditioning system.
The most direct intervention considered is the increase in ventilation rates during the cooling season. Increased ventilation rates would increase heat losses to the ambient temperature, thus reducing the cooling demand. The increase in ventilation rates was considered only for the cooling season in Chile, specifically for the months between November and March. The increased ventilation rate considered only the regularly occupied spaces (offices and meeting rooms). Table 6 shows the details of the increase in ventilation rates. Although the building does not incorporate mechanical ventilation systems, this case represents the scenario where the occupants maintain the windows open more than required for ventilation.
Due to the lack of thermal insulation, this analysis considered incorporating a layer of cellulose fiber insulation on the reinforced concrete roof. Table 7 shows the resultant thermal transmittance of the proposed and current arrangement.
This study has included a series of solar shading devices since the building does not have installed solar control systems. The evaluated devices are horizontal sun louvers for the north façade, vertical sun louvers for the south façade, and an eave at the third level of the north façade. Table 8 shows the characteristics of the sun louvers, whereas Table 9 presents the dimensions of the eave. The building is shown with and without solar shading devices in Figure 3 and Figure 4 for the north and south facades, respectively.
Low-E windows (Table 10) with PVC frames consist of double hermetic glass, colorless, and Low-E glass, and replace the existing windows. Finally, led lamps with lower lighting density power replace the current fluorescent lamps installed in the building. Table 11 lists the resultants’ lighting density due to the replacement of the lamps.

2.5. Thermal Simulations

A series of simulations with EnergyPlus aimed to quantify the impact of the retrofit interventions on the buildings’ air conditioning loads. We used the heating and cooling setpoint temperatures observed during the visits to the building to perform the simulations. The cooling setpoint temperature observed corresponded to 24 °C, while the heating temperature setpoint was 21 °C. The annual cooling and heating demand calculation assumed an ideal air conditioning system, i.e., with an efficiency of 1.

2.6. Energy Cost Analysis

We have also evaluated the retrofit interventions in terms of electricity cost savings. For that purpose, the EnergyPlus models consider and include the available cost structure of electricity. The cost of electricity consumption of the building must be calculated by simulation since the electricity tariff applied in Chile depends on both consumption and power. According to this, the total cost of energy consumption is not proportional to the accumulated energy consumption. The whole building’s electricity consumption involved the lighting and equipment consumptions, besides the heating and cooling loads. For the CES-complying model, the heating power consumption calculation assumed a resistance heating system, whereas an air-cooled chiller was employed to calculate the cooling power consumption. According to the on-site visits, each room for the as-built models has a direct expansion unitary system.
The electricity distribution company defines the tariff structure and costs that depend on the location and building characteristics. Table 12 shows the cost components of electricity for the analyzed building. The peak period cost corresponds to winter days between 18:00 and 22:00 hrs.
In the case of the analyzed building, no energy use records are available from the university or the utility company since the university has a contract with the utility company that charges electricity costs for the whole campus, not per individual building. This way, neither the energy use nor the energy costs obtained from the model can be directly calibrated with information from the existing building.

2.7. Total Electricity Consumption

The estimation of the total electricity consumption considered implementing direct expansion air conditioning systems, including the lighting and equipment in this estimation. The total annual electricity consumption and the total building area ratio are fundamental to evaluating the energy performance and comparing it with similar buildings.
Figure 5 represents a graphical abstract of the implemented methodology, which includes an in-situ survey that allowed for obtaining information about occupation, work schedules, envelope materials, lighting, and equipment, which was vital to develop an energy model of the building. Afterward, several retrofit strategies focusing on modifying architectural elements were assessed. Finally, these strategies were compared based on their impact on the air-conditioning energy demand.

3. Results and Discussions

3.1. Heating and Cooling Loads

The thermal simulation of the building allows the estimation of the annual flows of energy associated with the heat gains and losses. The simulations assume that the indoor temperature in each zone ranges between 22 °C and 24 °C using an ideal air-conditioning system. Figure 6 shows the estimated heat gain and losses of the building through the envelope, the losses by infiltration, and the internal heat gains. The thermal behavior of the building is mainly determined by the heat and gain losses through the envelope and infiltrations. The influence of the internal gains due to equipment, occupancy, and lighting is of lesser significance. The primary heat gains are due to solar gains, and the higher losses are associated with thermal conduction through windows. On the other hand, the losses through the roof and ground are significantly less than those through walls due to the walls’ low insulation and the wall surface.
Figure 7 shows the annual energy demands for heating and cooling to maintain the temperature in the comfort range. The building presents higher cooling demands than heating demands, the former being 31% higher.
Figure 8 shows the energy balance for the two cases of increased natural ventilation during the cooling season. By increasing the ventilation rate during the cooling season, the energy balance of the building does not show significant changes.
Figure 9 compares the heating and cooling demands for the baseline and increased ventilation cases. Even though the increased ventilation is only implemented during the cooling season in Chile, an increase of 6.2% and 6.9% in heating demand can be observed for increased ventilation rates of 1.5 and 2 times, respectively. In the case of the cooling demand, it also increases by 0.9% and 2.2%, which is explained by the fact that during the cooling season, introducing hot air from the outdoors only increases the cooling load to the cooling system. In a climate with lower air temperatures or during the mid-season, it is possible that increasing the ventilation rates could provide cooling demand savings.
Further, we have performed other simulations to evaluate the impact of the retrofit interventions on the annual flows of energy; all the interventions described above were taken into account and evaluated individually and in combination among them. Figure 10 shows the simulation results for the current building and the building subjected to the different retrofit strategies. The replacement of windows leads to significant reductions in heat losses due to the low thermal transmittance of the Low-E windows. The replacement of lamps and the reduction of the lighting power density have little impact on the reduction of the internal gains due to the negligible effect of the lighting on the total heat gains. Regarding solar gains, both the substitution of the windows and the solar shading devices lead to decreases in solar gains; however, only using solar control systems leads to significant reductions.
Figure 11 shows the heating and cooling energy demands for the current building and the building subjected to the different retrofit interventions. In contrast, Figure 12 shows the total demands involving heating and cooling. The replacement of windows and lighting and adding roof insulation gave place to a decrease of 30% in heating demands and a 28.7% reduction for the case of only windows replacement. On the other hand, the cooling demands increase with window replacement since Low-E windows diminish the heat losses by conduction through windows. The reduction in internal gains associated with the decrease in the lighting power density leads to a decrease in the cooling demand and an increase in the heating demand. The intervention based on solar shading devices reduces the cooling demands by 36.8% but increases the heating demand by 52.8%.
As stated, each retrofit intervention considered the total energy consumption for air-conditioning, i.e., the sum of the heating and cooling demands. Figure 12 depicts the obtained results, showing that the total energy demand values are very similar, despite the significant impact of some interventions on individual heating or cooling demands. The explanation for the similar energy demand values lies in the effects that tend to be balanced. If an intervention increases the heating demand, this increase will decrease the cooling demand and vice versa. The strategy that involves lamp and windows substitution, roof insulation, and solar control is the one that allows a higher reduction in the total air-conditioning demand, achieving a 6.9% in energy savings. On the other hand, the intervention that only included the windows replaced led to an increase of 8.3% in energy consumption concerning the current building.
Besides energy demand, simulations allowed the assessment of the retrofit measures’ effect on the occupants’ comfort conditions. The energy demand models obtained the number of hours outside the ASHRAE 55 acceptability range. Then, the reduction in hours outside the ASHRAE acceptability range was calculated for each retrofit case compared to the building in its current condition.
The simulation result shows that the current building has 7337.5 h outside the ASHRAE 90% acceptability range for a yearly simulation. This number represents the sum of all hours outside the acceptability range for all regularly occupied spaces in the building. Figure 13 shows the percentage reduction of hours outside the ASHRAE acceptability range for the different retrofit cases. The cases of window replacement and window replacement with roof insulation increase the number of hours outside the acceptability range. However, the case considering window replacement and solar shading can significantly reduce the number of hours outside the acceptability range. The roof insulation, lighting replacement, and exterior solar shading reduce the hours outside the acceptability range. Although, the case of roof insulation has a barely noticeable effect. Nevertheless, despite the significant increase in discomfort hours for window replacement, window replacement, and roof insulation cases, with lighting replacement and solar shading, reducing the hours outside the acceptability range is still possible. These results are consistent with the energy demand simulations, showing that the case with the most significant increase in discomfort hours matches the case with the most considerable energy demand.
Figure 14 shows the annual energy flows considering the current and the retrofitted building based on the guidelines for sustainable building. The sustainable building intervention led to decreases in both losses through windows and gains by occupancy. Solar gains remain the most influential element in the thermal behavior of the building. Figure 15 shows the heating and cooling energy demands for the building with and without sustainable building intervention, showing a reduction of 12.3% in heating demand and an increase of 41.5% in cooling demand due to the differences in envelope properties.
Figure 16 illustrates the total air-conditioning energy demand by the building with and without the interventions for sustainable certification. The combined effect of saving on heating and increasing cooling produces an increase of 18.3% in the total energy demand. Therefore, the current building exhibits better thermal performance than the theoretical reference building, following the sustainable certification guidelines. Therefore, the current building presents high energy efficiency compared to the reference building, despite being built without following particular energy optimization standards. The fact that this office building has a cooling-dominated thermal behavior may influence the energy demand comparison. Excess insulation and lower glazing area in the baseline case are helpful to reduce heating demand slightly. However, they may difficult the rejection to the outdoors of internal loads during the nights in the summer. Considering that this is an office building with relatively high internal loads due to office equipment, this situation can be more pronounced than in other types of public buildings, such as schools, which might be the goal of the certification program.

3.2. Cost Analysis

Further, we have estimated the energy costs to quantify the impact of the different retrofit interventions. The annual energy cost of the current building obtained by simulation was CLP$14,996,340 (USD 18,329.21). Figure 17 shows the energy savings associated with the retrofit interventions taking the current building as a reference. The interventions based on solar control or the guidelines for sustainable building do not generate monetary savings but, on the contrary, increase the costs. The costs associated with solar control are due to increases in heating demand. The other retrofit interventions reduce the electricity cost between 0.9% and 15.6%, involving led lighting, windows replacement, and roof insulation, which maximizes the monetary savings. Since the lamp replacement permanently reduces electricity consumption annually, the interventions that include this action allow for achieving the highest monetary savings. When the interventions do not include the lighting density power decrease, the monetary savings are significantly minor, reaching a maximum saving of 3.1% with the windows replacement.
The baseline case of sustainable building guidelines significantly increases the electricity cost, which is relatively higher than the increase in electricity consumption because the electricity cost was determined considering consumption and the increase in power demand. We considered an electric resistance heating system to calculate the electricity cost. Since the direct expansion heating system has lower power demand than the electric resistance system, replacing the heating system decreased the electricity cost.

3.3. Total Electricity Consumption

The total electricity consumption is again considered a direct expansion system for air conditioning. We obtained reductions in electricity consumption of between 41% and 46% for the building with and without the proposed retrofit interventions. In order to evaluate more appropriately the thermal performance of the analyzed building, it is necessary to compare its electricity consumption with that of other buildings of similar use. In a further analysis, we have assumed energy consumption to be equal to heating and cooling demands and lighting and equipment consumption. Figure 18 shows the annual specific energy consumption of the building along with those obtained with the retrofit interventions. As expected, the building with the retrofit interventions based on the sustainable building certification presents higher energy consumption. The rest of the estimated annual specific energy consumptions were between 29.0 and 35.1 kWh/year·m2.

3.4. Discussion

Table 13 shows the annual specific energy consumption reported for buildings of similar use, i.e., administrative university buildings. The first report corresponds to buildings located at the campus ‘Sciences et Technologies’ of the University of Bordeaux in France. This campus is in a region of oceanic climate, and the research included research, teaching, and administrative buildings; the reported energy consumptions were between 26 and 74 kWh/year.m2. The second report is research performed at the University of Almeria, reporting energy consumption between 23.3 and 32.5 kWh/year·m2 for administrative buildings. Almeria has a subtropical desert/low latitude and a hot arid climate. The last report was a survey of electricity consumption by buildings of different categories performed by the Energy Information Administration of the United States Department of Energy; the reported average energy consumption for buildings for education was 96.8 kWh/year·m2.
Our simulated energy consumptions are within the reported values for the University of Bordeaux; however, this comparison cannot be taken as an appropriate assessment since the buildings are in different climate zones, i.e., Mediterranean and Oceanic. A fairer comparison corresponds to the University of Almeria; In Almeria, the minimum and maximum average temperatures are 9 and 30 °C, respectively, while in Santiago of Chile, these average temperatures are 3 and 30 °C. We can observe that the specific energy consumption values of administrative buildings in the University of Almeria are similar to our reported values. Considering these two comparisons, the present research findings are within the expected values. On the other hand, our values are far below the average energy consumption reported by the Energy Information Administration for educational buildings. Possible explanations for such a significant difference being that the analyzed building remains unoccupied for a complete month during the summer (February) and the differences in climate for a location in Santiago, Chile, and a survey across the US. Additionally, the comparison is based on simulated results. A comparison with a higher degree of certainty would require the measurement of energy consumption in the analyzed building. Additionally, a larger sample could increase the strength of the validation, which can involve several buildings located on the same campus with similar use characteristics. This measurement-gathering task has been considered part of this project’s future work.
Regarding the analysis comparing the actual building to the baseline generated using the Chilean sustainable certification guidelines, comparing a larger building dataset could also strengthen the conclusion of whether the baseline case defined is suitable for such a purpose.

4. Conclusions

We have performed a series of simulations to identify measures that reduce the energy demand for air-conditioning of an existing building, preferring the evaluation of passive measures focused on modifying the building envelope elements but also including a reduction in the lighting power density. Further, we have developed a model according to the certification requirements for sustainable building, corresponding to the energy efficiency certification standard used by the Chilean government for public-use buildings.
Regarding the proposed retrofit configurations, the main conclusions are:
  • The analysis of the building in its current condition shows that the gains and losses through the envelope have a higher relevance than the internal gains.
  • The building has higher cooling demand than heating demand, the former 31% higher than the latter; however, the heating demand is significant and represents 43% of the total demand. Therefore, both demands are vital to optimizing thermal performance.
  • From the analyzed interventions, only external solar shading devices significantly reduce solar gains and, thus, the cooling demands of the building.
  • The intervention with the higher energy savings corresponds to the strategy that involves solar control, windows replacement, reduction of the lighting power density, and roof insulation, with a reduction of 6.9% in total energy demand. Although the window replacement reduces the heating demand by 28.7%, the total demand increases to 8.9%, the intervention with the worst performance.
  • The cost analysis demonstrated that implementing solar shading devices increases electricity costs due to the significant increase in heating demands. The intervention that obtained the highest cost savings includes led lighting, roof insulation, and Low-E windows.
Regarding the analysis of the CES baseline case, the main conclusions are:
  • The CES baseline case has an air-conditioning energy demand 18% higher than the existing building. Therefore, the model based on the guidelines for sustainable building could not adequately represent a typical building built in Chile with a common energy efficiency standard. Consequently, a building could be wrongly categorized as energy efficient by having slightly better energy performance than the baseline case established in the sustainable building guidelines.
The limited information from the on-site visits stage and the lack of availability of energy use records for the building are the main constraints of this work.
Future research in this field should aim to:
  • Obtain on-site temperature measures and measurements of electric energy use for model calibration;
  • Evaluate the comfort conditions reported by the users using thermal satisfaction polls;
  • Extend the analysis to other buildings on the same campus, to establish reliable baseline for future building design;
  • Compile a larger-scale building database to generate a statistically representative baseline of the existing building stock to improve the accuracy of the energy-saving predictions obtained from the application of the Chilean energy efficiency standard.

Author Contributions

Conceptualization, T.P.V. and D.A.V.; methodology, T.P.V.; software, T.P.V. and B.A.E.; formal analysis, T.P.V.; investigation, B.A.E.; resources, D.A.V.; data curation, D.A.V. and F.A.C.; writing—original draft preparation, F.A.C.; writing—review and editing, T.P.V., D.A.V. and F.A.C.; visualization, T.P.V. and F.A.C.; supervision, D.A.V.; project administration, D.A.V.; funding acquisition, D.A.V. All authors have read and agreed to the published version of the manuscript.

Funding

ANID-Chile, grant number Fondecyt 1201520 funded this research.

Data Availability Statement

The data presented in this study are available on request from the corresponding author. The data are not publicly available due to privacy restrictions.

Acknowledgments

T. Venegas acknowledges the funding of Proyecto USA 1856_2_1_3, Universidad Santiago de Chile.

Conflicts of Interest

The authors declare no conflict of interest.

Nomenclature and Abbreviations

Nomenclature
hrs24-h clock
CLPChilean pesos
Abbreviations
A/CAir-Conditioning
ASHRAEAmerican Society of Heating, Refrigerating, and Air-conditioning Engineers
CESCertificación Edificio Sustentable (Sustainable Building Certification)
CsbWarm-summer Mediterranean climate
HVACHeating, Ventilation, and Air Conditioning
LEDLight-emitting diode
LEEDLeadership in Energy and Environmental Design
Low-ELow-emissivity
OSBOriented Strand Board
PVCPolyvinyl chloride
SHGCSolar heat gain coefficient
UThermal transmittance
WWRWindow-to-wall ratio

References

  1. Mastrucci, A.; van Ruijven, B.; Byers, E.; Poblete-Cazenave, M.; Pachauri, S. Global scenarios of residential heating and cooling energy demand and CO2 emissions. Clim. Change 2001, 168, 1–26. [Google Scholar] [CrossRef]
  2. González-Torres, M.; Pérez-Lombard, L.; Coronel, J.F.; Maestre, I.R.; Yan, D. A review on buildings energy information: Trends, end-uses, fuels and drivers. Energy Rep. 2022, 8, 626–637. [Google Scholar] [CrossRef]
  3. Cabeza, L.F.; Ürge-Vorsatz, D. The role of buildings in the energy transition in the context of climate change challenge. Glob. Transit. 2020, 2, 257–260. [Google Scholar] [CrossRef]
  4. Kaushik, A.; Arif, M.; Tumula, P.; Ebohon, O.J. Effect of thermal comfort on occupant productivity in office buildings: Response surface analysis. Build Environ. 2020, 180, 107021. [Google Scholar] [CrossRef]
  5. Booysen, M.J.; Samuels, J.A.; Grobbelaar, S.S. LED there be light: The impact of replacing lights at schools in South Africa. Energy Build. 2021, 235, 110736. [Google Scholar] [CrossRef]
  6. Ganandran, G.S.B.; Mahlia, T.M.; Ong, H.C.; Rismanchi, B.; Chong, W.T. Cost-Benefit Analysis and Emission Reduction of Energy Efficient Lighting at the Universiti Tenaga Nasional. Sci. World J. 2014, 2014, 745894. [Google Scholar] [CrossRef]
  7. Kerem, A. Assessing the electricity energy efficiency of university campus exterior lighting system and proposing energy-saving strategies for carbon emission reduction. Microsyst. Technol. 2022, 28, 2623–2640. [Google Scholar] [CrossRef]
  8. He, Q.; Ng, S.T.; Hossain, M.U.; Skitmore, M. Energy-Efficient Window Retrofit for High-Rise Residential Buildings in Different Climatic Zones of China. Sustainability 2019, 11, 6473. [Google Scholar] [CrossRef]
  9. Ahn, B.L.; Kim, J.H.; Jang, C.Y.; Leigh, S.B.; Jeong, H. Window retrofit strategy for energy saving in existing residences with different thermal characteristics and window sizes. Build. Serv. Eng. Res. Technol. 2016, 37, 18–32. [Google Scholar] [CrossRef]
  10. Mainini, A.G.; Bonato, D.; Poli, T.; Speroni, A. Lean strategies for window retrofit of Italian office buildings: Impact on energy use, thermal and visual comfort. Energy Procedia 2015, 70, 719–728. [Google Scholar] [CrossRef]
  11. Piselli, C.; Pisello, A.L.; Saffari, M.; de Gracia, A.; Cotana, F.; Cabeza, L.F. Cool Roof Impact on Building Energy Need: The Role of Thermal Insulation with Varying Climate Conditions. Energies 2019, 12, 3354. [Google Scholar] [CrossRef]
  12. Shittu, E.; Stojceska, V.; Gratton, P.; Kolokotroni, M. Environmental impact of cool roof Paint: Case study of house retrofit in two hot islands. Energy Build. 2020, 217, 110007. [Google Scholar] [CrossRef]
  13. Chen, J.; Peng, Z.; Yang, P.P. The Energy Performance Evaluation of Roof Retrofit Under Uncertainties for the Shanghai’s Worker Village. Energy Procedia 2019, 158, 3170–3176. [Google Scholar] [CrossRef]
  14. Kahoorzadeh, A.; Shahwarzi, S.; Farjami, E.; Osivand, S. Investigation of Usage of Passive Solar Energy in Salamis Road’s Buildings, Famagusta. Int. J. Environ. Sci. Dev. 2014, 5, 132–136. [Google Scholar] [CrossRef]
  15. Yao, J. An investigation into the impact of movable solar shades on energy, indoor thermal and visual comfort improvements. Build Environ. 2014, 71, 24–32. [Google Scholar] [CrossRef]
  16. Stazi, F.; Marinelli, S.; Di Perna, C.; Munafò, P. Comparison on solar shadings: Monitoring of the thermo-physical behaviour, assessment of the energy saving, thermal comfort, natural lighting and environmental impact. Sol. Energy 2014, 105, 512–528. [Google Scholar] [CrossRef]
  17. Bellia, L.; De Falco, F.; Minichiello, F. Effects of solar shading devices on energy requirements of standalone office buildings for Italian climates. Appl. Therm. Eng. 2013, 54, 190–201. [Google Scholar] [CrossRef]
  18. Ozarisoy, B.; Altan, H. Significance of occupancy patterns and habitual household adaptive behaviour on home energy performance of post-war social-housing estate in the South-eastern Mediterranean climate: Energy policy design. Energy 2022, 244, 122904. [Google Scholar] [CrossRef]
  19. Ozarisoy, B.; Altan, H. Bridging the energy performance gap of social housing stock in south-eastern Mediterranean Europe: Climate change and mitigation. Energy Build. 2022, 258, 111687. [Google Scholar] [CrossRef]
  20. Sharma, S.K.; Mohapatra, S.; Sharma, R.C.; Alturjman, S.; Altrjman, C.; Mostarda, L.; Stephan, T. Retrofitting Existing Buildings to Improve Energy Performance. Sustainability 2022, 14, 666. [Google Scholar] [CrossRef]
  21. Hamdaoui, S.; Mahdaoui, M.; Allouhi, A.; El Alaiji, R.; Kousksou, T.; El Bouardi, A. Energy demand and environmental impact of various construction scenarios of an office building in Morocco. J. Clean. Prod. 2018, 188, 113–124. [Google Scholar] [CrossRef]
  22. Ihara, T.; Gustavsen, A.; Jelle, B.P. Effect of facade components on energy efficiency in office buildings. Appl. Energy 2015, 158, 422–432. [Google Scholar] [CrossRef]
  23. Goia, F.; Haase, M.; Perino, M. Optimizing the configuration of a façade module for office buildings by means of integrated thermal and lighting simulations in a total energy perspective. Appl. Energy 2013, 108, 515–527. [Google Scholar] [CrossRef]
  24. Aste, N.; Del Pero, C. Energy retrofit of commercial buildings: Case study and applied methodology. Energy Effic. 2013, 6, 407–423. [Google Scholar] [CrossRef]
  25. Qiu, Y.; Kahn, M.E. Impact of voluntary green certification on building energy performance. Energy Econ. 2019, 80, 461–475. [Google Scholar] [CrossRef]
  26. Scofield, J.H. Do LEED-certified buildings save energy? Not really. Energy Build. 2009, 41, 1386–1390. [Google Scholar] [CrossRef]
  27. Scofield, J.H. Efficacy of LEED-certification in reducing energy consumption and greenhouse gas emission for large New York City office buildings. Energy Build. 2013, 67, 517–524. [Google Scholar] [CrossRef]
  28. Filippini, M.; Obrist, A. Are households living in green certified buildings consuming less energy? Evidence from Switzerland. Energy Policy 2022, 161, 112724. [Google Scholar] [CrossRef]
  29. VOSviewer. Homepage. Available online: https://vosviewer.com (accessed on 7 March 2023).
  30. 90.1-2019; Energy Standard for Buildings Except Low-Rise Residential Buildings. American Society of Heating, Refrigeration and Air-Conditioning: Atlanta, GA, USA, 2019.
  31. American Society of Heating, Refrigeration and Air-Conditioning. Handbook of Fundamentals; American Society of Heating, Refrigeration and Air-Conditioning: Atlanta, GA, USA, 2021. [Google Scholar]
  32. Certificación Edificio Sustentable, Manual 1: Evaluación y Calificación; Instituto de la Construcción: Santiago, Chile, 2014.
  33. Aguayo-Ulloa, E.; Valderrama-Ulloa, C.; Rouault, F. Analysis of energy data of existing buildings in a University Campus. Rev. Constr. 2018, 17, 172–182. [Google Scholar] [CrossRef]
  34. Chihib, M.; Salmerón-Manzano, E.; Manzano-Agugliaro, F. Benchmarking Energy Use at University of Almeria (Spain). Sustainability 2019, 12, 1336. [Google Scholar] [CrossRef]
  35. U.S Energy Information Administration. Electricity Consumption Totals and Conditional Intensities by Building Activity Subcategories. 2012. Available online: https://www.eia.gov/consumption/commercial/data/2012/c&e/pdf/pba4.pdf (accessed on 20 April 2023).
Figure 1. Global overview of the keywords used on buildings retrofitting (a) and certification of retrofitted buildings (b).
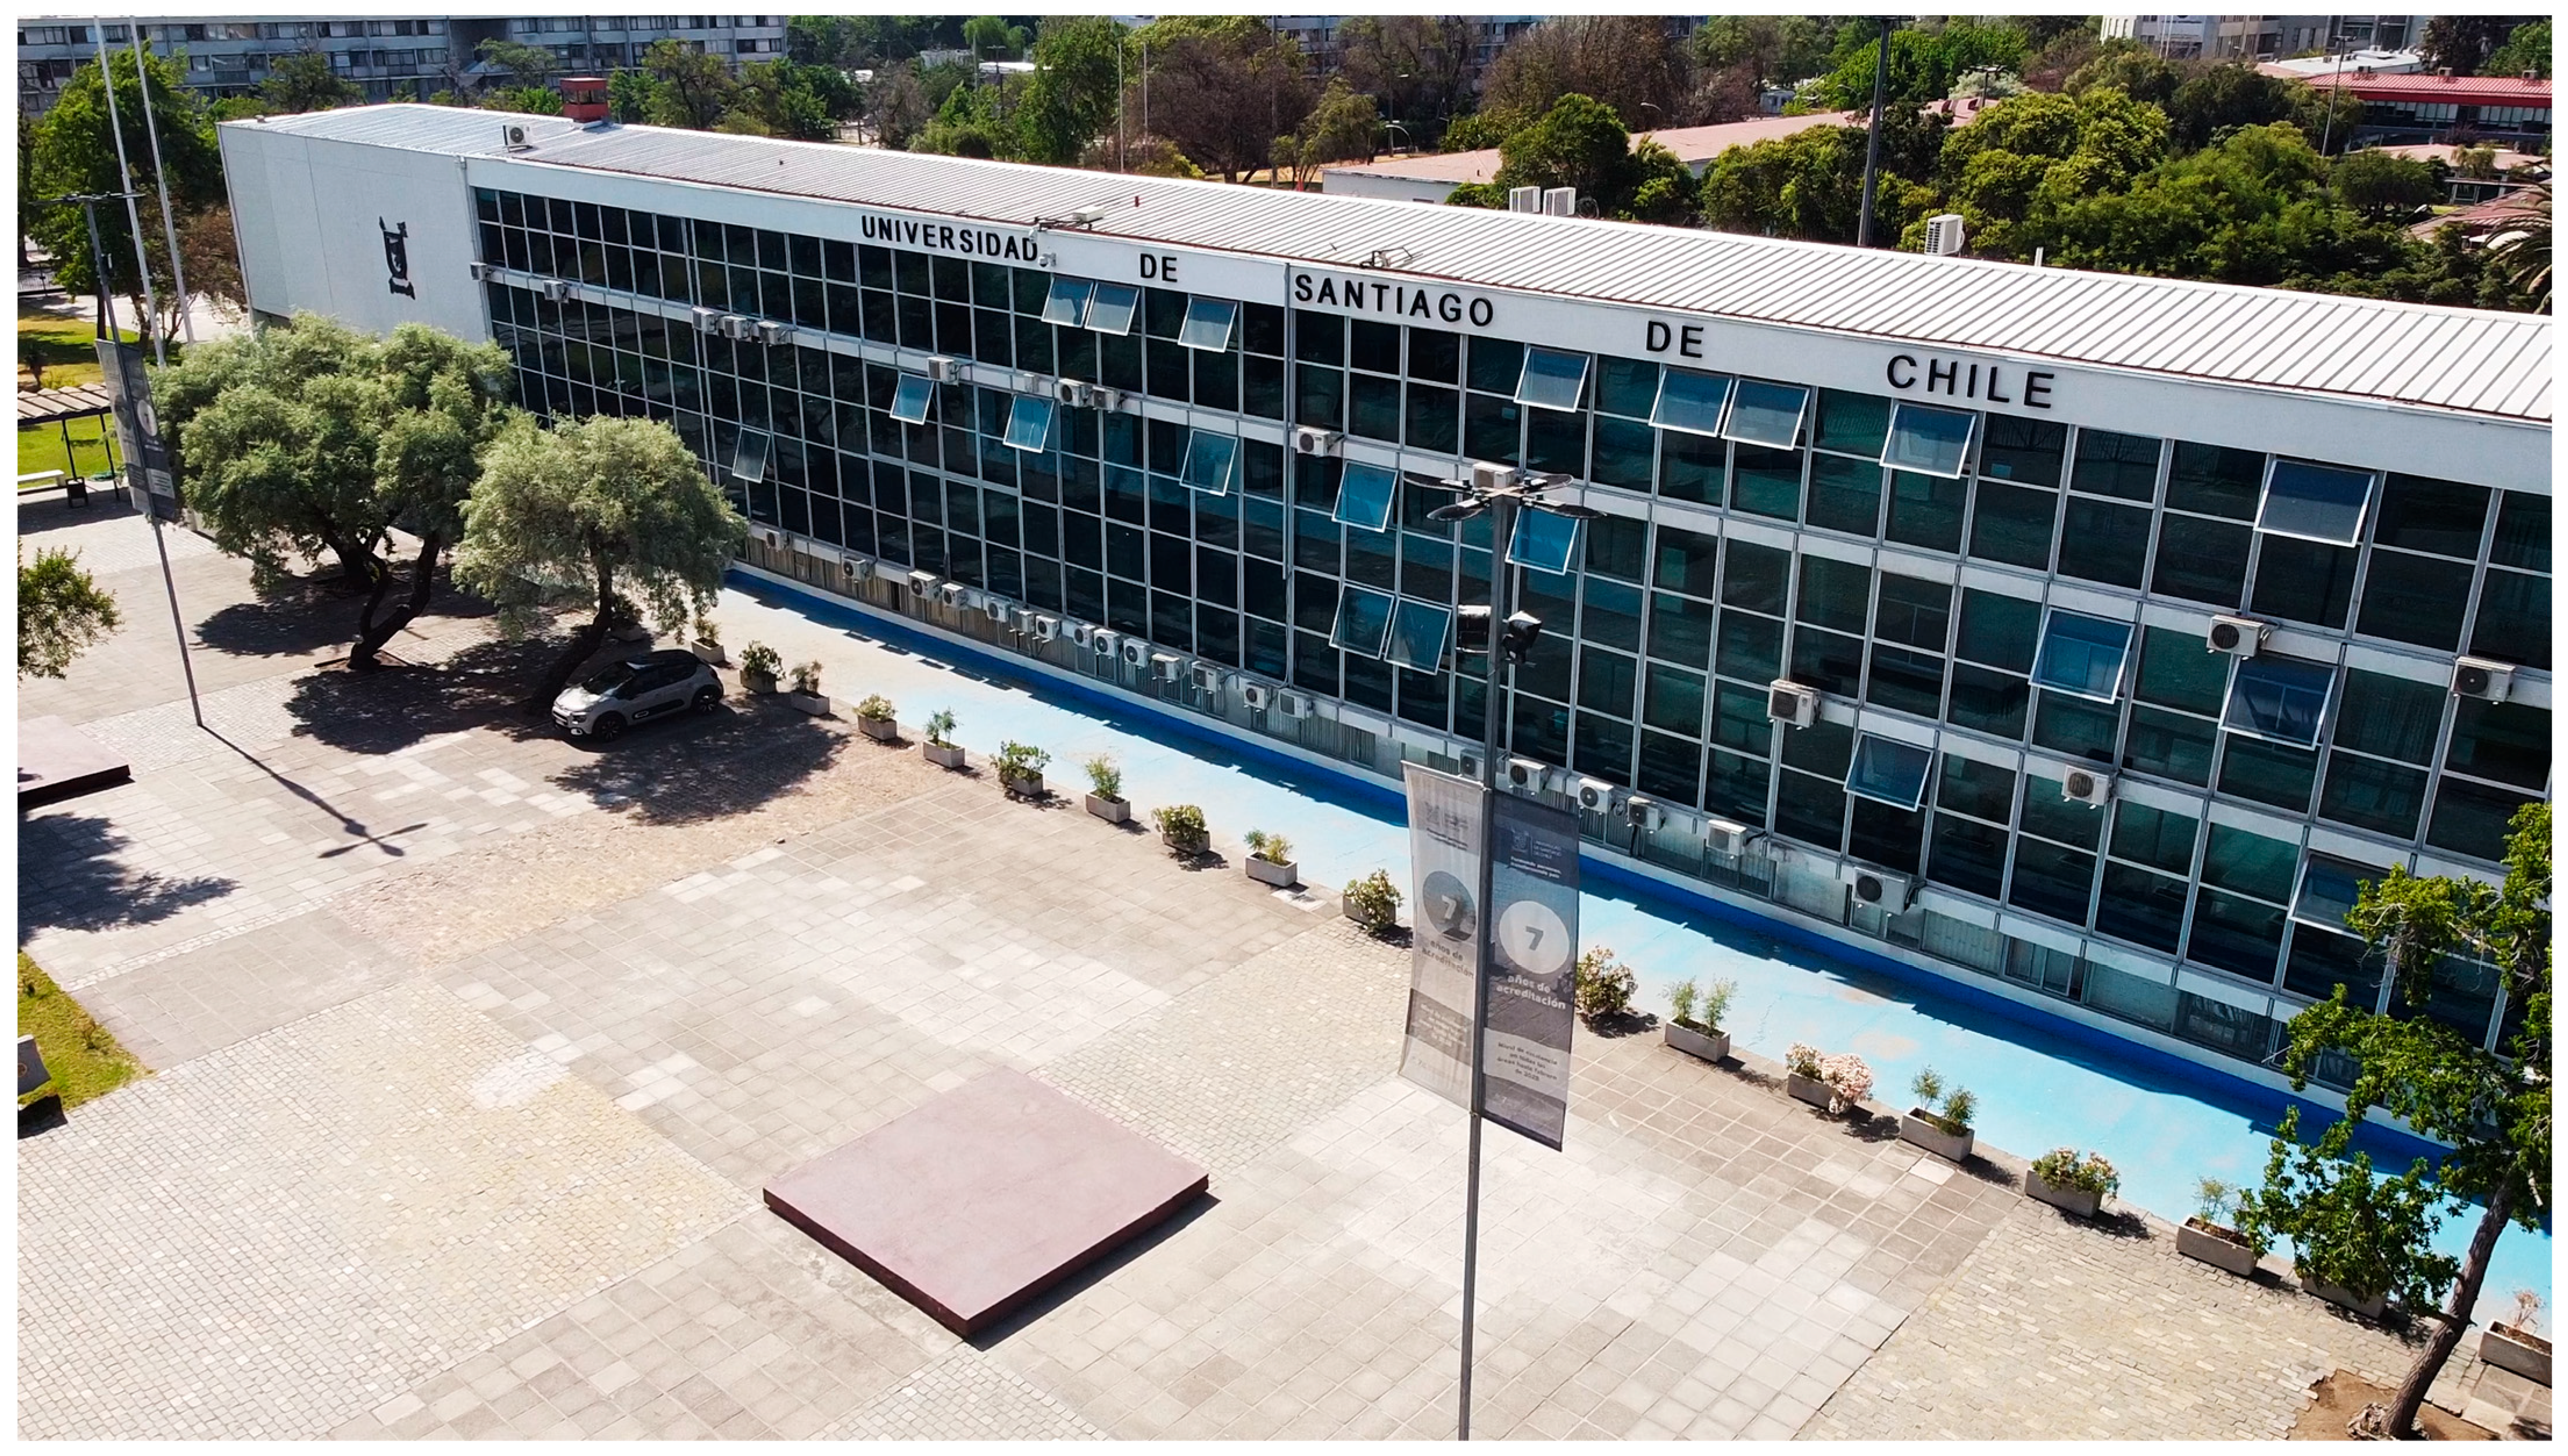
Infrastructures 08 00080 g001
Figure 2. University of Santiago of Chile Headquarters.
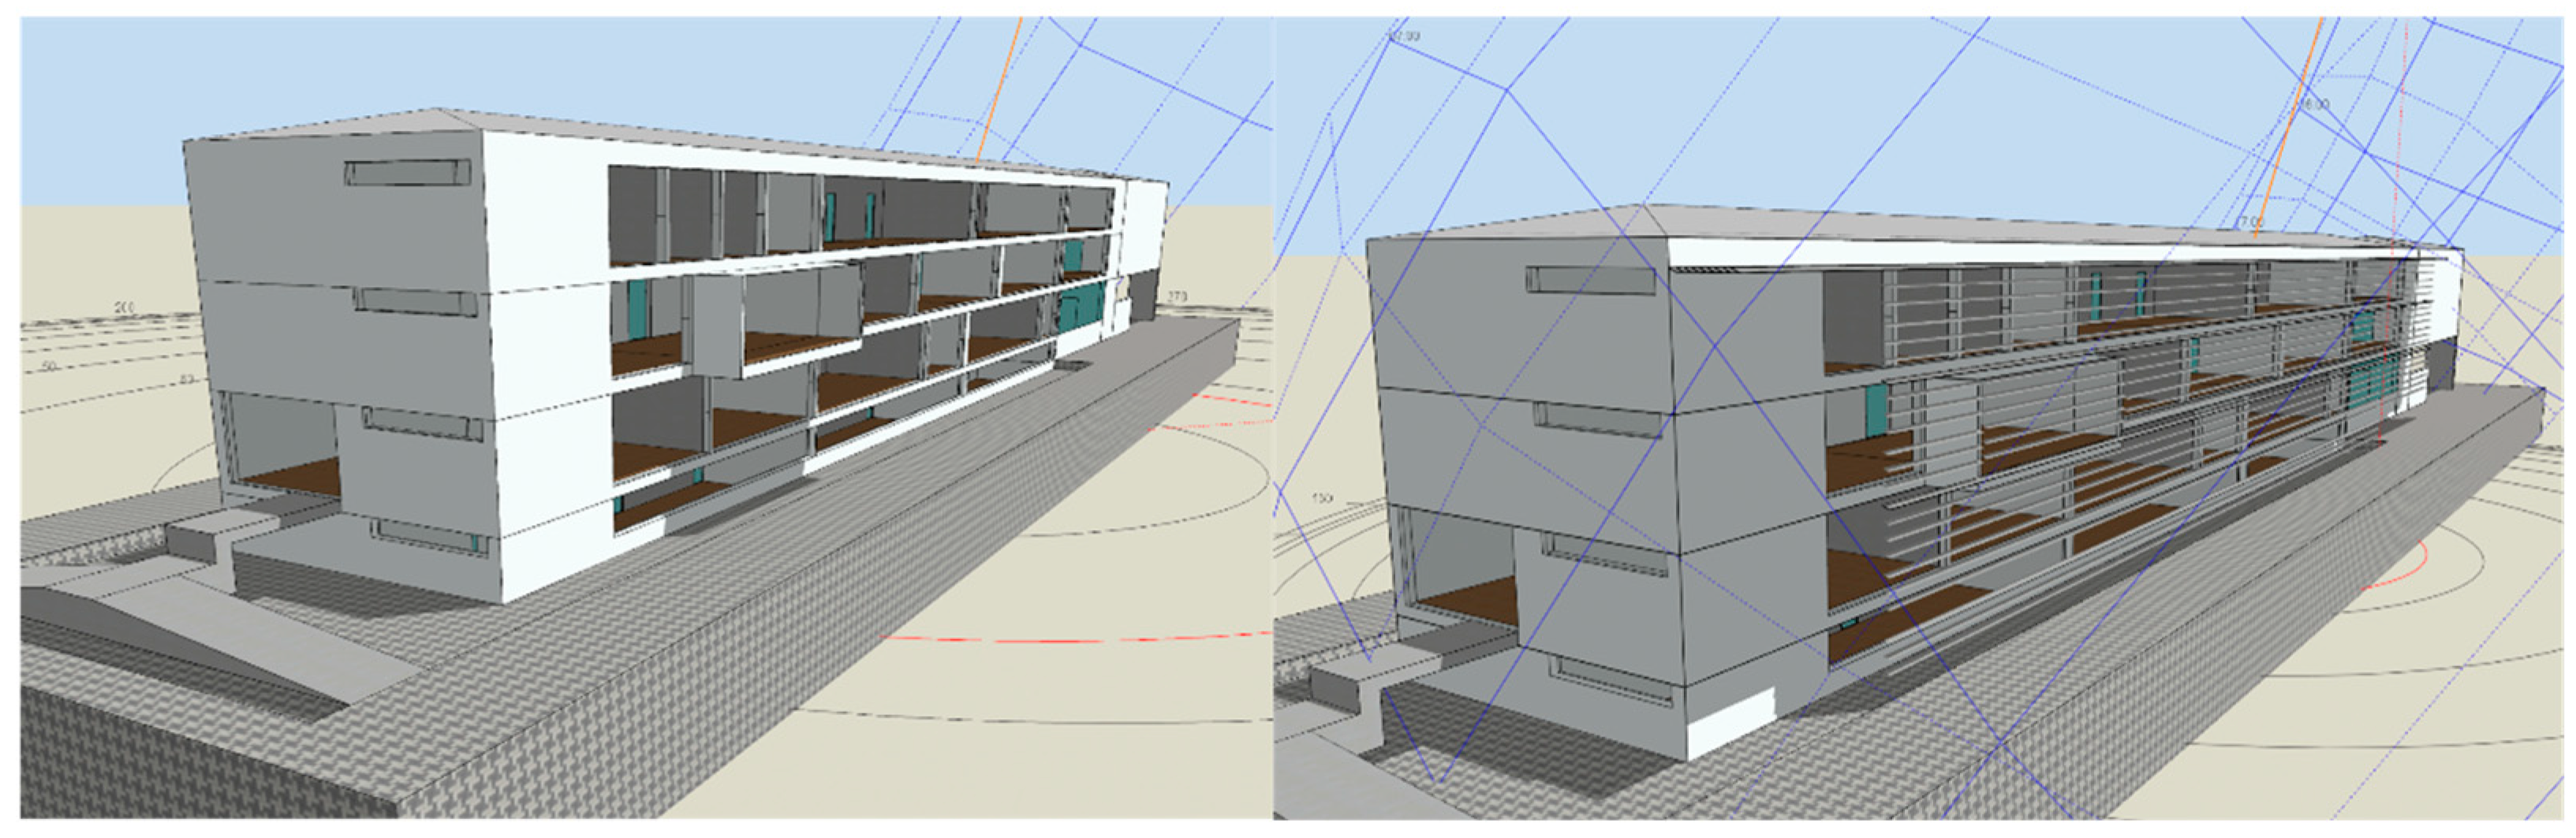
Infrastructures 08 00080 g002aInfrastructures 08 00080 g002b
Figure 3. Rendered view of the façade; with (right) and without (left) solar control for the summer design day (Time: 13:00 h).
Infrastructures 08 00080 g003
Figure 4. Rendered view of south façade; with (right) and without (left) solar control for the summer design day (Time: 16:30 h).
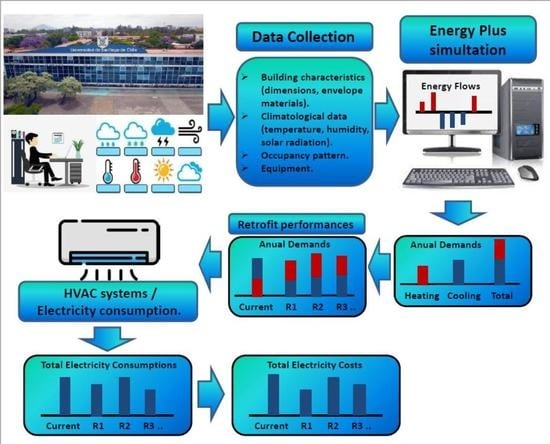
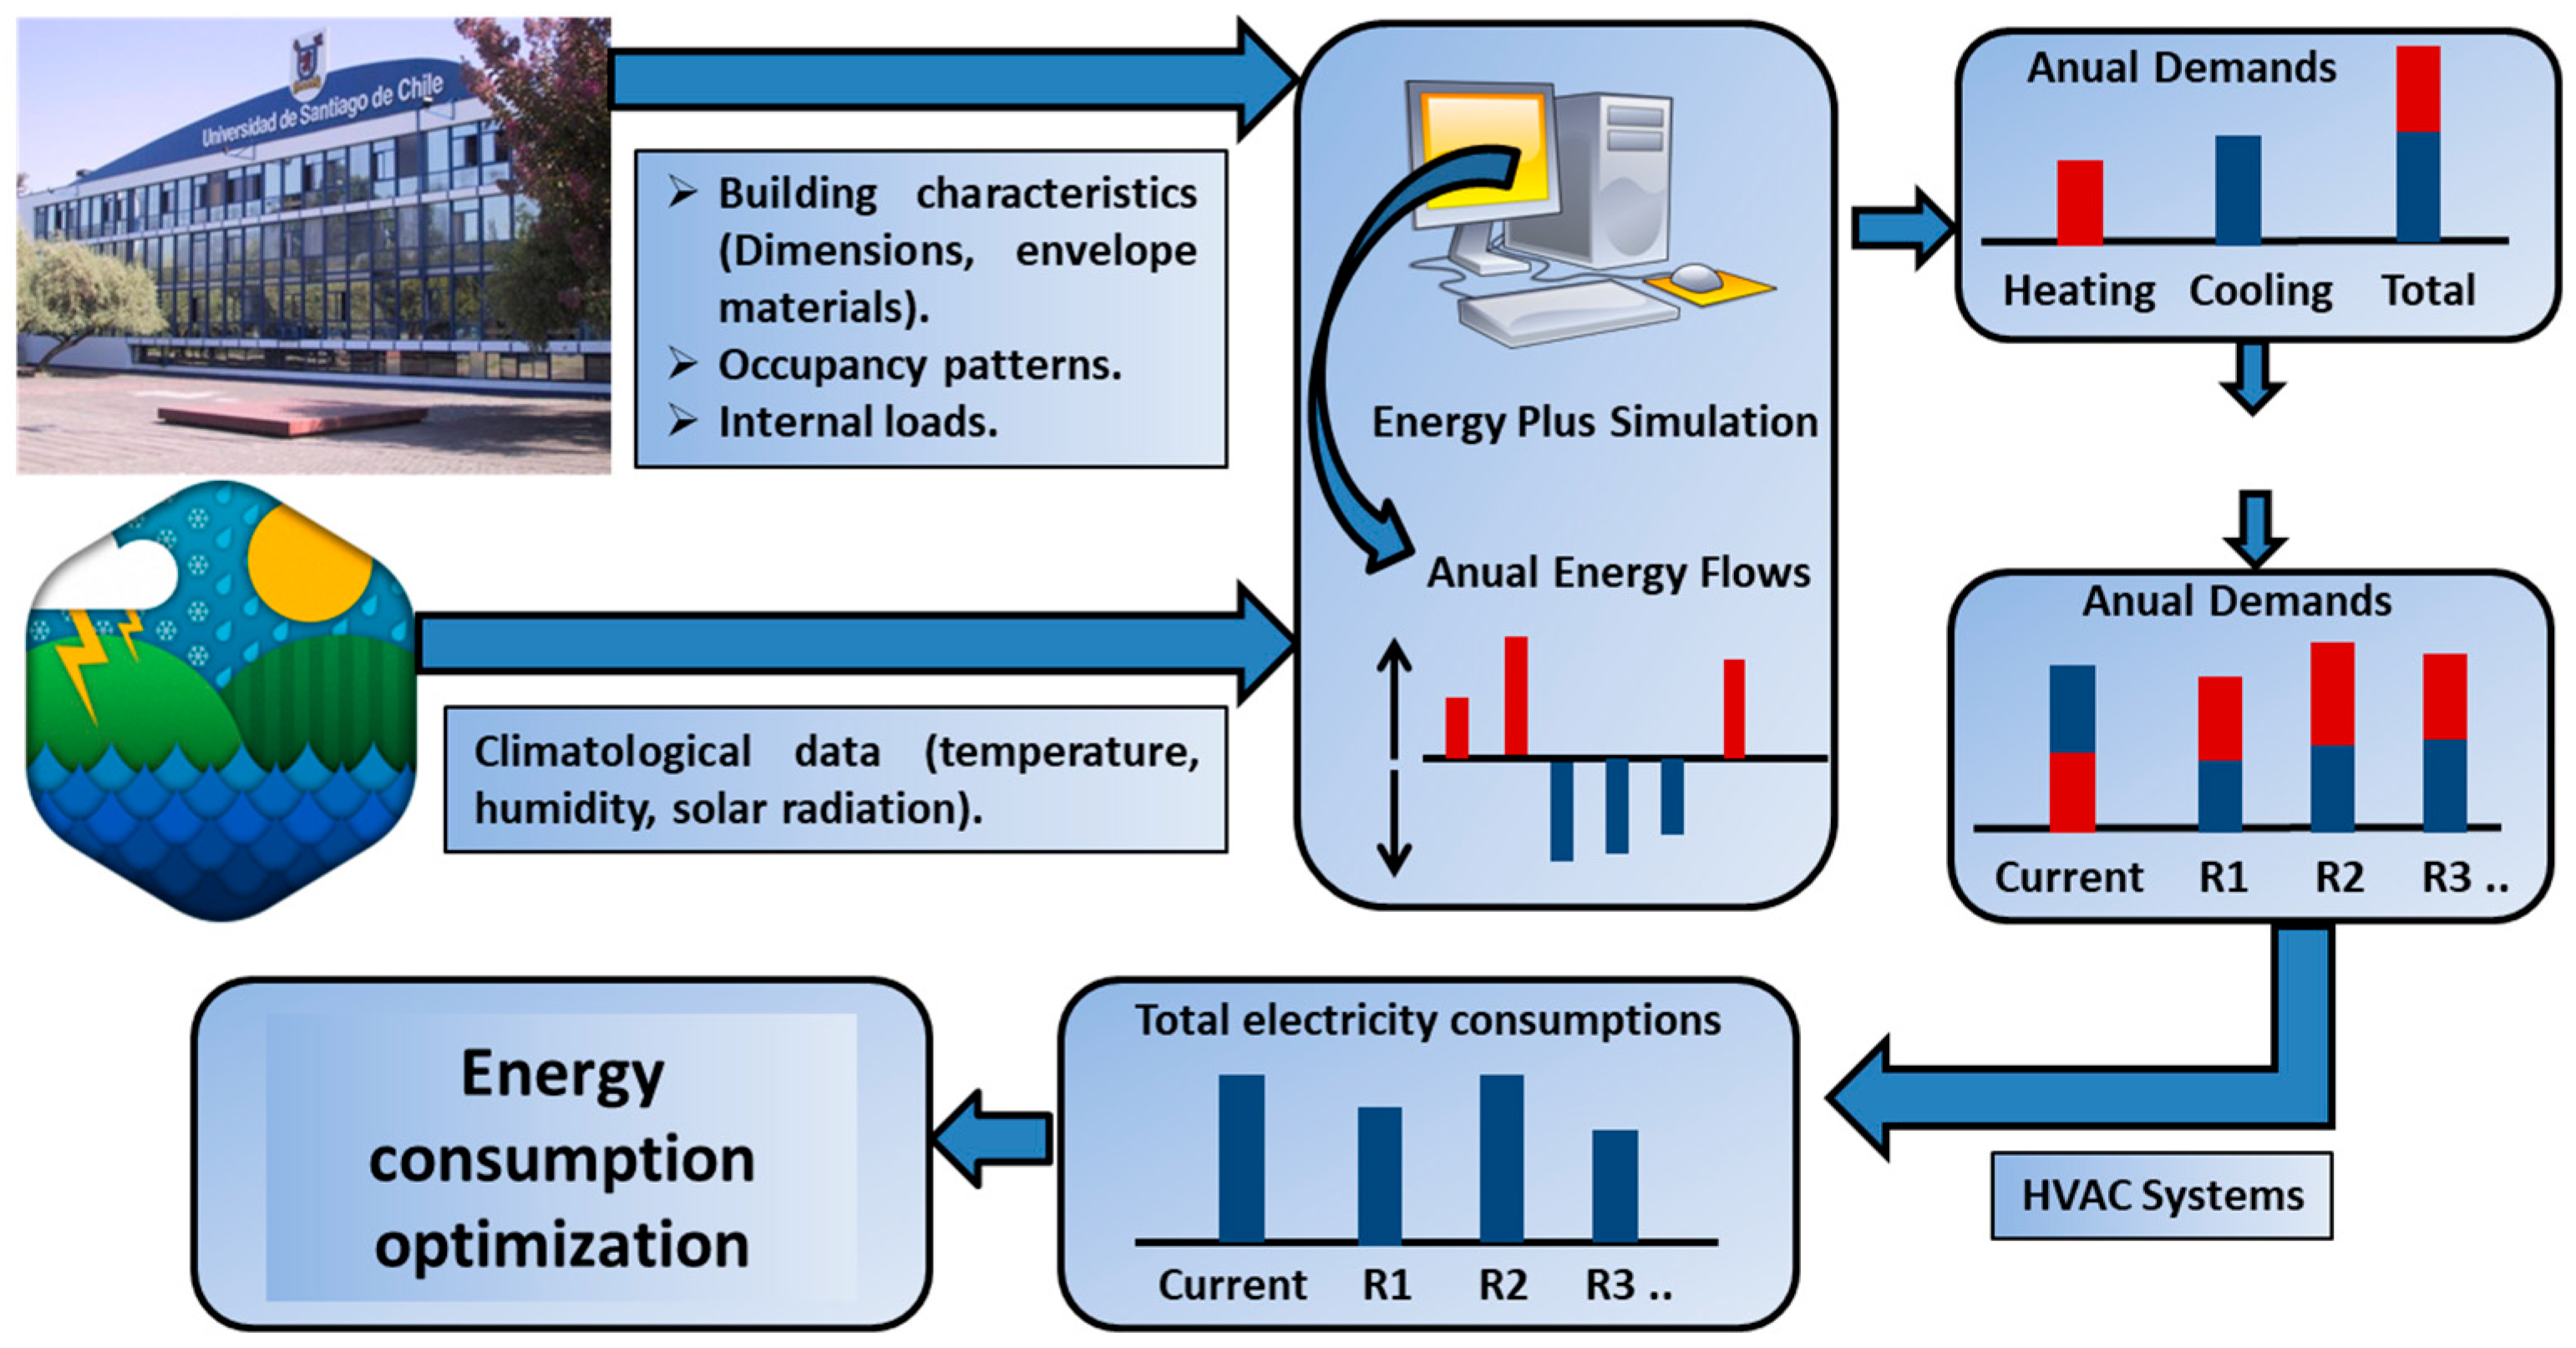
Infrastructures 08 00080 g004
Figure 5. Graphical description of the methodology.
Infrastructures 08 00080 g005
Figure 6. Estimated annual flows of energy for the current building.
Infrastructures 08 00080 g006
Figure 7. Annual energy demands for heating and cooling in the current building.
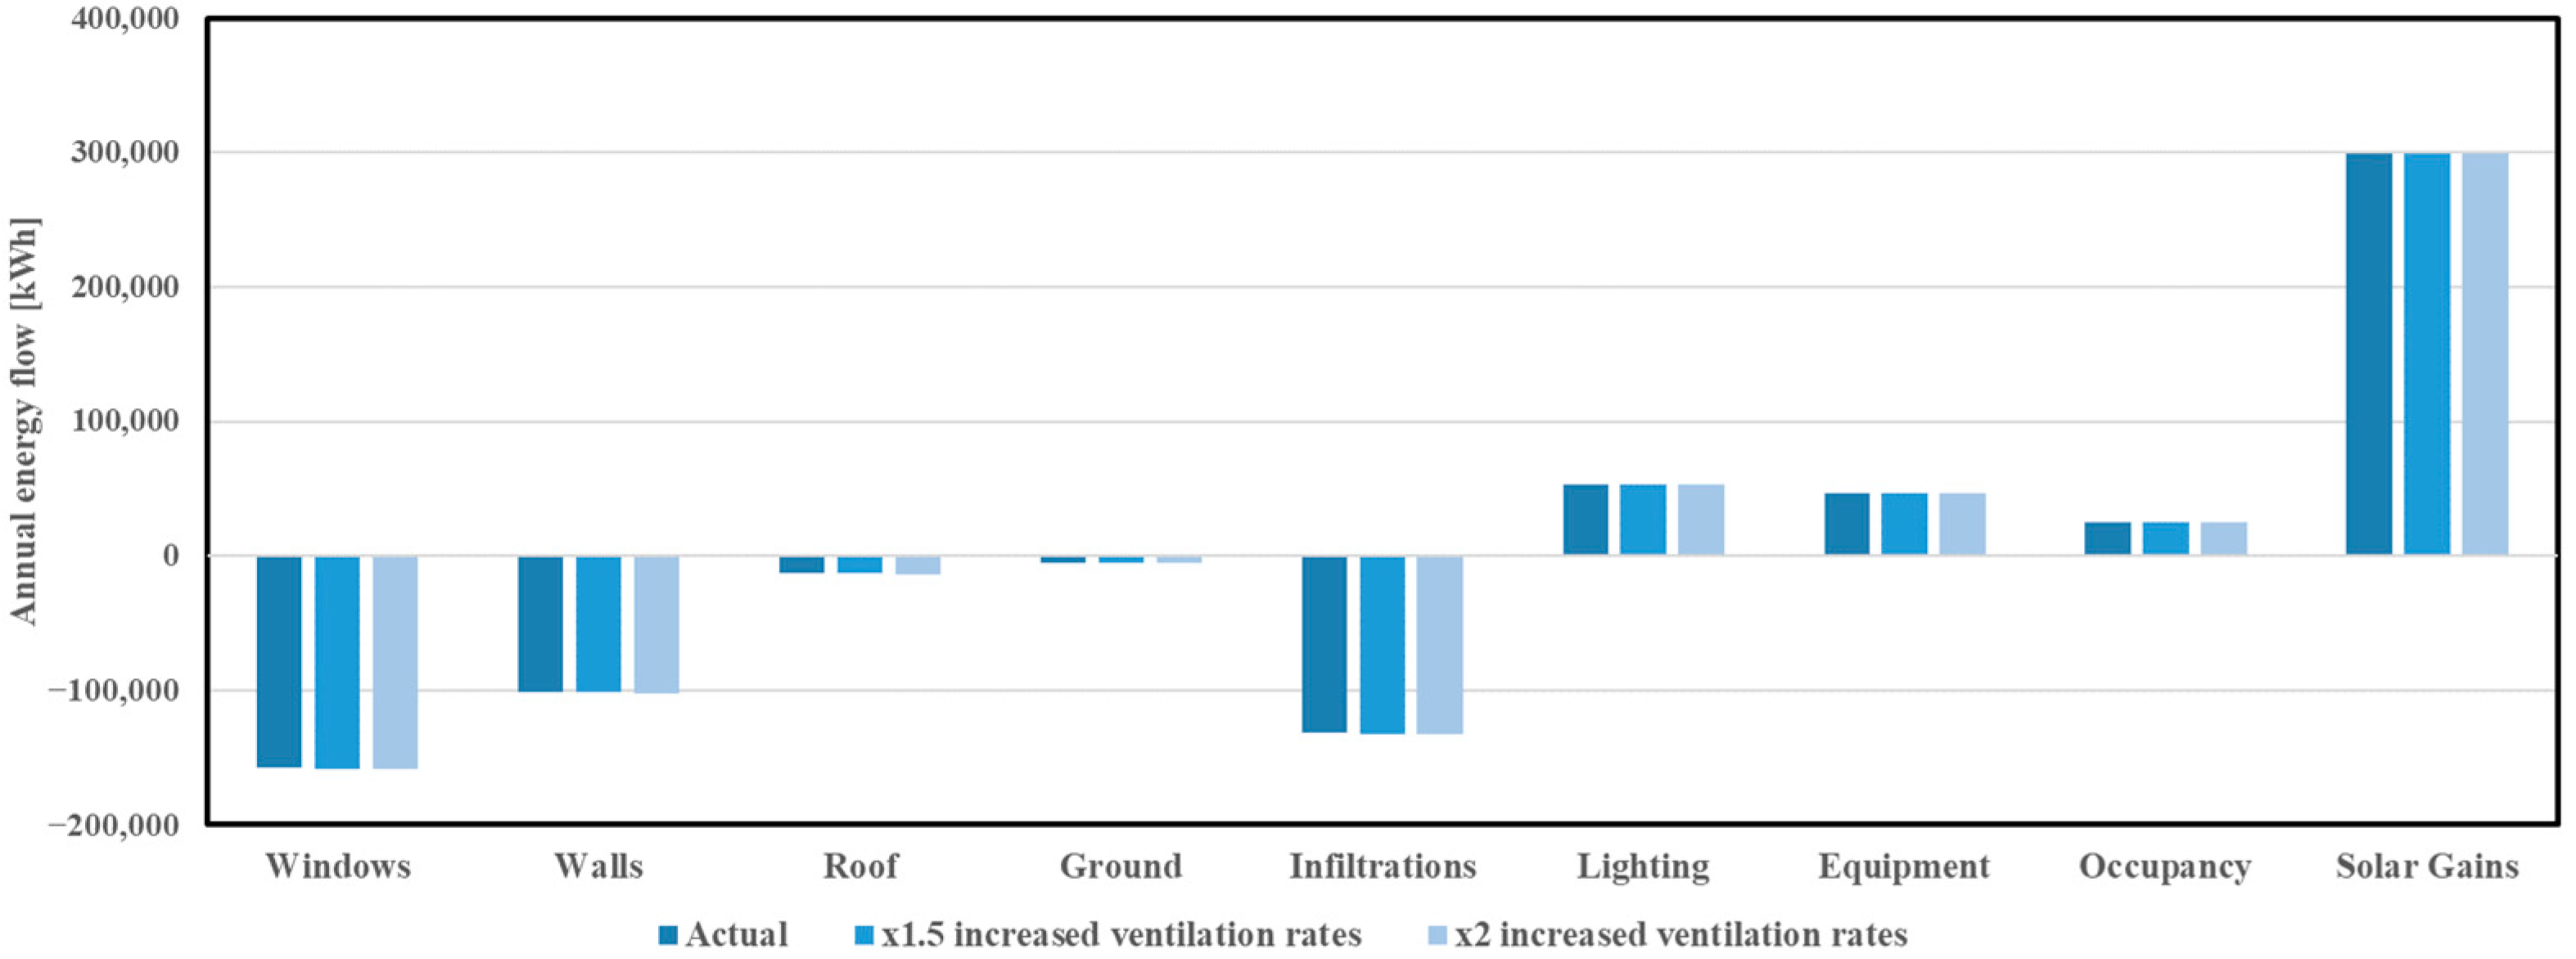
Infrastructures 08 00080 g007
Figure 8. Estimated annual energy flows for the current building and increased ventilation rate cases.
Infrastructures 08 00080 g008
Figure 9. Annual energy demands for heating and cooling in the current building and increased ventilation rate cases.
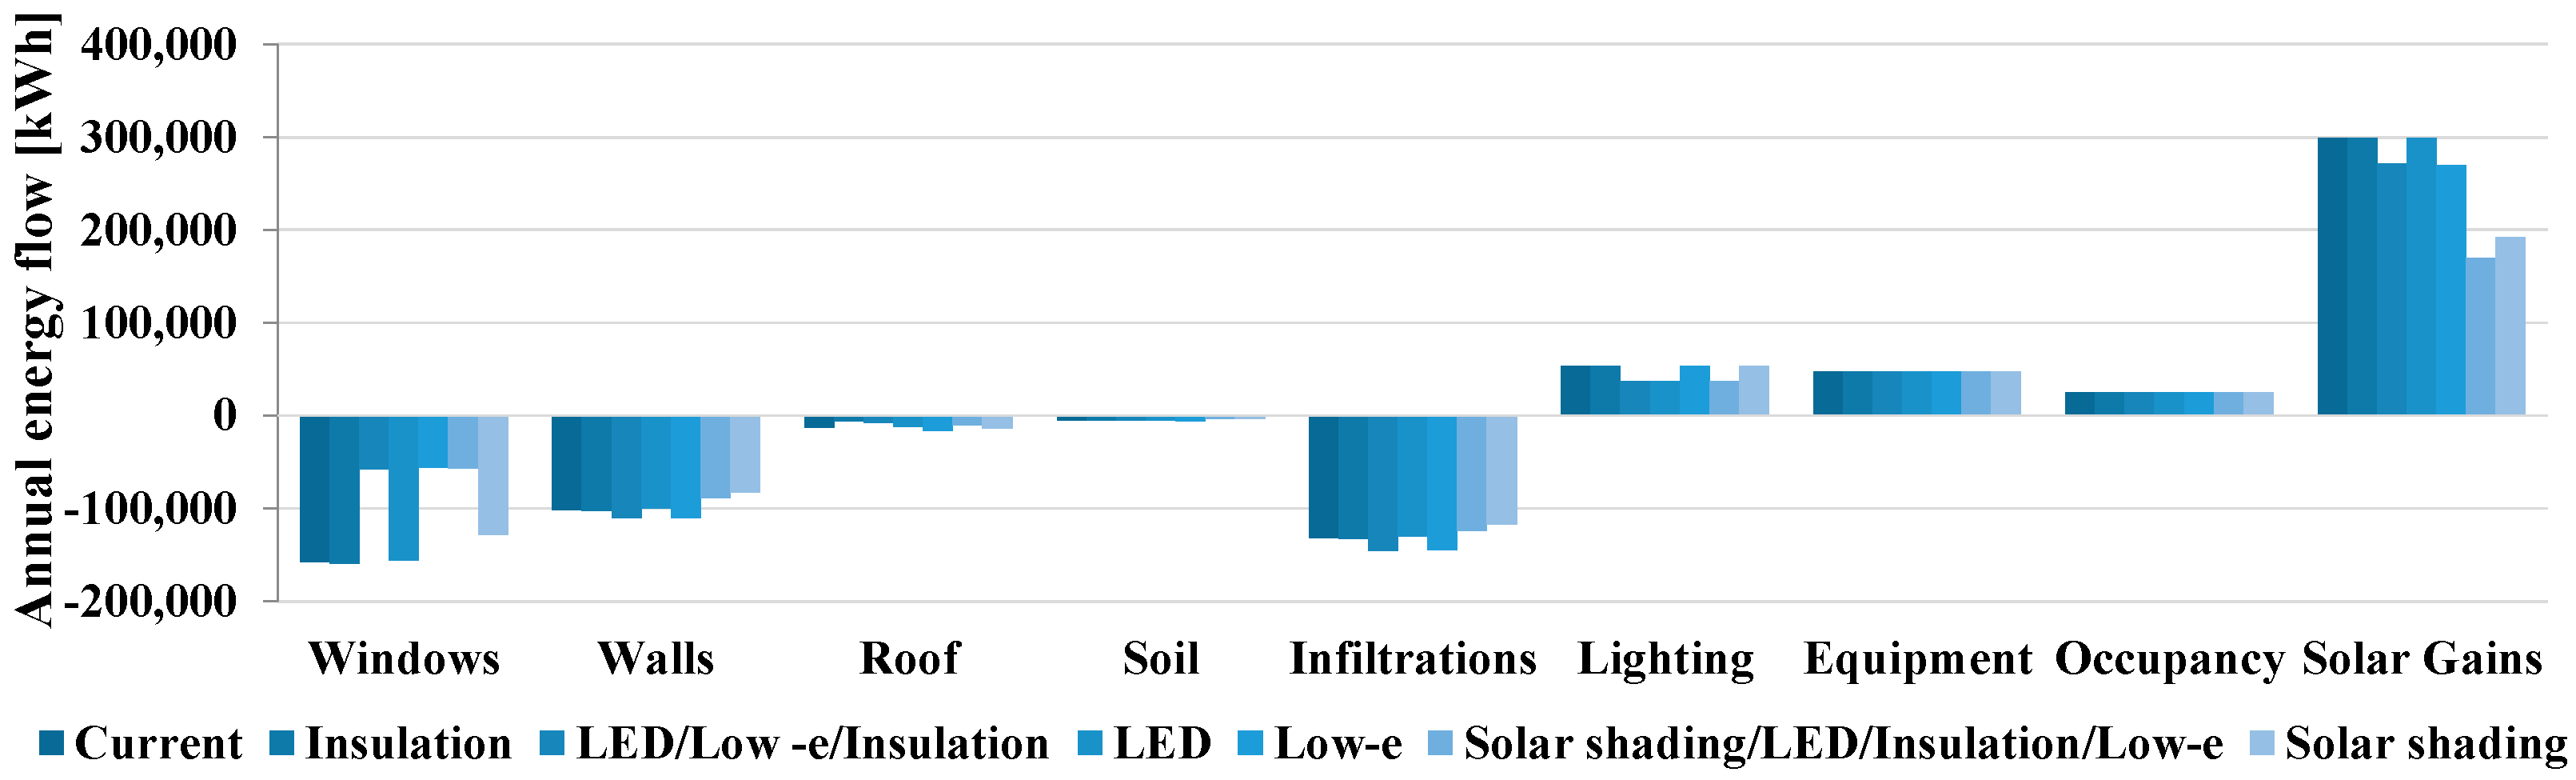
Infrastructures 08 00080 g009
Figure 10. Impact of the retrofit interventions on the annual energy flows of the building.
Infrastructures 08 00080 g010
Figure 11. Heating and cooling annual energy demand for the building. The energy demands correspond to the current building and the building subjected to the different retrofit interventions.
Infrastructures 08 00080 g011
Figure 12. Total energy consumption for air-conditioning. The energy demands correspond to the current building and the building subjected to the different retrofit interventions.
Infrastructures 08 00080 g012
Figure 13. Reduction of hours outside ASHRAE 55 acceptability range.
Infrastructures 08 00080 g013
Figure 14. Estimated annual energy flows for the current building and the building subjected to the guidelines for sustainable building.
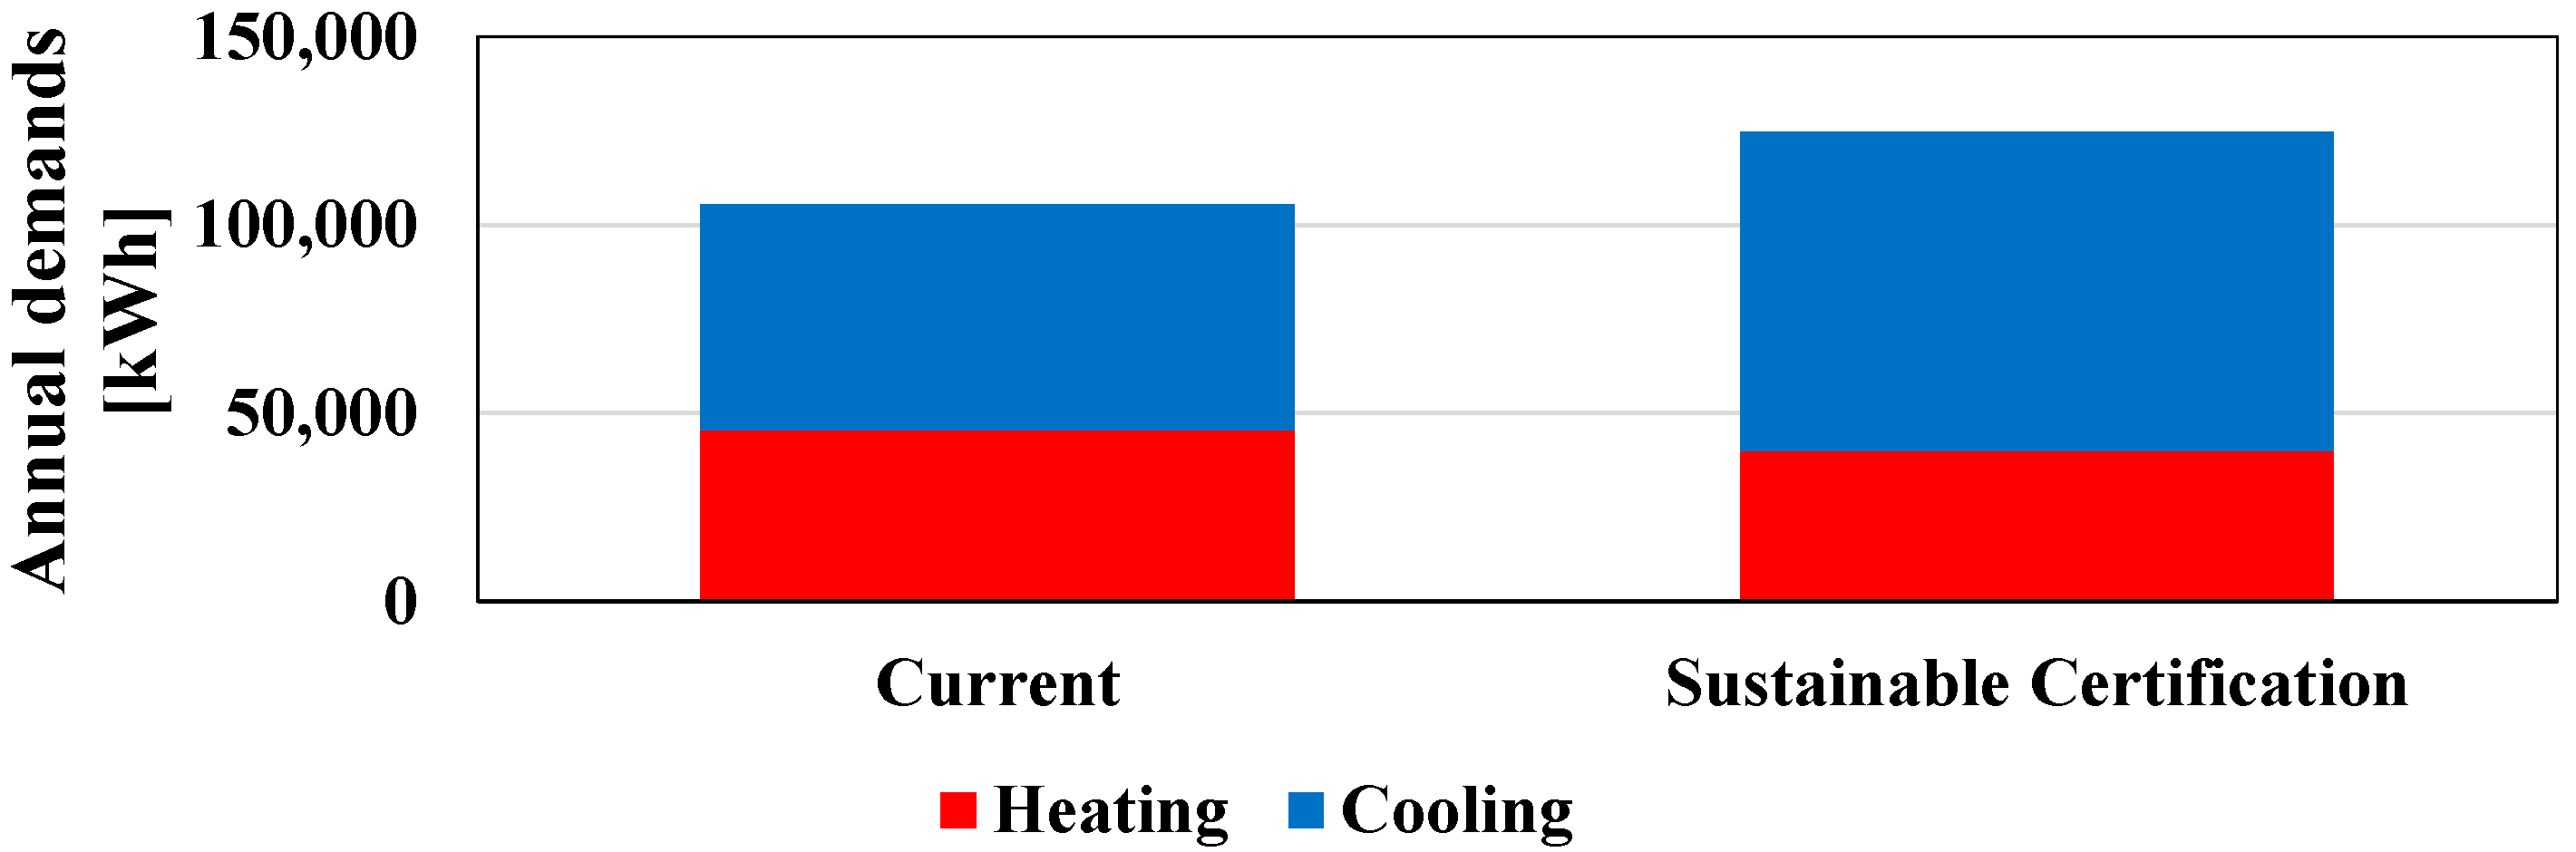
Infrastructures 08 00080 g014
Figure 15. Heating and cooling annual energy demands for the building. The energy demands correspond to the current building and the building subjected to the retrofit intervention for sustainable building.
Infrastructures 08 00080 g015
Figure 16. Total energy consumption for air-conditioning. The energy demands correspond to the current and hypothetical buildings built following the guidelines for sustainable certification.
Infrastructures 08 00080 g016
Figure 17. Cost energy savings of each retrofit intervention. The red color indicates negative savings, while the blue indicates positive savings.
Infrastructures 08 00080 g017
Figure 18. Annual specific energy consumption of the building with and without retrofit interventions.
Infrastructures 08 00080 g018
Table 1. Envelope materials characteristics.
Envelope ElementConfiguration (Interior-Exterior)U Value [W/m2K]
Exterior wallsStucco 1 [cm], reinforced concrete 30–43 [cm], Stucco 1 [cm]2.65
Ground floorConcrete slab 33 [cm]1.07
RoofConcrete slab 38 [cm], osb plate 0.9 [cm], zinc 0.5 [mm]1.35
Table 2. Construction specification and thermal parameters of the windows.
Window TypeGlass Layer NumberDescriptionSHGCLight TransmittanceU [W/m2K]
Monolithic glass1
-
Single sheet of glass with a thickness of 6 mm.
-
Metallic frames.
0.820.885.7
Double pane windows2
-
Double pane windows, 10 mm air cavity.
-
Aluminum frames.
0.6140.4903.1
Double pane/Air chamber/Single pane window4
-
Double pane windows, 10 mm air cavity/non-ventilated cavity, 700 mm thickness/Monolithic glass of thickness 6 mm.
-
Exterior single pane glass: a blue tinted glass of thickness 6 mm; for the interior face of double pane window: float colorless glass of 6 mm.
-
Aluminum frame for double pane and single pane window.
0.4970.4372.3
Table 3. Zone areas and air-conditioned zones.
ZoneArea [m2]AirconditionedOccupant Density [m2/pers]Light Power Density [W/m2]Equipment Power Density [W/m2]
Offices1476Yes10.714.017.3
Meeting room59Yes2.314.08.8
Entrance hall129No129.15.8-
Auditorium145No1.283.310.7
Halls306No---
Hallways496No-8.5-
Bathrooms84No-22.4-
Table 4. Maximum allowed values of the thermal transmittance for the envelope elements according to the sustainable building certification and the actual values of the thermal transmittances.
Envelope ElementSustainable Certification U Value [W/m2K]Current U Value [W/m2K]
Walls2.92.65
Roof0.81.35
Ventilated floor0.8-
Windows3.63.1–5.7
Table 5. Maximum allowed lighting density power established in the guidelines for sustainable building and current lighting density power in different locations inside the building.
ZoneLighting Density Power—Guideline [W/m2]Lighting Density Power—Current [W/m2]
Offices1214
Meeting room1414
Entrance hall145.8
Auditorium1483.3
Hallways118.5
Bathrooms1022.4
Table 6. Increase in ventilation rates.
CasePerson Ventilation Rate [l/s/pers]Area Ventilation Rate [l/s/m2]
Baseline case2.30.3
1.5 ventilation rates increase
2 ventilation rates increase
3.75
5
0.45
0.6
Table 7. Thermal transmittance of the insulated and non-insulated roof.
Roof Current Thermal Transmittance
[W/m2 K]
Roof Thermal Transmittance with Insulation [W/m2 K]
1.350.22
Table 8. Louvers characteristics.
IElements ArrangementVertical Distance from the Superior Edge of the Window [m]Distance between Slats
[m]
Slats Width [m]Angle (°)Distance from the Window [m]
NorthHorizontal0.000.410.2020.002.00
SouthVertical0.401.550.550.000.00
Table 9. Eave characteristics.
Vertical Distance from the Superior Edge of the Window [m]Length [m]Distance from the Wall [m]
0.0061.532.00
Table 10. Properties of the Low-E windows.
Windows
Type
DescripciónSHGCLight TransmittanceU [W/m2K]
Double paneDouble pane window 6 [mm] glass thickness and 13 [mm] air cavity0.570.751.8
Table 11. Lighting density power for the current building and the replacement lamps.
ZoneFluorescent—Lighting Density Power [W/m2]Led—Lighting Density Power [W/m2]
Office14.08.0
Meeting room14.08.0
Table 12. Cost components of electricity in Chilean pesos [CLP].
Tariff ComponentCost per Unit of Electricity
Energy consumption74,801 [CLP/kWh]
Energy transport14,761 [CLP/kWh]
Power demand2584.67 [CLP/kW]
Power demanded during peak period6481.8 [CLP/kW]
Table 13. Annual specific energy consumptions reported for administrative University buildings.
University/BuildingsAnnual Specific Energy Consumption (kWh/Year·m2)Publication Year
University of Bordeaux [33]26.0–742018
University of Almeria [34]23.3–32.52020
USA educational buildings (survey) [35]96.82012
Disclaimer/Publisher’s Note: The statements, opinions and data contained in all publications are solely those of the individual author(s) and contributor(s) and not of MDPI and/or the editor(s). MDPI and/or the editor(s) disclaim responsibility for any injury to people or property resulting from any ideas, methods, instructions or products referred to in the content.

