1. Introduction
Decision-makers in construction projects face additional risks when accelerating the project and delivering it on time and within budget. Construction projects are risky and fast-track construction projects carry more risks than traditional projects. These risks can significantly jeopardize the acceleration strategy and the project cost. Therefore, project decision-makers need to integrate the overlapping risks (i.e., risks for different overlapping degrees) for fast-track projects into the schedule models to support their project acceleration decisions. While previous studies proposed simulation models for projects applying the fast-track overlapping method, they did not consider that risks may arise for different overlapping degrees. They also generally assumed the risk of rework only as a linear function of the overlapping duration.
Earlier studies about overlapping and concurrent engineering acknowledge that a fast-track project faces more risks than traditional projects [
1]. These risks are related to more required work, rework, the uncertainty of variables in progress, or overtime work and are not related to safety or the final project functionality. Project parties (i.e., owner and management team) need to recognize the potential for additional risks [
2]. At the start of a fast-track construction project, it is difficult to determine the amount of optimum overlapping between the phases of engineering design, procurement, construction, and commissioning due to uncertainties about the scope, implementation methods, and the need for additional research [
3].
These risks arising from different overlapping degrees can considerably jeopardize the fast-track strategy and the project cost. The impact of overlapping risk on time and cost is not a linear function. Moreover, there are risks where it would be possible to recover the lost time but not the cost incurred due to the occurrence of the risk. A qualification analysis of the risks, including a probability (likelihood) versus impact matrix, is usually used to analyze the risks, positioning them in high, medium, and low severity ranges. However, this technique does not estimate how much the overlapping risks may impact the project. In this case, it is necessary to perform a quantitative analysis, which also assists decision-makers in making informed decisions and prioritizing the limited resources to respond to the most impactful risks.
Owners and external conditions will continue to exert pressure for faster construction project delivery, and fast-tracking will continue to be a common strategy to respond to it. Fast-track projects may face even more threats, and former studies have accepted that risks may arise due to acceleration. However, they mainly assumed the risk of rework is linear to the overlapping duration. They did not consider that different risks may occur due to different overlapping degrees. Additionally, there was a lack of consideration for the fact that the risk impact characteristics are better represented as a distribution, the potential relationship among these risks, and that an overlapping combination could minimize the impact of overlapping risks on time and cost. Therefore, this study’s knowledge contribution is expanding on previous research and proposing a Monte Carlo simulation and optimization model for fast-track construction projects that contribute to the understanding of risk impacts on project time and cost.
2. Literature Review
The research community has developed models to study fast-track construction projects and the impact of rework through different approaches and methods. The literature review begins with classical studies, some related to the product development field. Then, it goes to more recent studies from 2016 to 2022 and the relevant models before 2016. Among these, some studies specifically tried to address uncertainties or risks in construction projects, and other studies aimed to provide models for optimization of accelerated schedules applying overlapping or crashing.
The topic of concurrent engineering, overlapping, or fast-track modeling involves the review of some classical studies in this area. Krishnan et al. [
4] produced a seminal work of overlapping modeling in product development. The proposed model-based framework considered the two properties of evolution and sensitivity related to the information exchanged between the predecessor and successor activities. They offered a solution to manage better the risk of overlapping through a better comprehension of these two activity characteristics and the decision of the amount of overlap, if any.
Recent studies from 2016 to 2022 applied different methods to assess uncertainties or risks in construction or product development projects with various outcomes (i.e., duration, cost, or both). Among the few studies related to product development, Tian et al. [
5] modeled two types of rework risk (i.e., forward rework and reverse rework) and their consequent time delay to the overlapping coupling activities in the development process. Oh and Hong [
6] developed a quantitative model considering the uncertainty of cascaded information that causes an impact on rework and project duration due to the concurrency of multiple development activities.
Some recent studies on risk assessment in construction projects were specific to fast-track projects or accelerated projects, applying overlapping and crashing. Rasul et al. [
7] used casual loop diagrams, a systems-based approach, to investigate the impact relationship of critical risk factors on time, cost, safety, quality, and productivity of fast-track projects. This approach did not quantify the risk impacts or optimize the project. Ma and Liu [
8] aimed to mitigate the rework risk by introducing communication strategies in an optimization model for overlapping dependent activities, combining Monte Carlo simulation, an optimization algorithm, and BIM visualization. Laryea and Watermeyer [
9] used a case study to investigate the client delivery-management approach applied to manage uncertainty in fast-track construction projects in South Africa. Abuwarda and Hegazy [
10] considered only the rework risk. However, in addition to calculating rework time, they assumed rework cost is a linear function of the overlapping time. In previous work, they proposed a schedule optimization model using the constraint programming (CP) technique to obtain the optimal mix of overlapping and crashing constrained by resources and considering rework [
11]. Yu et al. [
12] intended to reduce uncertainty in project cash flows and the need for borrowing money for projects applying activity overlapping, developing an algorithm using a fuzzy dependency structured matrix (DSM) based scheduling. Francis [
13] modeled uncertainties in construction schedules, including uncertainties that might arise due to project acceleration (e.g., overlapping and crashing), using Monte Carlo simulation and the chronographic scheduling logic. Ballesteros-Pérez [
14] developed a stochastic activity overlapping model, applying Monte Carlo simulation, considering the risk of an unsuccessful overlap to analyze the impact on the duration and cost of fast-track projects. Gwak et al. [
15] developed a computational optimization model to solve the time-cost trade-off in schedules applying overlapping. The model considered rework cost due to overlap and the probability of completing the project on time or cost.
The remaining of those recent studies was related to construction projects in general. Nabawy and Gouda Mohamed [
16] classified infrastructure project risk factors by their risk scores obtained by the probability of occurrence and impact on cost using a sequence of methods. The study used a risk breakdown structure to classify the risks from the literature, a checklist, a questionnaire, and Back Propagation Multi-Layer Perceptron (BP-MLP) Artificial Neural Network to generate the final classification. Mohajeri Borje Ghaleh et al. [
17] used a survey and analytical hierarchy process (AHP) to investigate risks in road projects that can lead to schedule delays without considering acceleration, quantification, or optimization of the schedule. Nabawy and Khodeir [
18] offered specific guidelines for a quantitative risk analysis using Monte Carlo simulation in infrastructure projects, simulating the impact on the completion date and cost but not accounting for schedule acceleration or optimization. Etemadinia and Tavakolan [
19] proposed a hybrid SD-ISM (System dynamics-Interpretive structural modeling) method to examine risks that can emerge during the design phase and as an interrelated system. The approach aimed to provide risk prioritization, individual risk assessment, and the overall risk impact on project objectives. One study proposed a methodology using a fuzzy logic approach to quantify project over cost caused by risks on varying types and sizes of power plant projects and during different project phases [
20]. Another study applied a different approach to assess project time delays using the line-of-balance (LOB) scheduling method, which can be used for projects with many similar activities occurring in succession and repeated throughout the project, combined with Monte Carlo simulation to generate the final delay impact output [
21]. Two other earlier works combined other methods to propose a quantitative risk analysis for construction projects. One of these works proposed a methodology applying Group Technique for Order Preference by Similarity to Ideal Solution (GTOPSIS) with a Judgemental Risk Analysis Process (JRAP) and Monte Carlo simulation to quantify duration delays [
22]. The other work proposed a hybrid approach of system dynamics (SD) and discrete event simulation (DES) to quantify schedule risks in infrastructure projects without the purpose of considering acceleration or optimization [
23]. One last study attempted to create a methodology using Bayesian Belief Nets and combining different input variables, such as the risk factors, their potential impact, and the mitigation action effects, to determine the impact on the time or cost of civil engineering projects in urban environments [
24].
Before 2016, the research community produced a series of classical studies of concurrent engineering or overlapping aiming to model optimal combinations of acceleration, starting with Roemer et al. [
25]. The seminal works of this group were developed in the area of product development and later applied in the construction area. Roemer and Ahmadi [
26] developed an algorithm with linear costs to address the overlapping and crashing in product development schedules. Gerk and Qassim [
27] proposed mixed-integer linear programming to solve the optimum project acceleration solution considering overlapping, crashing, and substitution. Bogus et al. [
28] presented a simulation-based methodology to find the optimum overall duration when overlapping design-dependent activities. Then, another group of authors used a genetic algorithm aiming to solve the time-cost trade-off in fast-track projects [
29,
30,
31,
32].
Fast-track construction projects will continue to be a common strategy to respond to the need for faster delivery. While fast-track projects cannot be free of risks and may face even more threats, project decision-makers need to consider the occurrence of overlapping risks in their strategy. They need a model that can support more informed decisions about their acceleration strategy using overlapping—a piece of information that could provide which acceleration combinations would less expose the project to the impact of potential risks. Former studies have considered that risks may arise due to acceleration. However, they have not considered that different risks may occur due to different overlapping degrees and mainly consider the risk of rework linear to the overlapping duration. In this respect, the following questions need to be addressed: “what is the probability of attaining the desired fast-track project performance metrics under different overlapping risk scenarios, and what is the project’s most probable duration and cost?”; “what are the most significant overlapping risks and the activities most affected by the risks?”; and “what is the optimal degree of overlapping to obtain the minimum total cost subjected to a duration less than the original?” This study proposes a Monte Carlo simulation model to address these questions. This risk model for accelerated construction projects considers that different risks with different impacts may occur for different degrees of overlapping. It aims to address the time-cost trade-off and find an acceleration solution with a combination of overlapping degrees that would least threaten the fast-track project strategy (i.e., the project duration and the final project cost).
3. Materials and Methods
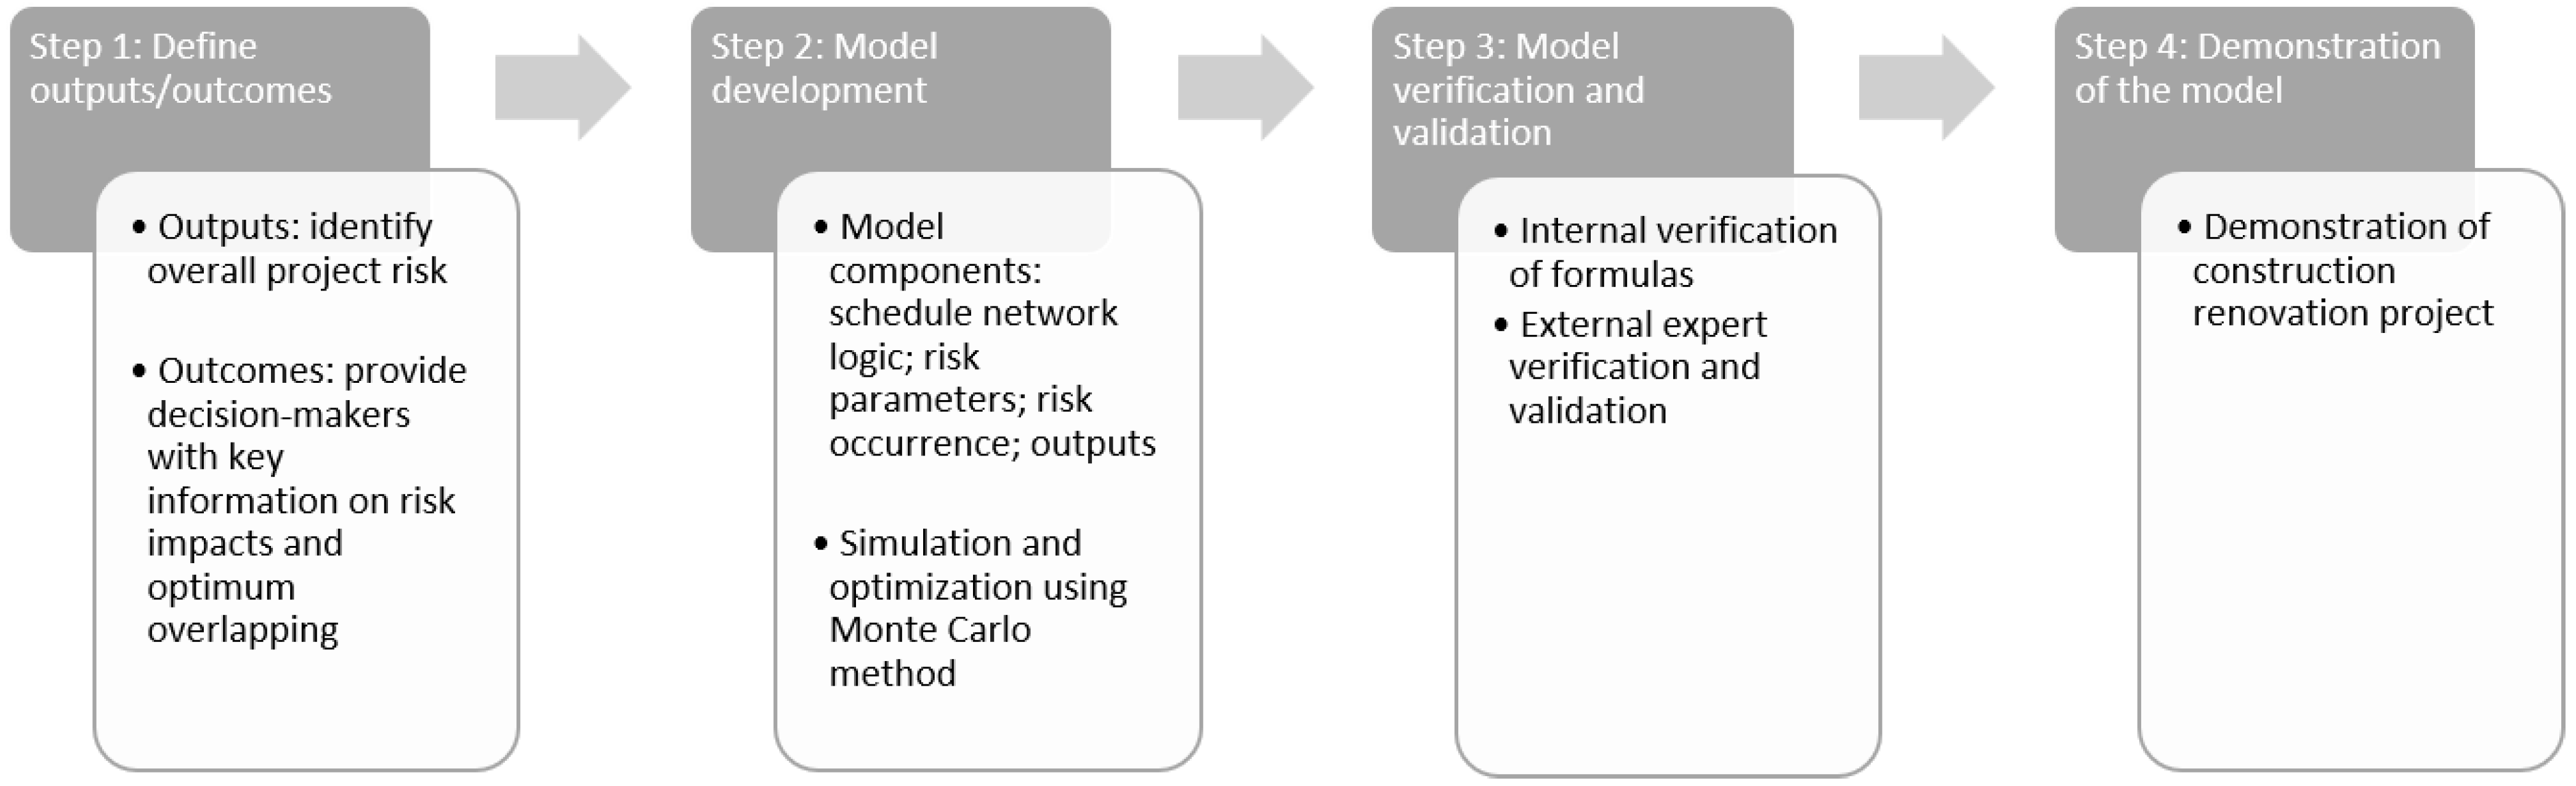
The framework for this study includes four main steps (
Figure 1). The first step in developing the simulation model was defining the desired outputs and outcomes. After determining the outcomes, the model was developed, followed by model verification and validation. The last step, the demonstration of the model, consisted of running the Monte Carlo simulations and optimizations and analyzing the results. The following subsections will explain each of these main steps.
3.1. Model Outputs/Outcomes Definition
The first step in the research process was to define the desired outputs and outcomes of the model. The purpose of the model was to obtain the overall project risk considering different overlapping risks and the probability distribution of the project duration and cost subjected to the risk impacts. Additionally, the model was also to aid in understanding which risks most impacted the project and to provide decision-makers with information to respond to them. The final desired output was the optimum overlapping degree combination that could produce the minimum risk impact on cost, subjected to a duration constraint.
3.2. Model Development
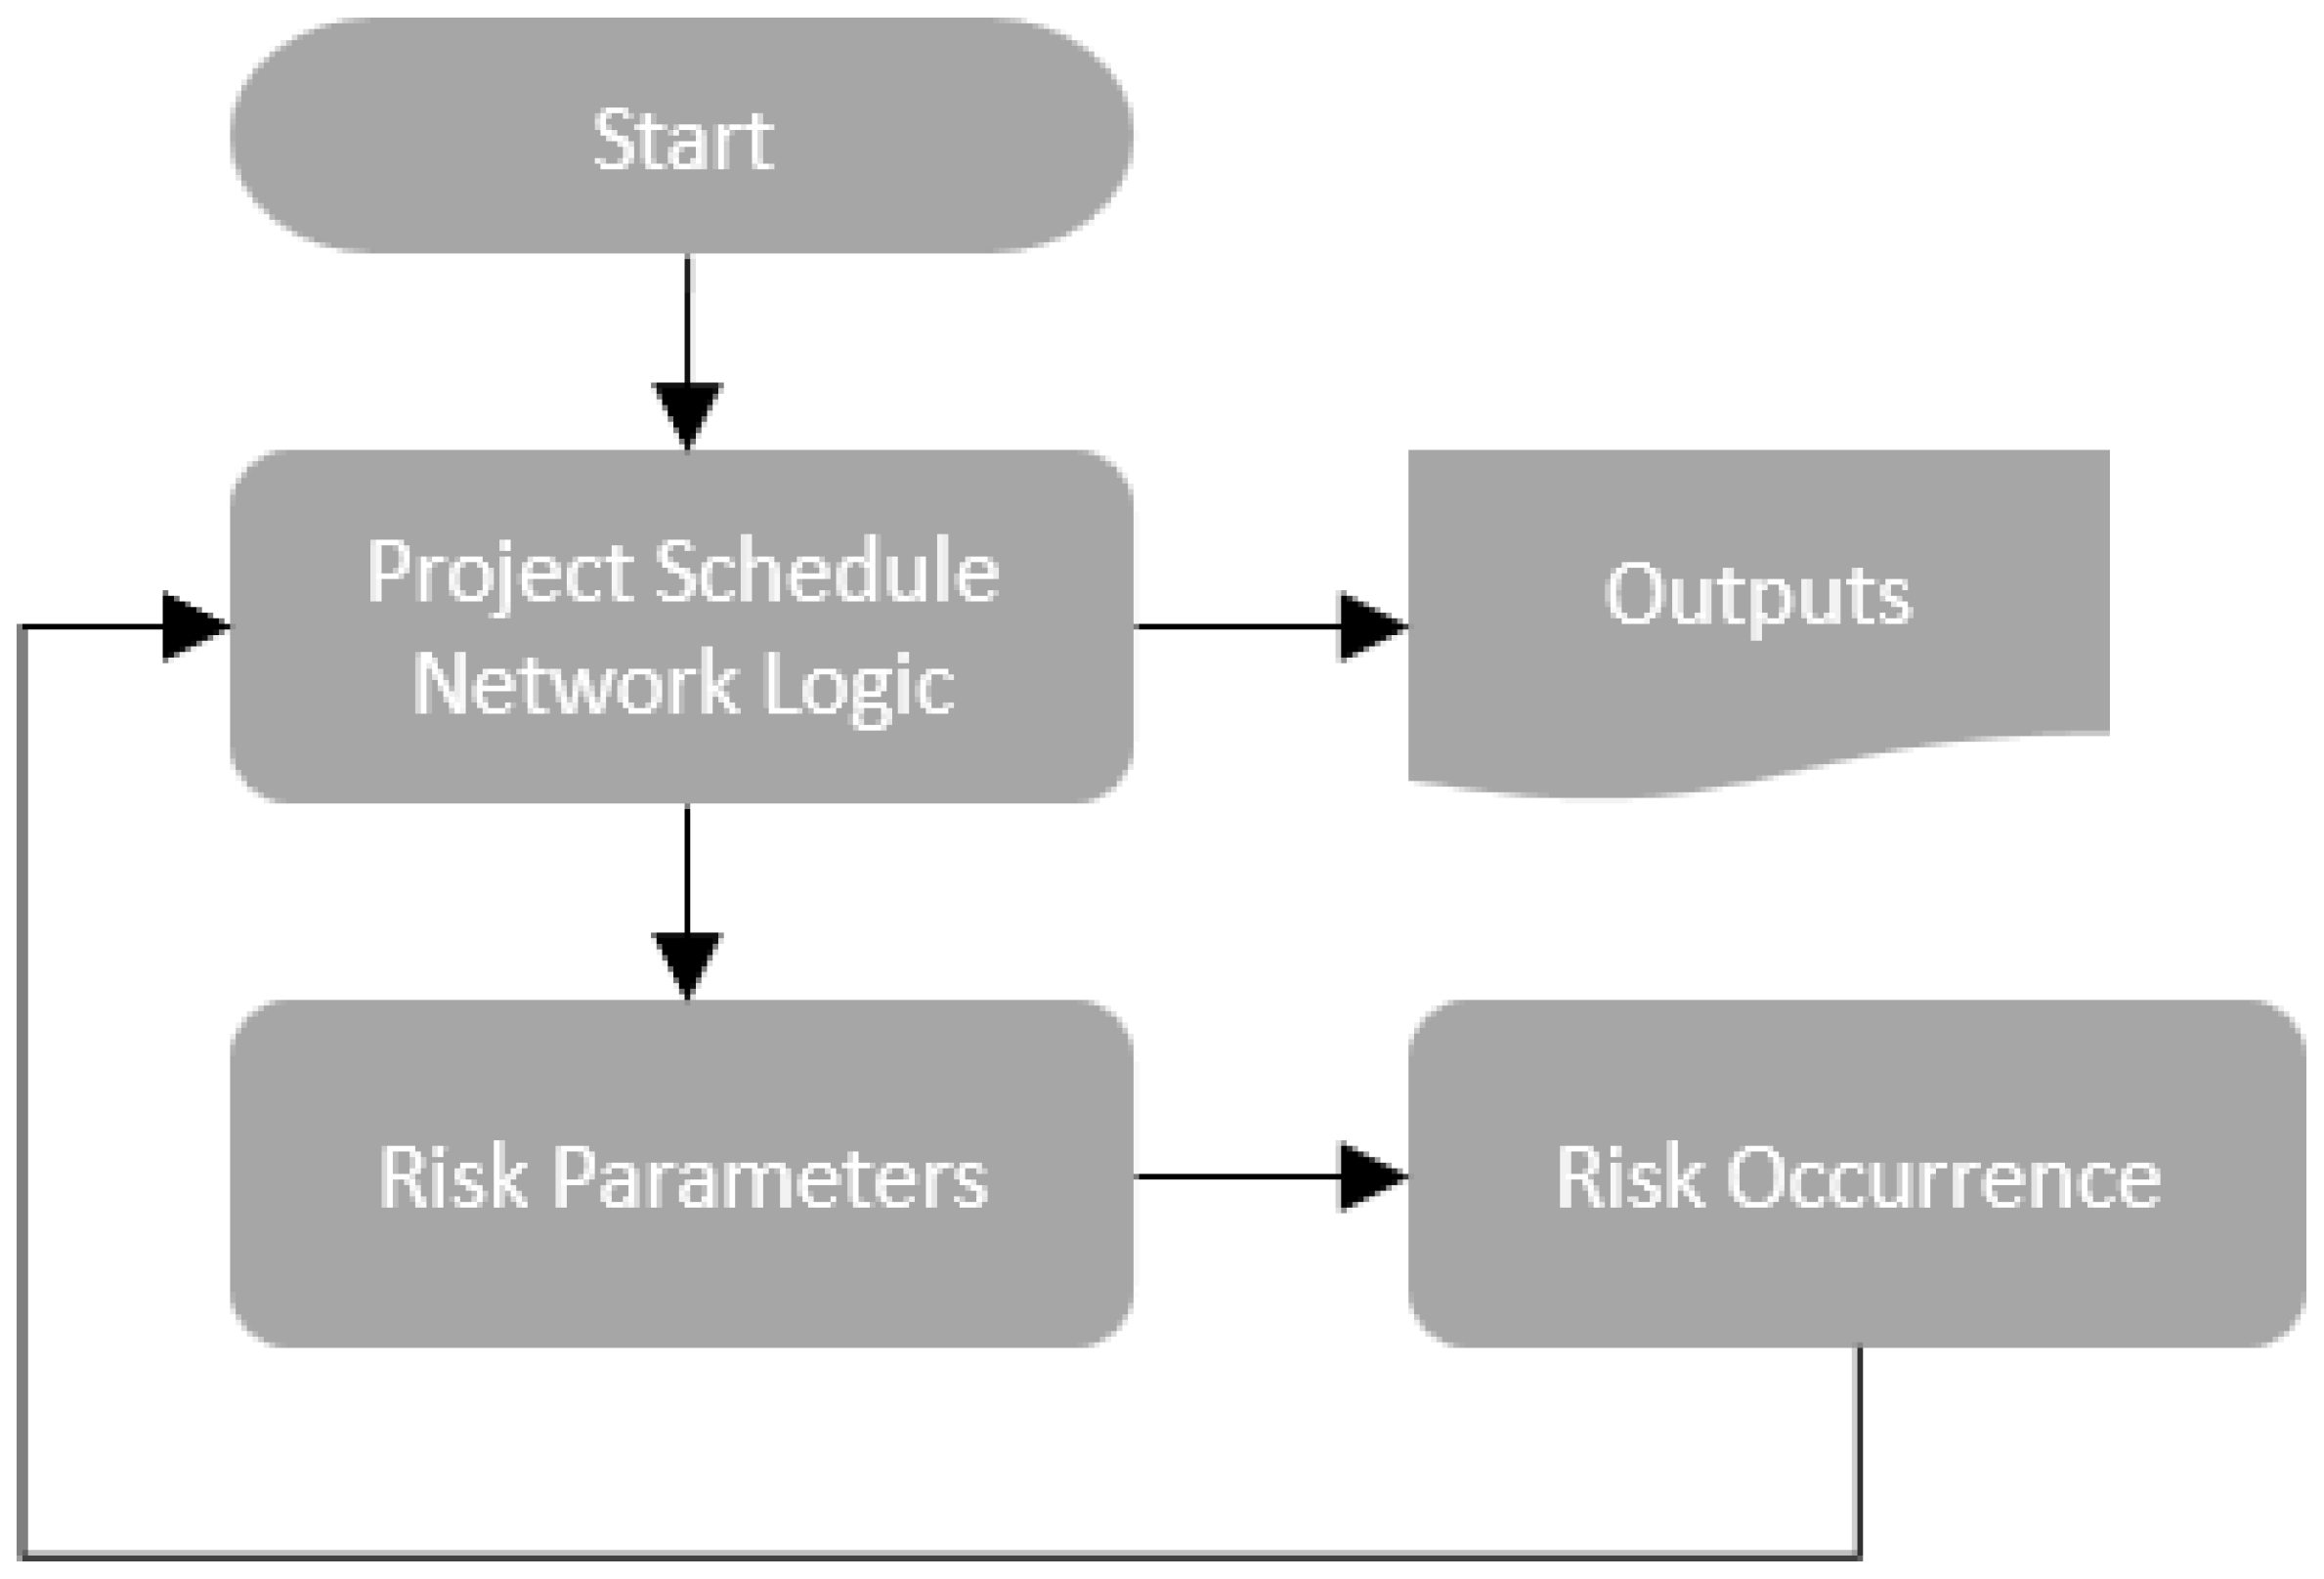
There are four areas included in the simulation model: (1) schedule logic; (2) risk parameters; (3) risk occurrence; and (4) model outputs.
Figure 2 shows the relationship between the different model areas. The subsections below introduce the variables, equations, and logic in each of the four areas of the simulation model. The following indexes apply to the variables and equations:
i = activity number
p = predecessor activity
j = risk
m = risk for a specific activity and degree of overlapping
N = total number of activities
M = number of risks within the same degree of overlap
3.2.1. Project Schedule Network Logic
The scheduling approach and logic area of the simulation model were based on the critical path method (CPM) approach to scheduling and assumed a finish-to-start relationship between activities. This area of the model identified individual activities and associated the following data with each activity: duration (in days), cost (
$), degree of overlapping (lead or negative lag), early start, and early finish. The original values of duration and cost for each activity did not include any impact associated with overlapping risk (Equations (1) and (2)).
The degree and the amount of overlapping are represented in Equations (3) and (4). The overlapping degree (OL
ip) corresponds to the percentage of time that the two dependent activities will be overlapped. The current model adopted three overlapping degrees as proposed in the framework developed by Peña-Mora and Li [
33]: 25%, 50%, and 75%. The amount of overlapping (O
ip) in days is calculated based on the original duration of the predecessor activity and the overlapping degree.
Equations (5)–(8) define the early start and early finish times for an activity considering logic constraints. The logic applies a constraint to the early start time to ensure that the successor activity will not finish before its predecessor. The calculation of the early start time rounds up the calculated time to the next whole day, avoiding fractions of a work day. Moreover, the calculated early finish time of the successor activity is restricted such that it finishes at the same time or after its predecessor’s early finish time.
The original project total duration and cost are calculated as follows (Equations (9) and (10)).
Project total duration (original)
3.2.2. Risk Parameters
The risk parameters area of the model calculates risk data for each potential risk that might emerge based on different levels of activity overlapping (i.e., low, medium, or high amounts of overlapping). The risk data calculated in this area include the probability of occurrence, duration of impact, and cost impact. Equations (11)–(16) define the overlapping risk data associated with each combination of overlapping activities and degrees. The risk probability of occurrence is the likelihood of a risk event. If the risk occurs, the duration impact defines the time impact (in days) on the activity duration. In the same way, the cost impact defines the monetary impact ($) on the activity cost. Both risk impacts on time and cost were represented by a PERT distribution, a transformation of the Beta distribution defined by a mean, and two parameters that control the distribution shape.
Probability of occurrence
where
3.2.3. Risk Occurrence
The risk occurrence area of the model includes the logic that triggers the occurrence of risks and uses risk parameter data and the schedule logic to calculate how much impact should be applied to the project. The following variables are part of the risk occurrence logic: risk frequency, risk relationships, and the total risk impacts on time and cost. Equation (17) defines the risk frequency as a binomial distribution that triggers the risk event.
The model applies the risk relationships concept presented by Chapman [
34], where risks can occur in series and parallel. When Risk X also activates the occurrence of Risk Y, it indicates the occurrence in series. In this case, the impact will be the sum of the individual impacts. When Risk X and Risk Y are independent and can occur simultaneously, it indicates that the occurrence of risks is in parallel. The risk relationships logic is represented by a matrix (Equation (18)).
Equations (19)–(21) show the calculations of the total impact on duration caused by overlapping risks. Equation (19) calculates the individual impact on the duration of each risk. Logic determines the most significant impact by combining the risks in series and parallel (Equation (20)) because, in parallel, the minor impacts will be contained by the largest impact. Equation (21) shows the total impact on the duration to be applied to the schedule, and it is defined by the overlapping degree with a value greater than zero.
Duration impact for each risk
Equations (22)–(24) show the calculations of the total impact on cost caused by overlapping risks. Equation (22) calculates the individual impact on the cost caused by each overlapping risk, and then Equation (23) calculates the cost subtotal for the overlapping degree. Equation (24) presents the total risk impact on the cost transferred to the schedule and determined by the overlapping degree with a value greater than zero.
Cost impact for each risk
The activity early finish can now be rewritten considering the total risk impact on the activity duration (Equation (25)).
3.2.4. Outputs
The outputs area of the model calculates the total project duration and cost considering the risks of overlapping. These calculations are shown in Equations (26) and (27). These are the results that can support decision-makers in making informed decisions.
Equation (28) represents the optimization model, which aims to find an optimal solution for overlapping degrees and minimize the total project cost and overall risk.
3.2.5. Monte Carlo Simulation and Optimization
Once the simulation model was developed, there was a need to create a large input data set comprising many different combinations of activity overlapping and associated risks occurrences to evaluate the impact of activity overlapping on project time and cost. Monte Carlo simulation was used to develop this large input data set by applying the @Risk module in the Palisade DecisionTools Suite 7.5 Industrial (now Lumivero).
Before each simulation run, it was necessary to perform or check the initial setup of the model. In this case, the initial degrees of overlapping, the sampling method, and the number of iterations. All activity pairs had their overlapping degrees initially set to zero (no overlapping). The Monte Carlo simulation model was configured to provide the likelihood of possible project durations and costs considering the project acceleration strategy and the potential occurrence of overlapping risks, the overlapping risks that can result in higher variation in time and cost, and the activities affected by these risks.
The simulation model was also used to identify the optimal project acceleration solution (i.e., the optimal amount of overlapping) that would have the least impact on time and cost. The objective function was to minimize the overall project cost for the fast-track strategy. The solution had to satisfy a hard constraint of a total duration less than the original duration without acceleration. Optimization used a commercial optimization package that created trials using the Monte Carlo simulation. Then, it sought the optimal solution using the OptQuest Engine©, a proprietary algorithm built on a combination of techniques such as metaheuristics optimization, evolutionary algorithms, tabu search, and scatter search.
3.3. Model Verification and Validation
The simulation model verification and validation were performed according to the recommendations of Sargent [
35,
36] for its correct implementation and accuracy consistent with its domain application and intended use of the model. The subjective validation approach was adopted, exploring the model behavior [
36] since the problem was considered a non-observable system. Internal verification was performed, forcing potential scenarios to inspect formulas and logic. After verifying that the formulas and logic were correct, an internal validation was performed to verify the model’s behavior, executing it a few times. The last step was an external independent verification and validation approach [
35]. Two construction project managers with more than 20 years of experience, one from the interview group and another not associated with the interview group, evaluated the model outputs. Both validators agreed that the model answered the research questions. One of the reviewers did comment that the model would be limited for using it in practice because they do not perform these risk analyses. The results below, modified from [
37], are consistent with these verification and validation steps.
3.4. Demonstration of the Simulation Model
The demonstration of the simulation model was performed using real construction project information for the schedule and expert opinions about the risks from construction professionals. The construction project was the renovation of a 4-story, 67,000-square-foot (SF) building of a high education institution in the U.S. The scope included 67,319 gross square feet (GSF) plus an extra 9959 GSF for different departments, including spaces for different purposes, such as offices and computational research labs. The demonstration used the critical path schedule of the first-floor buildout. The first-floor section of the schedule had the following characteristics: total area of 16,478 SF, original duration of 145 days without overlapping, and original cost of $552 thousand (order of magnitude).
The demonstration used the initial ten activities of the critical path schedule. The network of these ten activities contained nine pairs of overlapping activities identified from P1 to P9. Since each pair could have three overlapping degrees (e.g., 25%, 50%, and 75%), the demonstration case used the risk data collected for 27 alternatives.
The risk data collection was performed through in-person interviews with 13 construction professionals. In order to facilitate the interviews, a semi-structured questionnaire was developed, tested twice with two target participants, and adjusted for the interviews. The data collected included, for each overlapping pair, the risk descriptions, probability of occurrence, impact on duration, impact on cost, and risk relationships.
Table 1 shows the profile of the interviewed construction professionals, from the U.S., by education degree, work experience, and years of experience.
The demonstration model simulated the potential occurrence of 133 overlapping risks identified during the data collection. The probability of occurrence of each risk was defined as a discrete value, a discrete distribution, or a discrete uniform distribution. For the impacts on time and cost, the minimum, median, and maximum values of the respective risk in the same pair and degree of overlapping defined the values of the PERT distribution—optimistic, most probable, and pessimistic, respectively. The risk relationship employed the most frequent type of relationship identified for the respective risk in the same pair and degree of overlapping. Finally, a code for each risk (e.g., P1-75-R10) was determined to facilitate the interpretation of the results, indicating the overlapping pair (i.e., P1 to P9), overlapping degree (i.e., 25, 50, and 75), and risk ID (e.g., R1). The final demonstration model worked with 741 inputs to generate three outputs.
For the simulation trials, the sampling method was set to Latin Hypercube. The number of iterations was configured to automatic until the change in the output statistics reached 1% of convergence tolerance and 95% of confidence level, resulting in an average of 27,940 iterations for each simulation run. During each iteration, the model sampled all distribution functions, the sampled values were returned to the formulas, and the outputs were recalculated. The output values were recorded to generate the probability distributions. For the optimization trial, the sampling method was set to Latin Hypercube sampling. The optimization was set to progress until the improvement in the objective value was less than 0.01% after every 500 or 250 trials.
The model demonstration results were generated by running ten Monte Carlo simulations for the risk impacts and one run for the optimization. The option to use a single run to produce the results for the optimization process was based on the long time necessary to run each optimization process. The analysis of the results generated by the optimization process was performed considering all the best values the algorithm found during the run.
4. Results and Discussion
4.1. Overlapping Risk Impacts on Total Project Duration and Cost
The results analysis was performed to evaluate how much the overlapping risks impacted the project target performance metrics and the leading causes of the impact. Statistical measures were used to analyze the impact ranges corresponding to the ten Monte Carlo simulation runs. The likelihood of possible project durations and costs considering the acceleration strategy and the potential occurrence of overlapping risks was performed using the probability distribution curve of a single one of the ten runs, considering the demonstration and space limitation. In the same way, a single tornado chart was used to analyze the overlapping risks that could result in higher variation in time and cost. The duration values were rounded up, and an order of magnitude was used for the cost values.
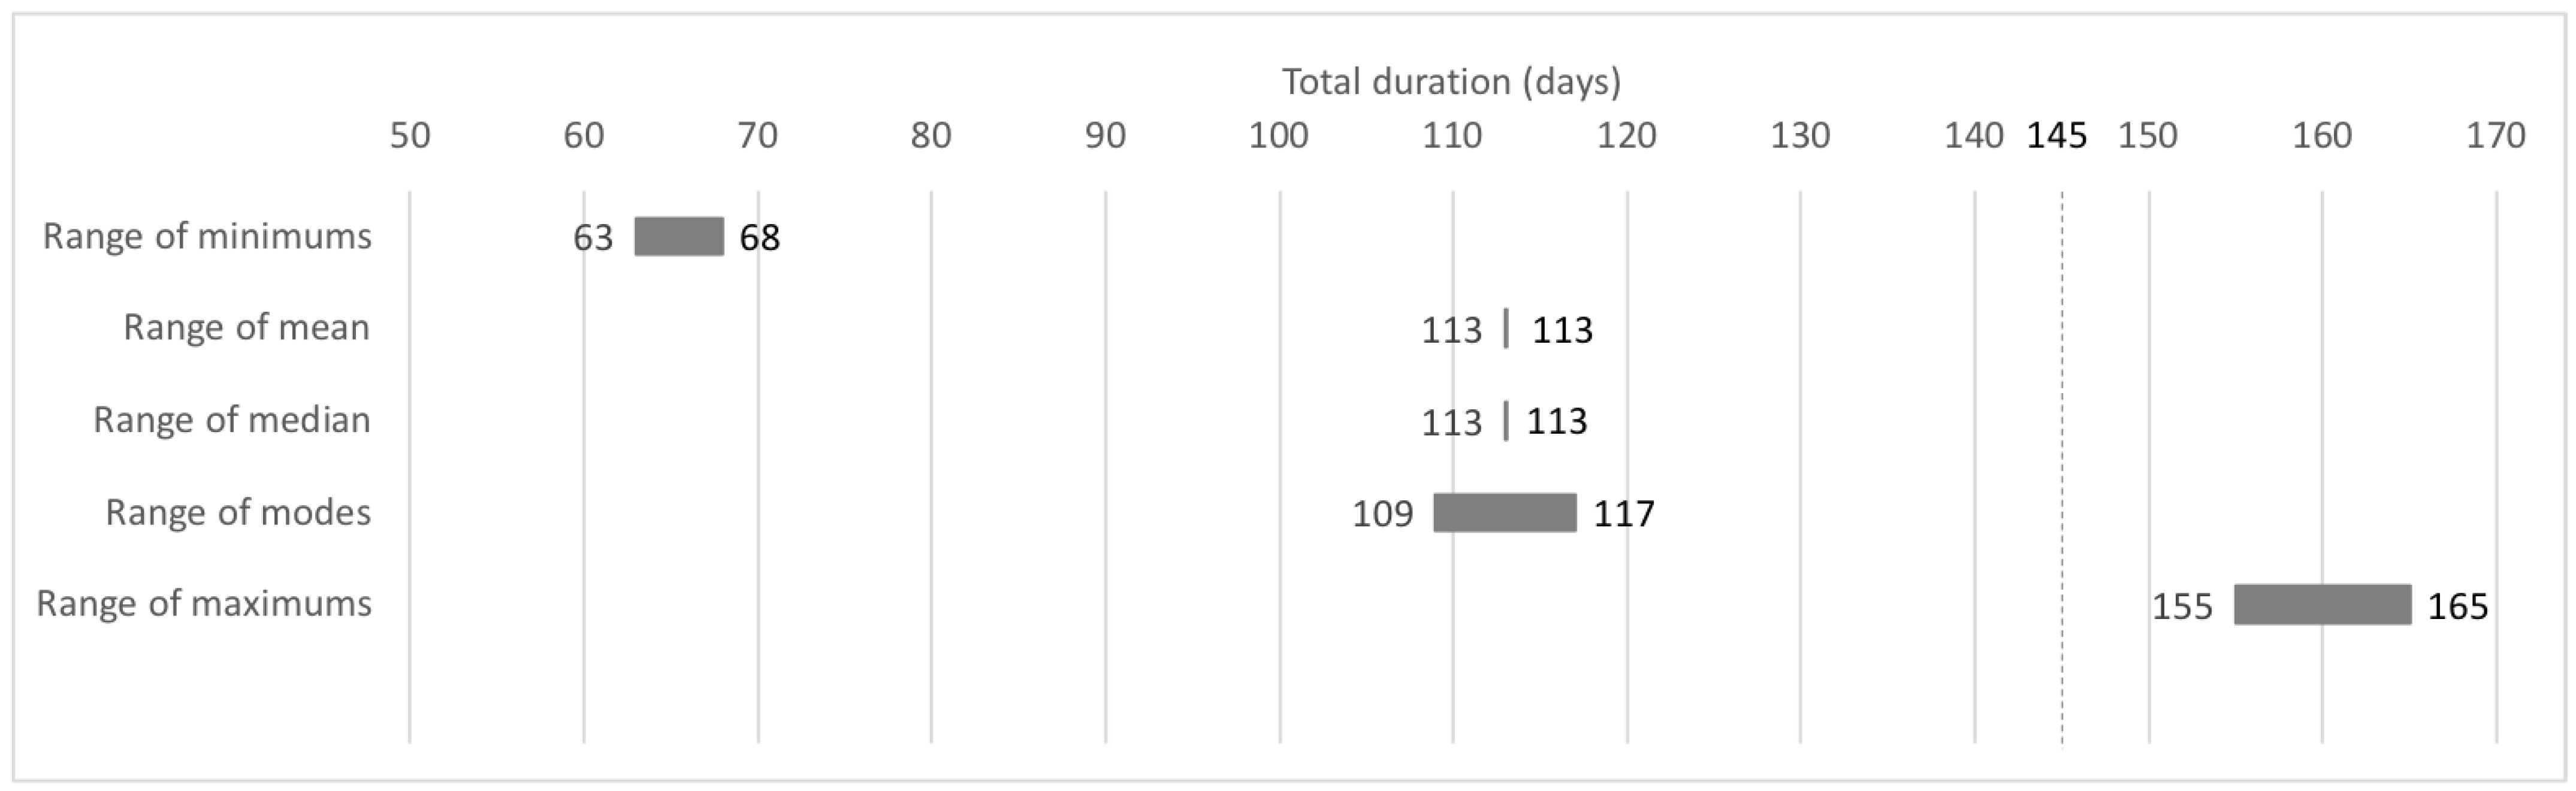
A summary of the statistics results for the total duration and total cost, expressed as ranges, is presented in
Figure 3 and
Figure 4. The range values are the results of the ten simulation runs, representing the natural variation of the outputs of a simulation process. The range values for the variation in the total project duration show small intervals (
Figure 3), meaning few value differences existed among runs. The variation for the minimum and maximum values was five days, or 4%, based on the total duration, and almost ten days, or 7%, respectively. The extreme minimum and maximum durations were approximately 63 days and 165 days, respectively. The variation of the most probable duration, represented by the mode, was eight days, or 6%. The difference between the extreme 165 days and the original duration of 145 days describes an overlapping risk impact of approximately 14% of the project duration.
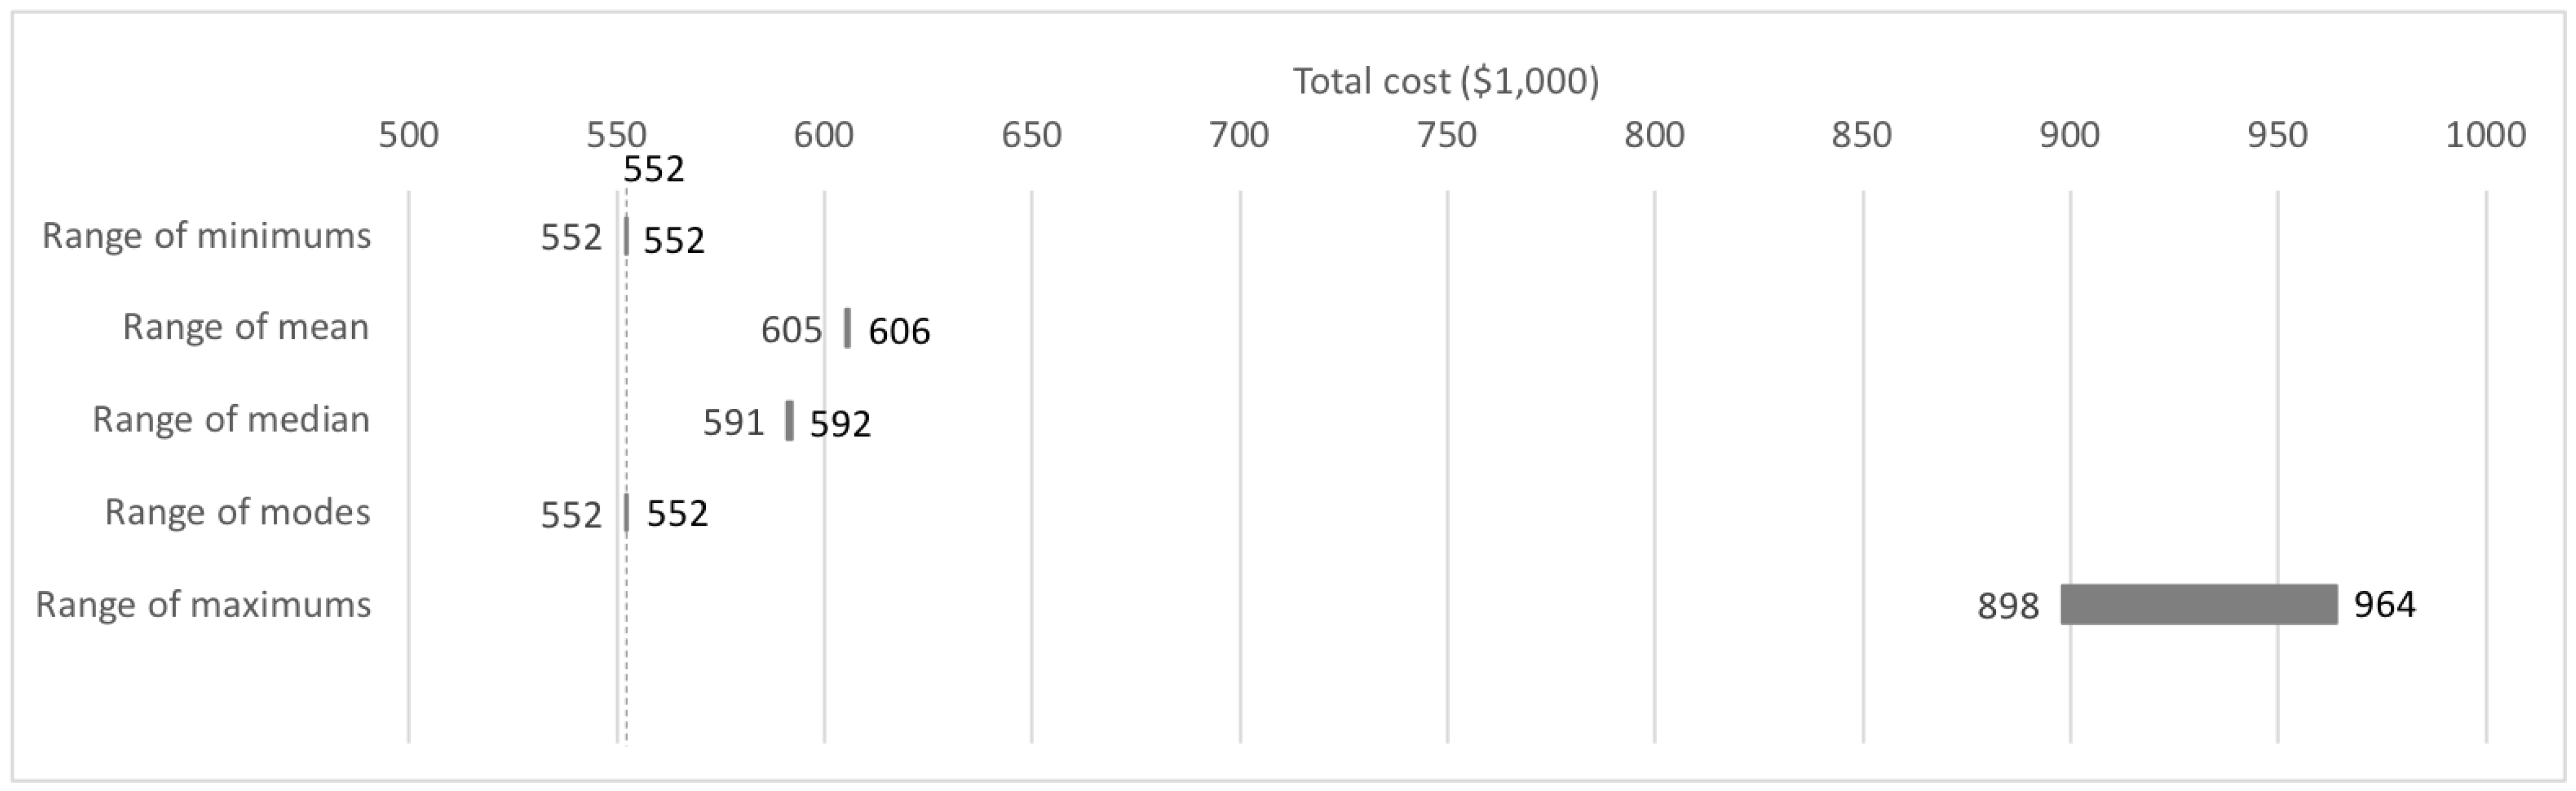
The range values for the variation on the project total cost show no variation except for the range of maximum values (
Figure 4). The range variation of the potential maximum project total cost was
$66 thousand, or 12%, based on the total original cost. The extreme minimum and maximum total costs were
$552 thousand and
$964 thousand, respectively. This extreme maximum value for the total cost indicates the potential for 75% over cost caused by the impact of overlapping risks.
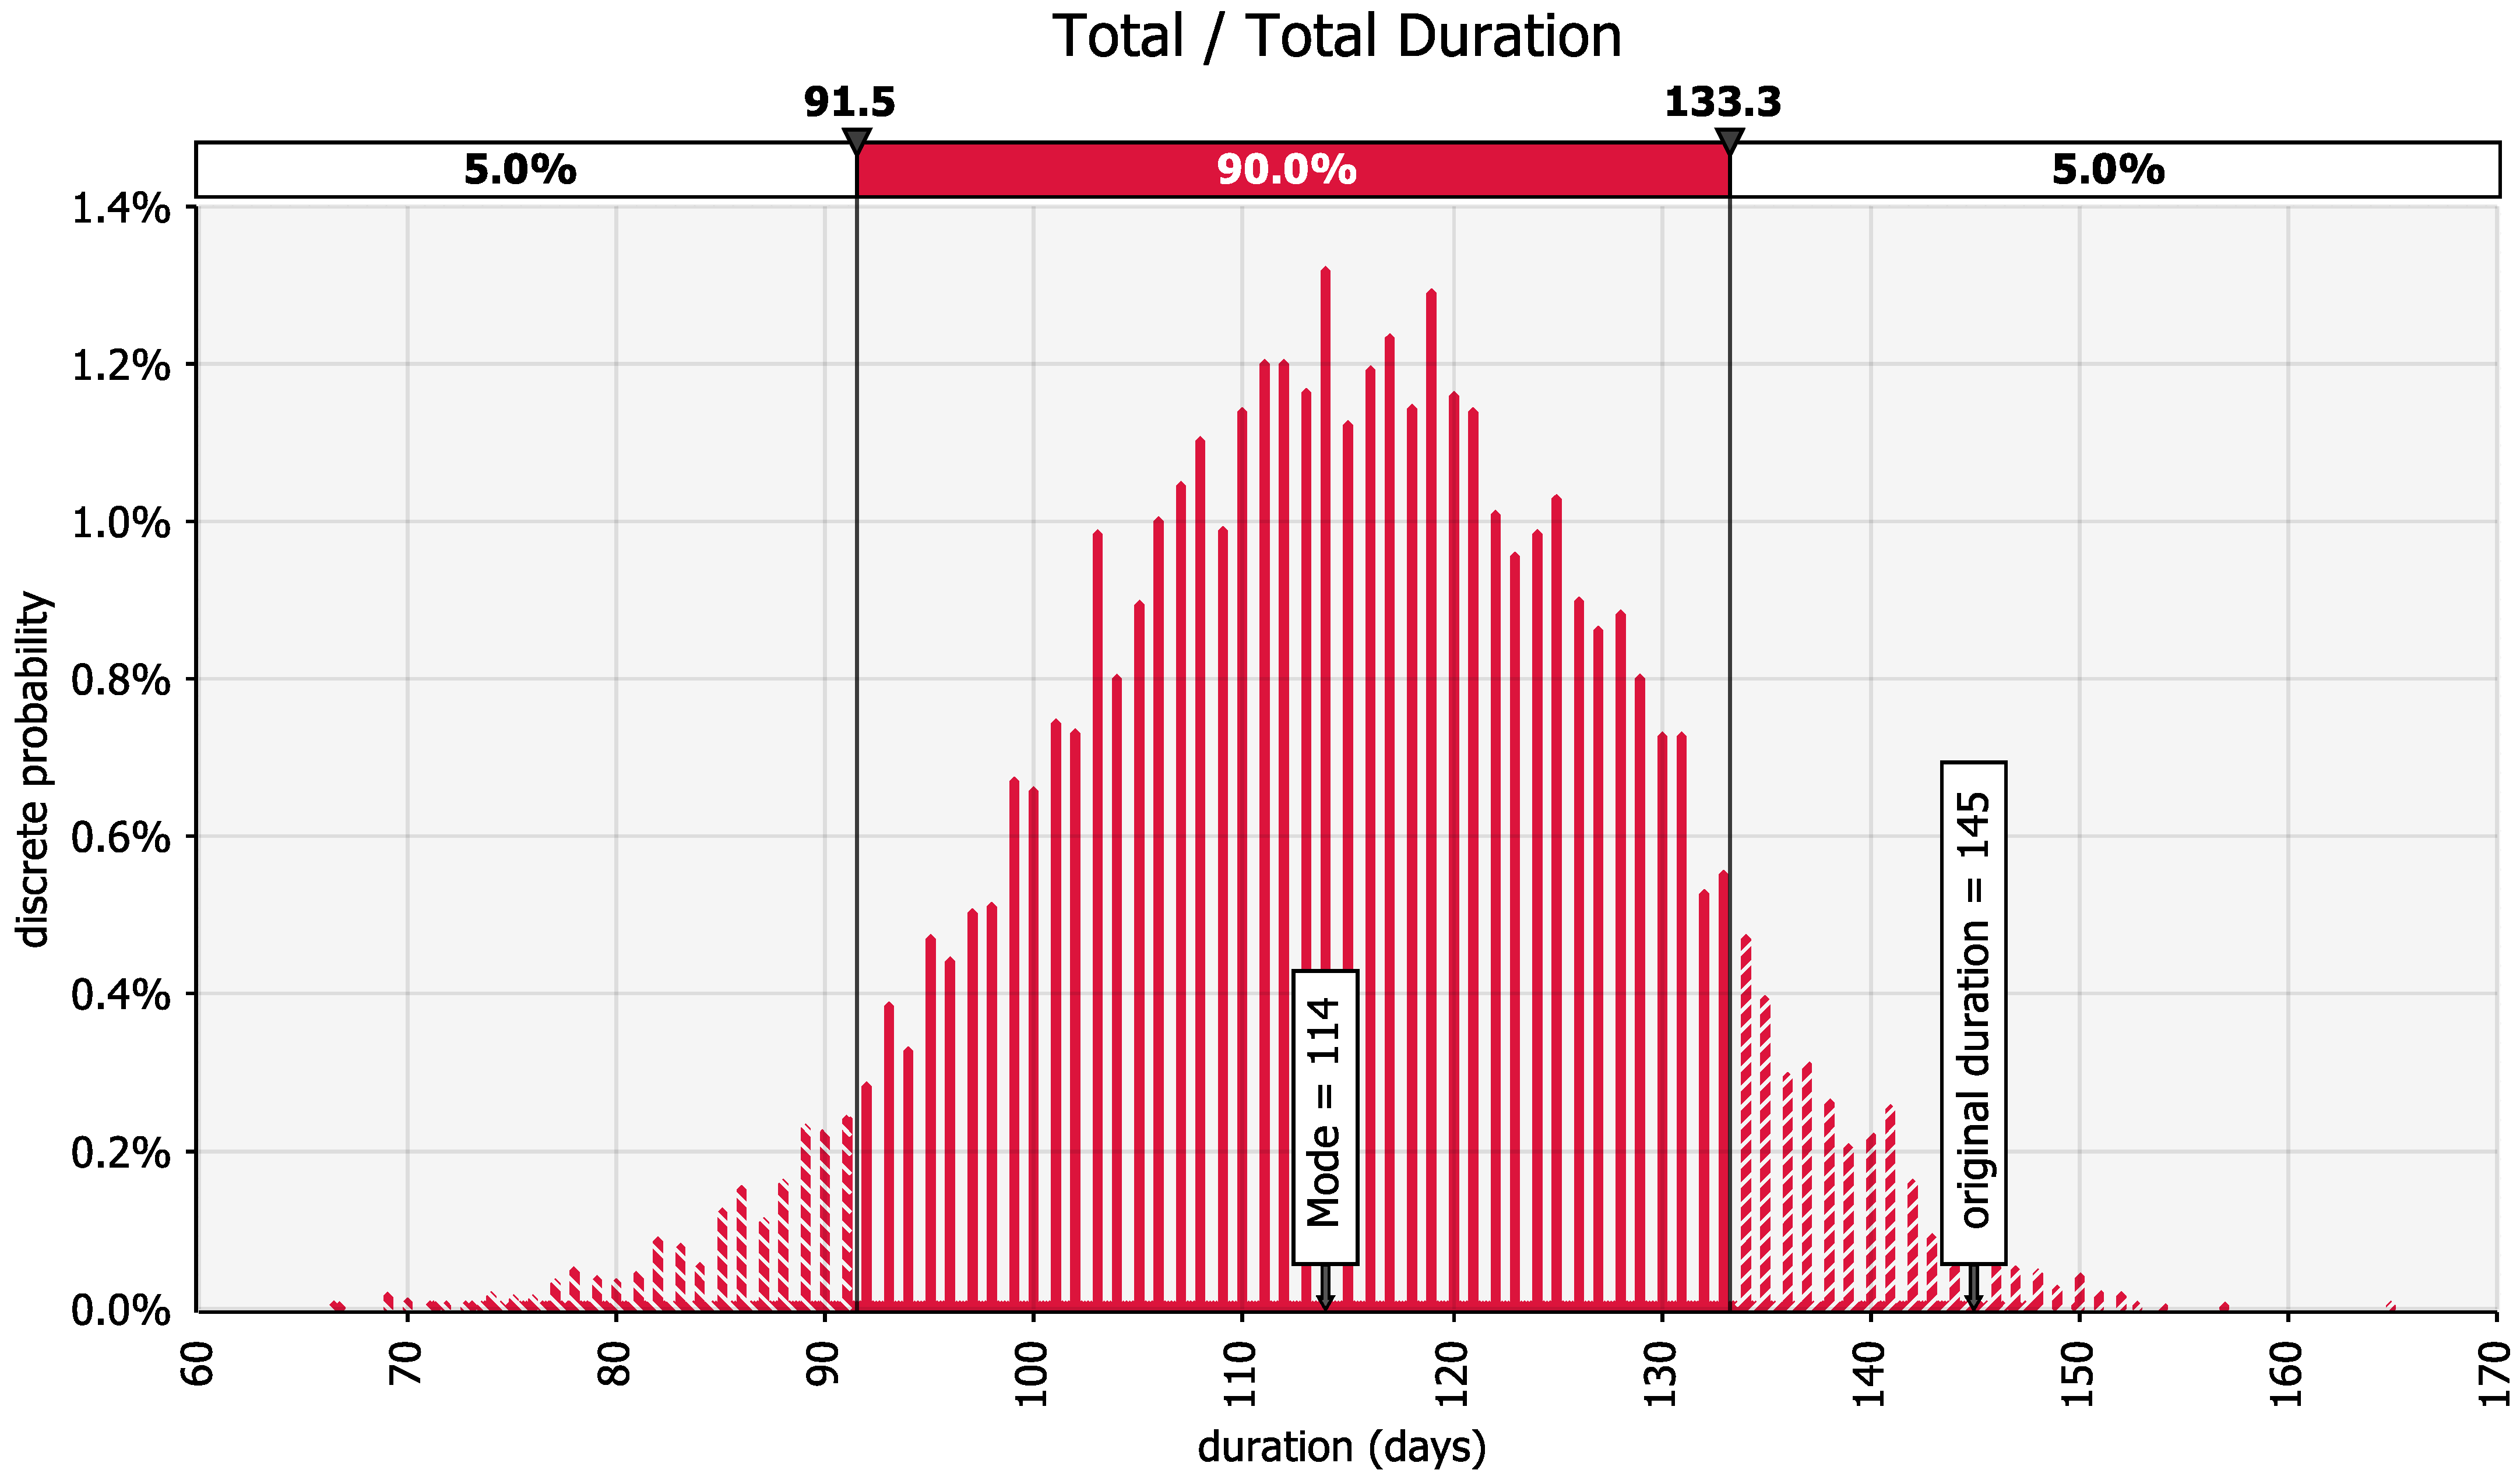
The probability distribution curve showing the likelihood of possible project durations considering the acceleration strategy and the potential occurrence of overlapping risks is presented in
Figure 5. The curve represents the output of only one simulation run. The lower horizontal axis indicates the potential project duration, and the upper horizontal axis indicates the cumulative probability for specific duration intervals. The vertical axis indicates the discrete probability for the potential project durations. Some durations obtained may reflect the occurrence of no risks, but the likelihood of having a total duration inferior to 92 days is only 5%. The curve shows more than a 90% chance of finishing the project up to 133 days and a minimal chance of 0.3% of finishing late after the original duration of 145 days. The chart also shows that 114 days was the project’s most frequent potential total duration. By complementing these results with the results shown in
Figure 3, it is possible to note that the most frequent potential total duration considering all simulation runs varies from 109 to 117 days.
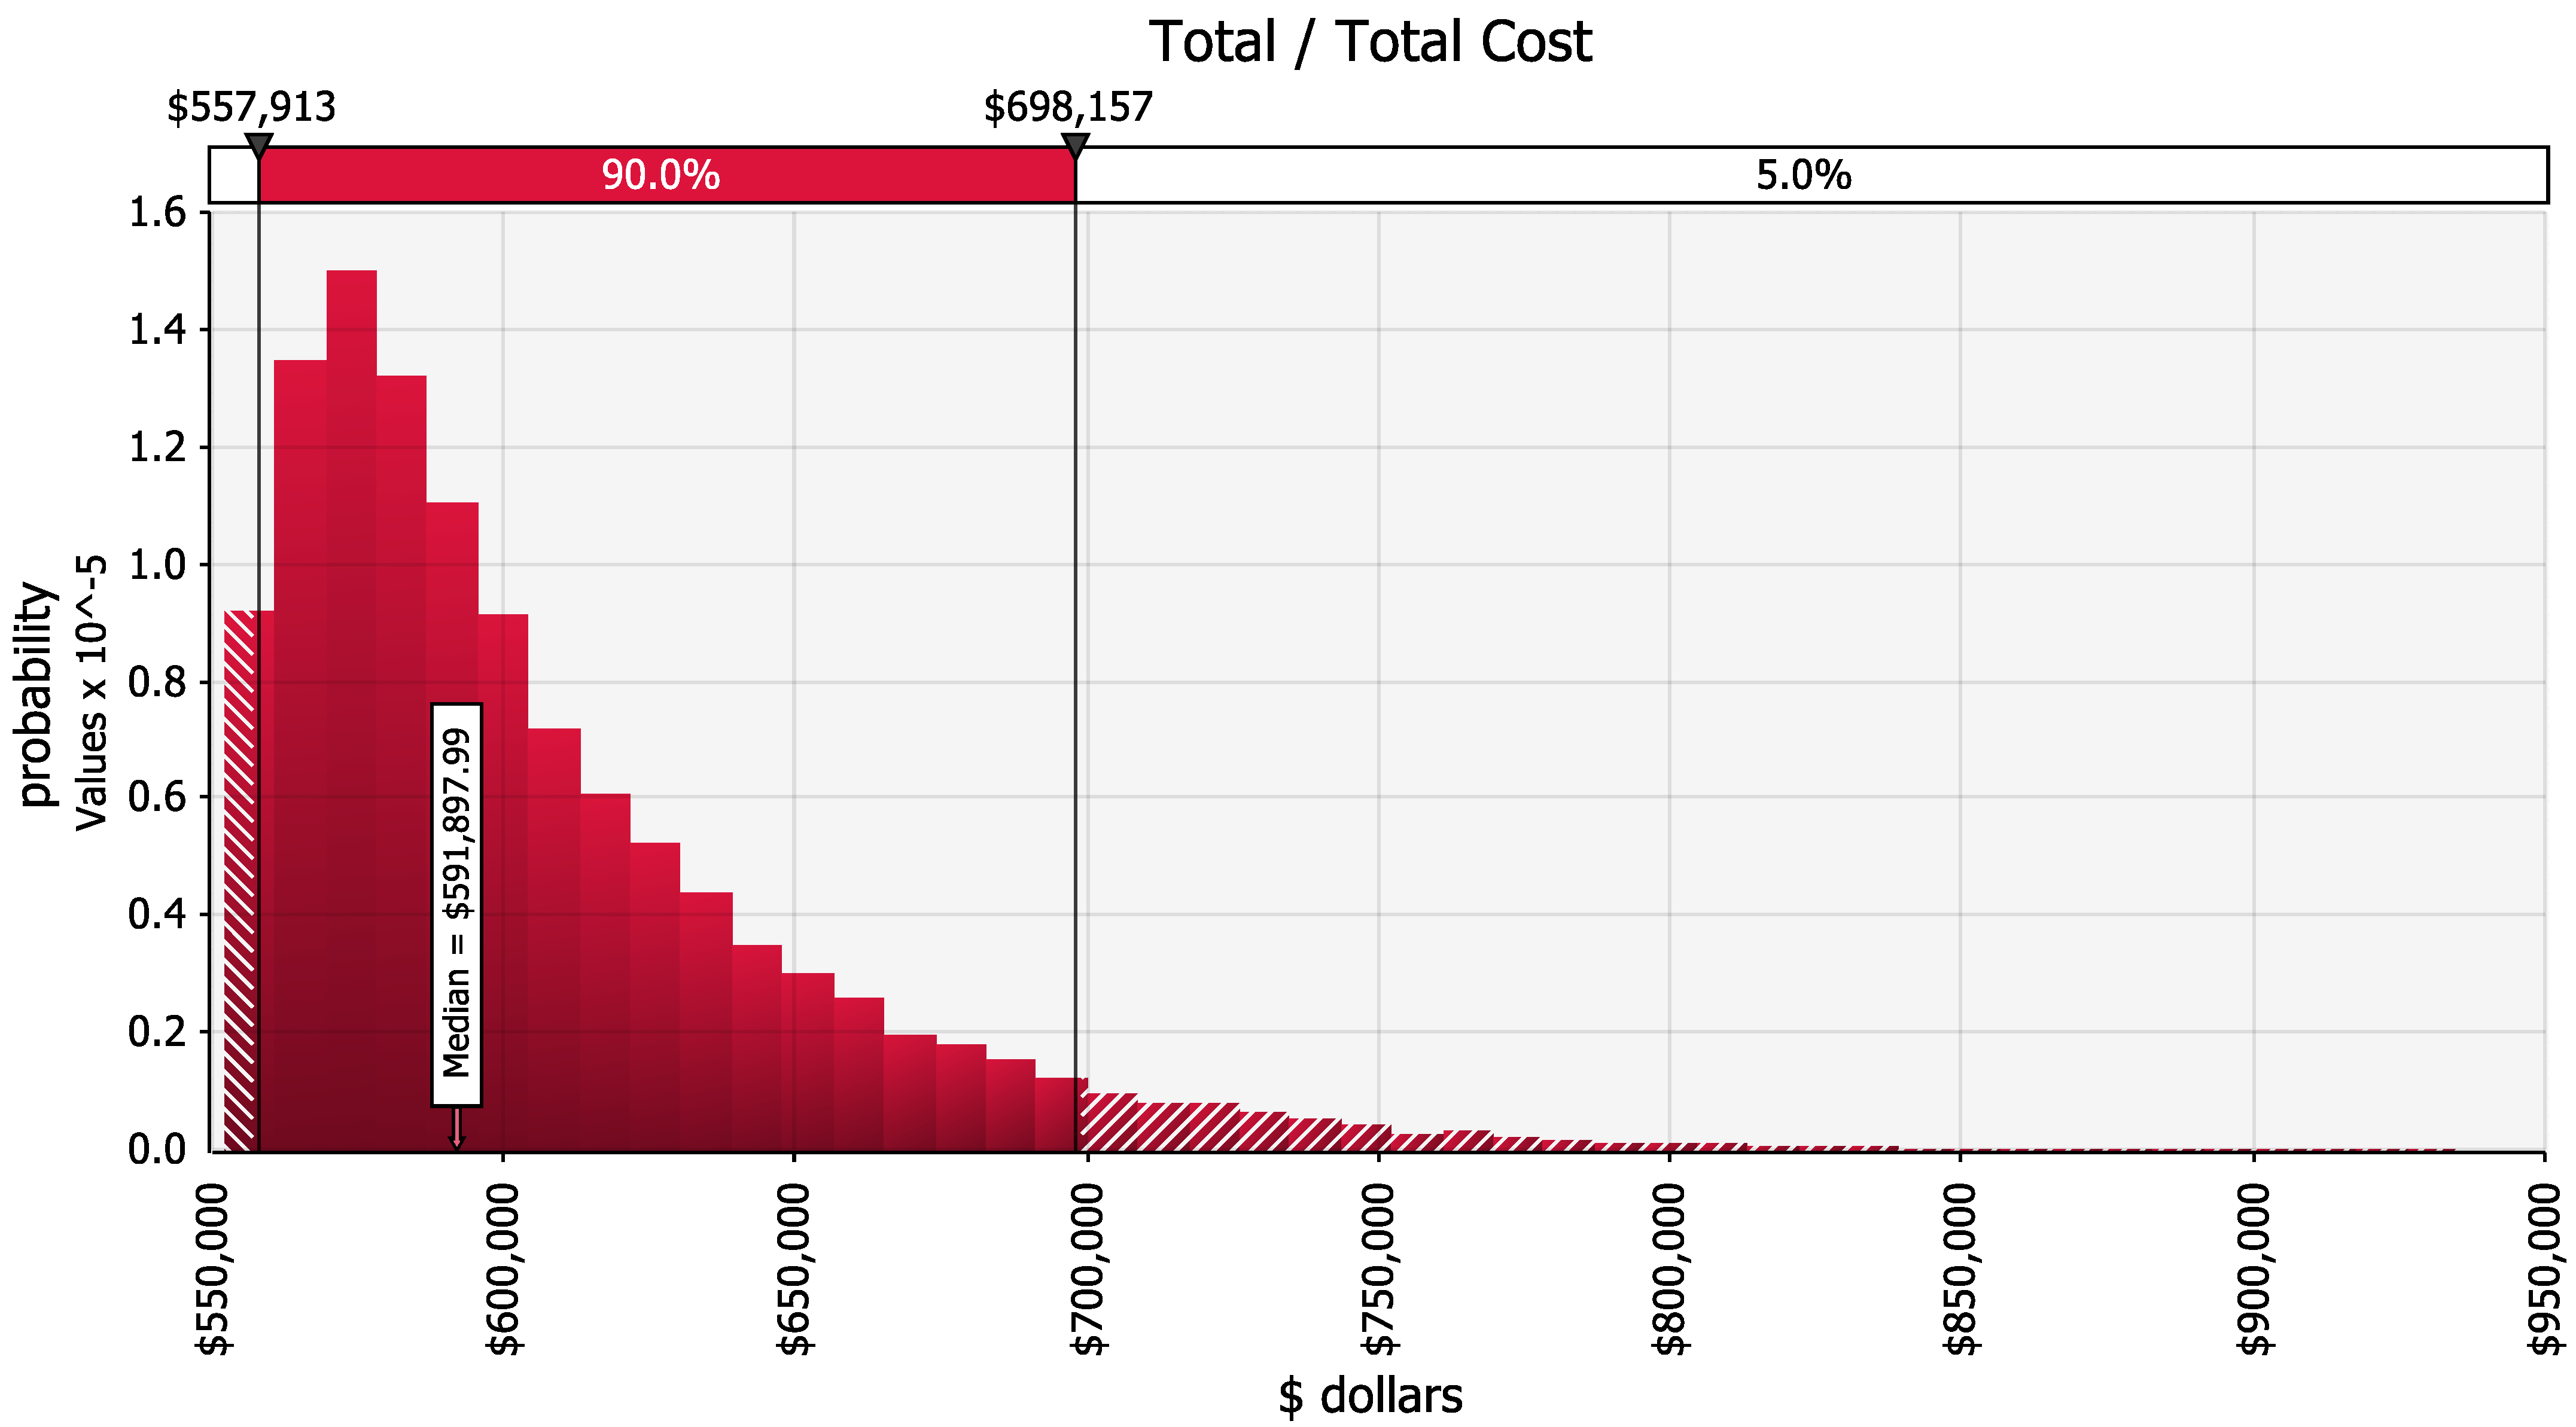
The probability distribution curve showing the likelihood of possible project costs considering the acceleration strategy and the potential occurrence of overlapping risks is presented in
Figure 6. Similar to the total duration probability distribution curve, it represents the output of the single simulation run. The lower horizontal axis indicates the potential project cost, and the upper horizontal axis indicates the cumulative probability for specific cost intervals. The vertical axis indicates the discrete probability for the possible project costs. There is a minimal chance, inferior to 5%, that some costs obtained reflect the occurrence of no risks. The plot shows a likelihood of 90% of chance that the overlapping risk impact could add between
$6 thousand and
$146 thousand to the original cost or up to 27% over cost due to overlapping risks. The median value for the total project cost would be
$592 thousand, representing an increase of 7% on the original cost. There is also a chance of 5% that the total project cost would exceed
$698 thousand, which would be more than 27% over cost.
Table 2 identifies the ranking of the main overlapping risks that caused the most variation in the mean values for the total project duration or cost among the ten simulation runs. This list represents the leading causes of the above effects on the target performance metrics. Risks related to crew interference, construction error, work environment, poor construction productivity, and design change were the leading cause of the impacts. The results show that the top risks impacted different overlapping activities and overlapping degrees. Identifying these risks works as an input to the risk response plan, which the decision-maker should prioritize according to ranking the top risks.
The results show that six overlapping risks related to the 25% overlapping degree and six risks related to the 75% overlapping degree of different pairs of activities caused more variation in the project time. None of the overlapping risks associated with any 50% overlapping degree was the cause of the mean duration variation. The risks were more concentrated in the middle and end of the project. The two overlapping risks that caused more deviation in the mean of the project time were “P8-25-R13-Work environment” and “P8-25-R3-Crew interference”. Both risks were associated with the 25% overlapping degree of the activities tape and finish drywall two sides and paint interior walls, soffits, hard lids, and door frames (Pair 8). Risks related to crew interference prevailed in the list of impact causes.
For the causes of impact on cost, the risks that caused more variation of the mean of the total project cost, only one risk was related to the 25% overlapping degree, two risks were related to the 50% overlapping degree, and eight risks associated with the 75% overlapping degree. The impact on cost was more related to the initial activities of the project, Pairs 1 and 2. The cost impact is also more associated with design change and construction error risks.
4.2. Optimum Project Overlapping to Minimize the Overlapping Risk
The optimum overlapping combination results are shown in
Table 3. The results for the optimum project overlapping degrees without any risk show all overlapping pairs at the 75% overlapping degree except for P5 at 50%. The total duration would be 54 days, costing
$552 thousand in this case. The optimization process to find the optimum project overlapping degrees with the potential occurrence of risks generated four possible best trials and trial 36 as the best trial. The best trial result shows a combination of different overlapping degrees. In this case, the project may have an estimated total duration of 97 days, lower than the constrained target duration. However, the project may experience 0.4% over cost.
4.3. Discussion
The risk analysis process demonstrated in this study for fast-track construction projects shows that the range of the total overlapping risk impact on duration and cost may differ significantly. These differences can be noticed when considering the total impact amount, the chance of attaining the project target goals, and the extreme impact cases. The total overlapping risk impact may be more significant on cost than duration. Most statistical measures indicated that the total impact on duration might not jeopardize the target duration. For example, the minimum, mean, median, and mode are all less than the target duration. However, some statistical measures indicate that the overlapping risk impacts the target cost. The total cost mean and median are all higher than the target total cost, representing an over cost from 7% to 10%.
The chances of attaining the project target goals of fast-track duration and cost are opposites. The project may have a probability higher than 99% of achieving the fast-track goal of finishing it sooner than the target date. Conversely, the project may have a significant chance lower than 1% of attaining the target cost, with the possibility of finishing the project in a specific range of cost that can reach over cost up to 27%.
The results also showed extreme impact cases—those events with a low probability but high impact. In the extreme case of impact on duration, the project may experience a duration increase from 7% to 14%. For the cost, the extreme case may cause the project to experience an over cost from 63% to 75%. Those are cases where the project experiences many risks with high consequences. These low probability with high-impact risks are generally not prioritized during risk assessment. However, we agree with a line of thought in risk management that decision-makers should verify these instances and decide whether mitigation actions can be applied.
Discussing aspects related to the top overlapping risks that may impact the total project duration or cost, they differ when considering the target performance metrics, the project time phase, and the overlapping degree. It is essential to notice that all top risks will impact duration and cost. Some types of risk may affect only duration or cost, but not both. In the case demonstrated, one single risk (P8-25-R13-Work environment) may impact both duration and cost. In this case, different mitigation strategies may apply.
We also noted differences in the project time phase and overlapping degree. The overlapping risks that may impact the project duration are mainly located in the late overlapping pairs (P7 to P9). The risks affecting the project cost are more concentrated in the early activities (P1 and P2). However, it may not be a rule for every project. The risks that may impact the project duration are associated with 25% and 75% overlapping degrees, impacting the project cost more concentrated at the 75% overlapping degree.
Ideally, the proposed analysis should occur during the planning and execution project phases as a proactive action. During the planning phase, the application would allow the project manager to look at the desirable duration, investigate specific risks that may occur, and plan to mitigate them. The project manager can also look at the optimum overlapping combination to analyze possible risks and plan to mitigate them. The application, during the execution phase, would allow the project manager to make an informed decision to adjust the project accordingly and not in a blind way. For example, for the crew interference risk that appears in the risks list (
Table 2) in the top second and third positions, the project manager may decide not to apply overlapping in Pair 8 since the risk could cause a significant impact already with 25 % of overlapping degree. In the case of Pair 7, the action could be to decrease the amount of overlapping. However, the proposal of specific mitigation actions was beyond the objective of this study.
5. Conclusions
This study proposes a risk simulation model for fast-track projects, considering that different risks with different characteristics (i.e., probability of occurrence and impact) may occur for various degrees of overlapping. Applying a Monte Carlo simulation and an optimization process, it was found that overlapping risks can impact duration and cost in very different measures. Moreover, the optimum overlapping combination to provide the lowest threat to the acceleration strategy will combine different degrees of overlapping.
The results suggest that overlapping risks have a high potential impact on the total cost, although with a high probability of attaining the target duration. The probability of attaining the desired fast-track project performance metrics (e.g., duration and cost) under different overlapping risk scenarios would be 99.7% for the project duration and a chance inferior to 5% for the project cost. The most probable duration and cost would be 114 days and $592 thousand.
Eight specific risks were the most significant overlapping risks that affected the total duration, cost, or both in six distinct overlapping pairs. The distinct overlapping risks were work environment, design change, crew interference, construction error, damage by others, poor construction productivity, crew member shortage, and impact on the end of the project. The most affected activities were P1, P2, P4, P7, P8, and P9.
Finally, the optimal degree of overlapping to obtain the minimum total cost subjected to a duration less than the original has combined different overlapping degrees. The overlapping degree suggested for each pair of overlapping (P1 to P9) to minimize the over cost would be P1 (50%), P2 (25%), P3 (75%), P4 (75%), P5 (25%), P6 (25%), P7 (25%), P8 (75%), and P9 (50%). This combination could produce 97 days but with a total cost of $554 thousand.
The development and findings of this study agree with previous studies that aimed to model the impacts on the project caused by the acceleration and contrast with some of their views. A common view shared with prior studies cited is that activity overlapping creates other risks or uncertainties that might negatively impact time and cost [
8,
10,
11,
13,
14,
15,
27,
28,
29,
30,
31,
32]. In contrast, our results question the single consideration of rework [
8,
10,
11,
13,
15,
27,
28], the linearity of the impacts caused by risks [
10,
11], and the limitation that, on average, a project could not be accelerated more than 25% of its original duration [
14]. These studies also indicate different techniques for simulating and optimizing accelerated schedules considering some impacts. Among these are Monte Carlo simulation [
8,
13,
14,
28], Constraint Programming [
10,
11], Mixed-Integer Linear Programming [
27], and Genetic Algorithm [
29,
30,
31,
32]. The choice of the most suitable model must be evaluated by considering aspects such as the problem context, computational efficiency, and expertise to develop the model, to name a few.
There are four main differences between the proposed model and other studies. First, the model considers the opinion variation among team members about the risks’ probability of occurrence and impact using distributions as input values, which also can be adjusted accordingly during the project. It considers specific risks for each potential overlapping degree and not only rework as previous studies (e.g., [
8,
10]). Each risk has its probability of occurrence and impact value, not an estimated value as a proportion of the activity duration or cost. Finally, it considers the relationship among risks (in parallel or series) proposed by Chapman [
34] but not considered in previous risk assessment models.
In addition, the proposed model may bring some reflections to accelerating construction projects through overlapping. For instance, when accelerating a project, we may miss the perception that we can introduce new risks. Moreover, we cannot realize that different overlapping degrees could experience various risks and, most importantly, these new risks could jeopardize the duration and cost targets.
Worth discussing and reflecting on in future studies and risk management practice is the viewpoint of one validator about using such a model in his/her practice. The validator based his/her justification on two aspects: (1) commercial construction projects are highly complex, customized, and unique, and (2) large construction companies do not adopt a formal risk management process because of these previous characteristics. Despite this view, all construction professionals who participated in this work communicated that they never thought that different risks could arise due to overlapping degrees. This study can offer the following answers to the validator’s statements. First, being unique is one of the intrinsic characteristics of a project. On the one hand, the complexity and differences among projects are also why a decision-maker should adopt a risk management process to assess and treat threats to the project objectives proactively. The risk assessment model does not imply or agree that risks are the same for all construction projects, but the model can be applied to any project assessing the specific risks. On the other hand, formalizing a risk management process in simple projects may not be worth it if it is not part of the company culture. The time and cost to be invested for the risk management implementation may be longer and more expensive than the activity itself. One last thought, this study agrees that construction companies do not fully formalize risk management. However, it does not subscribe to the viewpoint that large construction companies do not adopt a formal risk management approach.
Future studies can build in two different directions. One direction could be towards the decision-making process, investigating reflection questions, such as how do we make decisions regarding activity overlapping, what types of uncertainty variables do we consider when overlapping, or how can modeling the risk variable for different overlapping degrees help decision-making? The model for overlapping risk assessment can be large and complex, and creating large and complex Monte Carlo models can be challenging. Monte Carlo simulation can also be computationally inefficient, which can be worsened in large models. Another direction would be improving models and algorithms to optimize the project acceleration considering various risks and uncertainties that could impact the acceleration strategy.


