
The BosWash Infrastructure Biome and Energy System Succession


Abstract
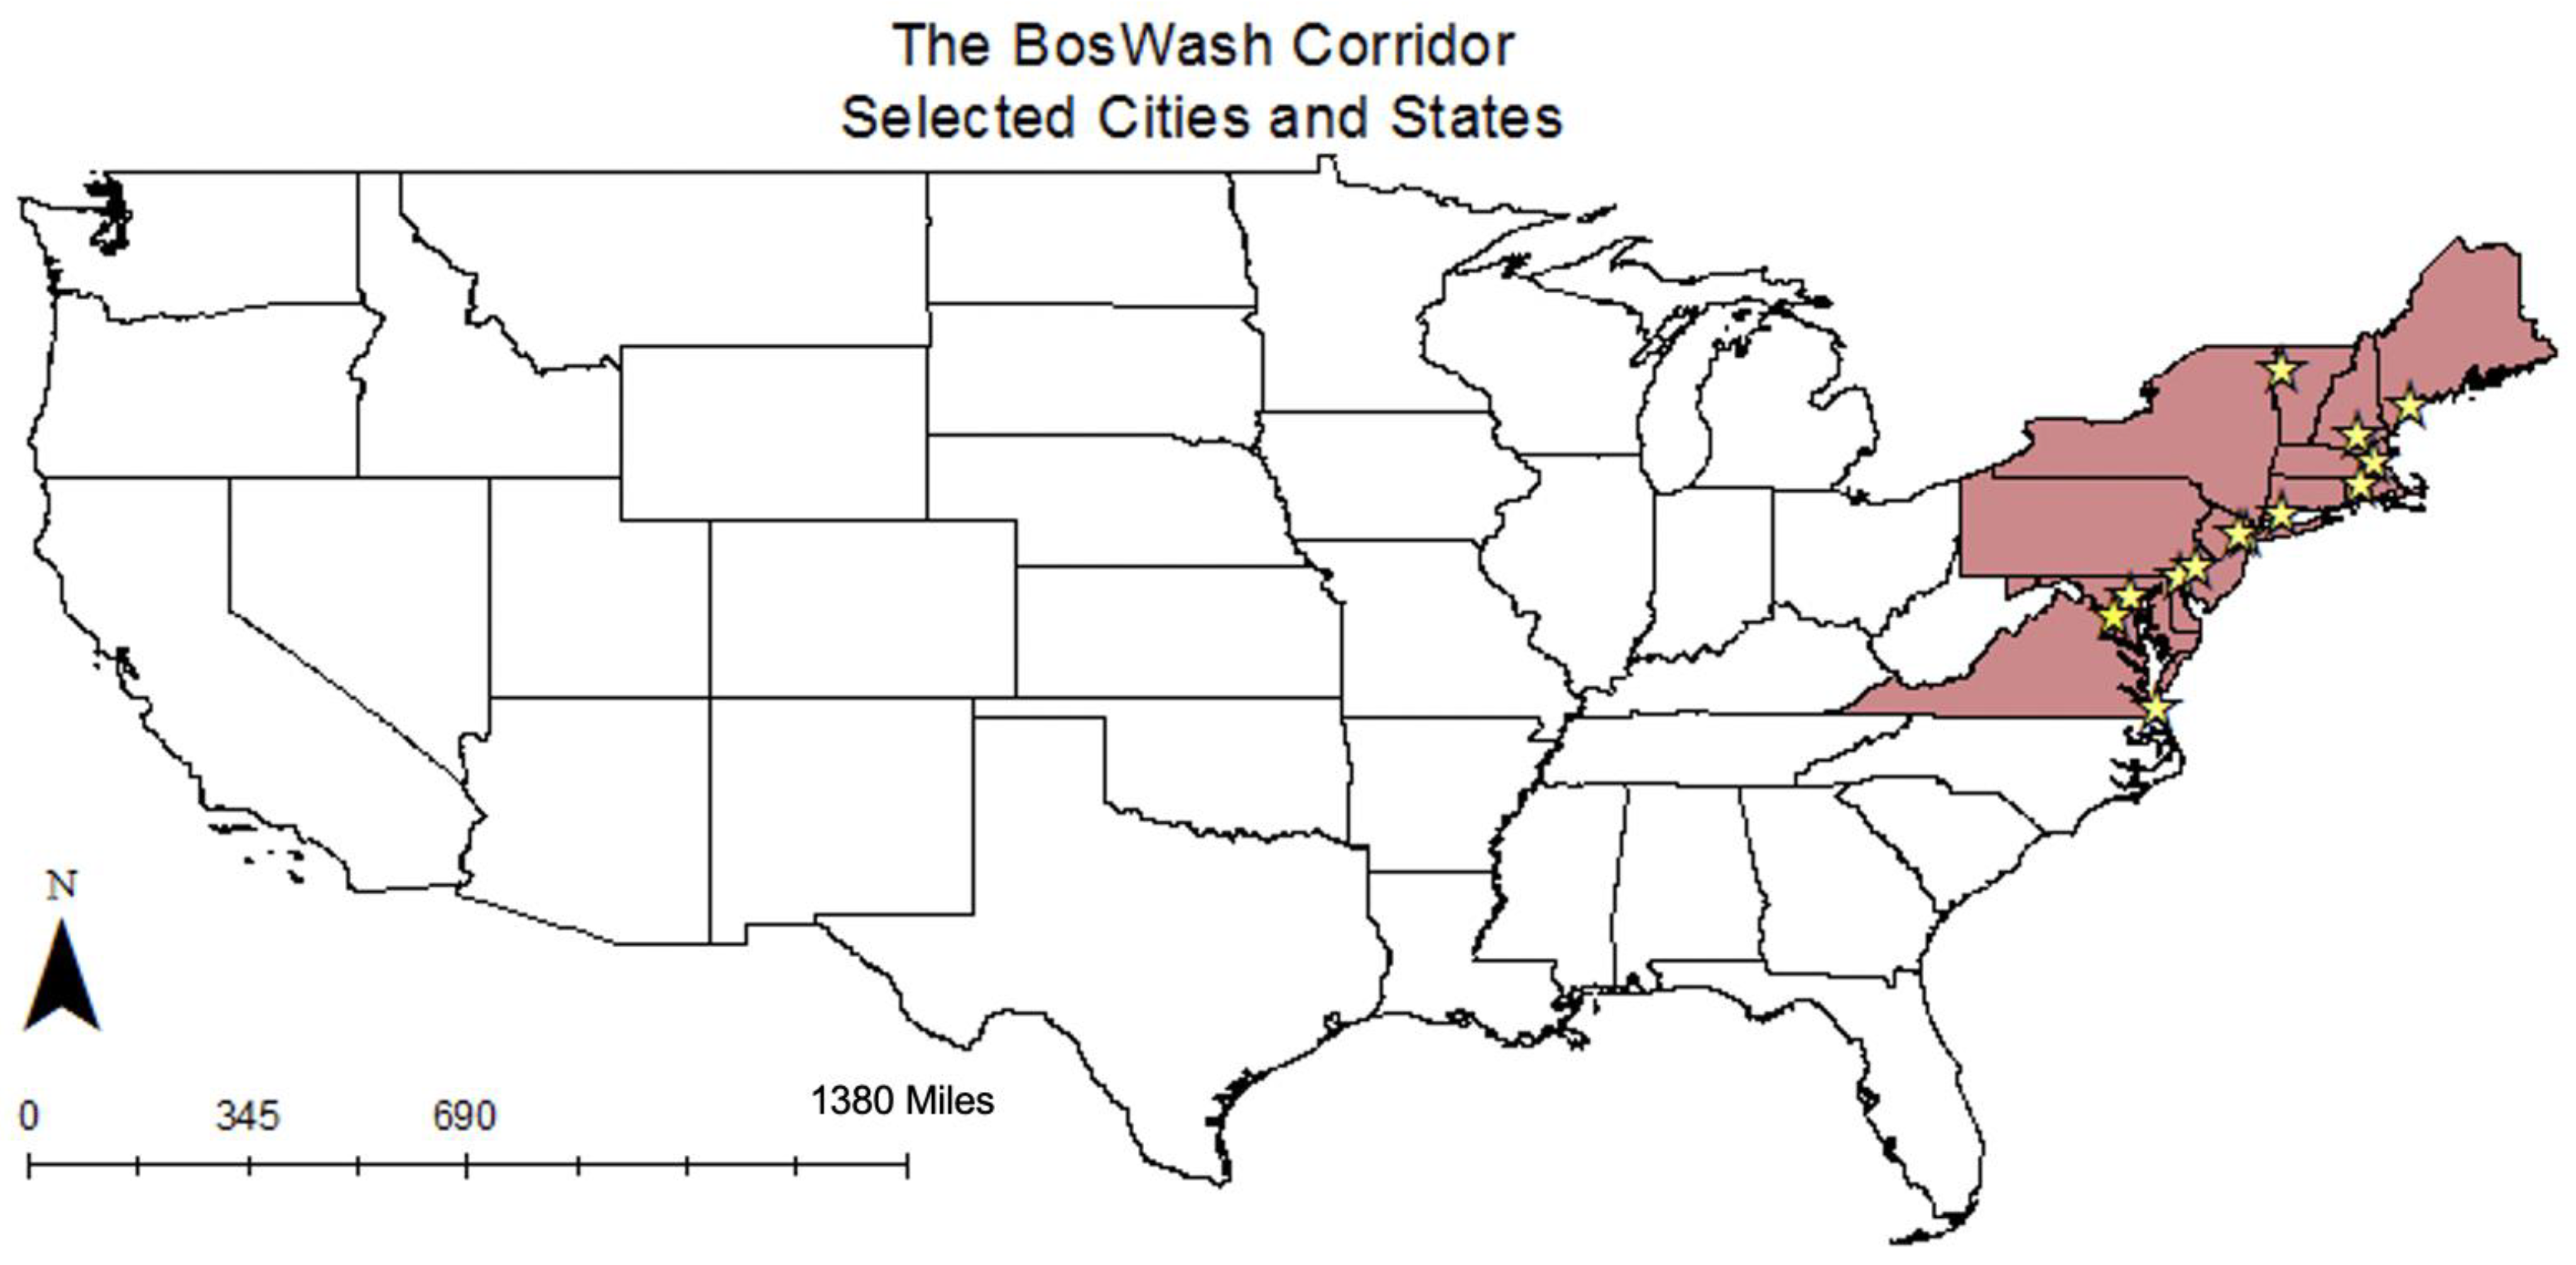
:1. Introduction—The BosWash Corridor
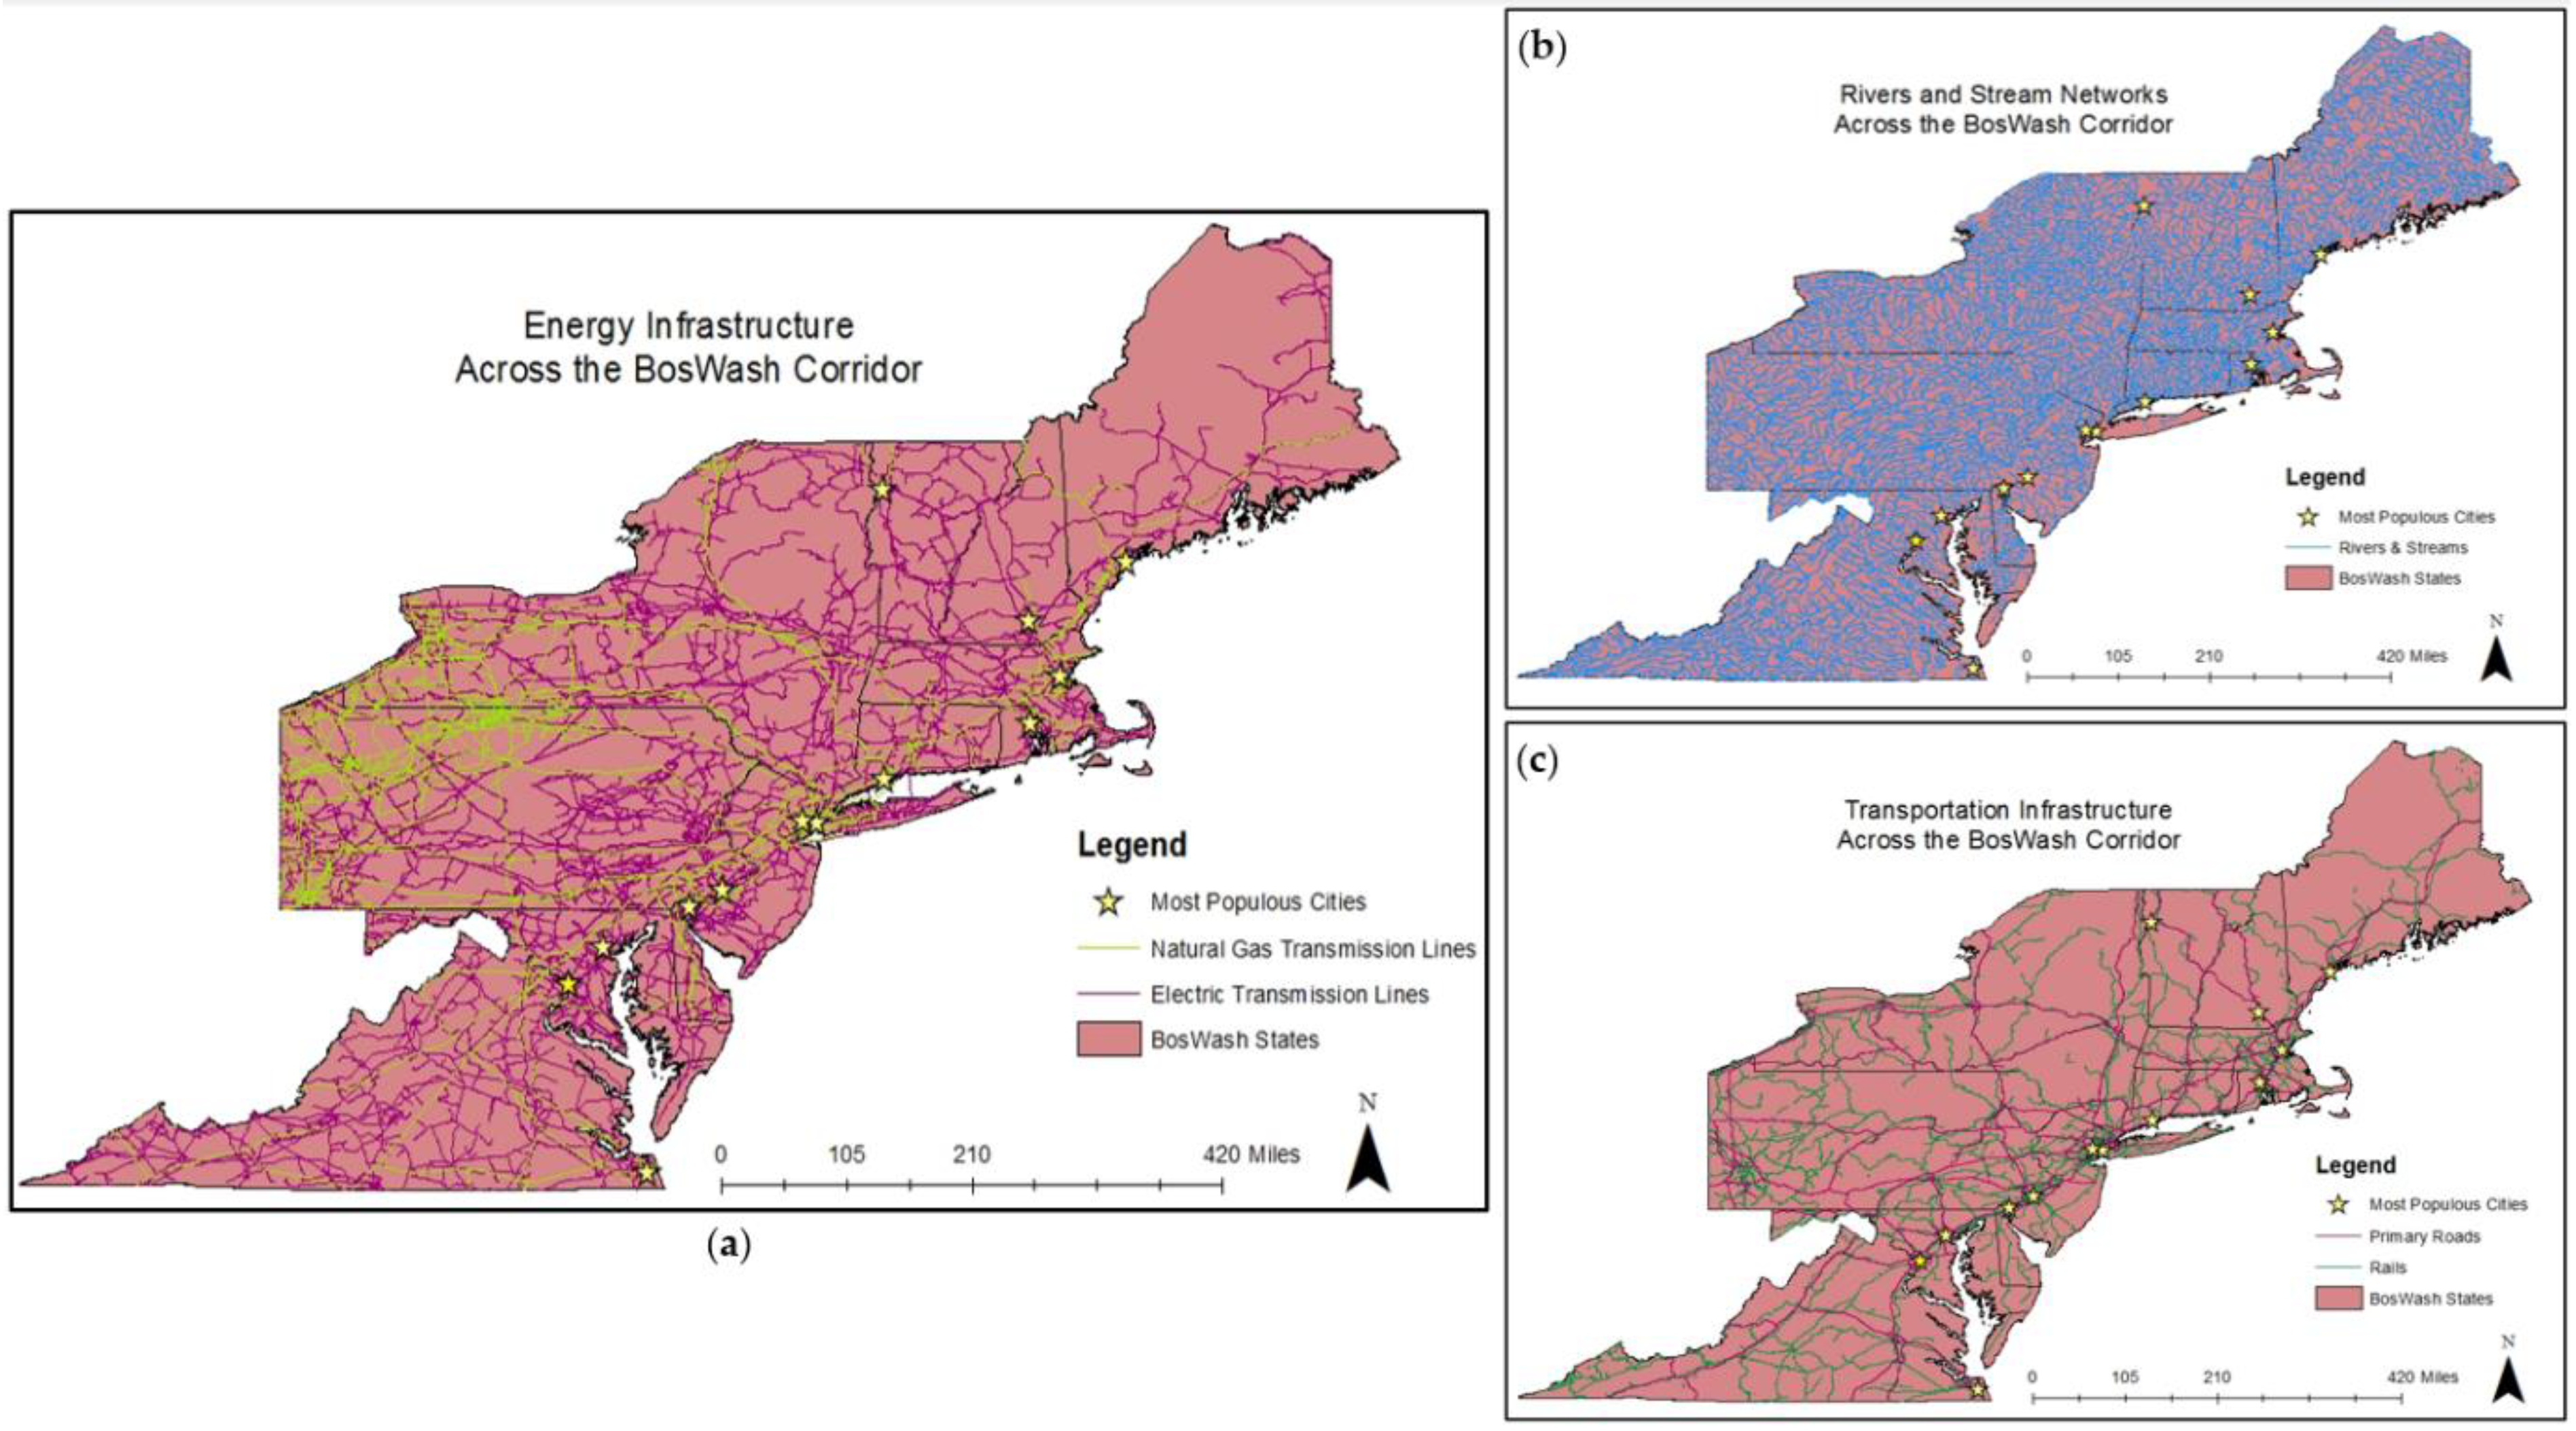
1.1. The BosWash Infrastructure Biome
1.2. Political Ecology of the Infrastructure Biome
1.3. The Natural Gas Case Study
2. Materials and Methods
- Develop baseline data of the physical state of the natural gas infrastructure;
- Analyze urban demographics that are associated with natural gas utilities;
- Contextualize energy transition within the various state/city CAP targets.
2.1. Area of Study
2.2. Physical State of Pipeline Infrastructure
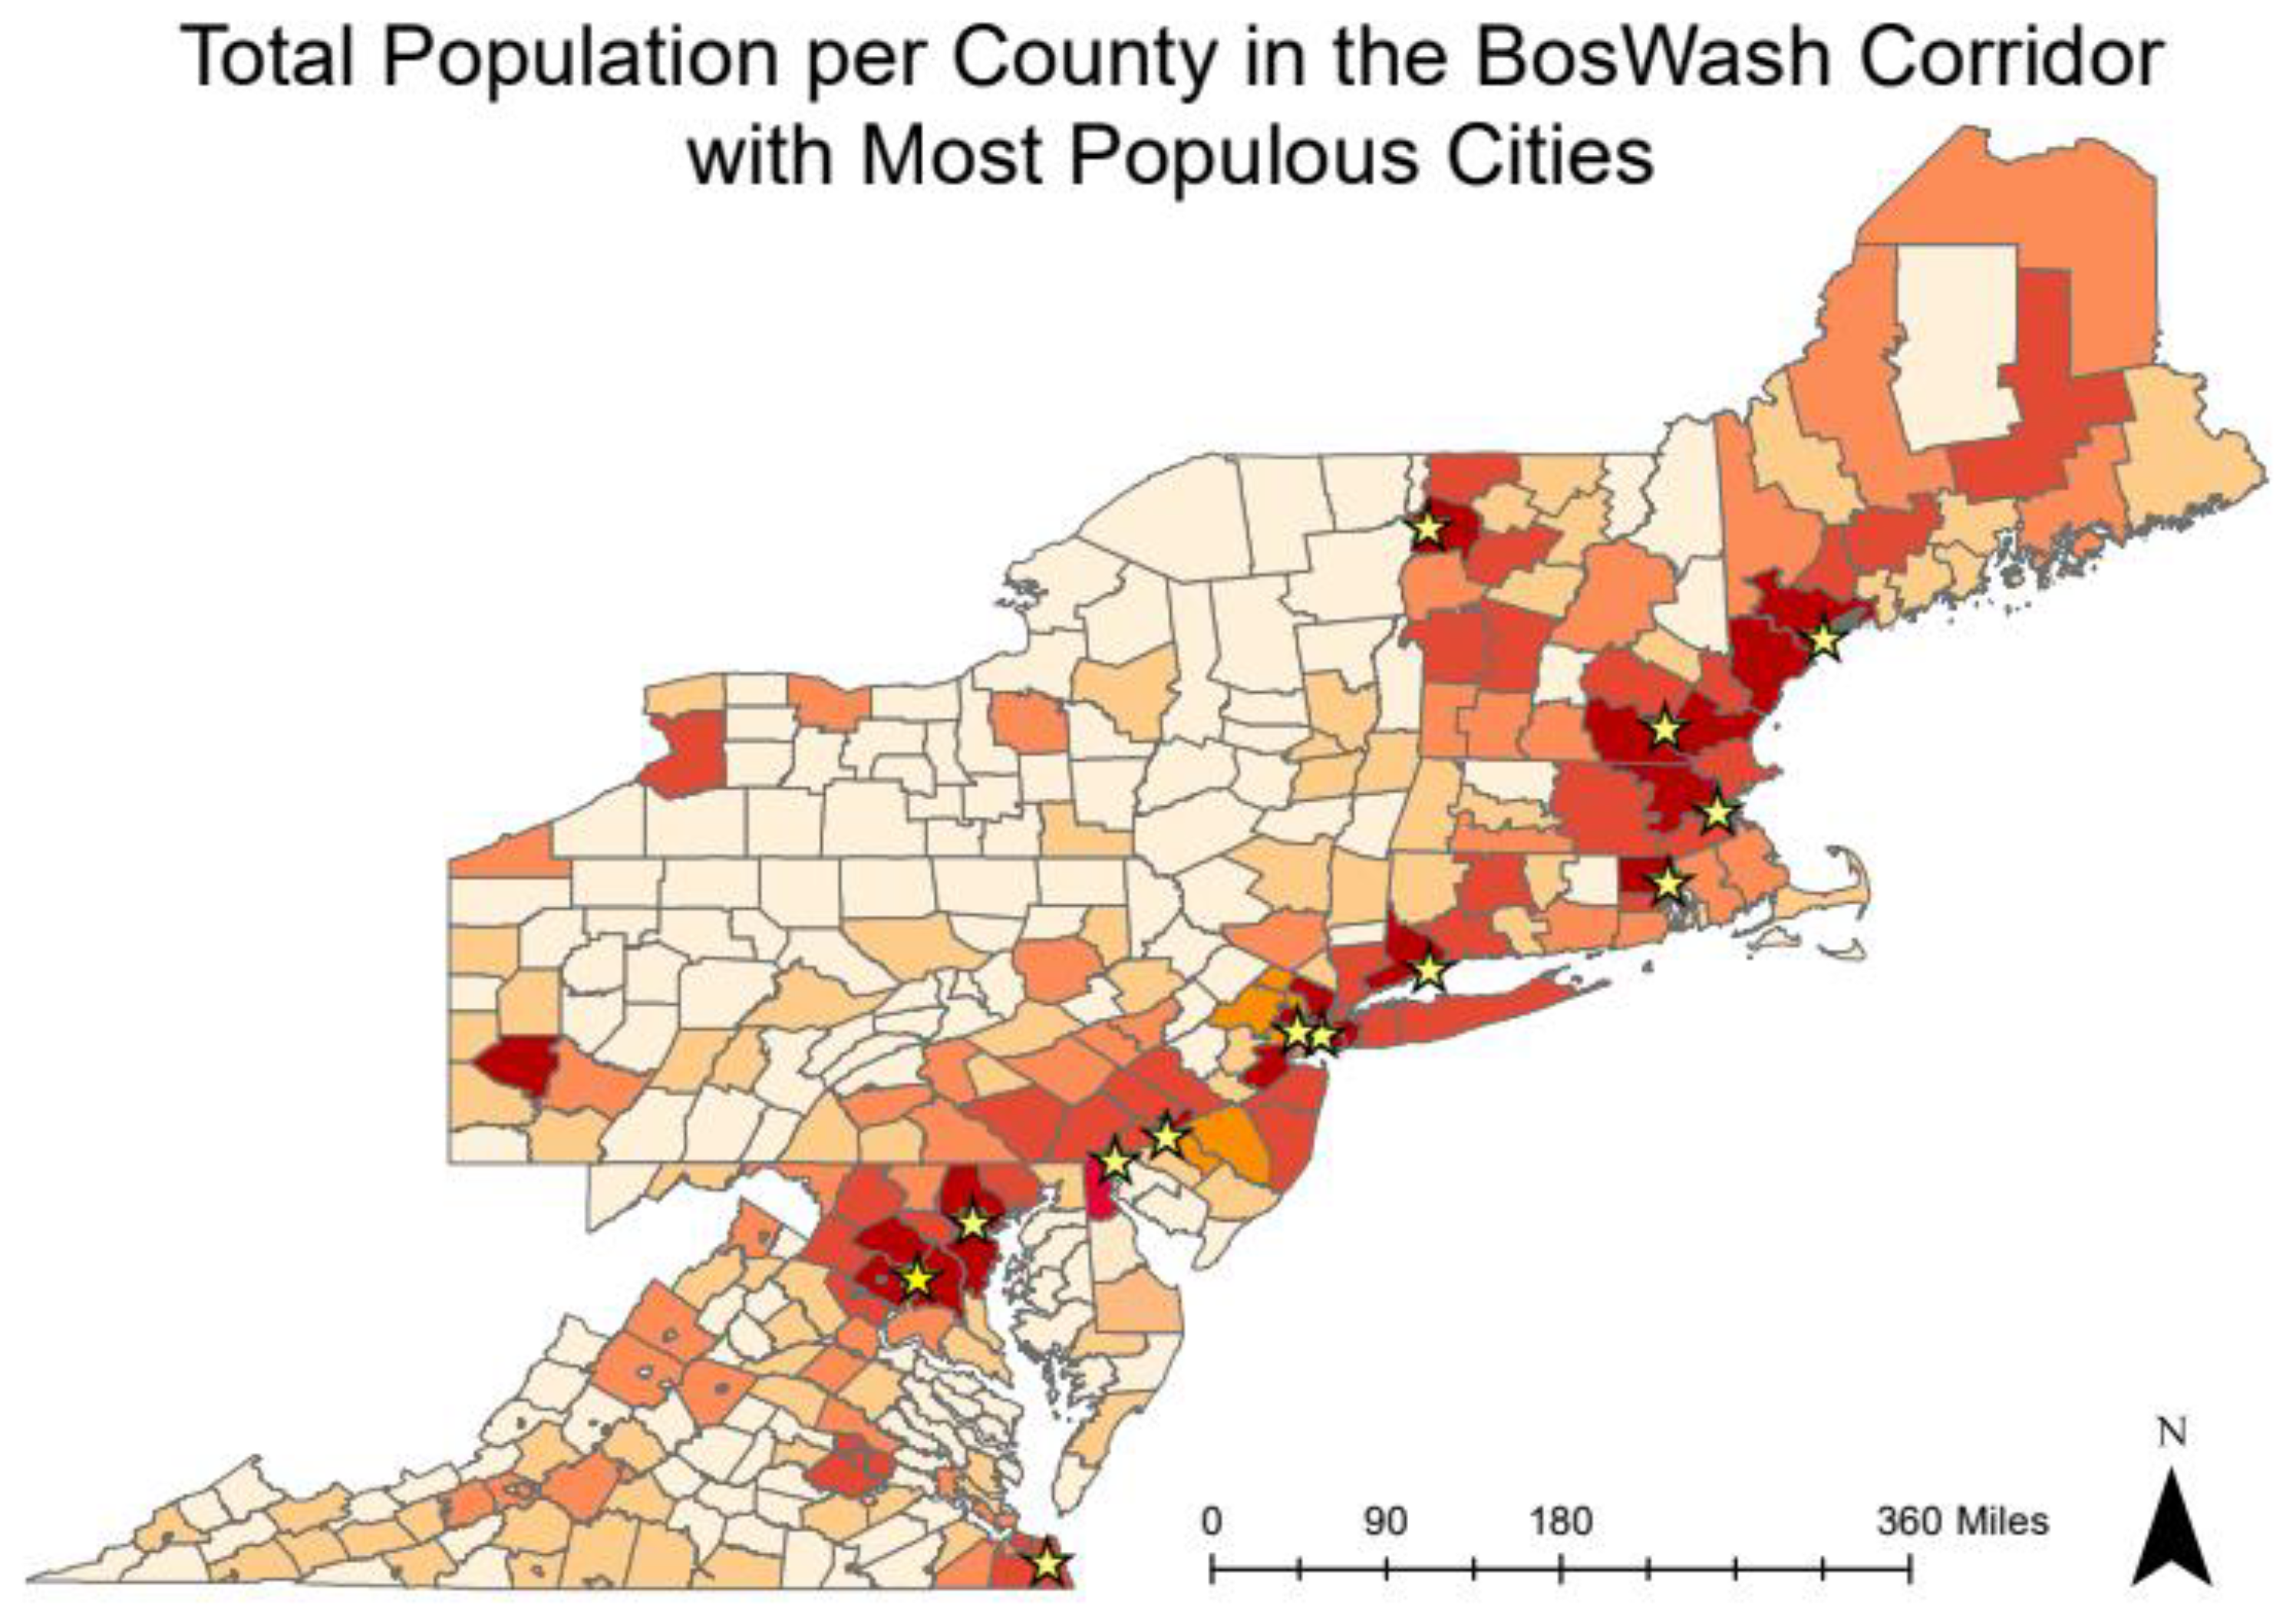
2.3. Social Vulnerability across the Region
2.4. State and City Climate Action Plans
3. Results & Discussion
3.1. The Physical Context—Natural Gas Infrastructure
3.2. Regional Social Vulnerability
3.3. Policy Context across the BosWash Corridor

| City | 2020 Progress to Reach GHG Emission Reduction Target | 2025 Progress to Reach GHG Emission Reduction Target | 2030 Progress to Reach GHG Emission Reduction Target | 2040 Progress to Reach GHG Emission Reduction Target | 2050 Progress to Reach GHG Emission Reduction Target |
|---|---|---|---|---|---|
| Portland, ME, USA | 20% | 30% | 40% | 60% | TARGET 80% (2017 baseline) |
| Manchester, NH, USA | -- | -- | -- | -- | -- |
| Burlington, VT, USA | 5% | TARGET 10% (2010 baseline) | -- | -- | -- |
| Boston, MA, USA | 25% | 37.5% | 50% | 75% | TARGET Carbon neutral |
| Providence, RI, USA | 25% | 37.5% | 50% | 75% | TARGET Carbon neutral |
| Bridgeport, CT, USA | TARGET 10% (1990 baseline) | -- | -- | -- | -- |
| New York City, NY, USA | 25% | 37.5% | 50% | 75% | TARGET Carbon neutral |
| Newark, NJ, USA | 20% | TARGET 26–28% (2006 baseline) | -- | -- | -- |
| Philadelphia, PA, USA | 20% | 30% | 40% | 60% | TARGET 80% (2006 baseline) |
| Wilmington, DE, USA | 13.3% | 19.96% | 26.6% | TARGET 40% (2008 baseline) | -- |
| Baltimore, MD, USA | 15% | TARGET 30% (2007 baseline) | TARGET 60% (2007 baseline) | TARGET 100% (2007 baseline) | -- |
| Virginia Beach, VA, USA | -- | -- | -- | -- | -- |
| Washington DC, USA | 26.6% | 53.3% | TARGET 80% (2006 baseline) |
4. Policy Recommendations
5. Conclusions
Author Contributions
Funding
Institutional Review Board Statement
Informed Consent Statement
Data Availability Statement
Conflicts of Interest
References
- Khan, H.; Wiener, A.J. The Year 2000: A Framework for Speculation on the Next Thirty-Three Years; Hudson Institute: New York, NY, USA, 1967. [Google Scholar]
- Rodrigue, J. The Geography of Transport Systems, 5th ed.; Routledge: London, UK, 2020. [Google Scholar]
- Beiler, M.O.; McNeil, S.; Ames, D.; Gayley, R. Identifying resiliency performance measures for megaregional planning: Case study of the transportation corridor between Boston, Massachusetts, and Washington, D.C. J. Transp. Res. Board 2013, 2397, 153–160. [Google Scholar] [CrossRef]
- Gottmann, J. Megalopolis—The Urbanized Northeastern Seaboard of the United States; The MIT Press: Cambridge, MA, USA, 1964. [Google Scholar]
- Lang, R.E.; Dhavale, D. Beyond Megalopolis: Exploring America’s new “megapolitan” geography. Geography 2005, 38, 1–33. [Google Scholar]
- Morrill, R. Classic map revisited: The growth of Megalopolis. Prof. Geogr. 2006, 58, 2. [Google Scholar] [CrossRef]
- Gottman, J. Megalopolis or the Urbanization of the Northeastern seaboard. Econ. Geogr. 1957, 33, 189–200. [Google Scholar] [CrossRef]
- Pickett, S.T.A.; Cadenasso, M.L.; Grove, J.M. Biocomplexity in coupled natural-human systems: A multidimensional framework. Ecosystems 2005, 8, 225–232. [Google Scholar] [CrossRef]
- Pandit, A.; Jeong, H.; Crittenden, J.C.; Xu, M. An infrastructure ecology approach for urban infrastructure sustainability and resiliency. In Proceedings of the IEEE PES Power Systems Conference and Exposition, Phoenix, AZ, USA, 20–23 March 2011; pp. 1–2. [Google Scholar] [CrossRef]
- Pandit, A.; Minné, E.A.; Li, F.; Brown, H.; Jeong, H.; James, J.C.; Newell, J.P.; Weissburg, M.; Chang, M.E.; Xu, M.; et al. Infrastructure ecology: An evolving paradigm for sustainable urban development. J. Clean. Prod. 2017, 163 (Suppl. 1), S19–S27. [Google Scholar] [CrossRef]
- Xu, M.; Weissburg, M.; Newell, J.P.; Crittenden, J.C. Developing a science of infrastructure ecology for sustainable urban systems. Environ. Sci. Technol. 2012, 46, 7928–7929. [Google Scholar] [CrossRef] [PubMed]
- Cudmore, W.W. Illustrations of Interconnectedness in Ecosystems. In Northwest Center for Sustainable Resources; Chemeketa Community College: Salem, OR, USA, 2009. [Google Scholar]
- Michaelidou, M.; Decker, D.J.; Lassoie, J.P. The interdependence of ecosystem and community viability: A theoretical framework to guide research and application. Soc. Nat. Resour. 2002, 15, 599–616. [Google Scholar] [CrossRef]
- Ecosystem Provinces, US Forest Service, Department of Agriculture. Available online: https://www.fs.fed.us/land/ecosysmgmt/colorimagemap/ecoreg1_provinces.html (accessed on 15 June 2022).
- America 2050—Northeast Megaregion 2050. Available online: https://rpa.org/work/reports/northeast-megaregion-2050 (accessed on 31 March 2022).
- Chetty, S.; Pillay, L. Assessing the influence of human activities on river health: A case for two South African rivers with differing pollutant sources. Environ. Monit. Assess. 2019, 191, 168. [Google Scholar] [CrossRef]
- Karr, J.R. Rivers as sentinels: Using the biology of rivers to guide landscape management. In River Ecology and Management: Lessons from the Pacific Coastal Ecoregion; Springer: New York, NY, USA, 1996; pp. 502–528. [Google Scholar]
- Mills, N.; Weber, M.J.; Pierce, C.L.; Cashatt, D. Factors influencing fish mercury concentrations in Iowa rivers. Ecotoxicology 2019, 28, 229–241. [Google Scholar] [CrossRef] [Green Version]
- Natural Gas Pipelines. Available online: https://hifld-geoplatform.opendata.arcgis.com/search?bbox=-151.558919%2C25.386288%2C-67.43964%2C60.499968&collection=Dataset (accessed on 13 April 2022).
- Electric Power Transmission Lines. Available online: https://hifld-geoplatform.opendata.arcgis.com/datasets/electric-power-transmission-lines/explore (accessed on 13 April 2022).
- USA Rivers and Streams—ArcGIS Hub. Available online: https://hub.arcgis.com/datasets/esri::usa-rivers-and-streams/explore (accessed on 13 April 2022).
- Primary Roads. Available online: https://hifld-geoplatform.opendata.arcgis.com/search?collection=Dataset&groupIds=dc2b19b1aad645c294f38cef40086ef4 (accessed on 13 April 2022).
- North American Rail Lines. Available online: https://hub.arcgis.com/documents/DCP::north-american-rail-lines-ntad/about (accessed on 13 April 2022).
- 50 Years Later: The Great Northeastern Blackout of 1965. Available online: https://www.wmur.com/article/50-years-later-the-great-northeastern-blackout-of-1965/5135484 (accessed on 31 March 2022).
- Cyberattack Forces a Shutdown of a Top, U.S. Pipeline. Available online: https://www.nytimes.com/2021/05/08/us/politics/cyberattack-colonial-pipeline.html (accessed on 31 March 2022).
- Prep the Pumps: Gas Stations Brace for Next Sandy. Available online: http://www.njgca.org/wp-content/uploads/GasStationsBraceForNextSandy10.29.2013CNBCNews.pdf (accessed on 5 April 2022).
- Zlotnik, A.; Roald, L.; Backhaus, S.; Chertkov, M.; Andersson, G. Coordinated scheduling for interdependent electric power and natural gas infrastructure. IEEE Trans. Power Syst. 2016, 32, 600–610. [Google Scholar] [CrossRef]
- O’Malley, C.; Delikaraoglou, S.; Roald, L.; Hug, G. Natural gas system dispatch accounting for electricity side flexibility. Electr. Power Syst. Res. 2020, 178, 106038. [Google Scholar] [CrossRef]
- Natural Gas Infrastructure Constraints. ISO New England. Available online: https://www.iso-ne.com/about/what-we-do/in-depth/natural-gas-infrastructure-constraints (accessed on 7 July 2022).
- Oswald Beiler, M.R. Sustainable transportation planning in the BosWash corridor. In The Palgrave Handbook of Sustainability; Springer International Publishing: New York, NY, USA, 2018. [Google Scholar]
- The Eastern Transportation Coalition. Available online: https://tetcoalition.org/ (accessed on 31 March 2022).
- Transportation Climate Initiative—About, Us. Available online: https://www.transportationandclimate.org/ (accessed on 31 March 2022).
- Ma, Y.; Wright, J.; Gopal, S.; Phillips, N. Seeing the invisible: From imagined to virtual urban landscapes. Cities 2020, 98, 102559. [Google Scholar] [CrossRef]
- Tani, A.; Morone, P. Policy implications for the clean energy transition: The case study of the Boston area. Energies 2020, 13, 10. [Google Scholar] [CrossRef]
- Neumann, R.P. Political ecology. In International Encyclopedia of Human Geography; Elsevier: Amsterdam, The Netherlands, 2009; pp. 228–233. [Google Scholar]
- Watts, M. Political ecology. In A Companion to Economic Geography; Blackwell Publishing Ltd.: Hoboken, NJ, USA, 2000; pp. 257–274. [Google Scholar]
- Blaikie, P.; Brookfield, H. Land Degradation and Society, 1st ed.; Blaikie, P., Brookfield, H., Eds.; Routledge: London, UK, 1987. [Google Scholar]
- Walker, P.A. Reconsidering ‘regional’ political ecologies: Toward a political ecology of the rural American West. Prog. Hum. Geogr. 2003, 27, 7–24. [Google Scholar] [CrossRef] [Green Version]
- Murphy, A. Revisiting regional geography: A view from Oregon. Yearb. Assoc. Pac. Coast Geogr. 1999, 61, 160–174. [Google Scholar] [CrossRef]
- Hortal, J.; Lobo, J.M. A synecological framework for systematic conservation planning. Biodivers. Inf. 2006, 3, 16–45. [Google Scholar] [CrossRef] [Green Version]
- Lencioni, V.; Rossaro, B. Microdistribution of chironomids (Diptera: Chironomidae) in Alpine streams: An autoecological perspective. Hydrobiologia 2005, 533, 61–76. [Google Scholar] [CrossRef]
- Delborne, J.A.; Hasala, D.; Wigner, A.; Kinchy, A. Dueling metaphors, fueling futures: “Bridge fuel” visions of coal and natural gas in the United States. Energy Res. Soc. Sci. 2020, 61, 101350. [Google Scholar] [CrossRef]
- Annual Report of Natural and Supplemental Gas Supply and Disposition. Available online: https://www.eia.gov/naturalgas/data.php (accessed on 31 March 2022).
- Brandt, A.R.; Heath, G.A.; Kort, E.A.; O’Sullivan, F.; Pétron, G.; Jordaan, S.M.; Tans, P.; Wilcox, J.; Gopstein, A.M.; Arent, D.; et al. Methane leaks from North American natural gas systems. Energy Environ. 2014, 343, 733–735. [Google Scholar] [CrossRef] [Green Version]
- Hendrick, M.F.; Ackley, R.; Sanaie-Movahed, B.; Tang, X.; Phillips, N.G. Fugitive methane emissions from leak-prone natural gas distribution infrastructure in urban environments. Environ. Pollut. 2016, 213, 710–716. [Google Scholar] [CrossRef] [PubMed] [Green Version]
- Anderson, L.A.; Goodman, R.A.; Holtzman, D.; Posner, S.F.; Northridge, M.E. Aging in the United States: Opportunities and challenges for public health. Am. J. Public Health 2012, 102, 393–395. [Google Scholar] [CrossRef]
- IPCC. Climate Change 2014: Synthesis Report. Contribution of Working Groups I, II and II to the Fifith Assessment Report of the Intergovernmental Panel on Climate Change; Core Writing Team, Pachauri, R.K., Meyer, L.A., Eds.; IPCC: Geneva, Switzerland, 2014; 151p, Available online: https://archive.ipcc.ch/pdf/assessment-report/ar5/syr/AR5_SYR_FINAL_All_Topics.pdf (accessed on 31 March 2022).
- Saint-Vincent, P.M.B.; Pekney, N.J. Beyond-the-Meter: Unaccounted sources of methane emissions in the natural gas distribution sector. Environ. Sci. Technol. 2020, 54, 39–49. [Google Scholar] [CrossRef]
- Sargent, M.R.; Floerchinger, C.; McKain, K.; Budney, J.; Gottlieb, E.W.; Hutyra, L.R.; Rudek, J.; Wofsy, S.C. Majority of US urban natural gas emissions unaccounted for in inventories. Proc. Natl. Acad. Sci. USA 2021, 118, e2105804118. [Google Scholar] [CrossRef] [PubMed]
- Adamse, A.D.; Hoeks, J.; de Bont, A.M.; van Kess, J.F. Microbial activities in soil near natural gas leaks. Arch. Mikrobiol. 1972, 83, 32–51. [Google Scholar] [CrossRef] [PubMed]
- Kaye, J.P.; Burke, I.C.; Mosier, A.R.; Guerschman, J.P. Methane and nitrous oxide fluxes from urban soils to the atmosphere. Ecol. Appl. 2004, 14, 4. [Google Scholar] [CrossRef] [Green Version]
- Schollaert, C.; Ackley, R.C.; DeSantis, A.; Polka, E.; Scammell, M.K. Natural gas leaks and tree death: A first-look case-control study of urban trees in Chelsea, MA USA. Environ. Pollut. 2020, 263, 114464. [Google Scholar] [CrossRef]
- Lebel, E.D.; Finnegan, C.J.; Ouyang, Z.; Jackson, R.B. Methane and NOx emissions from natural gas stoves, cooktops, and ovens in residential homes. Environ. Sci. Technol. 2022, 56, 2529–2539. [Google Scholar] [CrossRef]
- Pipeline Mileage and Facilities. Available online: https://www.phmsa.dot.gov/data-and-statistics/pipeline/pipeline-mileage-and-facilities (accessed on 31 March 2022).
- Plant, G.; Kort, E.A.; Floerchinger, C.; Gvakharia, A.; Vimont, I.; Sweeney, C. Large fugitive methane emissions from urban centers along the U.S. East coast. Geogr. Res. Lett. 2019, 46, 8500–8507. [Google Scholar] [CrossRef] [Green Version]
- Anguelovski, I.; Chu, E.; Carmin, J. Variations in approaches to urban climate adaptation: Experiences and experimentation from the global South. Glob. Environ. Chang. 2014, 27, 156–167. [Google Scholar] [CrossRef]
- Carmin, J.; Dodman, D.; Chu, E.K. Urban climate adaptation and leadership: From conceptual to practical understanding. In Organization for Economic Co-Operation and Development Regional Development Working Papers; Organization for Economic Cooperation and Development: Paris, France, 2013; p. 26. [Google Scholar] [CrossRef]
- Kirshen, P.; Ruth, M.; Anderson, W. Interdependencies of urban climate change impacts and adaptation strategies: A case study of Metropolitan Boston USA. Clim. Chang. 2008, 86, 105–122. [Google Scholar] [CrossRef]
- Pearsall, H. From brown to green? Assessing social vulnerability to environmental gentrification in New York City. Environ. Plan. C Gov. Policy 2010, 28, 872. [Google Scholar] [CrossRef]
- Luna, M.; Nicholas, D. An environmental justice analysis of distribution-level natural gas leaks in Massachusetts, USA. Energy Policy 2022, 162, 112778. [Google Scholar] [CrossRef]
- Guo, Z.; Liu, P.; Ma, L.; Li, Z. Effects of low-carbon technologies and end-use electrification on energy-related greenhouse gas mitigation in China by 2050. Energies 2015, 8, 7161–7184. [Google Scholar] [CrossRef] [Green Version]
- Steinberg, D.; Bielen, D.; Eichman, J.; Eurek, K.; Logan, J.; Mai, T.; McMillan, C.; Parker, A.; Vimmerstedt, L.; Wilson, E. Electrification & Decarbonization: Exploring U.S. Energy Use and Greenhouse Gas Emissions in Scenarios with Widespread Electrification and Power Sector Decarbonization; National Renewable Energy Laboratory: Washington, DC, USA, 2017. [Google Scholar]
- Tarroja, B.; Chiang, F.; AghaKouchak, A.; Samuelsen, S.; Raghavan, S.V.; Wei, M.; Sun, K.; Hong, T. Translating climate change and heating system electrification impacts on building energy use to future greenhouse gas emissions and electric grid capacity requirements in California. Appl. Energy 2018, 225, 522–534. [Google Scholar] [CrossRef] [Green Version]
- Lights Flicker for Utilities. Available online: https://www.wsj.com/articles/lights-flicker-for-utilities-1387752421 (accessed on 31 March 2022).
- Felder, F.; Athawale, R. The life and death of the utility death spiral. Electr. J. 2014, 27, 9–16. [Google Scholar] [CrossRef]
- Fuchs, G.; Hinderer, N. Situative governance and energy transitions in a spatial context: Case studies from Germany. Energy Sustain. Soc. 2014, 4, 16. [Google Scholar] [CrossRef] [Green Version]
- City and Town Population Totals: 2010–2019. Available online: https://www.census.gov/data/tables/time-series/demo/popest/2010s-total-cities-and-towns.html (accessed on 31 March 2022).
- Methane Emissions from the Natural Gas Industry—Volume 1: Executive Summary. Available online: https://digital.library.unt.edu/ark:/67531/metadc949406/m1/2/ (accessed on 31 March 2022).
- Data and Statistics—Gas Transmission and Hazardous Liquid Pipelines. Available online: https://www.phmsa.dot.gov/data-and-statistics/pipeline/gas-transmission-and-hazardous-liquid-pipelines-us (accessed on 31 March 2022).
- Pipeline Safety: Safety of Gas Transmission Pipelines: MAOP Reconfirmation, Expansion of Assessment Requirement and Other Related Amendments. Available online: https://www.federalregister.gov/documents/2019/10/01/2019-20306/pipeline-safety-safety-of-gas-transmission-pipelines-maop-reconfirmation-expansion-of-assessment (accessed on 15 June 2022).
- Table A1. Natural Gas Losses and Unaccounted for by State. 2020. Available online: https://www.eia.gov/naturalgas/annual/pdf/table_a01.pdf (accessed on 31 March 2022).
- Place and Health—Data & Documentation Download. Available online: https://www.atsdr.cdc.gov/placeandhealth/svi/data_documentation_download.html (accessed on 31 March 2022).
- California’s Cities Lead the Way to on Pollution-Free Homes and Buildings. Available online: https://www.sierraclub.org/articles/2021/07/californias-cities-lead-way-pollution-free-homes-and-buildings (accessed on 31 March 2022).
- Brookline Special Town Meeting of November 19, 2019—Case # 9725 Warrant Article #21 (General). Available online: https://www.lawandenvironment.com/wp-content/uploads/sites/5/2020/07/AG-MLU-Decision-on-Brookline-Fossil-Fuels-Ban-7.21.20.pdf (accessed on 31 March 2022).
- American Gas Association Managing the Reduction of the Nation’s Cast Iron Inventory. Available online: https://www.aga.org/sites/default/files/managing_the_nations_cast_iron_inventory.pdf (accessed on 31 March 2022).
- Corrosion Stands out as Cause of Gas Pipe Leaks as Utilities Upgrade Aging Lines. Available online: https://www.spglobal.com/marketintelligence/en/news-insights/trending/6m__eocgc-zgjbmoduv9cq2#:~:text=2018%20%7C%2008%3A58-,Corrosion%20stands%20out%20as%20cause%20of%20gas,as%20utilities%20upgrade%20aging%20lines&text=Corrosion%20was%20a%20major%20cause,importance%20of%20replacing%20older%20pipes (accessed on 31 March 2022).
- Pipeline Replacement Background. Available online: https://www.phmsa.dot.gov/data-and-statistics/pipeline-replacement/pipeline-replacement-background (accessed on 31 March 2022).
- Data and Statistics Overview. Available online: https://www.phmsa.dot.gov/data-and-statistics/pipeline/data-and-statistics-overview (accessed on 31 March 2022).
- Gas Leaks Maps. Available online: https://heet.org/gas-leaks/gas-leak-maps/ (accessed on 15 June 2022).
- An Act Relative to Natural Gas Leaks. Available online: https://malegislature.gov/laws/sessionlaws/acts/2014/chapter149 (accessed on 1 February 2022).
- Lamb, B.K.; Edburg, S.L.; Ferrara, T.W.; Howard, T.; Harrison, M.R.; Kolb, C.E.; Townsend-Small, A.; Dyck, W.; Possolo, A.; Whetstone, J.R. Direct measurements show decreasing methane emissions from natural gas local distribution systems in the United States. Environ. Sci. Technol. 2015, 49, 5161–5169. [Google Scholar] [CrossRef]
- Weller, Z.D.; Hamburg, S.; von Fischer, J.C. A national estimate of methane leakage from pipeline mains in natural gas local distribution systems. Environ. Sci. Technol. 2020, 54, 8958–8967. [Google Scholar] [CrossRef]
- Rolling the Dice, Assessment of Gas Safety in Massachusetts. Available online: https://static1.squarespace.com/static/612638ab5e31f66d7ae8f810/t/615888c41ab1fe20dbe57188/1633192135840/Rolling+the+Dice.pdf (accessed on 15 June 2022).
- Our Locations. Available online: https://www.pgworks.com/contact-us/our-locations (accessed on 15 June 2022).
- Con Edison Limits Natural Gas Service due to Pipeline Constraints into New York City Area. Available online: https://www.eia.gov/todayinenergy/detail.php?id=39572 (accessed on 15 June 2022).
- A Year Ago, Maine Unveiled Its Climate Action Plan. What Progress has Been Made? Available online: https://www.mainepublic.org/environment-and-outdoors/2021-12-01/a-year-ago-maine-unveiled-its-climate-action-plan-what-progress-has-been-made (accessed on 15 June 2022).
- The New Hampshire Climate Action Plan. Available online: https://www.des.nh.gov/sites/g/files/ehbemt341/files/documents/r-ard-09-1.pdf (accessed on 15 June 2022).
- Initial Vermont Climate Action Plan. Available online: https://outside.vermont.gov/agency/anr/climatecouncil/Shared%20Documents/Initial%20Climate%20Action%20Plan%20-%20Final%20-%2012-1-21.pdf (accessed on 15 June 2022).
- Massachusetts Clean Energy and Climate Plan for 2025 and 2030. Available online: https://www.mass.gov/info-details/massachusetts-clean-energy-and-climate-plan-for-2025-and-2030#:~:text=Feedback%20and%20Resources-,Development%20of%20the%20Clean%20Energy%20and%20Climate%20Plan%20for%202025,specific%20sublimits%20every%205%20years (accessed on 15 June 2022).
- Rhode Island Greenhouse Gas Emissions Reduction Plan. Available online: http://climatechange.ri.gov/documents/ec4-ghg-emissions-reduction-plan-final-draft-2016-12-29-clean.pdf (accessed on 15 June 2022).
- Taking Action on Climate Change and Building a More Resilient Connecticut for all, Governor’s Council on Climate Change. Available online: https://portal.ct.gov/-/media/DEEP/climatechange/GC3/GC3_Phase1_Report_Jan2021.pdf (accessed on 15 June 2022).
- Climate Action Plan Lays Out New York’s Clean Energy Future. Available online: https://www.timesunion.com/news/article/Climate-Action-plan-lays-out-New-York-s-clean-16725582.php (accessed on 15 June 2022).
- Climate Change New Jersey. Available online: https://www.nj.gov/dep/climatechange/#:~:text=New%20Jersey%20is%20now%20looking,infrastructure%20and%20building%20resilient%20communities (accessed on 15 June 2022).
- Climate Action Plan—Montgomery County PA. Available online: https://www.montcopa.org/3943/Climate-Action-Plan#:~:text=Pennsylvania%20Climate%20Action%20Plan%202021,Read%20the%20complete%20plan (accessed on 15 June 2022).
- Delaware’s Climate Action Plan. Available online: https://documents.dnrec.delaware.gov/energy/Documents/Climate/Plan/Delaware-Climate-Action-Plan-2021.pdf (accessed on 15 June 2022).
- Maryland Released Bold New Plan to Achieve Climate Goals. Available online: https://news.maryland.gov/mde/2021/02/19/maryland-releases-bold-new-plan-to-achieve-climate-goals/ (accessed on 15 June 2022).
- SB 94 Virginia Energy Plan; Climate Change and Pressing Challenge. Available online: https://lis.virginia.gov/cgi-bin/legp604.exe?201+sum+SB94S (accessed on 15 June 2022).
- Examples of Climate Action Plan Structures. Available online: https://secondnature.org/signatory-handbook/examples-of-climate-action-plan-structures/ (accessed on 15 June 2022).
- N.Y. Governor Backs Nation’s First Statewide Gas Ban. Available online: https://www.eenews.net/articles/n-y-governor-backs-nations-first-statewide-gas-ban/ (accessed on 31 March 2022).
- Will Developers Block Clean Energy Standards? Available online: https://commonwealthmagazine.org/energy/will-developers-block-clean-energy-standards/ (accessed on 7 April 2022).
- Geo Micro District—Feasibility Study. Available online: https://heet.org/wp-content/uploads/2019/10/HEET-BH-GeoMicroDistrict-Final-Report.pdf (accessed on 31 March 2022).
- Delaware Climate Action Plan Supporting Technical Greenhouse Gas Mitigation Analysis Report. Available online: https://documents.dnrec.delaware.gov/energy/Documents/Climate/Plan/DNREC%20Technical%20Report.pdf (accessed on 7 April 2022).
- Bill No. A08429 State of New York, Senate—Assembly. Available online: https://nyassembly.gov/leg/?default_fld=&leg_video=&bn=A08429&term=2019&Summary=Y&Actions=Y&Text=Y (accessed on 7 April 2022).
- Bureau of Building Codes and Standards, Maine Uniform Energy Code—Energy Code. Available online: https://www.maine.gov/dps/fmo/building-codes (accessed on 7 April 2022).
- State of New Jersey Energy Master Plan. Available online: https://www.nj.gov/governor/news/news/562020/approved/20200127a.shtml (accessed on 7 April 2022).
- The Vermont Climate Council Adopts the Vermont Climate Action Plan. Available online: https://anr.vermont.gov/content/vermont-climate-council-adopts-vermont-climate-action-plan (accessed on 7 April 2022).
- New Hampshire Gas Law Handcuffs Local Governments on Climate-Friendly Construction. Available online: https://energynews.us/2021/09/27/new-hampshire-gas-law-handcuffs-local-government-on-climate-friendly-construction/ (accessed on 1 April 2022).
- Could PA Gas Preemption Bill Derail Local Climate Action Plans? Available online: https://www.publicnewsservice.org/2021-06-11/energy-policy/could-pa-gas-preemption-bill-derail-local-climate-action-plans/a74581-1%7C6-2-a1,6-2-a2 (accessed on 1 April 2022).
- Cities Tried to Cut Natural Gas from the New Homes. The GOP and Gas Lobby Preemptively Quashed Their Effort. Available online: https://www.cnn.com/2022/02/17/politics/natural-gas-ban-preemptive-laws-gop-climate/index.html (accessed on 1 April 2022).
- Climate Action and Adaptation Plan—Portland and South Portland. Available online: https://www.oneclimatefuture.org/wp-content/uploads/2021/02/OneClimateFuture_FinalJan2021_Downsized.pdf (accessed on 15 June 2022).
- Manchester Business Center. Available online: https://www.manchesternh.gov/Business-Center/Sustainability-Manchester (accessed on 15 June 2022).
- Burlington, Vermont Climate Action Plan. Available online: https://www.adaptationclearinghouse.org/resources/burlington-vermont-climate-action-plan.html (accessed on 15 June 2022).
- City of Boston Climate Action Plan 2019 Update. Available online: https://www.boston.gov/sites/default/files/embed/file/2019-10/city_of_boston_2019_climate_action_plan_update_4.pdf (accessed on 15 June 2022).
- The City of Providence’s Climate Justice Plan. Available online: https://www.providenceri.gov/wp-content/uploads/2019/10/Climate-Justice-Plan-Report-FINAL-English-1.pdf (accessed on 15 June 2022).
- Energy Efficiency and Conservation Plan. Available online: https://www.bridgeportct.gov/filestorage/341650/341652/347099/EECS_Final_-_Energy_Plan.pdf (accessed on 15 June 2022).
- Aligning New York City with the Paris Climate Agreement, C40 Cities. Available online: https://www1.nyc.gov/assets/sustainability/downloads/pdf/publications/1point5-AligningNYCwithParisAgrmt-02282018_web.pdf (accessed on 15 June 2022).
- Newark NJ’s Climate Action Contribution. Available online: https://www.wearestillin.com/organization/newark-nj (accessed on 15 June 2022).
- Philadelphia Climate Action Playbook, The City of Philadelphia Office of Sustainability. Available online: https://www.phila.gov/media/20210113125627/Philadelphia-Climate-Action-Playbook.pdf (accessed on 15 June 2022).
- Climate Justice for Wilmington: Summary Report. Available online: https://www.delawarenaturesociety.org/wp-content/uploads/2018/10/DNS-Climate-Change-Summary-Report-Final.pdf (accessed on 15 June 2022).
- Climate Action Plan, Baltimore Office of Sustainability. Available online: https://www.baltimoresustainability.org/plans/climate-action-plan/ (accessed on 15 June 2022).
- Virginia Beach Green. Available online: https://www.vbgov.com/government/departments/planning/green/Pages/default.aspx (accessed on 15 June 2022).
- Climate Action Planning, Department of Energy & Environment DC.gov. Available online: https://doee.dc.gov/service/climate-action-planning (accessed on 15 June 2022).
- Stone, B.; Vargo, J.; Habeeb, D. Managing climate change in cities: Will climate action plans work? Landsc. Urban Plan. 2012, 107, 263–271. [Google Scholar] [CrossRef]
- Gas Ban Monitor: Vt. Building Carbon Fee Advances as More States Outlaw Bans. Available online: https://www.spglobal.com/marketintelligence/en/news-insights/latest-news-headlines/gas-ban-monitor-vt-building-carbon-fee-advances-as-more-states-outlaw-bans-63943553 (accessed on 7 April 2022).
- Philadelphia Gas Works Business Diversification Study. Available online: https://www.phila.gov/media/20211207134817/PGW-Business-Diversification-Study-2021-12.pdf (accessed on 7 April 2022).
- Hoppe, T.; Miedema, M. A governance approach to regional energy transition: Meaning, conceptualization and practice. Sustainability 2020, 12, 915. [Google Scholar] [CrossRef] [Green Version]
- Späth, P.; Rohracher, H. The ‘eco-cities’ Freiburg and Graz: The social dynamics of pioneering urban energy and climate governance. In Cities and Low Carbon Transitions, 1st ed.; Routledge: Abingdon, UK, 2012; pp. 88–106. [Google Scholar]
- Database of State Incentives for Renewables & Efficiency. Available online: https://nccleantech.ncsu.edu/renewable-energy-resources/dsire/ (accessed on 1 April 2022).
- California’s Green-Energy Subsidies Spur a Gold Rush in Cow Manure. Available online: https://www.wsj.com/articles/californias-green-energy-subsidies-spur-a-gold-rush-in-cow-manure-11645279200 (accessed on 4 April 2022).


| State, USA | Most Populous City |
|---|---|
| ME | Portland, ME |
| NH | Manchester, NH |
| VT | Burlington, VT |
| MA | Boston, MA |
| RI | Providence, RI |
| CT | Bridgeport, CT |
| NY | New York City, NY |
| NJ | Newark, NJ |
| PA | Philadelphia, PA |
| MD | Baltimore, MD |
| DE | Wilmington, DE |
| VA | Virginia Beach, VA |
| -- | Washington, DC |
| State | State Pipelines (miles) | Total # of Grade 2 Leaks | LAUF (% of Total Consumption) | Leak-Prone Pipe (miles) | Leak-Prone Pipe (% of Total Miles) | Pipelines Constructed Prior to 1970 (miles) | Pipelines Constructured Prior to 1970 (% of Total Miles) |
|---|---|---|---|---|---|---|---|
| NY, USA | 49,602 | 10,761 | 0.7 | 7577 | 15.3 | 18,093 | 36.5 |
| PA, USA | 48,651 | 10,567 | 3.9 | 8,286 | 17.0 | 15,594 | 32.1 |
| NJ, USA | 35,604 | 3871 | 0.8 | 3824 | 10.7 | 9932 | 27.9 |
| VA, USA | 22,133 | 2544 | 2.2 | 590 | 2.7 | 3790 | 17.1 |
| MA, USA | 21,800 | 8983 | −3.2 | 3934 | 18.0 | 7596 | 34.8 |
| MD, USA | 15,266 | 4595 | 4.6 | 1239 | 8.1 | 4770 | 31.2 |
| CT, USA | 8355 | 1212 | 1.8 | 1289 | 15.4 | 2841 | 34.0 |
| DE, USA | 3295 | 246 | 4.3 | 59 | 1.8 | 626 | 19.0 |
| RI, USA | 3204 | 743 | 1.5 | 855 | 26.6 | 1017 | 31.8 |
| NH, USA | 2006 | 22 | 0.3 | 49 | 2.4 | 325 | 16.2 |
| ME, USA | 1382 | 122 | 0.4 | 25 | 1.8 | 154 | 11.1 |
| VT, USA | 868 | 13 | −0.9 | 0 | 0 | 72 | 8.3 |
| Washington DC, USA | 1221 | 867 | 2.1 | 430 | 35.2 | 690 | 56.5 |
| BosWash Corridor | 213,387 | 44,747 | 28,157 | 13.2 | 65,499 | 30.7 |
| State | % Leak-Prone Infrastructure | 2025 Progress to Reach GHG Emission Reduction Target | 2030 Progress to Reach GHG Emission Reduction Target | 2040 Progress to Reach GHG Emission Reduction Target | 2045 Progress to Reach GHG Emission Reduction Target | 2050 Progress to Reach GHG Emission Reduction Target |
|---|---|---|---|---|---|---|
| ME, USA | 1.8 | 13.3% | 26.6% | 53.3% | 66.6% | TARGET 80% (1990 baseline) |
| NH, USA | 2.4 | 13.3% | 26.6% | 53.3% | 66.6% | TARGET 80% (1990 baseline) |
| VT, USA | 0 | 13.3% | 26.6% | 53.3% | 66.6% | TARGET 80% (1990 baseline) |
| MA, USA | 18.0 | 16.65% | 33.3% | 66.6% | 83.25% | TARGET Net-zero GHG |
| RI, USA | 26.6 | 13.3% | 26.6% | 53.3% | 66.6% | TARGET 80% (1990 baseline) |
| CT, USA | 15.4 | 22.5% | TARGET 45% (2001 baseline) | -- | -- | -- |
| NY, USA | 15.3 | 35% | TARGET 70% (1990 baseline)–drafted | -- | -- | -- |
| NJ, USA | 10.7 | 13.3% | 26.6% | 53.3% | 66.6% | TARGET 80% (2006 baseline) |
| PA, USA | 17.0 | 13.3% | 26.6% | 53.3% | 66.6% | TARGET 80% (2005 baseline) |
| DE, USA | 1.8 | TARGET–28% (2005 baseline) | -- | -- | -- | -- |
| MD, USA | 8.1 | 25% | TARGET–50% (2006 baseline) | -- | -- | -- |
| VA, USA | 2.7 | 20% | 40% | 80% | TARGET Net-zero GHG |
Publisher’s Note: MDPI stays neutral with regard to jurisdictional claims in published maps and institutional affiliations. |
© 2022 by the authors. Licensee MDPI, Basel, Switzerland. This article is an open access article distributed under the terms and conditions of the Creative Commons Attribution (CC BY) license (https://creativecommons.org/licenses/by/4.0/).
Share and Cite
Wright, J.; Ackley, R.; Gopal, S.; Phillips, N. The BosWash Infrastructure Biome and Energy System Succession. Infrastructures 2022, 7, 95. https://doi.org/10.3390/infrastructures7070095
Wright J, Ackley R, Gopal S, Phillips N. The BosWash Infrastructure Biome and Energy System Succession. Infrastructures. 2022; 7(7):95. https://doi.org/10.3390/infrastructures7070095
Chicago/Turabian StyleWright, Jessica, Robert Ackley, Sucharita Gopal, and Nathan Phillips. 2022. "The BosWash Infrastructure Biome and Energy System Succession" Infrastructures 7, no. 7: 95. https://doi.org/10.3390/infrastructures7070095