Article

Identifying the Factors Impacting Bridge Deterioration in the Gulf Cooperation Council

Civil Engineering Department, American University of Sharjah, Sharjah P.O. Box 26666, United Arab Emirates
*
Author to whom correspondence should be addressed.
Designs 2023, 7(6), 126; https://doi.org/10.3390/designs7060126
Submission received: 2 October 2023 / Revised: 31 October 2023 / Accepted: 1 November 2023 / Published: 6 November 2023
(This article belongs to the Topic Resilient Civil Infrastructure)

Abstract

:
The deterioration module (DM) is one of the four major modules necessary for any bridge management system (BMS). Environmental conditions, structural systems, bridge configuration, geographic location, and traffic data are some of the major factors that affect the development of deterioration modules. This emphasizes the need for the development of deterioration models that reflect the local conditions. In this article, some of the most important factors that could help in developing deterioration models in the Gulf Cooperation Council (GCC) were identified. The research was conducted in three phases; in the first phase, an extensive literature search was conducted to identify factors adopted in different deterioration models, and in phase two, the most relevant factors to the GCC environment were selected and these factors were further reduced based on input from local bridge experts. The result from the second phase is a list of factors identified by the experts. The identified list was utilized in phase three, which was focused on conducting a survey targeting bridge engineers to help identify the final selection and rank the factors according to their importance level. The results indicate that steel reinforcement protection, design load, chloride attack, type of defect, and age are the most important factors impacting bridge deterioration in the GCC. In addition, the time of rehabilitation; average daily truck traffic, ADTT; and average daily traffic, ADT, are the second most important factors. Factors with medium importance level are deck protection, services under the bridge, and inspection gap. The least important set of factors include temperature and wind load.

1. Introduction

Transportation infrastructure plays a crucial role within major cities around the world. Within the GCC countries, there has been a major development in transportation infrastructure over the past few decades. Bridges are considered one of the most important infrastructure projects that require a significant budget and a high degree of safety. Moreover, the number of bridges within the GCC region is increasing. This increase and the age of existing bridges highlight the need for plans to maintain these bridges in excellent operational conditions, which requires huge funds and efforts. Bridge deterioration is one of the major threats that may cause the sudden failure of some bridges. A bridge management system (BMS) is one of the effective tools that has been proposed to improve the efficiency in managing the inspection, maintenance, condition prediction, and budget allocation for bridges at both project and network levels. A BMS usually contains four basic modules, database, maintenance cost, deterioration, and decision making and optimization. The deterioration module is a very important module because it predicts the future condition of the bridge to assess proper planning for maintenance strategies and allocation of the budgets. Concrete bridges are widely constructed and preferred in the GCC countries due to their durability and the availability of raw material and workmanship. However, concrete bridges are exposed to many external deterioration mechanisms originating from environmental influences that decrease their serviceability and may compromise their integrity. Identifying the factors that affect bridge deterioration will help in developing reliable deterioration models.
In the GCC region, the number of bridges is increasing and only a few of these countries have started the development of bridge management systems that ensure that bridges are maintained in good condition. In addition, the few developed BMSs do not include deterioration models yet. In the first attempt of this research, the goal was to develop a deterioration model for bridges in the GCC. The research team contacted road departments in Kuwait and the UAE to collect data that can be utilized to develop a deterioration model. However, after obtaining the available data, it was found that there are no sufficient maintenance and inspection records and defects’ data to help in the development of a deterioration model. Therefore, the aim of this research was shifted to consider identifying the factors that impact bridge deterioration in GCC countries. Such factors are essential for the GCC countries to start collecting important data regarding the existing bridges, which will lead to the development of robust deterioration models.

2. Research Significance

Deterioration models are one of the main modules in any BMS as they facilitate the prediction of the maintenance requirements to preserve the bridge’s integrity and the safety of the public. Identifying the key factors that should be considered, when developing deterioration models within the GCC, is an essential step towards the development of realistic models. Identifying these factors can be of great benefit for the authorities managing bridges in the GCC and could be utilized to develop deterioration models that reflect the local conditions.

3. Literature Review

This section provides a review of previous research to help understand the factors that affect bridge deterioration, which have been considered in different models around the world. First, an overview of bridge management systems (BMSs) and their common modules is presented. The second part of this section focuses on deterioration models, their types, and the common factors that have been adopted in the development of the models.

3.1. Bridge Management Systems

A bridge management system (BMS) is considered one of the best tools used to monitor bridge activities and the health condition of the bridges. It is a process to help in making decisions regarding the maintenance, rehabilitation, and replacement of bridges in the most efficient approach [1,2].
The need for BMS was first realized in the United States after the “Silver Bridge” incident. On 15 December 1967, the Silver Bridge collapsed under the weight of rush-hour traffic. Accordingly, recommendations were made to the US Secretary of Transportation to begin a research program aimed at developing new inspection procedures. From that perspective, the Federal Highway Administration (FHWA) introduced the National Bridge Inventory (NBI), where all the states are required to report all inspection data, which eventually became the inventory of all BMS in the USA [3]. The BMS helps in maintaining the health and well-being of the bridges [4,5,6].

3.1.1. BMS Modules and Software

The four major modules of BMSs were defined by the American Association of State Highway and Transportation Officials (AASHTO) guidelines in 1993 and were re-defined by Czepiel [7]. These modules are the database, the maintenance cost, the deterioration, and the decision making and optimization.
The FHWA through the National Cooperative Highway Research Program (NCHRP) initiated a research project for the development of a BMS and came up with the first BMS software called PONTIS 1.0. The software was first developed in 1991 and then licensed by AASHTO in 1994 [5,8]. Approximately 50% of the U.S. transportation agencies have adopted PONTIS for their bridge management activities [9]. However, the accuracy of the predicted conditions of bridges might not be reliable enough if the input data are based on visual inspections only [10].
Another BMS software that is commonly used in the USA is BRIDGIT 1.0. It was developed by NCHRP in 1998 and has similar functions to PONTIS. The major difference is that BRIDGIT has an optimization module, called OPBRIDGE, which uses a “bottom-up” analysis method for cost planning [10].

3.1.2. Common BMS Practices around the World

There are currently numerous BMS packages in service around the world. Some of these systems were genuinely adopted from the PONTIS or BRIDGIT systems but were modified to fit the local conditions. A brief discussion on the common BMSs around the is summarized in Table 1. The information in Table 1 provides some observations on the developed BMSs in different parts of the world. In addition, it discusses the historical development of each system. Development of BMSs is discussed in detail in several previous studies [1,5,6,7,9].

3.2. Deterioration Models

Concrete bridges tend to deteriorate with time. Thompson et al. [36] emphasize that an effective BMS should be equipped with a reliable deterioration model. Deterioration models are models designed to predict the future condition of the bridge to assess proper planning for maintenance strategies and allocation of the budgets. Many deterioration models have been developed to help in predicting the condition of the bridge elements. The models are developed through different techniques that can be classified into deterministic, stochastic, and artificial intelligence.
Deterministic deterioration models are obtained through statistical and regression analysis based on the historical data on the structural deterioration [37]. These models do not provide enough accuracy for prediction of the bridge performance and may underestimate or overestimate the bridge condition at a specific time [38].
Stochastic models are probabilistic models that consider the uncertainty and randomness within deterioration conditions. A stochastic approach can also be used to incorporate environmental influences and material characteristics into the deterioration model [39]. Models developed using this approach can be state-based models or time-based models [40].
Artificial intelligence (AI) models are computational models that use AI techniques like Artificial Neural Networks (ANNs) [41]. The ANN consists of networks of an input layer, hidden layers, and an output layer, which are parallelly interconnected [42].

3.3. Factors Included in Deterioration Models

Concrete bridges are affected by many deterioration factors such as traffic volume and environmental conditions associated with the bridge’s location, which accelerate the degradation process. Many studies have developed deterioration models using different methods and have included different parameters in the developed models. The following subsections briefly discuss the factors included in different deterioration models.

3.3.1. Factors Considered in North America

Although some of the states used the same methods and types in developing the deterioration models, different factors were considered in each model, based on the local conditions. Age, average daily traffic (ADT), and average daily truck traffic (ADTT) were found to be the most common factors adopted in the deterioration models developed in North America [8,38,42,43,44,45,46,47,48,49,50,51,52,53,54,55,56,57,58,59,60,61,62].
Madanat et al. [44], Moomen et al. [14], and Saeed et al. [53] have developed different deterioration models for Indiana. The common factors found in the three studies were the following: age, ADT, state or non-state type of bridges, freeze and thaw cycles, number of spans, bridge length, skewness, and type of services under the bridge. Deck protection was adopted only by Moomen et al. [14]. Madanat et al. [44] were the only ones to consider the humidity, wearing surface type, bridge width, and structure type in their model.
In Ohio, Ramani [56] considered geographical location and bridge material type, while AlThaqafi and Chou [57] included skewness, ADT, design type, number of spans, bridge length, deck width, and design load in their model. The age of the bridge was the only common factor between the two models.
Winn [42] and Chyad [58] used ANN, deterministic, and stochastic approaches to develop a deterioration model in Michigan. Common factors used in these studies were age, ADT, and structure type.
Weissmann et al. [60] developed a deterioration model in Texas utilizing inventory data, which considered climate factors such as rainfall. Other studies [10,59,60,61] have also considered the environmental effects on bridge deterioration when developing different deterioration models. Shengzhi et al. [62] categorized the US into five zones: Hot-Humid, Mixed-Humid, Hot-Dry/Mixed-Dry, Cold/Very Cold, and Marine. There are several states that considered the effect of the environmental parameters in their deterioration models [14,43,44,48,53,54].
Foster [63] conducted a survey of the state departments of transportation (DOTs) to investigate their experience with bridge deterioration models. Twenty-nine states responded, with seventeen states that have a deterioration model in their BMS and seven states that do not use bridge deterioration models in their BMS. The most common factors in the deterioration models reported were age, superstructure’s material, condition rating, average daily traffic (ADT), and deck wearing surface.
In Canada, Marcous [45] considered highway class, region, age, ADT, and span length in the deterioration model. Morcous et al. [55] included more factors in their model such as ADTT, skew angle, structural system, wearing surface, and girder material and spacings. Another study in Ontario by Martinez et al. [59] was conducted to predict the condition rating of the province’s bridges using different types of models and a set of variables for the models. The set of variables includes rehabilitation time, number of spans, bridge length and width, region, age, and bridge material.

3.3.2. Factors Considered in Other Countries

To forecast the bridge condition rating using condition rating data, Khairullah and Roszilah [64] developed an ANN deterioration model in Malaysia. Another study by Al Hussein [61] utilized the inventory data of London bridges, where the defect type, exposure condition, and bridge component type were used as input parameters for the ANN deterioration model development.
A study in Japan was conducted by Miao [65], where an ANN deterioration model was developed using age, ADT, ADTT, and bridge geometry as factors included in the model. The study also involved climate-related factors such as snow and rain precipitation, temperature change, chloride, and carbon dioxide content. The same environmental factors were used in a study in China but without considering the rain precipitation, chloride, and carbon dioxide content [66].
Environmental factors were also considered in deterioration models in Australia. In addition to age, ADT, ADTT, and structure type were adopted by Callow [11], and the chloride and sulphate content were included in the ANN deterioration model developed by Hasan [67].
In Europe, a deterioration model was developed in Finland based on age, freeze–thaw cycles, carbonation depth, and reinforcement corrosion [25]. In Serbia, the deterioration model included structural components and inspection gap [68]. In the Netherlands, Kallen and Noortwijk [69] considered age and condition data of the bridges to develop a Markov deterioration model.
Santos et al. [70] in Brazil categorized the bridge data according to geographic location, material type, and superstructure type to develop Markovian and ANN deterioration models. For each bridge category, age, deck width, and bridge length were considered as parameters in both models. Another study in Brazil was conducted by Furtado and Ribeiro [71] in which they used age, bridge length, number of spans, bridge material, traffic volume, and different classes of environmental aggressiveness as variables for the semi-Markovian model. A stochastic model that considered age and environmental conditions was also developed in Japan [72].

3.3.3. Discussion of the Factors

This section discusses the findings regarding the factors that have been adopted in the development of deterioration models for bridges. Figure 1 summarizes the thirty-three factors found in the literature review, and these could be classified into six groups; environmental factors, structural-related factors, dimensional factors, factors related to geographic location, traffic, and other factors. In addition, the structural-, traffic-, and dimensional-related factors are the most included in the development of deterioration models. Figure 2 shows several structural-related factors which were included in different deterioration models. The age of the bridge and the superstructure type are the main factors that were included in the development of DMs. Furthermore, snow, rain, temperature, humidity, freeze index, number of freeze–thaw cycles, number of cold days, carbon dioxide, chloride, sulphate, and salt usage are some of the environmental conditions that are included in DMs, as shown in Figure 3. It is worth noting that the data in Figure 2 and Figure 3 are based on the reviewed references. Therefore, the percentages shown in the two figures represent the percentage of references.
Traffic, dimensional factors, geographic location factors, and other categories are summarized in Table 2. In addition, the table provides the frequency of using each factor and relevant references that considered different factors. Some factors have been rarely adopted by researchers when developing deterioration models. Examples of these factors include deck and steel reinforcement protection, type of defect, inspection gap, bridge elevation, girder material and spacing, approach surface type, sulphate and carbon dioxide content, and salt usage.
Because the objective of this research is to identify the factors that contribute to the deterioration of bridges in the GCC, there are some factors mentioned in the literature that are not applicable to the climate condition in the GCC region. These factors are freeze and thaw cycles, number of cold days, and salt usage for deicing. It is apparent that these factors are related to cold-weather countries, where snow and rain have a huge effect on the structures. Accordingly, these factors do not apply to the GCC countries. As a result, twenty-seven factors are included in the interview phase of this research.
It can be recognized that the development of deterioration models depends on different factors, based on the available data. The majority of the BMSs within the GCC are still under development and many of them do not include well-defined deterioration models. Therefore, identifying the most important factors that can impact bridge deterioration within the GCC can help the local agencies in the planning and development of their BMSs.
As can be recognized from this review, the concrete bridge’s structural deterioration can be affected by several factors. Such factors include, but are not limited to, environmental conditions, structural systems, bridge configuration, geographic location, traffic data, etc. These factors differ in their level and impact on the bridges within different regions or countries. Therefore, a bridge deterioration model should be different for various geographic locations. Based on that, this paper aims to identify the most important factors that impact bridge deterioration within the GCC countries.

4. Research Design and Methodology

In this section, the research methodology is presented. It includes the explanation of different research approaches that will help in developing the research strategy and the methods of data collection and analysis for the selection of suitable methods for this research. In the last part of this section, the plan for conducting the research and achieving its objective is presented.

4.1. Research Approach

The main approach followed in this research focuses on identifying the proper techniques to collect and analyze the data with the most suitable methods to achieve the research objectives [84,85,86]. In addition, the research approach within this paper discusses the use of deductive and/or inductive approaches [87,88,89,90,91].

4.2. Research Strategy

The research strategy will select one of the main analysis methods, namely, the qualitative, quantitative, or mixed methods [89]. In brief, the quantitative method allows the researchers to obtain a broad and generalizable set of findings and present them in a much clearer way through a deductive approach [88]. In addition, quantitative methods require the researcher to use a pre-constructed standardized method or pre-determined response categories that fit with the participants’ perspectives and experiences [92]. On the other hand, in the qualitative method, participants’ experiences and opinions are expressed through open-ended questions. This method is concerned with the process, context, interpretation, meaning, or understanding through inductive reasoning. Finally, the mixed methods involve combining qualitative and quantitative data in a research study [90]. A mixed-method strategy allows the researcher to use inductive and conductive approaches to answer the research question using different data collection techniques [93,94].

4.3. Research Methods

After discussing the research approaches and different research strategies in the previous section, this section includes the tools to conduct the research, which are data collection and data analysis methods.

4.3.1. Data Collection Methods

A research design comprises identifying the problem statement and then setting the research strategy, which includes the data collection method, sampling design, time horizon, and data analysis [90].
The most popular qualitative data collection methods include interviews, case studies, and focus groups [87]. The interview method provides the researchers with an immediate follow-up and clarification for the required data. Qualitative research relies extensively on in-depth interviewing to distinguish the qualitative data and information required [90]. A case study involves the empirical investigation of a contemporary phenomenon, using multiple sources of evidence [88]. This method enables the researcher to consider multiple sources of evidence and thus it is possible to evaluate them and deal with the studies that may include several variables of interest [91].
The survey method is a tool that can help in determining attitudes, opinions, understanding, and predicting behaviors through asking a set of questions to a sample of persons representing a population [95].

4.3.2. Data Analysis Methods

Qualitative data analysis involves identifying common patterns within the responses and critically analyzing them to achieve research objectives. There are four common approaches to analyze qualitative data, which are content analysis, thematic analysis, textual analysis, and discourse analysis [96]. On the other hand, quantitative data are analyzed by statistical methods. The Relative Importance Index (RII) is a descriptive statistical method for quantitative data analysis. It is used to determine the relative importance of quality factors by ranking them according to their importance value [97]. Many studies have applied the RII in surveys to identify the ranking of different factors included in a study [98,99,100].

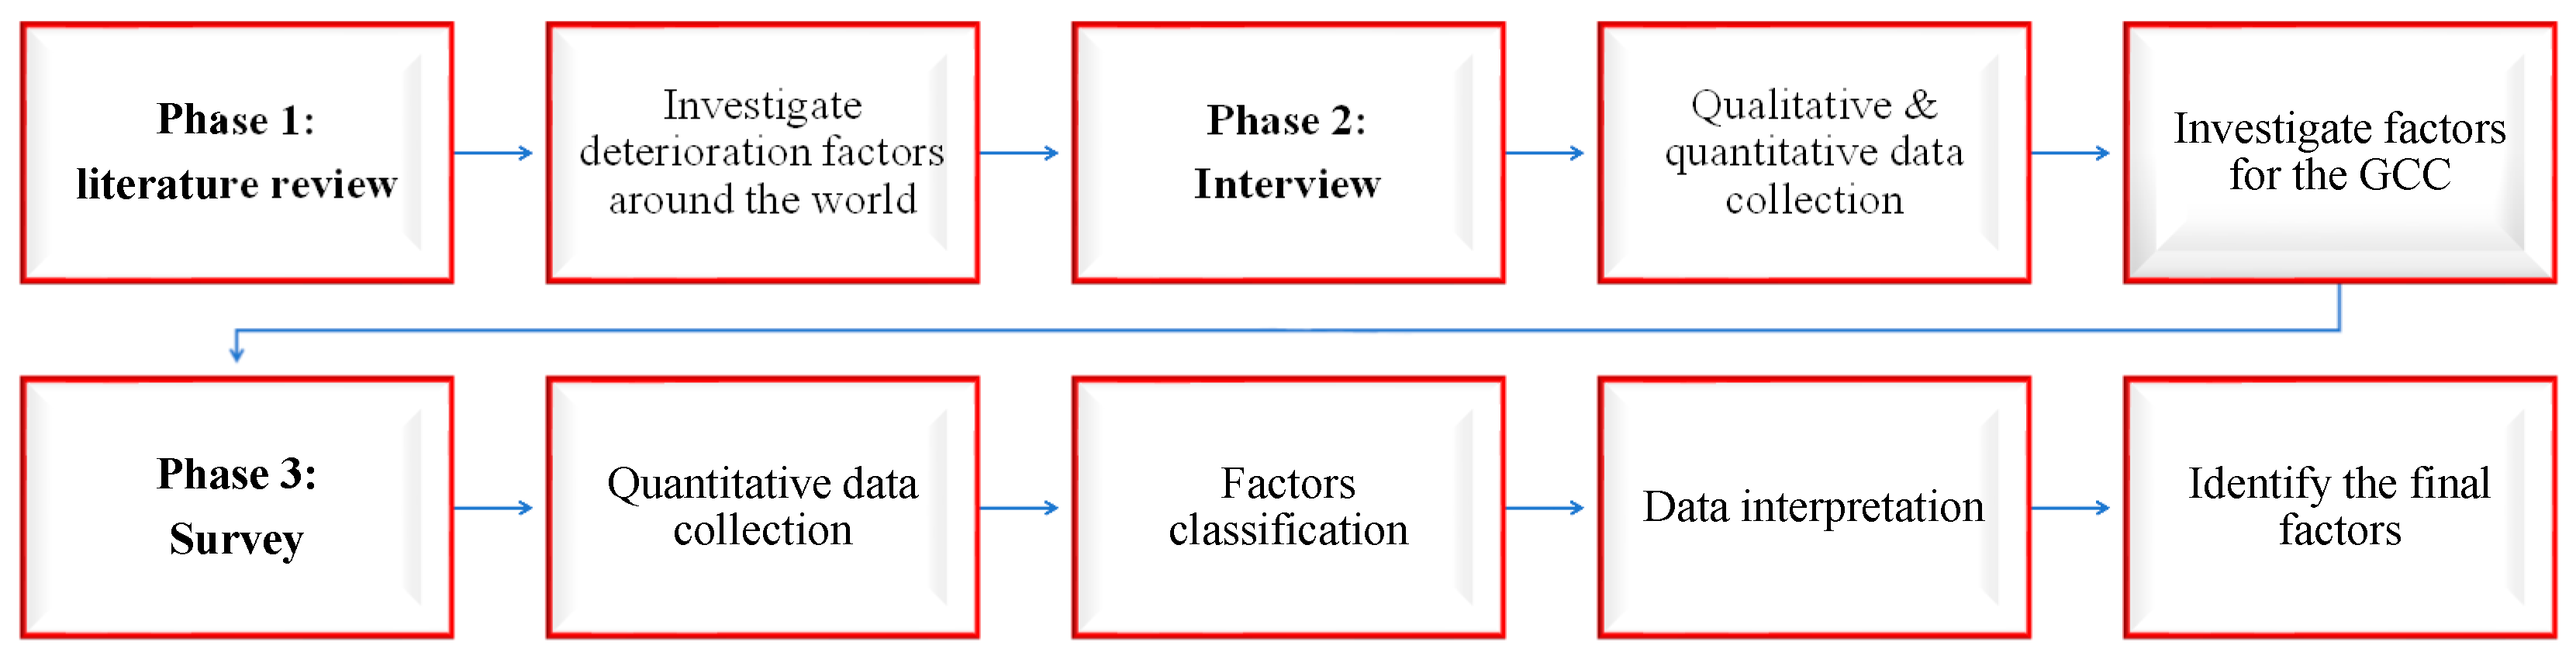
4.4. Research Design Process

To best design the process of this research, the objectives need to be clearly identified. As the main objective is to identify the factors that impact bridge deterioration in the GCC region, the following tasks were followed to accomplish the objective of this research:
  • An extensive literature search was conducted to identify the available deterioration models and the factors that contribute to bridges’ deterioration around the world.
  • The most important factors relevant to the GCC countries were considered for further evaluation and analysis.
  • Several factors were recommended for consideration when developing DMs for the GCC countries to reflect the local conditions in the region.

4.4.1. Research Phases

The above-mentioned tasks are conducted in three phases. In the first phase, a comprehensive literature review on the developed deterioration models around the world was conducted. In addition, several factors that were adopted in the models were identified. These factors were classified into six groups; environmental factors, structural-related factors, dimensional factors, factors related to geographic location, traffic, and other factors. With a total of thirty-three factors found in the literature, only twenty-seven factors were considered in this study based on the environmental conditions of the GCC countries.
The second phase focuses on investigating the factors that contribute to bridges’ deterioration in the GCC countries. This phase includes identifying the most influential factors that affect bridges’ deterioration among the twenty-seven factors concluded from the literature review and exploring more factors that were not mentioned in the literature but may have major effects on the bridges in the GCC. The goal of this phase is to identify the factors that contribute to bridges’ deterioration more than the others from the twenty-seven factors identified in phase one. The prioritization of the factors based on importance is conducted by collecting both qualitative and quantitative data from bridge experts. This phase is performed based on the inductive approach, where it focuses on developing a theory from the general observation of adopted factors in different deterioration models around the world to reach a specific conclusion about the suitability and applicability of these factors to the GCC region. The convergent parallel mixed method is considered a well-suited method for collecting the data through conducting a semi-structured interview targeting expert bridge engineers. The interview considered an effective technique for data collection that enables the researcher to clearly understand the effects of different factors on bridge deterioration and how each factor is considered by the authorities in the GCC. This information will help in analyzing the data for the next phase. The following step of this phase is to analyze the data collected from the interviewees using numerical methods and filter the results to identify the factors that have been considered to have the most significant impact on bridge deterioration. The identification of the factors is carried out using the Relative Importance Index (RII) method.
The third phase of the methodology is to evaluate the weights, or the importance level of each factor, resulting from the interview phase by ranking these factors according to their effect on bridge deterioration. Knowing the weight of the factors and their effect on bridge deterioration will help in grouping these factors into classes, which can facilitate the adoption processes of factors for the deterioration models’ development [80]. This step is executed by conducting a survey of bridge engineers. The survey aims to collect quantitative data, where participants are asked to evaluate the importance level for each factor through assigning weights to each of them. To rank the factors according to the survey results, the Relative Importance Index (RII) method is applied to analyze the data from the survey. The resulting factors that have been selected by bridge engineers can be considered when developing deterioration models in the GCC. Figure 4 shows the process design of this research.
In this phase, the research transfers from the inductive approach to the deductive approach as the final factors will be identified through answering the initial research question established in the first phase.

4.4.2. Sampling Techniques

There are two primary types of sampling methods that can be applied in research, which are probability and non-probability sampling. Probability sampling (random sampling) is a technique where every individual can be considered in the sample regardless of their age, education, background knowledge of the subject, and experience. Probability sampling is used when the objective of the study is to generalize the findings derived from the sample to the general population. It is widely used in quantitative research, where the results are considered as representative of the whole population. There are four types of probability sampling, which are simple random sampling, stratified random sampling, systematic sampling, and cluster sampling. On the other hand, non-probability sampling includes convenience sampling, quota sampling, snowball sampling, judgement sampling, and expert sampling [90,101,102,103,104,105,106].
The objective of this study is to highlight the factors that impact the deterioration of bridges in the GCC. Thus, the non-probability sampling technique is applied and more specifically the expert sampling best fits the research because it depends on the participant’s personal knowledge and experience.
The targeted stakeholders for the interview and the survey for the data collection are experts in road and bridge management such as road authorities, contractors, universities, and consulting companies in Kuwait and the UAE.

5. Data Collection and Analysis

This section presents the data collected in the interview and survey from different stakeholders in bridge design, construction, and management such as governmental road and transportation authorities, private bridge construction contractors, consulting firms, and universities. The first subsection presents the interview data collection, which includes the objective of the interview, the criteria for selecting the participants, and the collected data. It is followed by the second subsection, which discusses the objective, the criteria for selecting the participants, and the data collected in the survey. Finally, a brief discussion on the factors is presented.

5.1. Interview Data Collection and Analysis

The interview phase has two main objectives. The first objective is to investigate the factors that influence the deterioration of bridges from the viewpoint of bridge experts. The second objective of the interview is to highlight the factors that have the most impact based on experts’ responses and consider them for the second step. Within this phase, the factors that have a minor impact on bridge deterioration, based on the interview results, will be eliminated. This step is conducted using statistical analysis. The sampling technique for the data collection is non-probability sampling because selection of the interviewee is non-random and the findings from this phase will not be confidently generalized to the population. Approval was obtained from the Institutional Review Board (IRB) at the American University of Sharjah (AUS) before starting the interviews.

5.1.1. Criteria of Selecting the Interviewees and Sample Size

The participants in the interview have been selected from private and governmental stakeholders. The criteria for selecting these participants include long experience, having 15 years of experience or more in the design, construction, or maintenance of bridge projects in the GCC. In addition, these experts must hold a leadership position in their organizations. The interview phase depends on the participant’s personal knowledge and experience, and for that, the expert sampling technique is used for collecting the data. The targeted organizations to select participants from are:
  • The Public Authority of Road and Transportation (PART) in Kuwait.
  • The Road and Transportation Authority (RTA) in Dubai, UAE.
  • Road and bridge contracting companies.
  • Road and bridge consulting companies.
  • Professors in GCC universities.
For the expert sampling as a type of purposive sampling, several studies [107,108,109] have clarified that for the non-probability sampling that includes judgment and expert sampling, the sample size is determined based on judgements as this type of sampling has no generalization issue. Moreover, Guest et al. [110] confirmed that a sample of 12 respondents can be sufficient, depending on the research problem. Marshall et al. [111] indicated that proper justification is not always provided for the sample size for interviews. However, the credibility in the analysis and reporting of data can be based on the accuracy and robustness of data. They have concluded, based on their findings, that the data would be saturated, and the minimum number of interviews would be in the range of 15 to 20 interviews. According to Weller et al. [112], approximately 12–16 interviews are sufficient for reaching saturation for a research project.
Based on the recommended sample size, the targeted number of participants in the interview phase is 18 participants and the achieved sample size is 15, as shown in Table 3.

5.1.2. Interview Data Analysis

As the objective of the interview is to investigate the factors that contribute to bridge deterioration, the interview included three parts. The first part involves demographic information about the years of experience, work sector, and job title. There were 15 positive responses from the 18 targeted participants, which represents an acceptable response rate of 83.3% [110,111,112]. As can be seen from Table 3, the interviewees in road and transportation sectors in both governmental and private institutes represent 80% of the responses, while the academic respondents represent 20% of the sample.
The second part of the interview included questions concerning the bridge management process within the participants’ institute such as the bridge inspection routine and criteria for initiating the inspection, types of defects found in the bridges, and the bridge management system applied in their institutes. This part of the interview also included questions on deterioration models, whether the institute has a deterioration model, and what factors were included in the model if the institute had developed a deterioration model for bridges. The results of the bridge management part of the interview revealed the following information:
  • From the 15 participants from different stakeholders, only 6 stated that their institutes have a BMS, and only 3 of these BMSs include a simple deterioration model.
  • The factors that have been included in the bridge management system (BMS) were age, temperature change, structure type and material, number of spans, bridge width, bridge length, bridge condition index, and bridge reliability index.
  • About 67% of the road and transportation authorities and contracting and consulting companies conduct inspections of the bridge elements.
  • Only 40% of these institutes conduct preventive maintenance in their bridge management program.
  • The participants provided information on the commonly defective elements and the reason for the defects.
The third part of the interview included two main questions. Based on the factors identified in the literature, the interviewees were asked to select the factors that influence bridge deterioration in the GCC countries. In addition, the interviewees were asked to list any additional factors that influence bridge deterioration. The interviewees selected 14 factors according to their expert opinion which contribute to bridge deterioration. Some of these factors were related to the environment and climate in the GCC area such as high temperature, humidity, wind load, and temperature change. Other factors were related to the defect type such as chloride attack and scouring. The poor-quality control during construction was also reported as one of the factors that contributed to bridge deterioration. This includes absence of anti-carbonation paints, absence of cathodic protection for steel reinforcement, construction and supervision mistakes, and lack of inspection and maintenance. Some of the responses mentioned other factors such as the percent increase in traffic volumes, structural and design deficiencies, and steel reinforcement corrosion as affecting bridge deterioration in GCC countries.
To achieve the second objective of the interview phase, a list of 27 factors was presented to the interviewees, and they were asked to select the factors that contribute to the deterioration of bridges and assign weights (total of 100%) to these factors. In addition, each interviewee has the option to add any other factors that are not included in the list of factors. This step enables the filtration of the factors with a minor impact on bridge deterioration and the identification of the factors with a significant impact. Table 4 shows the factors selected by the participants and the average weights given to each of these factors.
As it appears from the values in Table 4, only two factors received a weight that is higher than 15%. Specifically, these were the inspection gap (19.5%) and the defect type (16.0%). Also, some factors were evaluated with a weight that ranges between 10% and 15%. These factors include time of rehabilitation (11.17%), design load (11.33%), age (14.0%), chloride (11.5%), and services under the bridge (10.5%). Most of the factors (13 factors) were evaluated with a weight that ranges from 5% to 10%. The rest of the factors received a weight that is less than 5%. When considering the number of participants who selected each factor, it shows that there are two factors that were selected by 12 participants. These factors are ADTT and the steel reinforcement protection. The second set of factors were selected by 9–11 participants. This set includes ADT, age, temperature, chloride, inspection gap, services under the bridge, and deck protection. The rest of the factors were selected by three to seven participants, except for the wearing surface type, which was not selected by any participant.
The participants in the interview phase evaluated the factors that have different impacts on bridge deterioration by assigning a weight out of 100% to each factor. As a result, factors that have a low percentage of weights will be eliminated as their impact is minor. To analyze the data, the Relative Importance Index (RII) method was used to evaluate the relevant importance of the factors to bridge deterioration. Sakhare and Patil [98] defined the RII method as a non-parametric technique that is widely used by construction and facilities management researchers for analyzing structured questionnaire responses for data. Equation (1) is used to calculate the RII for each factor [100]:
R I I = W A × N   * 100  
where W is the weight given to each factor by the respondents (total 100%), A is the highest weight (100%), and N is the total number of respondents. The final value is multiplied by 100 to obtain the percentage value. Applying Equation (1), the RII value for each factor is presented in Table 5.
The criteria for the nomination of factors to the second phase of this study are created by finding the limiting RII value for the factors, which is 3.703. The reason for choosing this RII value as an elimination point is that the total importance indicator equals to 100% and the number of factors is 27, so dividing the total importance indicator by the number of factors will give the minimum percentage weight that might be given to any factor to consider it.
The analysis of the interview has revealed a total of 12 factors, as highlighted in Table 5. These factors are time of rehabilitation, design load, average daily truck traffic (ADTT), age, temperature, chloride, inspection gap, services under the bridge, deck protection, average daily traffic (ADT), defect type, and steel reinforcement protection. In addition, the experts suggested wind load as an additional factor. Accordingly, a total of 13 factors will be included in the survey phase.

5.2. Survey Data Collection and Analysis

This section presents the survey phase. It discusses the objective, the criteria of selecting the participants, and the sampling technique selection along with the sample size. At the end of the section, the responses of the survey and the analysis method used are presented. Before distributing the survey, approval from the Institutional Review Board (IRB) at the American University of Sharjah (AUS) was obtained.
The objective of the survey phase is to rank the factors that resulted from the interview phase. The factors that have been chosen by the bridge experts are ranked according to their importance level and impact on bridge deterioration. This ranking was performed based on the judgment of the bridge engineers. Ranking the factors that impact the deterioration of bridges has many advantages to the deterioration model’s development. Abdelhady and Moselhi [79,80] mentioned that ranking the factors improves the performance of the model’s prediction by reducing the dimensionality of the data, computational time and complexity, and memory requirements. Moreover, factor ranking helps in developing more interpretable predictive models and provides better insights into and understanding of the most influential factors affecting bridge deterioration conditions [74,113,114,115,116]. In this step, the objective of the research will be accomplished by identifying the final ranking of factors that impact bridge deterioration in the GCC.

5.2.1. Criteria of Selecting the Participants and Sample Size

The participants in the survey phase are engineers from different private and governmental bridge stakeholders. Because of the limited number of bridge engineers and to collect data from a wide range of experiences, the condition of a specific number of years of experience in the field was not mandatory within this phase. In this step, the selection of the participants was restricted to bridge engineers. Therefore, the sampling technique used was expert sampling. Moreover, some of the bridge engineers could not be reached directly, and for that reason, snowball sampling was also used in this phase along with the expert sampling.
Considering the required sample size for the survey, Memon et al. [107] emphasizes that the sample size is not necessarily as important as the way data are collected. Many researchers have suggested several guidelines to determine the sample size in surveys. The sample size is considered as a ratio based on the number of questions in the survey. The minimum ratio that can be taken as a sample shall not be less than 5-to-1. This method is generally recommended for exploratory factors [117,118]. Krejcie and Morgan [108] indicated that a study with a small population in the range of 10–35 will require at least 90–93% of the population to be taken as a sample for the study. According to Kish [119], the minimum sample size for social science research should be taken as 30–200. Gall et al. [120] indicated that if the research has a relational survey design, the sample size should not be less than 30 and comparative and experimental studies require more than 50 samples. Roscoe [121] developed strategies to ensure a proper sample size that represents the population of the study and recommended a sample size of 30 to 500 in most cases. However, it was also mentioned that for simple experimental research with tight experimental controls, successful research is possible with samples as small as 10 to 20 in size. Finally, Mooi et al. [122] proposed that researchers should consider estimating the percentage of respondents that they are likely to reach, the percentage of respondents willing to participate, and the percentage of respondents likely to complete the questionnaire accurately.
Based on that, the sample size for the survey was planned to have a minimum of 30 participants. The survey started based on expert sampling and then followed a snowball sampling technique to reach more participants. Table 6 summarizes the list of engineers that were targeted and the actual number of engineers reached by the snowball sampling technique willing to participate in the survey. The final number of participants in the survey is 36.

5.2.2. Survey Results and Analysis

The survey was structured in two parts. The first part included questions on years of experience, working sector, and education level. Figure 5 shows the percentage from each sector participating in the survey. Approximately 70% of the responses were provided by participants from the governmental sector and the consulting sector.
Although there is no requirement for the number of years of experience in this phase, 40.6% of the participants had 15 years or more of work experience in bridges, while 15.3% had between 5 and 14 years of experience.
In the second part of the survey, the factors concluded from the interview were presented to assess the level of importance. The participants were asked to evaluate the importance of the factors according to their effect on bridge deterioration using four importance indexes: extremely important, very important, somewhat important, and not so important. The factors that were considered in this part to be evaluated by the engineers are time of rehabilitation, ADTT, ADT, age, temperature, chloride attack, inspection gap, services under the bridge, deck protection, steel reinforcement protection, defect type, design load, and wind load. The participating engineers evaluated the factors as shown in Table 7 and Figure 6 and Figure 7.
As can be noted from Figure 6 and Figure 7, about 50% of the participants considered chloride attack, design load, and steel protection to be extremely important. Also, ADT, defect type, inspection gap, time of rehabilitation, and deck protection are considered by a significant percentage of the participants (around 50%) to be very important.
The objective of the survey phase is to rank the factors that impact bridge deterioration according to their importance level. One of the common approaches to achieve this objective is using the Relative Importance Index (RII) method that is widely applied in the construction and facilities management for analyzing structured questionnaire responses [84,85,86,87,88,89,90,123]. The Relative Importance Index is calculated based on Equation (1) using a Likert scale. The Likert scale represents weights assigned to the factors to evaluate them. Usually, the Likert scale consists of five scales from 1 to 5, where 1 represents the least significant effect weight and 5 represents the most significant effect weight [124]. However, the Likert scale used in this study consists of four scales from 1 to 4. Because there are no factor exclusion processes in the survey phase, the option “not important”, which represents the fifth scale in the Likert scale, is not listed in the survey. In the four Likert scales used here, the index “extremely important” represents scale 4 and the index “not so important” represents scale 1.
From the interview phase, a total of 13 factors were presented in the survey for evaluation and ranking. Using Equation (1), the RII values for the 13 factors were calculated, as shown in Table 8.
The limits for the importance level were obtained based on the difference between the maximum and minimum RII values (0.847–0.618), and then they were divided into four equal classes. The limits are presented in Table 9.
Based on the limits shown in Table 9, the factors are categorized into four importance levels based on the RII values as follows:
  • Factors with the extremely important level: Factors with an RII value more than 0.77 are considered extremely important factors. These factors are steel reinforcement protection, design load, chloride attack, type of defect, and age.
  • Factors with the high importance level: Factors with an RII value more than 0.71 and less than 0.77 are considered highly important factors. These factors are time of rehabilitation, ADTT, and ADT.
  • Factors with the medium importance level: Factors with an RII value more than 0.65 and less than 0.71 are considered important factors. These factors are deck protection, services under the bridge, and inspection gap.
  • Factors with the low importance level: Factors with an RII value less than 0.65 are considered low importance deterioration factors. These factors are temperature and wind load.
The purpose of categorizing the factors to the four categories of importance levels is to provide better insights into and understanding of the most influential factors affecting bridge deterioration conditions. This will help in developing more interpretable predictive deterioration models. Agencies can prioritize the selection of the factors when developing deterioration models and can manage and plan the process of collecting the data for these factors. Agencies with high financial and technical resources can consider all the factors in their data collection system to prepare for the deterioration model’s development. In case of a lack of resources and funds, agencies should consider the selection of factors based on the importance level of the factors. Although some factors were not included in the survey phase, some of the data for these factors are considered available in the blueprints, and when no financial or technical resources are available, engineers can consider these factors in the model development. Such factors are geometry factors such as number of spans, deck width and length, bridge elevation, superstructure type, etc.

5.3. Comparing the Final List of Factors

In Section 2 of this paper, an extensive literature review was conducted to collect information on different deterioration models for bridges around the world, in which different factors adopted in these models were identified. The total number of factors found in the literature review was thirty-three. Some factors were eliminated because of the environmental conditions in the GCC, which resulted in a total of 27 factors. Based on the interviews with experts, this list was reduced to 13 factors. The comparison of the factors selected in this paper and the consideration of the same factors in the reviewed literature is presented in Table 10.
Referring to Table 10, it can be observed that two factors (age and ADT) received comparable percentages. On the other hand, several factors showed a much higher percentage for the GCC. Some of these factors can be attributed to the harsh environmental conditions in the GCC such as temperature, chloride attack, wind load, deck protection, and steel reinforcement protection. All these factors are related to the high temperature, high humidity, and the presence of major sandstorms in the GCC. Another set of factors are related to the lack of control over the truck loads within the GCC. These factors are the ADTT and the design load. Because most of the countries in North America and Europe have weighing stations to control the maximum truck load, such factors are not of a high importance in these countries. The third set of factors includes the type of defect, inspection gap, and time of rehabilitation. These factors showed higher percentages in the GCC because of the lack of well-developed BMSs. Finally, the services under the bridge showed a higher percentage in the GCC because of the poor planning at the early stages of the infrastructure development in the GCC countries.
These results support the claim that the factors impacting bridge deterioration are significantly impacted by the region. In addition, a recent study [125] indicated that the management of bridges is still a major challenge that must be addressed. Furthermore, advancements in evaluation methods of bridges can facilitate the development of deterioration models [126].

6. Conclusions

As the majority of the GCC countries have not developed robust deterioration models yet, it is important to be aware of the factors that contribute to bridge deterioration. These factors could be considered by the agencies in the area of bridge management when developing deterioration models. The research was conducted in three phases:
  • An extensive literature search on bridge deterioration models was conducted in the first phase. The search led to the identification of 33 factors, which were filtered to 27 factors that suit the climate and conditions within the GCC countries.
  • In the second phase, interviews were conducted with bridge stakeholders targeting experts with 15 years of experience or more in bridge management/design in governmental, private, and academic sectors in the GCC. The bridge experts’ responses were utilized to evaluate the 27 factors and highlight the factors with a major impact on bridge deterioration in the GCC. The evaluation revealed 13 factors that have the most impact on bridge deterioration based on the experts’ opinion.
  • A survey was conducted in phase three of the research to identify the factors and rank them according to their importance level. Several bridge engineers from different stakeholders were involved in the survey. The survey included the 13 factors selected by the experts. The collected data from the responses were analyzed using the Relative Importance Index (RII) and the factors were categorized into four importance levels: extreme importance, high importance, medium importance, low importance.
The results showed that steel reinforcement protection, design load, chloride attack, type of defect, and age have an extreme importance level when considering their impact on bridge deterioration in the GCC. By categorizing the factors to the four categories of importance levels, a better insight and understanding of the most influential factors affecting bridge deterioration is provided. This will help in developing a more interpretable predictive deterioration model. Agencies can prioritize the selection of the factors when developing deterioration models and can manage and plan the process of collecting the data of these factors.
In this research, the main limitation that was encountered is the number of responses for the interview and the survey. These numbers could be increased with more time.
This limitation does not affect the results of this research because the selection of the factors was based on the expert’s involvement, judgments, and experience in bridge deterioration in these countries.

Author Contributions

Conceptualization, A.A. and S.Y.; methodology, R.A.-R.; validation, R.A.-R., A.A. and S.Y.; formal analysis, R.A.-R.; investigation, R.A.-R., A.A. and S.Y.; resources, R.A.-R., A.A. and S.Y.; data curation, R.A.-R. and A.A.; writing—original draft preparation, R.A.-R.; writing—review and editing, A.A. and S.Y.; visualization, R.A.-R.; supervision, A.A. and S.Y.; project administration, A.A. All authors have read and agreed to the published version of the manuscript.

Funding

This research received no external funding.

Data Availability Statement

The data used in this research are available in detail in the MSc thesis titled “Identifying the Factors Impacting Bridge Deterioration in the GCC”, by Rawan Al-Rashed and published by the American University of Sharjah, Sharjah, UAE.

Acknowledgments

The work is part of the 2011 Provost Challenge grant and is supported, in part, by the College of Engineering at the American University of Sharjah. This paper represents the opinions of the author(s) and does not mean to represent the position or opinions of the American University of Sharjah.

Conflicts of Interest

The authors declare no conflict of interest.

References

  1. James, W.; Stukhart, G.; Garcia-Diaz, A.; Sobanjo, J. Analytical Approach to the Development of a Bridge Management System. Transp. Res. Rec. 1991, 1290, 57–170. [Google Scholar]
  2. Hart, M.; Schrock, S. Highway Bridge Maintenance Planning and Scheduling; Elsevier Inc.: Amsterdam, The Netherlands, 2016; pp. 291–298. [Google Scholar]
  3. Lee, J. A Methodology for Developing Bridge Condition Rating Models Based on Limited Inspection Records. Ph.D. Thesis, Griffith University, Queensland, Australia, 2007. [Google Scholar]
  4. Frangopol, D.M.; Gharaibeh, E.S.; Kong, J.S.; Miyake, M. Optimal Network-Level Bridge Maintenance Planning Based on Minimum Expected Cost. Transp. Res. Rec. J. Transp. Res. Board 2000, 1696, 26–33. [Google Scholar] [CrossRef]
  5. Edward, R.E., Jr.; Zayed, T.; Boyd, A.; Mendoza, M. Best practice of bridge system management. J. Manag. Eng. 2006, 22, 186–195. [Google Scholar]
  6. Yehia, S.; Abdelfatah, A.; Abu Dabous, S. A conceptual framework for a bridge management system for the United Arab Emirates. Bridg. Struct. 2012, 8, 67–79. [Google Scholar] [CrossRef]
  7. Czepiel, E. Bridge Management Systems: Literature Review and Search; Northwestern University BIRL Industrial Research Laboratory: Evanston, IL, USA, 1995. [Google Scholar]
  8. Yari, N. New Model for Bridge Management System (BMS): Bridge Repair Priority Ranking System (BRPRS), Case Based Reasoning for Bridge Deterioration, Cost Optimization, and Preservation Strategy. Ph.D. Thesis, University of New Hampshire, Durham, NH, USA, 2018. [Google Scholar]
  9. Robert, W.; Marshall, A.; Shepard, R.; Aldayuz, J. Pontis Bridge Management System: State of the Practice in Implementation and Development. In Proceedings of the 9th International Bridge Management Conference, Orlando, FL, USA, 28–30 April 2003; pp. 49–60. [Google Scholar]
  10. Alexander, J. Development of a Condition-Based Deterioration Model for Bridges in Rhode Island. Master’s Thesis, University of Rhode Island, Kingston, RI, USA, 2018. [Google Scholar]
  11. Callow, D. Optimization of the Neural Network Process for an Improved Bridge Deterioration Model. Ph.D. Thesis, Griffith University, Queensland, Australia, 2015. [Google Scholar]
  12. Yanev, B.; Testa, R. Life Cycle Performance of Bridge Components in New York City. In Proceedings of the Eighth International Bridge Management Conference, Denver, CO, USA, 26–28 April 1999. [Google Scholar]
  13. Austroads. Bridge Management Systems—The State of the Art; Publication No: AP-R198-02; Austroads Inc.: Sydney, Australia, 2002. [Google Scholar]
  14. Moomen, M.; Qiao, Y.; Agbelie, R.; Labi, S.; Sinha, K. Bridge Deterioration Models to Support Indiana’s Bridge Management System; Indiana Department of Transportation and Purdue University: West Lafayette, IN, USA, 2016. [Google Scholar]
  15. Bevc, L.; Perus, I.; Mahut, B.; Grefstad, K. Review of Existing Procedures for Optimization; Deliverable D3 for the BRIME Report Project PL97-2220; Transportation Research Laboratory: London, UK, 2001; pp. 15–17. [Google Scholar]
  16. Green, S.; Richardson, J. Development of a bridge management system in Alabama. Transp. Res. Circural 1994, 432, 72–80. [Google Scholar]
  17. Sobanjo, J.; Thompson, P. Project Planning Models for Florida’s Bridge Management System. In Florida Department of Transportation; Florida State University: Tallahassee, FL, USA, 2004; pp. 1–4. [Google Scholar]
  18. Johnson, M.; Kerr, R.; Thompson, T.; Ailaney, R. Bridge Management Experiences of California, Florida, and South Dakota; Federal Highway Administration: Washington, DC, USA, 2005. Available online: https://www.fhwa.dot.gov/infrastructure/asstmgmt/bmcs7.pdf (accessed on 24 April 2023).
  19. Sobanjo, J. Enhancement of the FDOT’s Project Level and Network Level Bridge Management Analysis Tools; Florida State University: Tallahassee, FL, USA, 2011. [Google Scholar]
  20. Rens, K.L.; Nogueira, C.L.; Neiman, Y.M.; Gruber, T.; Johnson, L.E. Bridge Management System for the City and County of Denver. Pract. Period. Struct. Des. Constr. 1999, 4, 131–136. [Google Scholar] [CrossRef]
  21. Thompson, P.; Kerr, B.; Cheetham, A.; Ellis, R. The New Ontario Bridge Management System. TRB Transp. Res. Circ. 1999, 498, F-6/1–F-6/15. [Google Scholar]
  22. Thompson, R.; Ellis, R.; Hong, K.; Merlo, T. Implementation of the Ontario bridge management system. In Proceedings of the 9th International Bridge Management Conference, National Orlando, FL, USA, 28–30 April 2003. [Google Scholar]
  23. Anderson, N. DANBRO-A bridge management system for many levels. In Advanced Research Workshop on Bridge Evaluation, Repair and Rehabilitation; Nowak, A., Ed.; Klumer Academic Publishers: Baltimore, ML, USA, 1990. [Google Scholar]
  24. Lauridsen, J.; Lassen, B. The Danish Bridge Management System DANBRO; Management of Highway Structures: London, UK, 1999; pp. 61–70. [Google Scholar]
  25. Soderqvist, M. The Finnish Practice and Experience Regarding Bridge Inspection and Management; Management Highway Structures, Thomas Telford: London, UK, 1999; pp. 71–80. [Google Scholar]
  26. Mirzaei, Z.; Adey, B.; The IABMAS Bridge Management Committee. Overview of Existing Bridge Management Systems. In Proceedings of the 6th International Conference on Bridge Maintenance, Safety and Management (IABMAS 2012), International Association for Bridge Maintenance and Safety (IABMAS), Stresa, Italy, 8–12 July 2012. [Google Scholar]
  27. Hayter, G.; Allison, B. Structure Management Information Systems (SMIS); Management of Highway Structures, Thomas Telford: London, UK, 1999; pp. 153–162. [Google Scholar]
  28. Godart, B.; Vassie, P. Bridge Management Systems: Extended Review of Existing Systems and Outline Framework for a European System; Deliverable D13 for BRIME Project; European Commission: Brussels, Belgium, 2001; pp. 97–220. [Google Scholar]
  29. Everett, T.; Weykamp, P.; Capers, H. Bridge Evaluation Quality Assurance in Europe; FHWA-PL-08-016; Federal Highway Administration, U.S. Department of Transportation: Washington DC, USA, 2008; pp. 7–22.
  30. Agardy, G.; Bako, A.; Gaspar, L.; Kolozsi, G.; Lubloy, A.; Molnar, I. Adaption of PONTIS BMS to Hungarian conditions. In Proceedings of the 4th Austroads Bridge Conference, Sydney, Australia, 29 November–1 December 2000; Austroads: Sydney, Australia, 2000; pp. 61–70. [Google Scholar]
  31. Marinković, M.; Matić, B.; Stevanović, R. Bridge Management System in Europe. In Proceedings of the 6th International Conference Civil Engineering—Science and Practice, Žabljak, Montenegro, 7–11 March 2016; Volume 6. [Google Scholar]
  32. Gusella, V.; Materazzi, A.; Moriconi, C. Information System for Management of Bridges Owned by the Province of Perugia, Italy. In Bridge Management 3: Inspection, Maintenance, Assessment and Repair; Harding, J.E., Parke, G.A.R., Ryall, M.J., Eds.; Spon: London, UK, 1996; pp. 595–602. [Google Scholar]
  33. Romack, G.; Christian, G.; Shepard, R.; Thompson, T.; Young, R. Bridge Preservation and Maintenance in Europe and South Africa; FHWA-PL-05-002; Federal Highway Administration: Washington, DC, USA, 2005; pp. 3–68. [Google Scholar]
  34. Miyamoto, A.; Nakamura, K.; Nakamura, H. Development of a Bridge Management System for Existing Bridges. Adv. Eng. Softw. 2001, 32, 821–833. [Google Scholar] [CrossRef]
  35. Steele, K.; Cole, G.; Parke, G.; Clarke, B.; Harding, J. Bridge Maintenance Strategy and Sustainability. In Bridge Management 4: Inspection, Maintenance, Assessment and Repair; Ryall, M.J., Parke, G.A.R., Harding, J.E., Eds.; E&FN Spon, Thomas Telford: London, UK, 2000; pp. 361–369. [Google Scholar]
  36. Thompson, L.; Shirole, A.; Sinha, S. Equations for quantitative assessments of the long-term effectiveness of bridge actions. In Proceedings of the 90th Annual Meeting of the Transportation Research Board, Washington, DC, USA, 23–27 January 2011. [Google Scholar]
  37. de Dieu, G.J.; Chingui, J.A.; Botir, E. A Review of Bridge Management System: Deterioration Models. Asian J. Eng. Technol. 2020, 8, 55–62. [Google Scholar]
  38. Srikanth, I.; Arockiasamy, M. Deterioration models for prediction of remaining useful life of timber and concrete bridges: A review. J. Traffic Transp. Eng. 2020, 7, 152–173. [Google Scholar] [CrossRef]
  39. Kotze, R.; Ngo, H.; Seskis, J. Improved Bridge Deterioration Models, Predictive Tools and Cost; Austroads: Sydney, Australia, 2015. [Google Scholar]
  40. Mauc, M.; Madanat, S. Semiparametric hazard rate models of reinforced concrete bridge deck deterioration. J. Infrastruct. Syst. 2001, 7, 49–57. [Google Scholar] [CrossRef]
  41. Alozn, M.; Ahmed, S.; Yehia, S.; Abdelfatah, A. Deterioration Models for Concrete Structures; Infrastructure Management, Assessment and Rehabilitation; Cambridge Scholars Publishing: Newcastle, UK, 2021; pp. 180–191. ISBN 9781527569478. [Google Scholar]
  42. Winn, E. Artificial Neural Network Models for the Prediction of Bridge Deck Condition Ratings. Master’s Thesis, Michigan State University, East Lansing, MI, USA, 2011. [Google Scholar]
  43. Sanders, D.; Zhang, J. Bridge Deterioration Models for States with Small Bridge Inventories. Transp. Res. Rec. 1442, 1994, 101–109. [Google Scholar]
  44. Madanat, S.; Mishalani, R.; Ibrahim, W.H.W. Estimation of Infrastructure Transition Probabilities from Condition Rating Data. J. Infrastruct. Syst. 1995, 1, 120–125. [Google Scholar] [CrossRef]
  45. Morcous, G. Comparing the Use of Artificial Neural Networks and Case-based Reasoning in Modeling Bridge Deterioration. In Proceedings of the Annual Conference of the Canadian Society for Civil Engineering, Montréal, QC, Canada, 5–8 June 2002; pp. 1–9. [Google Scholar]
  46. Ali, G.; Assaad, R.; Elsayegh, A.; El-Adaway, I. Artificial Neural Network Model for Bridge Deterioration and Assessment. In Proceedings of the CSCE Annual Conference, Laval, QC, Canada, 12–15 June 2019; pp. 1–10. [Google Scholar]
  47. Naderimoghaddam, T. A Comparison of Bridge Deterioration Models. Master’s Thesis, Georgia Southern University, Statesboro, GA, USA, 2018. [Google Scholar]
  48. Moomen, M.; Siddiqui, C. Probabilistic deterioration modeling of bridge component condition with random effects. J. Struct. Integr. Maint. 2022, 7, 151–160. [Google Scholar] [CrossRef]
  49. Huang, Y.-H. Artificial Neural Network Model of Bridge Deterioration. J. Perform. Constr. Facil. 2010, 24, 597–602. [Google Scholar] [CrossRef]
  50. Aboura, K.; Samali, B.; Crews, K.; Li, J. Stochastic Deterioration Processes for Bridge Lifetime Assessment. In Proceedings of the 2008 Third International Conference on Broadband Communications, Information Technology & Biomedical Applications, Pretoria, South Africa, 23–26 November 2008; pp. 437–442. [Google Scholar]
  51. Bolukbasi, M.; Mohammadi, J.; Arditi, D. Estimating the Future Condition of Highway Bridge Components Using National Bridge Inventory Data. Pract. Period. Struct. Des. Constr. 2004, 9, 16–25. [Google Scholar] [CrossRef]
  52. Hatami, A.; Morcous, G. Developing Deterioration Models for Nebraska Bridges; SPR-P1(11) M302; University of Nebraska: Lincoln, NE, USA, 2011; pp. 23–35. [Google Scholar]
  53. Saeed, T.U.; Moomen, M.; Ahmed, A.; Murillo-Hoyos, J.; Volovski, M.; Labi, S. Performance Evaluation and Life Prediction of Highway Concrete Bridge Superstructure across Design Types. J. Perform. Constr. Facil. 2017, 31, 04017052. [Google Scholar] [CrossRef]
  54. Agrawal, A.K.; Kawaguchi, A.; Chen, Z. Bridge Element Deterioration Rates; Report # C-01-51; The City College of New York Department of Civil Engineering: New York, NY, USA, 2009. [Google Scholar]
  55. Morcous, G.; Rivard, H.; Hanna, A.M. Modeling Bridge Deterioration Using Case-based Reasoning. J. Infrastruct. Syst. 2002, 8, 86–95. [Google Scholar] [CrossRef]
  56. Ramani, S. A Markov-based Analysis of the State of Ohio’s Bridge Inventory and Novel Approaches to the Estimation of Bridge Degradation Rates. Master’s Thesis, University of Cincinnati, Cincinnati, OH, USA, 2010. [Google Scholar]
  57. Althaqafi, E.; Chou, E. Developing Bridge Deterioration Models Using an Artificial Neural Network. Infrastructures 2022, 7, 101. [Google Scholar] [CrossRef]
  58. Chyad, A. Deterioration Prediction Modeling for the Condition Assessment of Concrete Bridge Decks. Master’s Thesis, Western Michigan University, Kalamazoo, MI, USA, 2018. [Google Scholar]
  59. Martinez, P.; Mohamed, E.; Mohsen, O.; Mohamed, Y. Comparative Study of Data Mining Models for Prediction of Bridge Future Conditions. J. Perform. Constr. Facil. 2020, 34, 04019108. [Google Scholar] [CrossRef]
  60. Weissmann, J.; Weissmann, A.J.; Montoya, A. Deterioration Models for Texas Bridges and Culverts. Transp. Res. Rec. J. Transp. Res. Board 2023, 2677, 307–316. [Google Scholar] [CrossRef]
  61. Hussein, A.; Abu Tair, A. Estimating Bridge Deterioration Age Using Artificial Neural Networks. Int. J. Eng. Technol. 2019, 11, 29–32. [Google Scholar] [CrossRef]
  62. Shengzhi, S.; Weinbergera, K.; Spanglera, K.; Eliota, M.; Brauna, J.; Welleniusa, G. Ambient temperature and preterm birth: A retrospective study of 32 million US singleton births. Environ. Int. 2019, 126, 7–13. [Google Scholar]
  63. Foster, D. Bridge Deterioration Models and Rates; Caltrans Division of Research, Innovation and System Information, Office of Asset Management: Sacramento, CA, USA, 2020. [Google Scholar]
  64. Khairullah, Y.; Roszilah, H. Developing a Bridge Condition Rating Model Based on a Limited Number of Data Sets; IntechOpen: London, UK, 2018. [Google Scholar] [CrossRef]
  65. Miao, P. Prediction-Based Maintenance of Existing Bridges Using Neural Network and Sensitivity Analysis. Adv. Civ. Eng. 2021, 2021, 1–17. [Google Scholar] [CrossRef]
  66. He, X.; Wang, W.; Hu, W.; Zhang, H. Bridge Deterioration Analysis Based on Censored Data: A Case Study in Yunnan Province. IOP Conf. Ser. Mater. Sci. Eng. 2020, 787, 012035. [Google Scholar] [CrossRef]
  67. Hasan, S. Deterioration Prediction of Concrete Bridge Components Using Artificial Intelligence and Stochastic Methods. Master’s Thesis, RMIT University, Melbourne, Australia, 2015. [Google Scholar]
  68. Mašović, S.; Hajdin, R. Modelling of bridge elements deterioration for Serbian bridge inventory. Struct. Infrastruct. Eng. 2013, 10, 976–987. [Google Scholar] [CrossRef]
  69. Kallen, M.; Noortwijk, J. Statistical inference for Markov deterioration models of bridge conditions in the Netherlands. In Proceedings of the 3rd International Conference on Bridge Maintenance, Safety and Management, Bridge Maintenance, Safety, Management, Life-Cycle Performance and Cost, Porto, Portugal, 16–19 July 2006; pp. 535–536. [Google Scholar]
  70. Santos, A.F.; Bonatte, M.S.; Sousa, H.S.; Bittencourt, T.N.; Matos, J.C. Improvement of the Inspection Interval of Highway Bridges through Predictive Models of Deterioration. Buildings 2022, 12, 124. [Google Scholar] [CrossRef]
  71. Furtado, F.; Ribeiro, D. Railway Bridge Management System Based on Visual Inspections with Semi-Markov Continuous Time Process. KSCE J. Civ. Eng. 2022, 27, 233–250. [Google Scholar] [CrossRef]
  72. Li, M.; Jia, G. Age, state, and environment dependent non-homogeneous stochastic model for improved bridge deterioration prediction. In Bridge Maintenance, Safety, Management, Life-Cycle Sustainability and Innovations; CRC Press: Sapporo, Japan, 2021. [Google Scholar]
  73. Cavalline, T.; Whelan, M.; Tempest, B.; Goyal, R.; Ramsey, J. Determination of Bridge Deterioration Models and Bridge User Costs for the NCDOT Bridge Management System; North Carolina Department of Transportation: Raleigh, NC, USA, 2015. [Google Scholar]
  74. Assaad, R.; El-Adaway, I.H. Bridge Infrastructure Asset Management System: Comparative Computational Machine Learning Approach for Evaluating and Predicting Deck Deterioration Conditions. J. Infrastruct. Syst. 2020, 26, 04020032. [Google Scholar] [CrossRef]
  75. Rajkumar, M.; Nagarajan, S.; Arockiasamy, M. Bridge Infrastructure Management System: Autoencoder Approach for Predicting Bridge Condition Ratings. J. Infrastruct. Syst. 2023, 29, 04022042. [Google Scholar] [CrossRef]
  76. Ahmed, M.; Moselhi, O.; Bhwomick, A. Integration of NDE Measurements and Current Practice in Bridge Deterioration Modeling. In Proceedings of the 33th International Symposium on Automation and Robotics in Construction, Auburn, Alabama, 18–21 July 2016; pp. 341–349. [Google Scholar]
  77. Nguyen, T.T.; Dinh, K. Prediction of bridge deck condition rating based on artificial neural networks. J. Sci. Technol. Civ. Eng. (STCE)-NUCE 2019, 13, 15–25. [Google Scholar] [CrossRef]
  78. Ruck, G.; Francis, K. Bridge Model Validation at Indiana Department of Transportation. In Proceedings of the Eleventh International Bridge and Structures Management Conference, Washington, DC, USA, 26–27 April 2017; pp. 1–29. [Google Scholar]
  79. Abdelhady, O.; Moselhi, O. Condition Monitoring of Reinforced Concrete Bridge Decks: Current Practices and Future Perspectives. Curr. Trends Civ. Struct. Eng. 2022, 8, 1–4. [Google Scholar]
  80. Abdelhady, O.; Moselhi, O. Hybrid feature selection framework for predicting bridge deck conditions. J. Inf. Technol. Constr. 2022, 27, 1028–1041. [Google Scholar]
  81. Hu, X.; Liu, K. Structural Deterioration Knowledge Ontology towards Physics-Informed Machine Learning for Enhanced Bridge Deterioration Prediction. J. Comput. Civ. Eng. 2023, 37, 04022051. [Google Scholar] [CrossRef]
  82. Wang, R.; Ma, L.; Yan, C.; Mathew, J. Condition deterioration prediction of bridge elements using Dynamic Bayesian Networks (DBNs). In Proceedings of the 2012 International Conference on Quality, Reliability, Risk, Maintenance, and Safety Engineering (QR2MSE), Chengdu, China, 15–18 June 2012; pp. 566–571. [Google Scholar]
  83. Abdelkader, E.; Marzouk, M.; Zayed, T. Modeling of concrete bridge decks deterioration using a Hybrid stochastic model. In Proceedings of the CSCE the Canadian Society for Civil Engineering: Building Tomorrow’s Society, Fredericton, New Brunswick, Canada, 13–16 June 2018; pp. 1–8. [Google Scholar]
  84. Saunders, M.; Lewis, P.; Thornhill, A. Research Methods for Business Students, 6th ed.; Pearson Education Limited: Indianapolis, IN, USA, 2012. [Google Scholar]
  85. Easterby-Smith, M.; Thorpe, R.; Jackson, P.R. Management Research: An Introduction, 2nd ed.; Sage Series in Management Research; SAGE: Thousand Oaks, CA, USA, 2002. [Google Scholar]
  86. Smyth, H.J.; Morris, P.W. An epistemological evaluation of research into projects and their management: Methodological issues. Int. J. Proj. Manag. 2007, 25, 423–436. [Google Scholar] [CrossRef]
  87. Kulatunga, K.; Amaratunga, D.; Haigh, R. Researching construction client and innovation: Methodological perspective. J. Librariansh. Inf. Sci. 2007, 41, 479–488. [Google Scholar]
  88. Hyde, K.F. Recognising deductive processes in qualitative research. Qual. Mark. Res. Int. J. 2000, 3, 82–90. [Google Scholar] [CrossRef]
  89. Hashemnezhad, H. Qualitative content analysis research: A review article. J. ELT Appl. Linguist. 2015, 3, 54–62. [Google Scholar]
  90. Sekaran, U.; Bougie, R. Research Methods for Business: A Skill-Building Approach; Wiley: New York, NY, USA, 2016. [Google Scholar]
  91. Yin, K. Case Study Research: Design and Methods, 3rd ed.; SAGE Publications, Inc.: Thousand Oaks, CA, USA, 2003. [Google Scholar]
  92. Yilmaz, K. Comparison of quantitative and qualitative research traditions: Epistemological, theoretical, and methodological differences. Eur. J. Educ. 2013, 48, 311–325. [Google Scholar] [CrossRef]
  93. Onwuegbuzie, A.; Johnson, J.; Burke, R.; Turner, L. A Typology of Mixed Methods Sampling Designs in Social Science Research. J. Mix. Methods Res. 2007, 1, 267–294. [Google Scholar] [CrossRef]
  94. Creswell, J.; Clark, P. Designing and Conducting Mixed Methods Research, 2nd ed.; SAGE Publications: Thousand Oaks, CA, USA, 2011. [Google Scholar]
  95. Baker, J. Selecting a Research Methodology; The Marketing Review; Westburn Publishers Ltd.: Helensburgh, UK, 2001; Volume 1, pp. 373–397. [Google Scholar]
  96. Bhandari, P. What Is Qualitative Research? Methods and Examples. Scribbr. 2020. Available online: https://www.scribbr.com/methodology/qualitative-research (accessed on 25 August 2023).
  97. Azman, N.S.; Ramli, M.Z.; Razman, R.; Zawawi, M.H.; Ismail, I.N.; Isa, M.R. Relative importance index (RII) in ranking of quality factors on industrialised building system (IBS) projects in Malaysia. In Proceedings of the Applied Physics of Condensed Matter (Apcom 2019), Pleso, Slovak Republic, 19–21 June 2019. [Google Scholar]
  98. Sakhare, V.; Patil, G. Construction Equipment Monitoring: By Using Relative Importance Indices (RII) Analysis. Int. Res. J. Eng. Technol. (IRJET) 2019, 6, 261–263. [Google Scholar]
  99. Rajgor, M.; Paresh, C.; Dhruv, P.; Chirag, P.; Dharmesh, B. RII & IMPI: Effective techniques for finding delay in construction project. Int. Res. J. Eng. Technol. (IRJET) 2016, 3, 1173–1177. [Google Scholar]
  100. Rooshd, R.; Majidb, M.A.; Sahamira, S.; Ismail, N. Relative Importance Index of Sustainable Design and Construction Activities Criteria for Green Highway. Chem. Eng. Trans. (CET) 2018, 63, 151–156. [Google Scholar]
  101. Idrus, A.B.; Newman, J.B. Construction related factors influencing the choice of concrete floor systems. Constr. Manag. Econ. 2002, 20, 13–19. [Google Scholar] [CrossRef]
  102. Etikan, I. Sampling and Sampling Methods. Biom. Biostat. Int. J. 2017, 5, 5–7. [Google Scholar] [CrossRef]
  103. Showkat, N.; Parveen, H. Non-Probability and Probability Sampling. ResearchGate. Available online: https://www.researchgate.net/publication/319066480_Non-Probability_and_Probability_Sampling (accessed on 20 February 2023).
  104. Sharma, G. Pros and cons of different sampling techniques. Int. J. Appl. Res. 2017, 3, 749–752. [Google Scholar]
  105. Etikan, I.; Musa, S.A.; Alkassim, R.S. Comparison of Convenience Sampling and Purposive Sampling. Am. J. Theor. Appl. Stat. 2016, 5, 1–4. [Google Scholar] [CrossRef]
  106. Semasinghe, W. Non-Probability Sampling Methods. 19 August 2019. Available online: https://ss.kln.ac.lk/depts/econ/media/attachments/2019/08/19/non-probability-sampling-english-2019.pdf (accessed on 20 February 2023).
  107. Memon, M.; Ting, H.; Hwa, C.; Ramayah, T. Sample size for survey research: Review and recommendations. J. Appl. Struct. Equ. Model. 2020, 4, 1–21. [Google Scholar] [CrossRef] [PubMed]
  108. Krejcie, R.V.; Morgan, D.W. Determining Sample Size for Research Activities. Educ. Psychol. Meas. 1970, 30, 607–610. [Google Scholar] [CrossRef]
  109. Office of the Comptroller of the Currency. Sampling Methodologies; U.S. Department of the Treasury: Washington, DC, USA, 2020; Version 1.
  110. Guest, G.; Bunce, A.; Johnson, L. How many interviews are enough? An experiment with data saturation and variability. Field Methods 2006, 18, 59–82. [Google Scholar] [CrossRef]
  111. Marshall, B.; Cardon, P.; Poddar, A.; Fontenot, R. Does sample size matter in qualitative research? J. Comput. Inf. Syst. 2013, 54, 11–22. [Google Scholar]
  112. Weller, S.C.; Vickers, B.; Bernard, H.R.; Blackburn, A.M.; Borgatti, S.; Gravlee, C.C.; Johnson, J.C. Open-ended interview questions and saturation. PLoS ONE 2018, 13, e0198606. [Google Scholar] [CrossRef] [PubMed]
  113. Ebrahimi, S.; Kazerooni, M.; Sumati, V.; Fayek, A. Predictive model for construction labor productivity using hybrid feature selection and principal component analysis. Can. J. Civ. Eng. 2022, 49, 1366–1378. [Google Scholar] [CrossRef]
  114. Jain, R.K.; Damoulas, T.; Kontokosta, C.E. Towards Data-Driven Energy Consumption Forecasting of Multi-Family Residential Buildings: Feature Selection via The Lasso. In Proceedings of the 2014 International Conference on Computing in Civil and Building Engineering, Orlando, FL, USA, 23–25 June 2014. [Google Scholar]
  115. Nik-Bakht, M. Lecture Notes on “Big Data Analytics for Smart City Infrastructure: CIVI691”; Concordia University: Montreal, QC, Canada, 2021. [Google Scholar]
  116. Solorio-Fernández, S.; Carrasco-Ochoa, J.A.; Martínez-Trinidad, J.F. A review of unsupervised feature selection methods. Artif. Intell. Rev. 2019, 53, 907–948. [Google Scholar] [CrossRef]
  117. Hatcher, L. A Step-by-Step Approach to Using the SAS System for Factor Analysis and Structural Equation Modeling, Cary, NC: The SAS Institute. Technometrics 1996, 38, 296. [Google Scholar]
  118. Suhr, D. Exploratory or Confirmatory Factor Analysis; SAS Institute Inc.: Cary, CN, USA, 2006. [Google Scholar]
  119. Leslie, K. Survey Sampling; John Wiley and Sons, Inc.: New York, NY, USA, 1965; p. 17. [Google Scholar]
  120. Gall, M.D.; Gall, J.P.; Borg, W.R. Educational Research: An introduction, 8th ed.; Pearson/Allyn & Bacon: Boston, IL, USA, 2007. [Google Scholar]
  121. Roscoe, J. Fundamental Research Statistics for the Behavioral Sciences, 2nd ed.; Holt Rinehart and Winston: New York, NY, USA, 1975. [Google Scholar]
  122. Mooi, E.; Sarstedt, M.; Mooi-Reci, I. Market Research: The Process, Data, and Methods Using Stata; Springer: Singapore, 2018. [Google Scholar]
  123. Zambon, I.; Vidovic, A.; Strauss, A.; Matos, J.; Amado, J. Comparison of stochastic prediction models based on visual inspections of bridge decks. J. Civ. Eng. Manag. 2017, 23, 553–561. [Google Scholar] [CrossRef]
  124. Kassem, M.; Khoiry, M.; Hamzah, N. Using Relative Importance Index Method for Developing Risk Map in Oil and Gas Construction Projects. J. Kejuruter. 2020, 32, 85–97. [Google Scholar] [CrossRef]
  125. Marić, M.; Ivanković, A.; Srbić, M.; Skokandić, D. Assessment of Performance Indicators of a Large-Span Reinforced Concrete Arch Bridge in a Multi-Hazard Environment. Buildings 2022, 12, 1046. [Google Scholar] [CrossRef]
  126. Eslamlou, A.D.; Ghaderiaram, A.; Schlangen, E.; Fotouhi, M. A review on non-destructive evaluation of construction materials and structures using magnetic sensors. Constr. Build. Mater. 2023, 397, 132460. [Google Scholar] [CrossRef]
Figure 1. Categories adopted in the development of DMs.
Designs 07 00126 g001
Figure 2. Structural-related factors adopted in the development of DMs.
Designs 07 00126 g002
Figure 3. Environmental factors adopted in the development of DMs.
Designs 07 00126 g003
Figure 4. Research design for data collection and analysis.
Designs 07 00126 g004
Figure 5. Distribution of participants who contributed to phase three of the study.
Designs 07 00126 g005
Figure 6. Summary of the survey results for the first set of factors.
Designs 07 00126 g006
Figure 7. Summary of the survey results for the second set of factors.
Designs 07 00126 g007
Table 1. Summary of BMS practices around the world.
RegionComments
North AmericaAlthough PONTIS and BRIDGIT were mainly used in the U.S., some other states and provinces in North America such as New York, Indiana, Pennsylvania, North Carolina, Alabama, Florida, Denver, and Ontario have developed their own bridge management systems [3,5,7,11,12,13,14,15,16,17,18,19,20,21,22].
EuropeDenmark developed a BMS, which includes six modules, called DANBRO (DANish Bridges and Roads) in 1988 [13,23]. Although DANBRO does not include a condition deterioration module, it has been implemented in Saudi Arabia, Mexico, Colombia, Honduras, Croatia, and Malaysia [24].
A bridge management software named SIHA was developed in Finland. At the beginning, the system included inventory data only [25]. The latest version of the system included a deterioration module that optimizes the maintenance and repair costs using a probabilistic Markov Chain model [3,26]. Another BMS named Highway Structural Management Information System (HiSMIS) was developed in the UK [27]. Belgium, Norway, and Sweden operated a functionally complete BMS that included inventory, inspection, and maintenance modules. However, only Belgium’s BMS included a deterioration model [28]. The BMS applied in Belgium and Sweden lacks a life-cycle cost analysis module to plan for optimal maintenance planning [13,29]. Finally, France, Germany, Hungary, and Italy have developed basic BMSs to manage the bridge activities. Their BMSs basically involve inspection and condition ratings [30,31]. A maintenance decision support system is implemented in Germany and Italy [28,32].
Africa and AsiaThe South African National Roads Agency Limited (SANRAL) developed a BMS named STRUMAN by the Council for Scientific and Industrial Research (CSIR) [33].
The first BMS in Japan was developed in 1995 and it was mainly for bridge condition ratings and rehabilitation strategies [3]. Miyamoto et al. [34] proposed a comprehensive bridge management system for Japan called J-BMS.
The Indonesian Directorate General of Highways developed a bridge management system that contains modules to store inspection data, rank the bridges, prepare a report with annual and five-year programs of bridge work, and optimize the required repair works [13].
Australia and New ZealandA report was initiated with the proposed BMS by Steele et al. [35] that included four modules: activities, engineering inputs, management inputs, and outputs. The engineering inputs module provides a set of feasible actions that can be taken [12]. The output module provides data on the bridge condition prediction, options for maintenance, and estimated costs [13].
Table 2. Summary of other factors included in different DMs.
CategoryFactorNo of Times MentionedReferences
Dimensional factorsBridge elevation1[65]
Span length8[38,44,45,46,55,73,74,75]
No of spans15[3,10,14,38,42,44,49,53,57,59,67,71,76,77,78]
Bridge width13[3,38,44,46,57,59,65,66,67,70,74,75,79,80]
Bridge length18[3,10,14,46,47,49,53,57,59,65,67,70,71,74,75,76,78,81]
Factors related to geographic locationServices under the bridge6[11,14,48,53,60,78]
State or interstate6[8,14,44,51,53,78]
Region or location7[48,50,54,55,56,70,76]
TrafficADT31[3,8,10,11,38,42,43,44,45,46,47,48,49,50,51,52,55,57,58,60,65,67,70,71,73,74,75,76,77,79,80,82]
ADTT18[3,10,11,14,42,46,51,52,53,54,55,65,67,70,71,73,77,78]
OthersWearing surface type5[8,44,49,52,55]
Time of rehabilitation5[43,59,60,76,82]
Inspection gap3[3,47,68]
Defect type2[60,83]
Table 3. List of the stakeholders interviewees.
Stakeholder Targeted Sample SizeAchieved Sample Size
The public authority of road and transportation in kuwait54
The road and transportation authority in dubai22
Road and bridge contracting companies43
Road and bridge consulting companies33
Professors in gcc universities43
Total1815
Table 4. Interviewees’ selection of factors from the interview phase.
FactorsAverage WeightTotal No. of Selection
No of Spans5.333
Bridge Length2.003
Bridge Width1.502
Bridge Elevation5.502
Span Length3.254
Precipitation5.004
State or Interstate6.004
Skew Angle4.333
Girder Material and Spacing3.754
Approach Surface Type5.673
Superstructure Type4.754
Time of Rehabilitation11.176
Design Load11.336
Carbon Dioxide6.147
Sulphate7.506
Region or Location6.336
Average Daily Traffic (ADT)7.1010
Age14.0010
Temperature6.569
Chloride11.5010
Inspection Gap19.5010
Services Under the Bridge10.3010
Deck Protection9.0011
Average Daily Truck Traffic (ADTT)7.1712
Defect Type16.005
Steel Reinforcement Protection9.9212
Wearing Surface Type0.000
Table 5. Interviewees’ selection of factors from the interview phase.
FactorsTotal % WeightRII (%)
No of Spans161.067
Bridge Length60.4
Bridge Width30.2
Bridge Elevation110.733
Span Length130.867
Precipitation201.333
State or Interstate241.6
Skew Angle130.867
Girder Material and Spacing151
Approach Surface Type171.133
Superstructure Type191.267
Time Of Rehabilitation674.467
Design Load684.53
Carbon Dioxide432.867
Sulphate453
Region or Location382.533
Average Daily Traffic (ADT)714.733
Age1409.333
Temperature593.933
Chloride1157.667
Inspection Gap19513
Services Under the Bridge1087.2
Deck Protection1046.933
Average Daily Truck Traffic (ADTT)865.733
Defect Type805.33
Steel Reinforcement Protection1248.267
Wearing Surface Type00
Table 6. Targeted sample size for the survey phase.
Stakeholder NameTargeted Sample SizeSnowball Sample Size
The public authority of road and transportation in kuwait515
The road and transportation authority in dubai24
Road and bridge contracting companies46
Road and bridge consulting companies35
Professors in universities62
Total 1836
Table 7. Summary of the survey results.
FactorPercentage of Responses
Extremely ImportantVery ImportantSomewhat ImportantNot So Important
Age33.3344.4522.220.00
ADTT30.5544.4516.678.33
ADT22.2252.7816.678.33
Temperature11.1141.6733.3313.89
Chloride Attack50.0025.0016.678.33
Wind Load13.8933.3338.8913.89
Design Load52.7830.5616.670.00
Defect Type33.3347.2319.440.00
Steel Prot.52.7833.3313.890.00
Services under the bridge22.2241.6727.788.33
Inspection Gap16.6750.0025.008.33
Time of Rehabilitation27.7850.0022.220.00
Deck Protection22.2247.2222.228.33
Table 8. RII values for the factors.
FactorRII Value
Age0.778
Average daily traffic adt0.722
Average daily truck traffic adtt0.744
Temperature0.625
Chloride attack0.792
Wind load0.618
Design load0.805
Type of defect0.785
Deck protection0.708
Steel reinforcement protection0.847
Services under the bridge0.694
Inspection gap0.688
Time of rehabilitation0.764
Table 9. Limits for RII values.
Importance LevelRII Value
Extremely important0.77 < RII < 1
High importance0.71 < RII ≤ 0.77
Medium importance0.65 < RII ≤ 0.71
Low importanceRII ≤ 0.65
Table 10. Comparison of factors.
Factors Concluded from the StudyEvaluation from GCC Bridge Experts % *% Adoption in the Literature
Age77.8% 86.7%
Average daily traffic adt75%68.8%
Average daily truck traffic adtt75%37.8%
Temperature52.78%8.88%
Chloride attack75%11.1%
Wind load47.22%**
Design load83.33%15.6%
Type of defect80.56%4.4%
Deck protection69.44%8.88%
Steel reinforcement protection86.11%4.4%
Services under the bridge63.89%13.3%
Inspection gap66.67%11.1%
Time of rehabilitation77.78%6.7%
* Percentage of experts who selected the factor ** Was not found in the literature.
Disclaimer/Publisher’s Note: The statements, opinions and data contained in all publications are solely those of the individual author(s) and contributor(s) and not of MDPI and/or the editor(s). MDPI and/or the editor(s) disclaim responsibility for any injury to people or property resulting from any ideas, methods, instructions or products referred to in the content.

