
Prioritizing Riverine Bridge Interventions: A Hydrological and Multidimensional Approach

Abstract
:1. Introduction
2. Materials and Methods
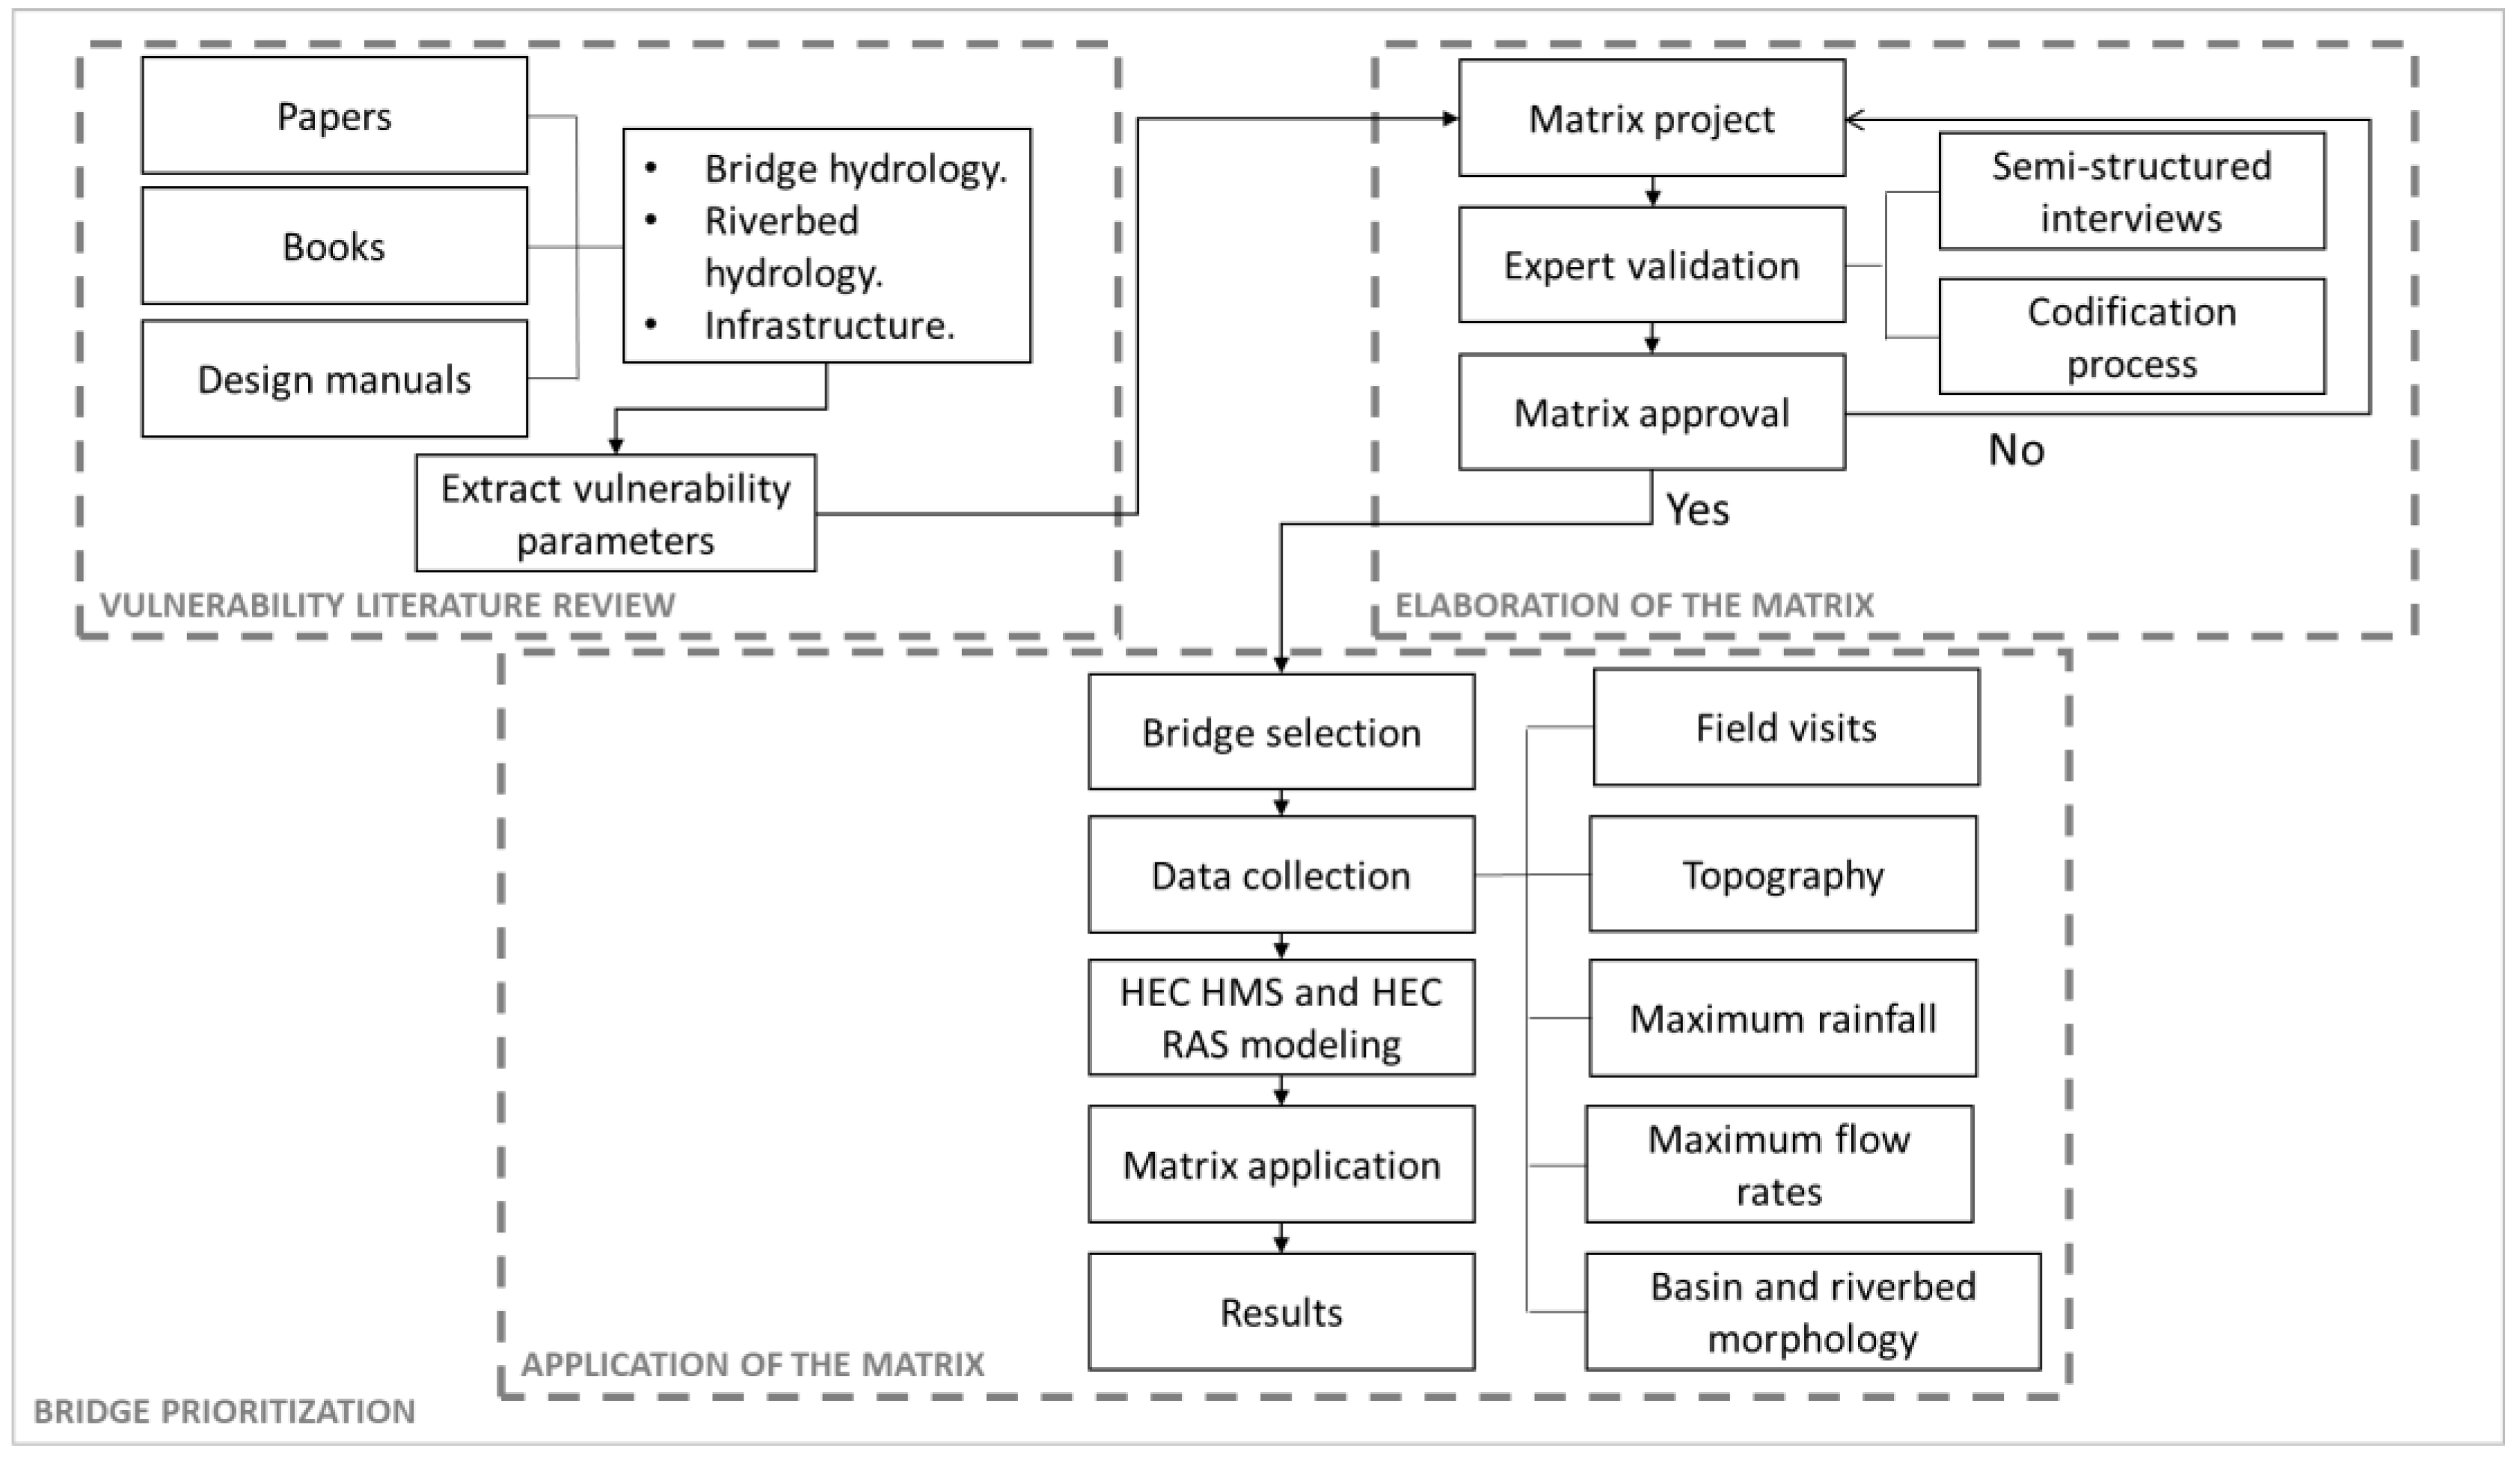
2.1. Methodology
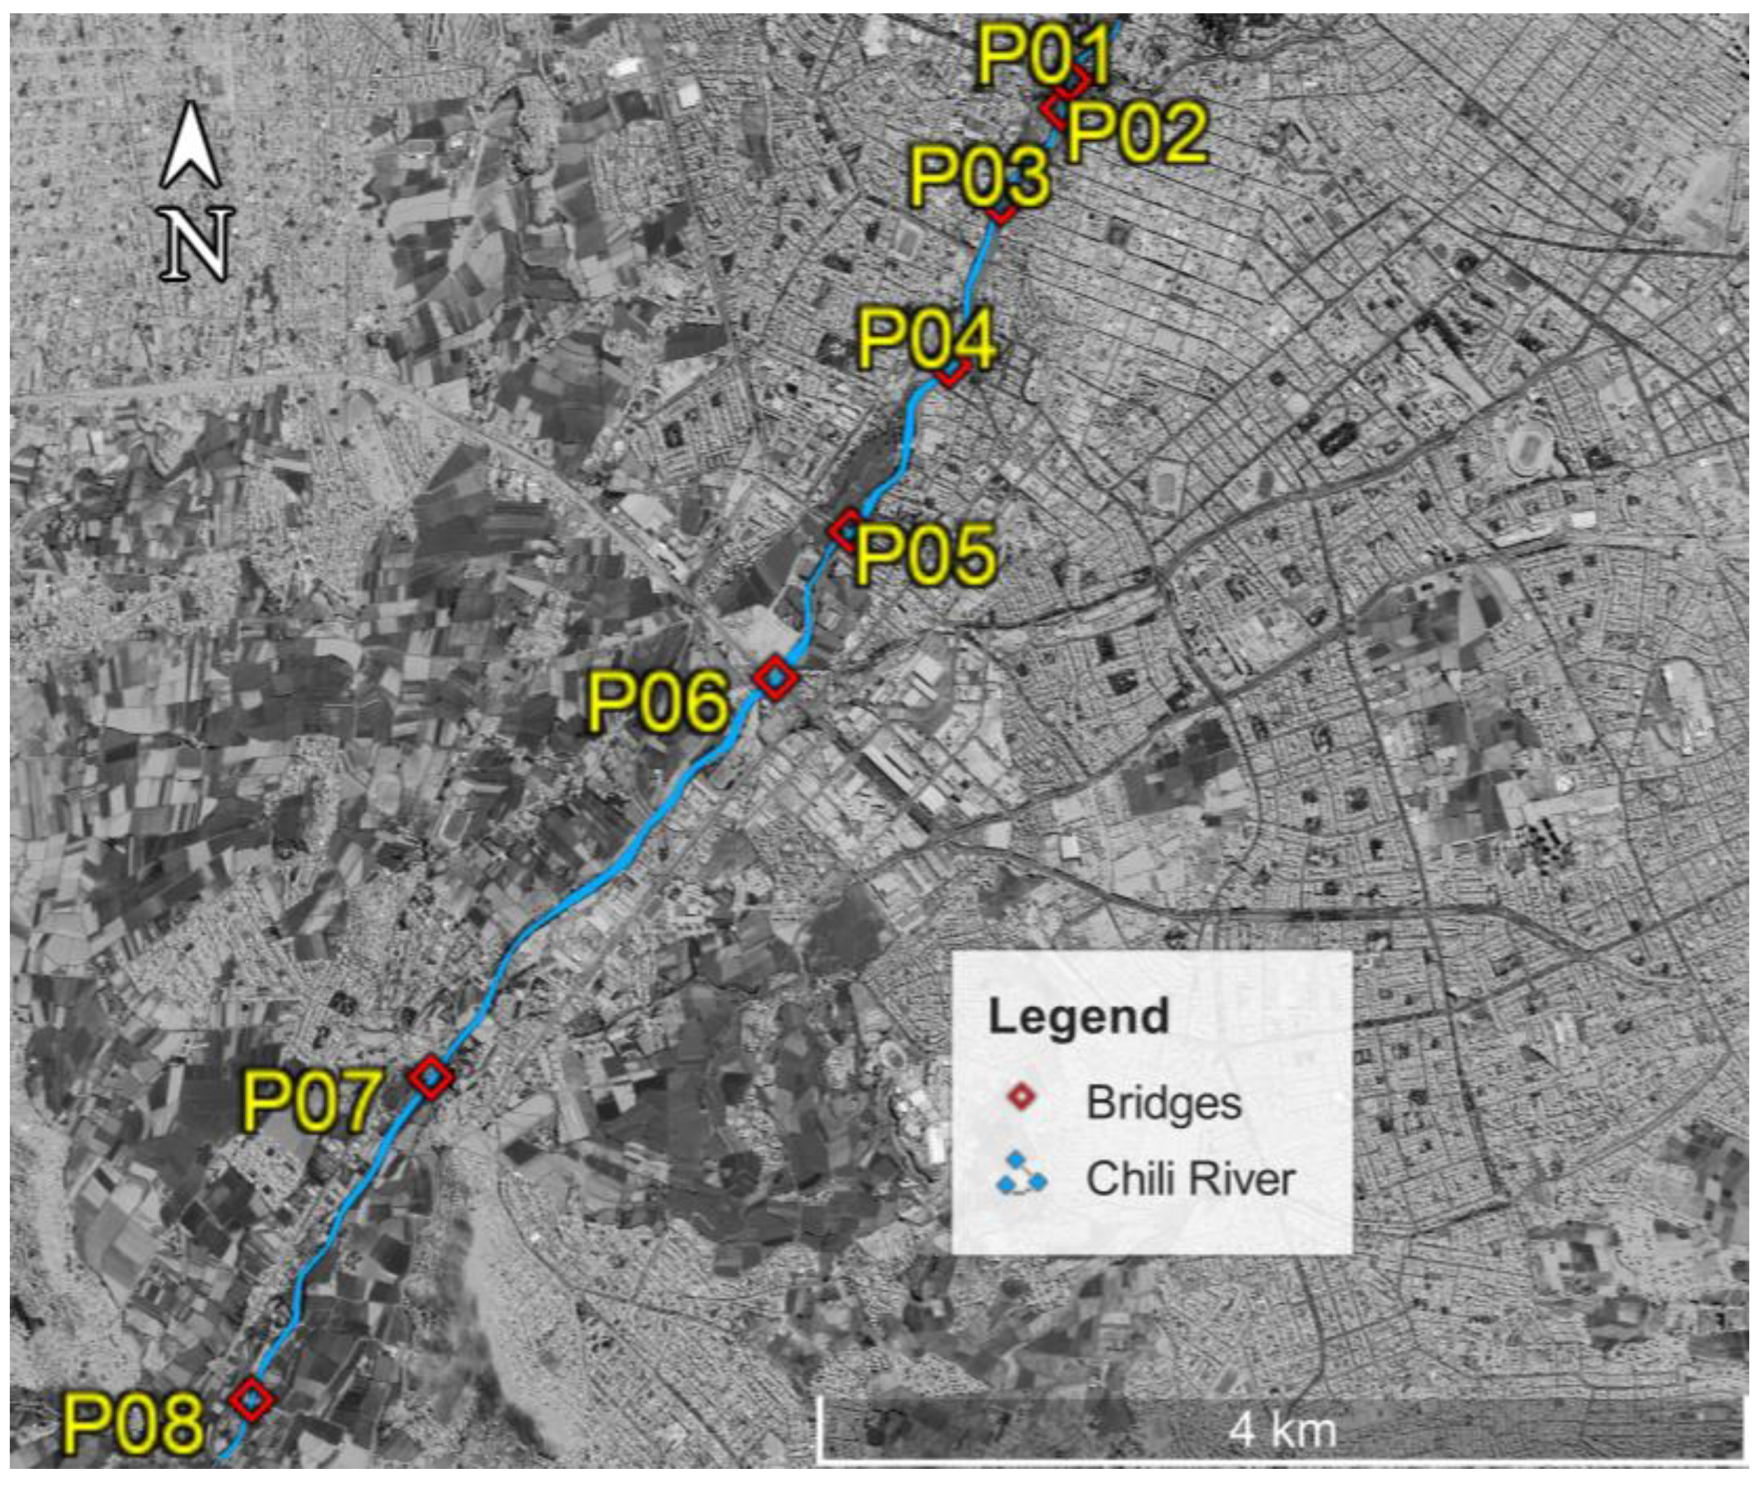
2.2. Study Area
2.3. Evaluation Matrix
2.4. Matrix Validation
2.5. Codification Process
3. Results
3.1. Hydrological Aspects
3.2. Topographic Survey
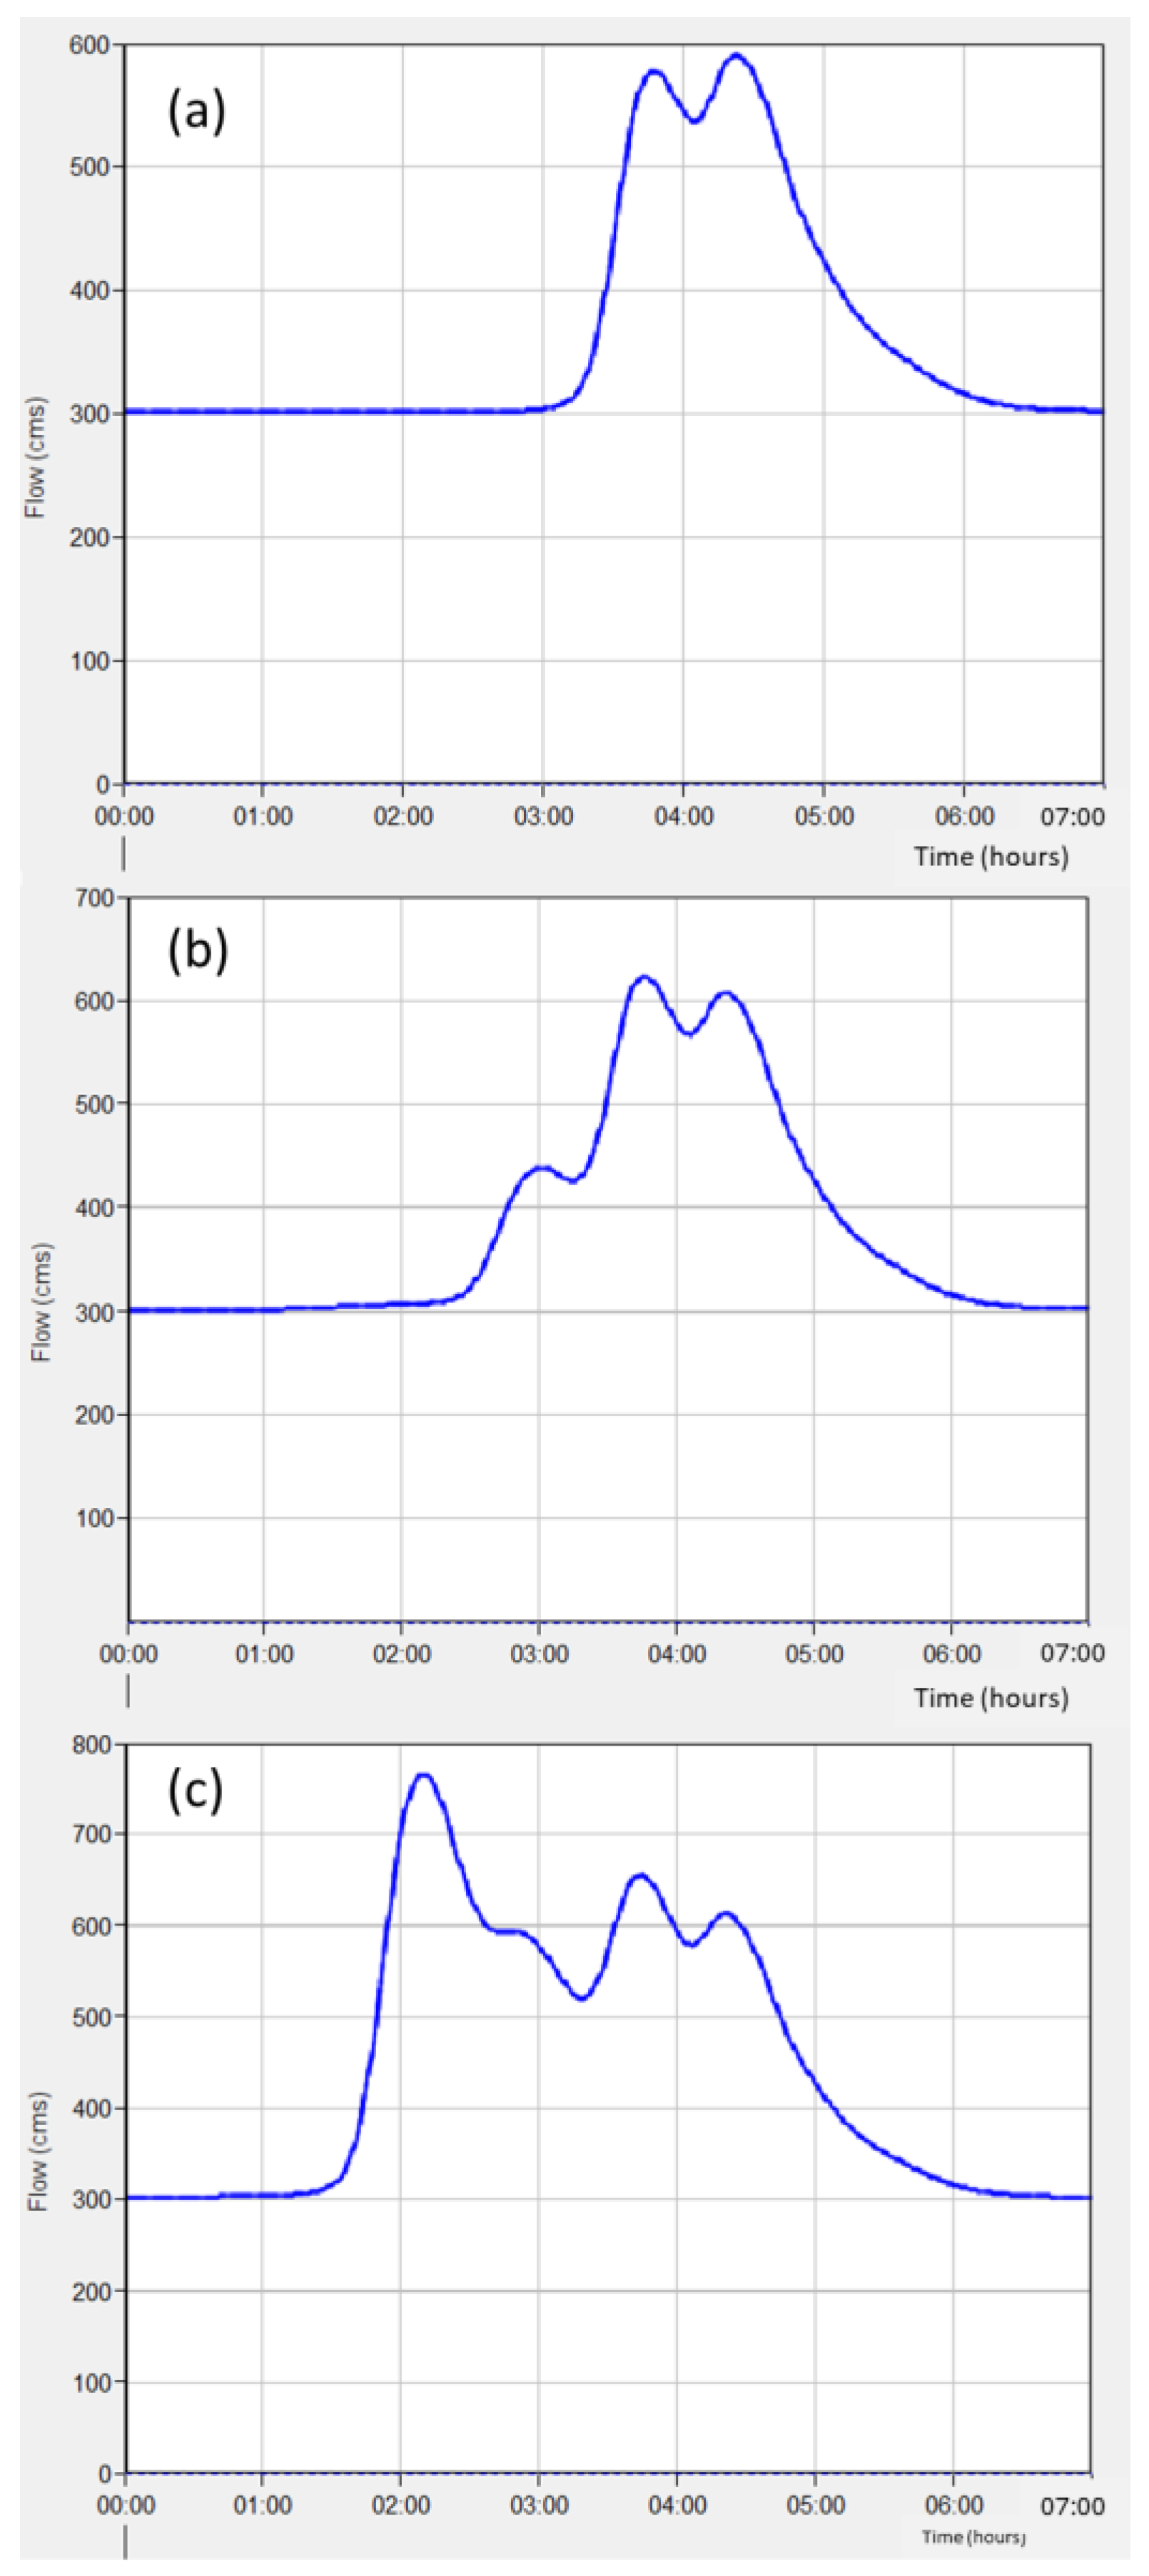
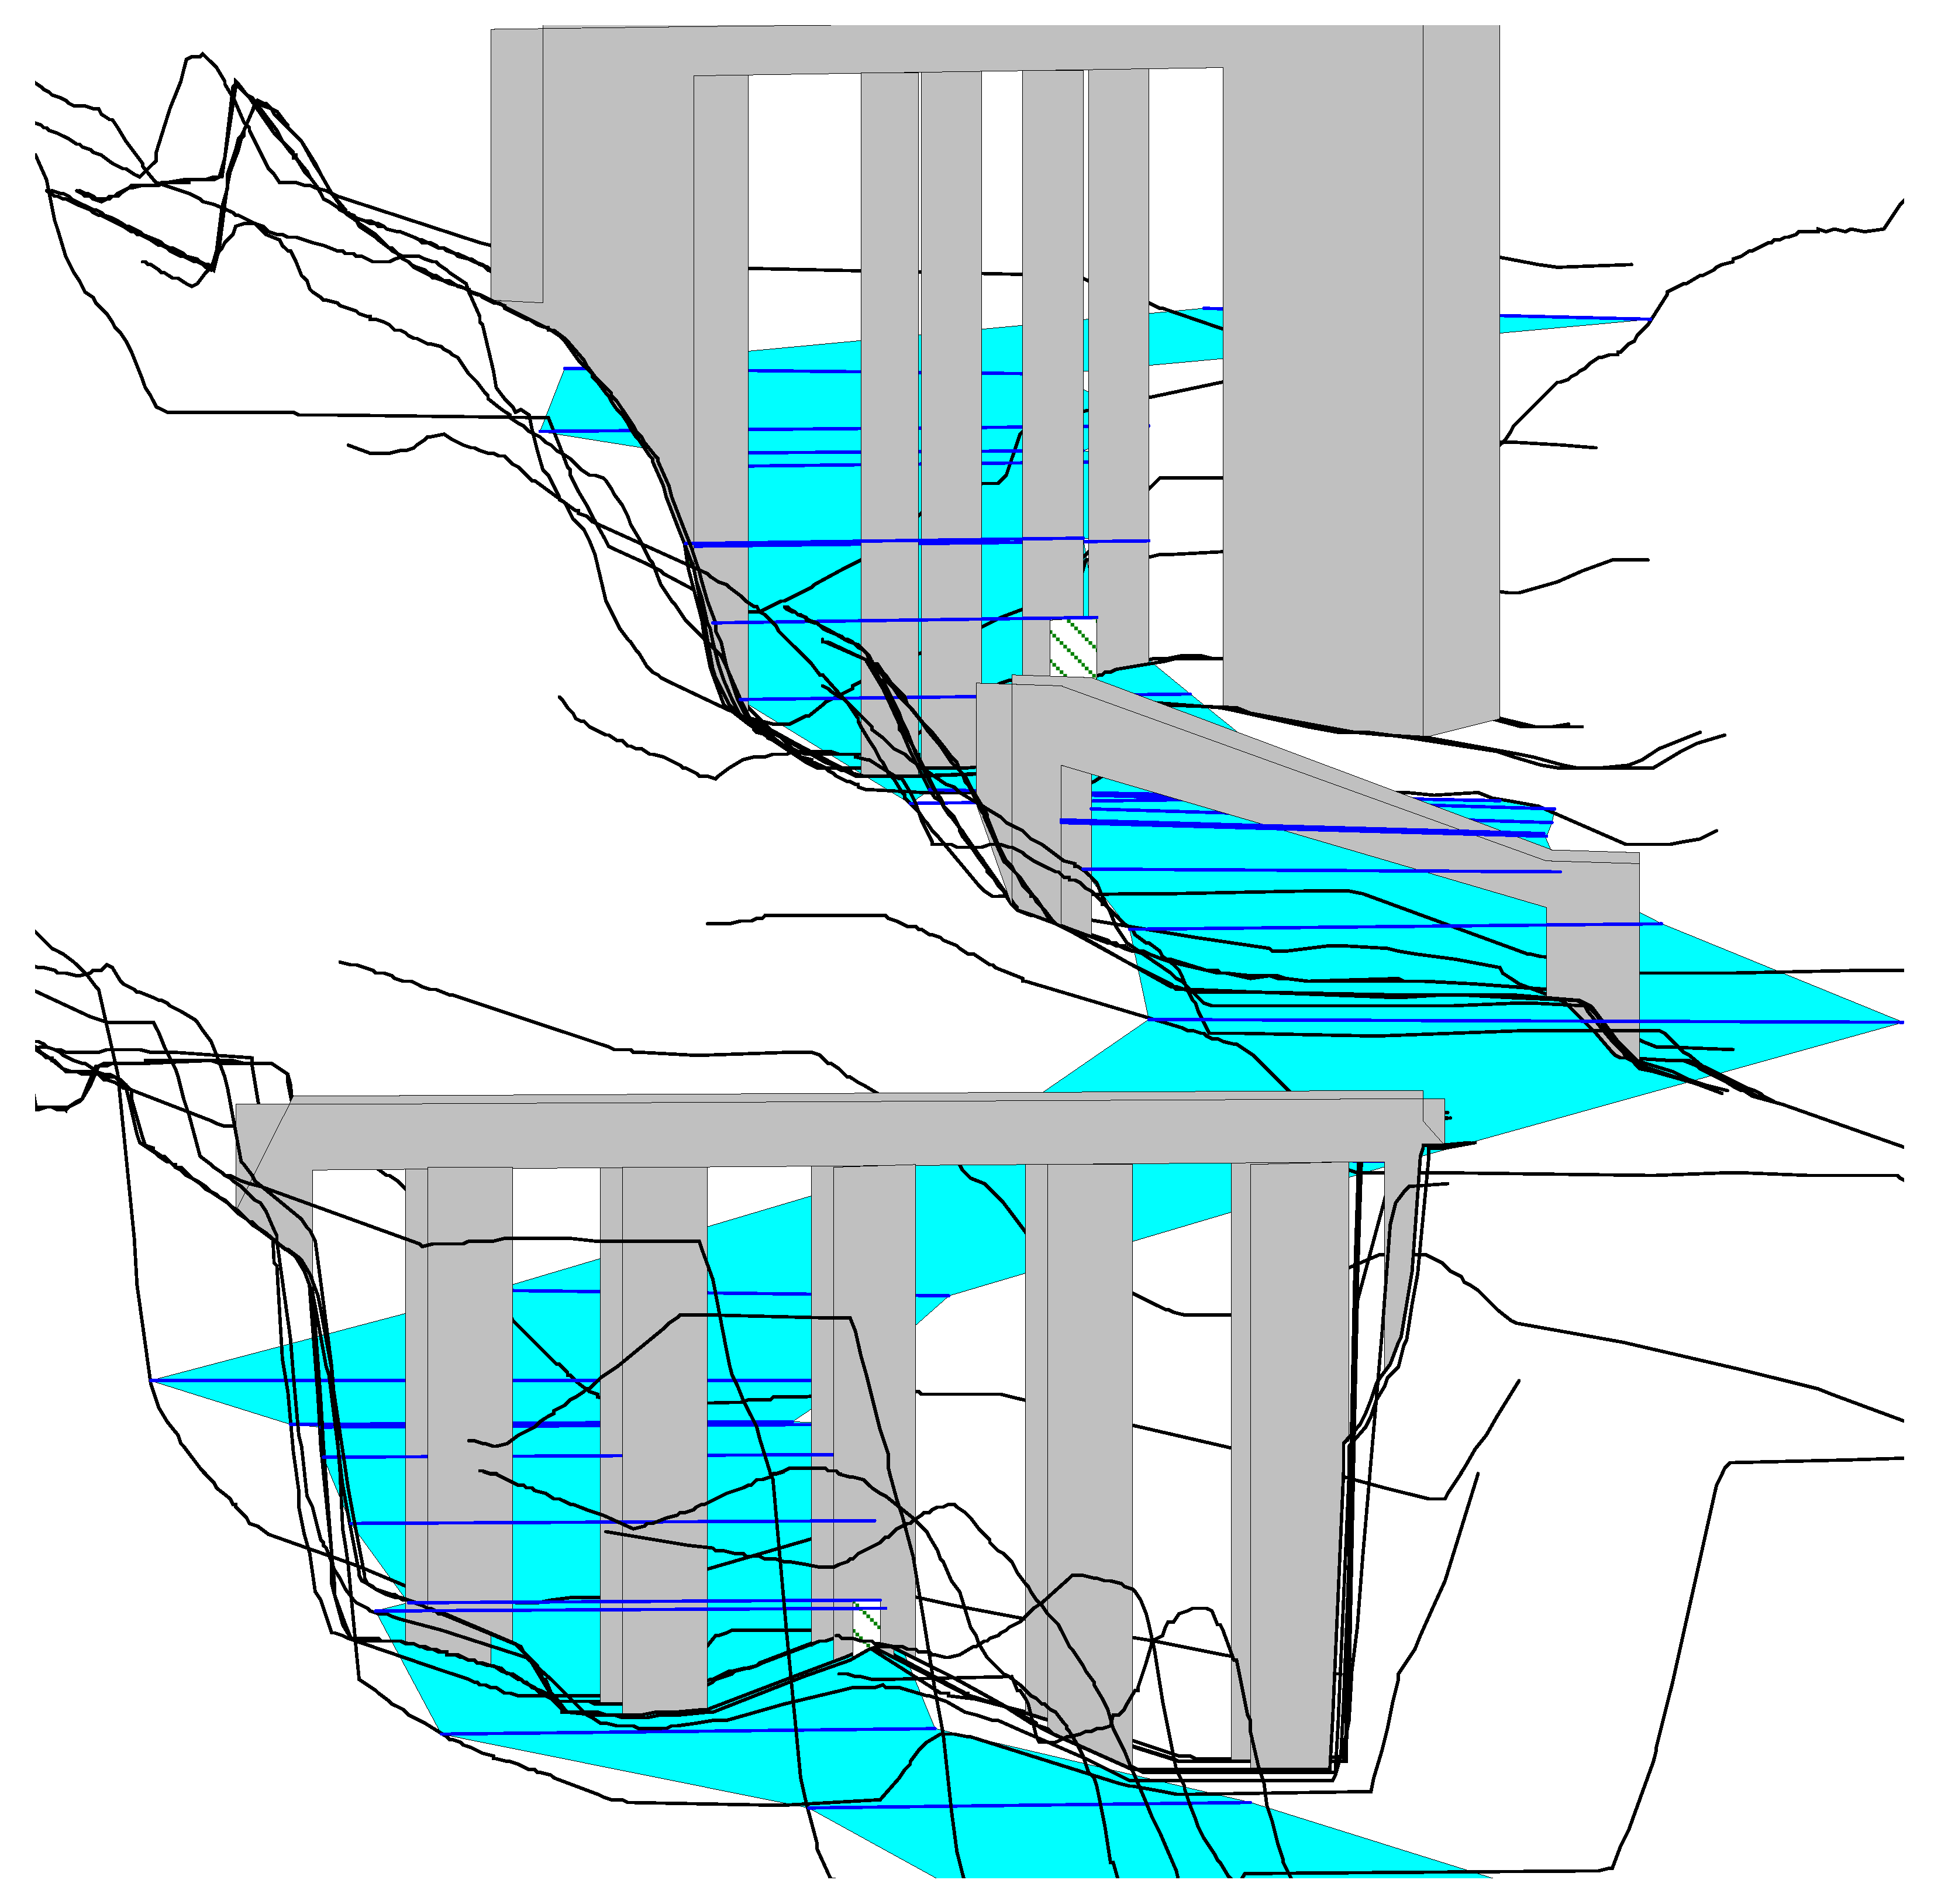
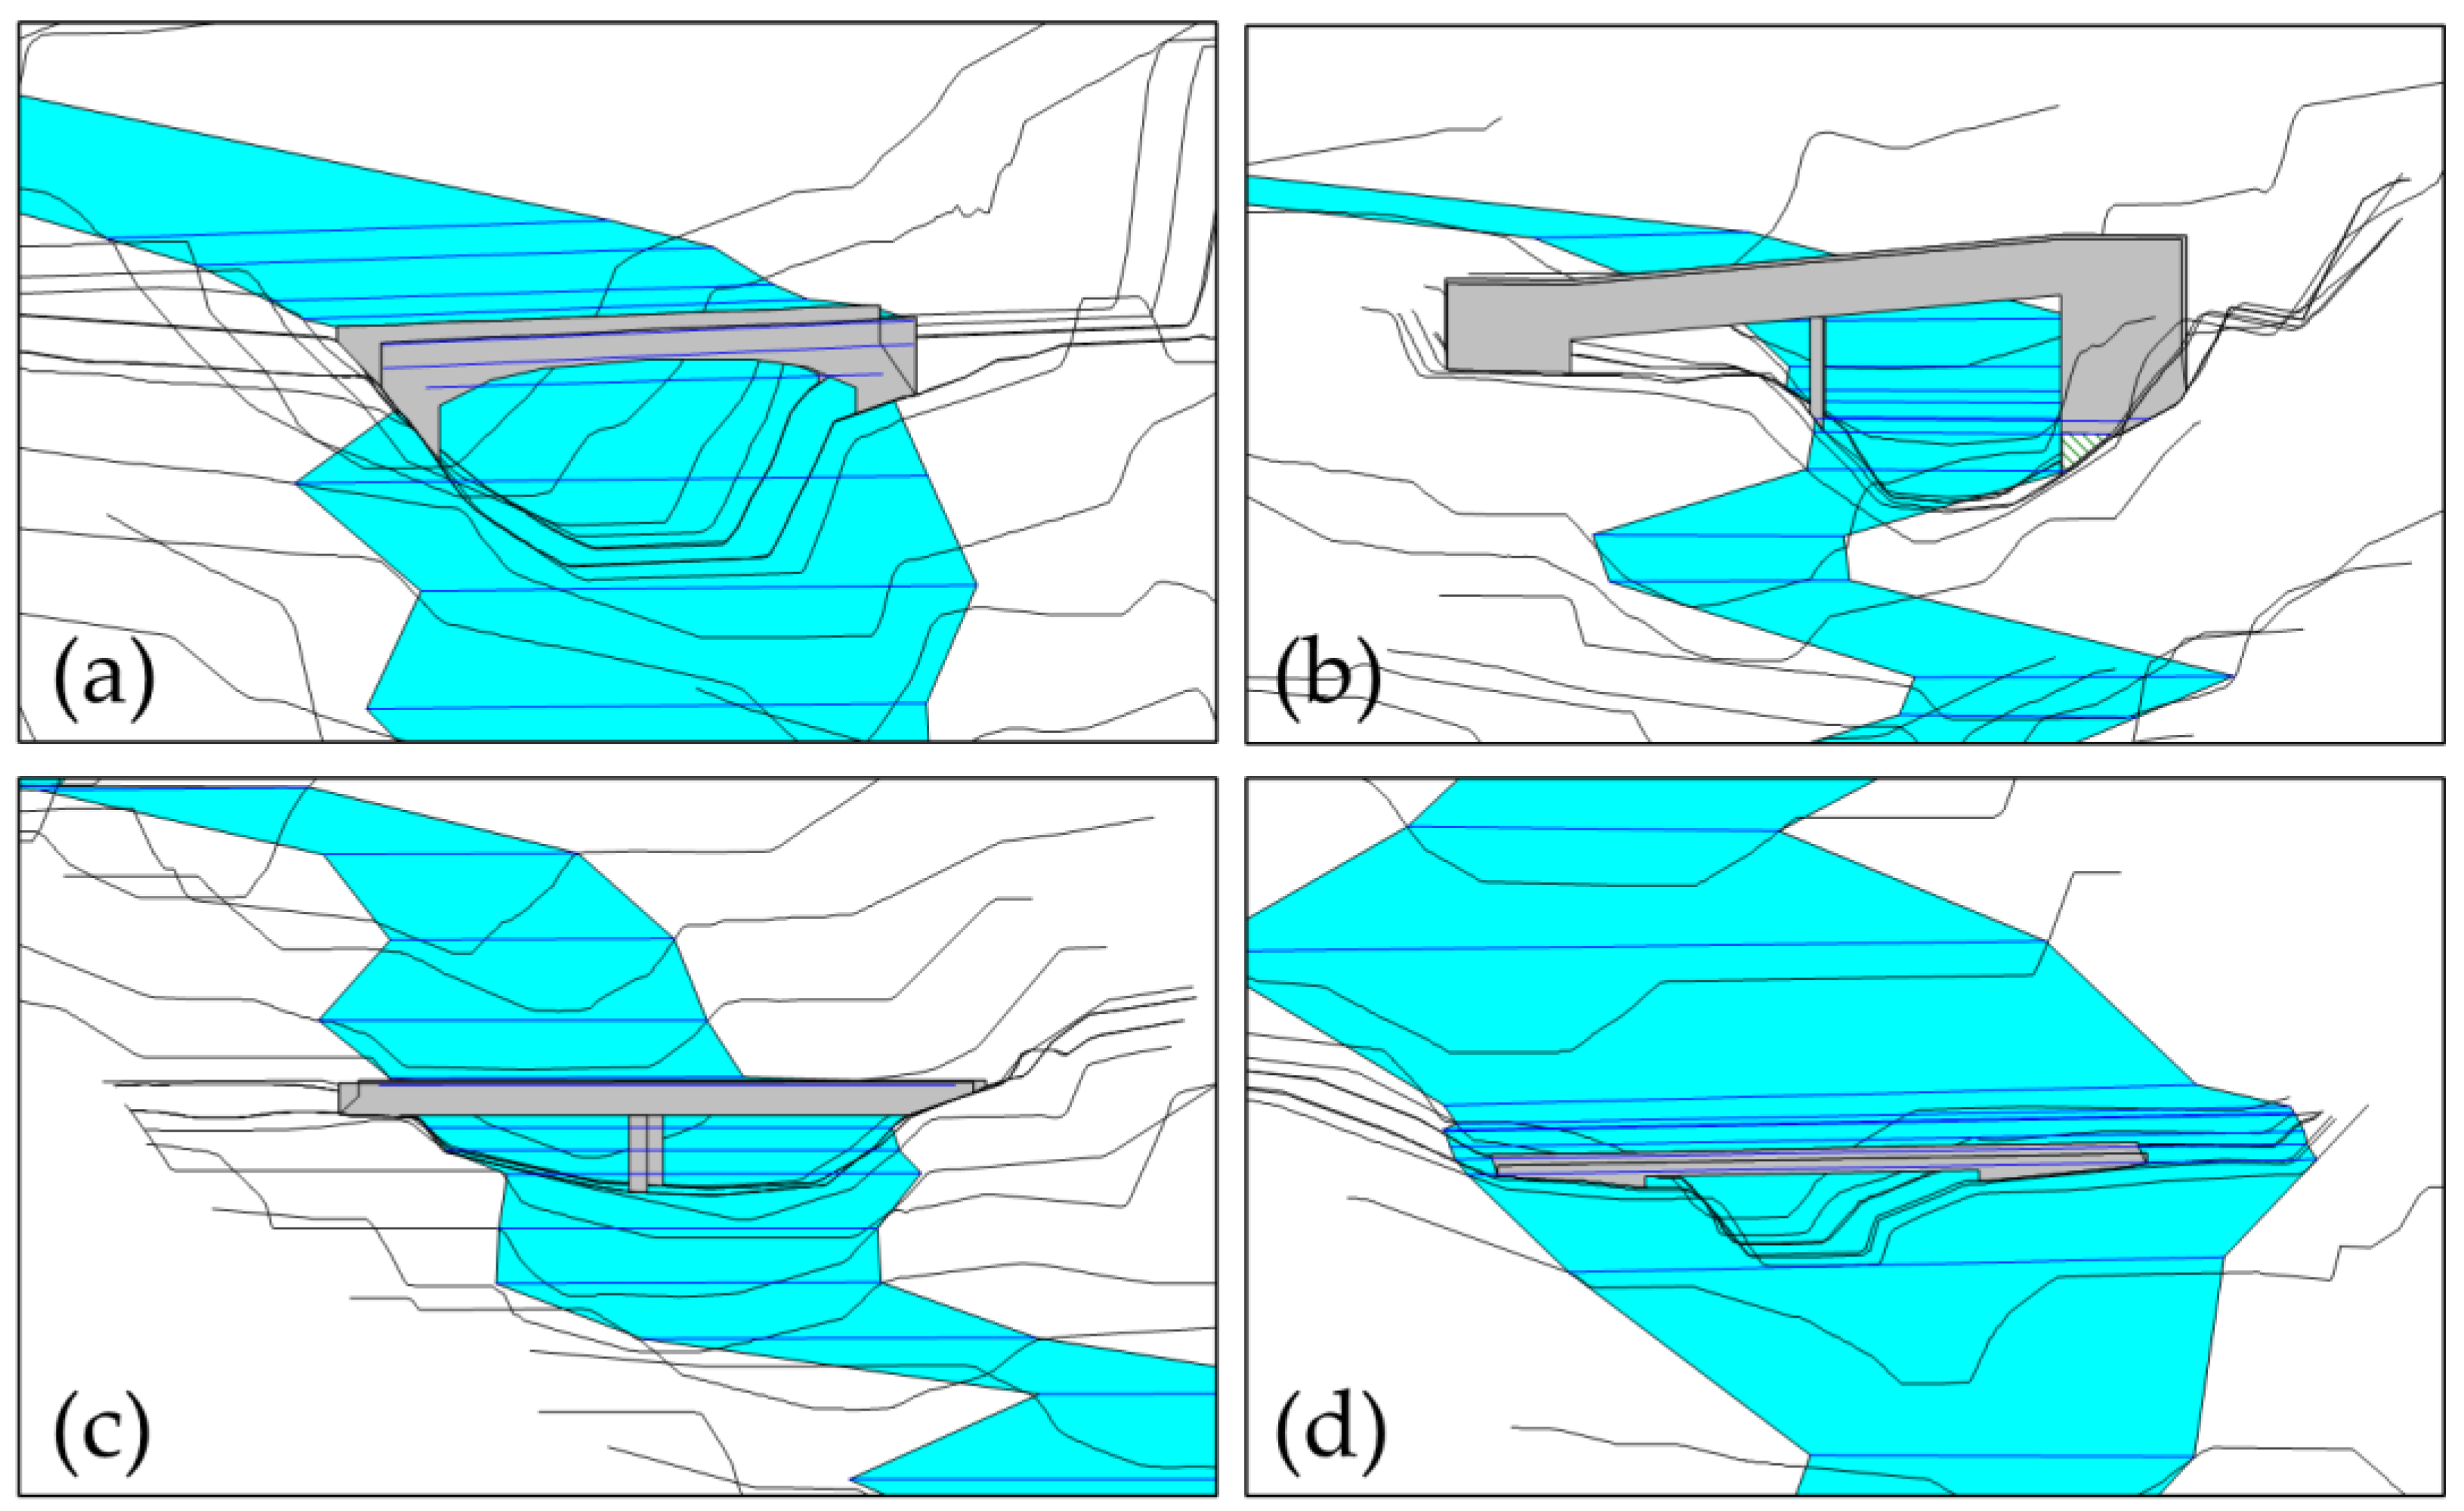
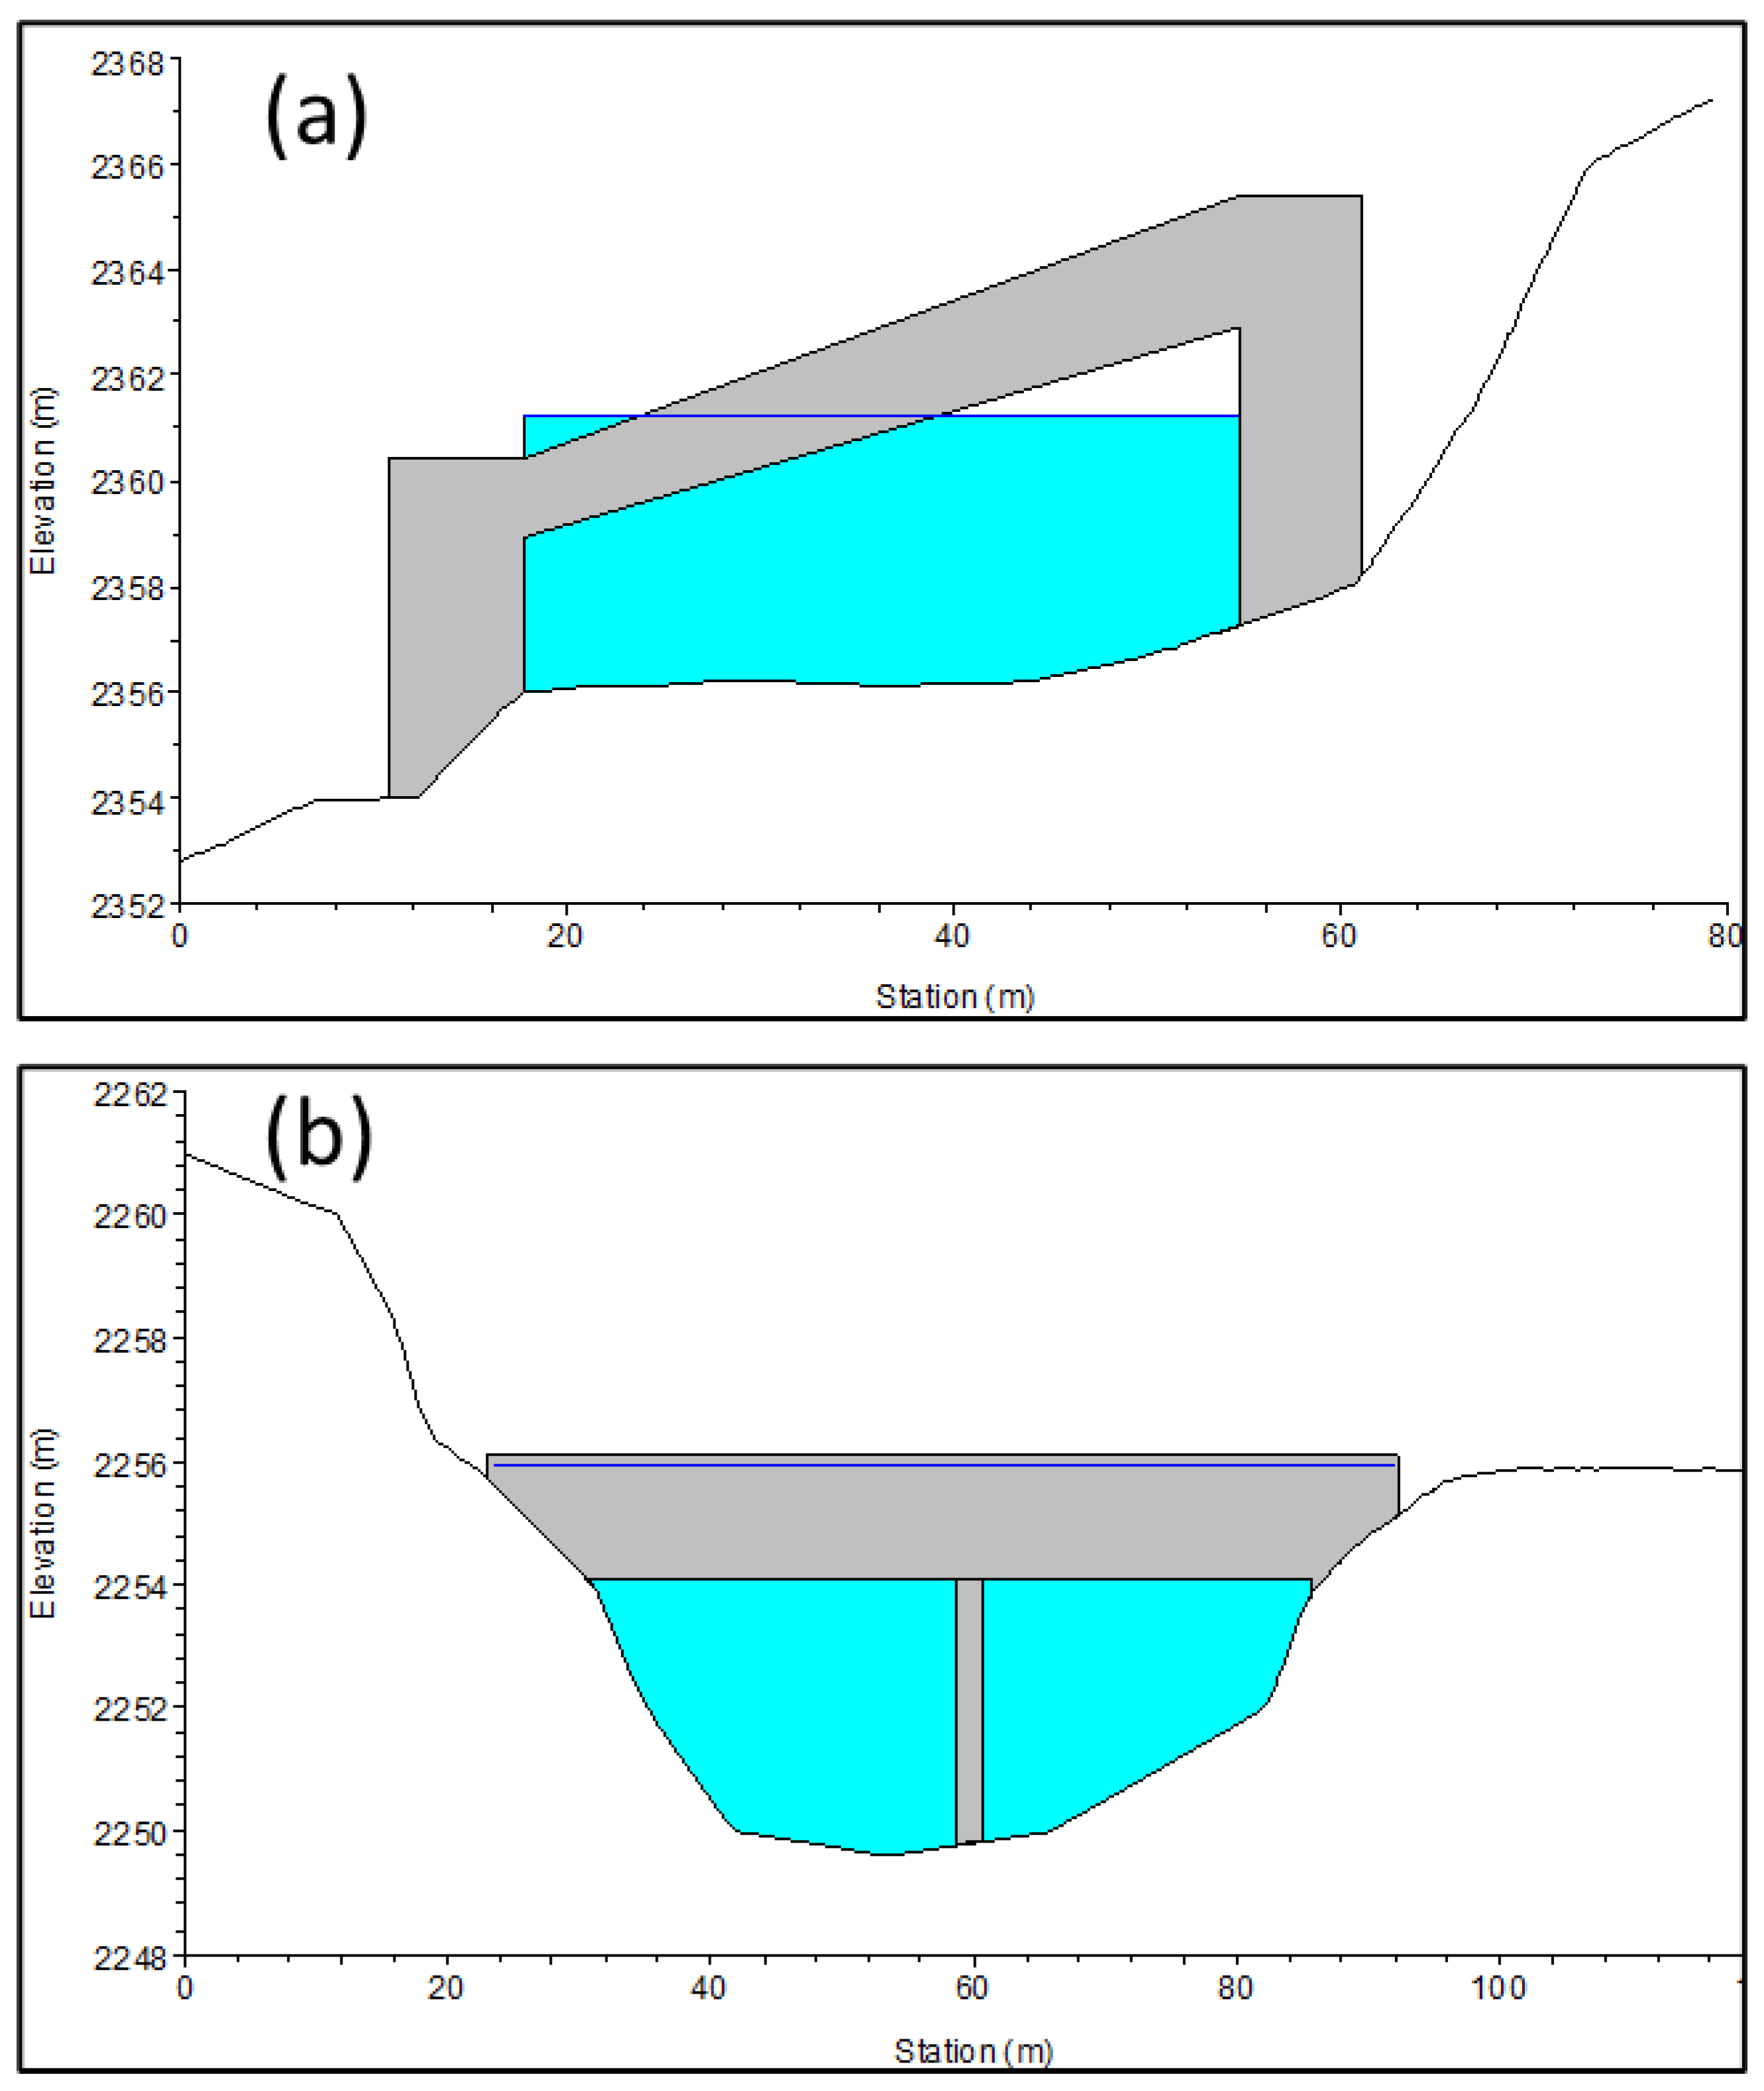
3.3. Hydraulic Modeling
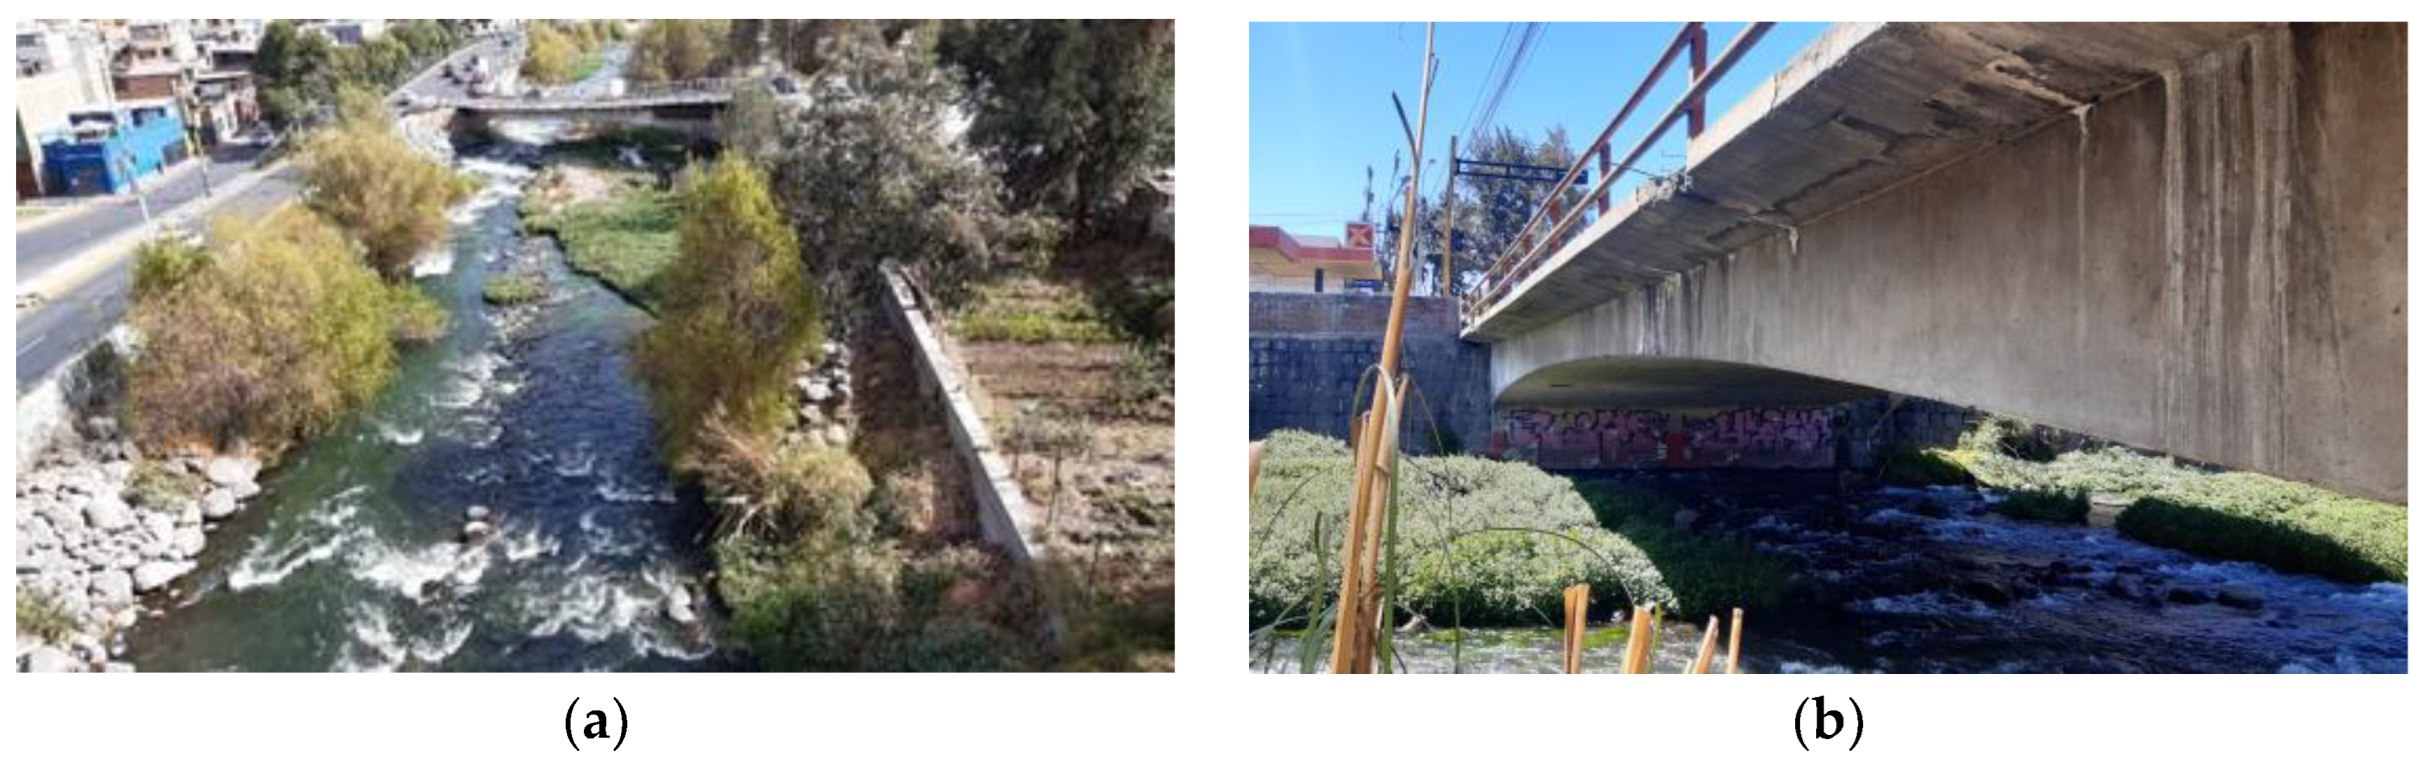
3.4. Bridge Assessment
4. Conclusions
Author Contributions
Funding
Data Availability Statement
Acknowledgments
Conflicts of Interest
References
- Proske, D. Comparison of the collapse frequency and the probability of failure of bridges. Proc. Inst. Civ. Eng. Bridge Eng. 2019, 172, 27–40. [Google Scholar] [CrossRef]
- Shirole, A.M.; Holt, R.C. Planning for a comprehensive bridge safety assurance program. Transp. Res. Rec. 1991, 1290, 39–50. [Google Scholar]
- Wardhana, K.; Hadipriono, F.C. Analysis of Recent Bridge Failures in the United States. J. Perform. Constr. Facil. 2003, 17, 144–150. [Google Scholar] [CrossRef]
- Mondoro, A.; Frangopol, D.M.; Liu, L. Bridge Adaptation and Management under Climate Change Uncertainties: A Review. Nat. Hazards Rev. 2018, 19, 04017023. [Google Scholar] [CrossRef]
- Smith, D. Bridge failures. Proc. Inst. Civ. Eng. 1976, 60, 367–382. [Google Scholar] [CrossRef]
- Pregnolato, M.; Winter, A.O.; Mascarenas, D.; Sen, A.D.; Bates, P.; Motley, M.R. Assessing flooding impact to riverine bridges: An integrated analysis. Nat. Hazards Earth Syst. Sci. 2022, 22, 1559–1576. [Google Scholar] [CrossRef]
- Bhatkoti, R.; Moglen, G.E.; Murray-Tuite, P.M.; Triantis, K.P. Changes to Bridge Flood Risk under Climate Change. J. Hydrol. Eng. 2016, 21, 04016045. [Google Scholar] [CrossRef]
- Bastidas-Arteaga, E.; Stewart, M.G. Damage risks and economic assessment of climate adaptation strategies for design of new concrete structures subject to chloride-induced corrosion. Struct. Saf. 2015, 52, 40–53. [Google Scholar] [CrossRef]
- Kosič, M.; Anžlin, A.; Bau’, V. Flood Vulnerability Study of a Roadway Bridge Subjected to Hydrodynamic Actions, Local Scour and Wood Debris Accumulation. Water 2023, 15, 129. [Google Scholar] [CrossRef]
- Rowan, E.; Evans, C.; Riley-Gilbert, M.; Hyman, R.; Kafalenos, R.; Beucler, B.; Rodehorst, B.; Choate, A.; Schultz, P. Assessing the Sensitivity of Transportation Assets to Extreme Weather Events and Climate Change. Transp. Res. Rec. 2013, 2326, 16–23. [Google Scholar] [CrossRef]
- INDECI. Resumen Ejecutivo N° 323-2023. Temporada de Lluvias 2022–2023. Available online: https://drive.google.com/file/d/1TXLtyd6ne7oRen3-m3hrBYGD9rhL6Vzh/view (accessed on 16 September 2023).
- Espinoza Vigil, A.J.; Booker, J.D. Building national disaster resilience: Assessment of ENSO-driven disasters in Peru. Int. J. Disaster Resil. Built Environ. 2023. ahead-of-print. [Google Scholar] [CrossRef]
- INDECI. Resumen Ejecutivo Historico—Temporada de Lluvias, 2016–2017. Available online: https://portal.indeci.gob.pe/emergencias/resumen-ejecutivo-historico-temporada-de-lluvias-2016-2017-actualizado-al-24-de-enero-2018-2/ (accessed on 18 July 2023).
- Libélula, Comunicación Ambiente y Desarrollo S.A.C. Vulnerabilidad y adaptación al cambio climático en Arequipa Metropolitana. Available online: https://scioteca.caf.com/handle/123456789/1181 (accessed on 17 July 2023).
- Podestá, L. Media Represa Llena de Barro en Arequipa. Available online: https://www.podestaprensa.com/2017/02/media-represa-llena-de-barro-en-arequipa.html (accessed on 18 July 2023).
- Vargas Maquera, M. Determinación de Índice Simplificado de Calidad de Agua en el río Chili, Arequipa 2019. Universidad Nacional de San Agustín de Arequipa. 2021. Available online: http://hdl.handle.net/20.500.12773/12585 (accessed on 18 November 2020).
- Espinoza Vigil, A.J.; Booker, J. Hydrological Vulnerability Assessment of Riverine Bridges: The Bajo Grau Bridge Case Study. Water 2023, 15, 846. [Google Scholar] [CrossRef]
- Bento, A.M.; Gomes, A.; Viseu, T.; Couto, L.; Pêgo, J.P. Risk-based methodology for scour analysis at bridge foundations. Eng. Struct. 2020, 223, 111115. [Google Scholar] [CrossRef]
- Akay, H.; Baduna Koçyiğit, M. Hydrologic Assessment Approach for River Bridges in Western Black Sea Basin, Turkey. J. Perform. Constr. Facil. 2020, 34, 04019090. [Google Scholar] [CrossRef]
- Timbadiya, P.V.; Patel, P.L.; Porey, P.D. HEC-RAS Based Hydrodynamic Model in Prediction of Stages of Lower Tapi River. ISH J. Hydraul. Eng. 2011, 17, 110–117. [Google Scholar] [CrossRef]
- Popescu, C.; Bărbulescu, A. Floods Simulation on the Vedea River (Romania) Using Hydraulic Modeling and GIS Software: A Case Study. Water 2023, 15, 483. [Google Scholar] [CrossRef]
- Merkuryeva, G.; Merkuryev, Y.; Sokolov, B.V.; Potryasaev, S.; Zelentsov, V.A.; Lektauers, A. Advanced river flood monitoring, modelling and forecasting. J. Comput. Sci. 2015, 10, 77–85. [Google Scholar] [CrossRef]
- Ahmad, B.; Kaleem, M.S.; Butt, M.J.; Dahri, Z. Hydrological modelling and flood hazard mapping of Nullah Lai. Proc. Pak. Acad. Sci. 2010, 47, 215–226. [Google Scholar]
- Cook, A.; Merwade, V. Effect of topographic data, geometric configuration and modeling approach on flood inundation mapping. J. Hydrol. 2009, 377, 131–142. [Google Scholar] [CrossRef]
- Deng, L.; Cai, C.S. Bridge Scour: Prediction, Modeling, Monitoring, and Countermeasures—Review. Pract. Period. Struct. Des. Constr. 2010, 15, 125–134. [Google Scholar] [CrossRef]
- Garg, V.; Setia, B.; Singh, V.; Kumar, A. Scour protection around bridge pier and two-piers-in-tandem arrangement. ISH J. Hydraul. Eng. 2022, 28, 251–263. [Google Scholar] [CrossRef]
- Khalid, M.; Muzzammil, M.; Alam, J. A reliability-based assessment of live bed scour at bridge piers. ISH J. Hydraul. Eng. 2021, 27, 105–112. [Google Scholar] [CrossRef]
- Gharbi, M.; Soualmia, A.; Dartus, D.; Masbernat, L. Comparison of 1D and 2D hydraulic models for floods simulation on the Medjerda Riverin Tunisia. J. Mater. Environ. Sci. 2016, 7, 3017–3026. [Google Scholar]
- Anees, M.T.; Abdullah, K.; Nawawi, M.N.M.; Ab Rahman, N.N.; Piah, A.R.; Zakaria, N.A.; Syakir, M.I.; Omar, A.K. Numerical modeling techniques for flood analysis. J. Afr. Earth Sci. 2016, 124, 478–486. [Google Scholar] [CrossRef]
- Papaioannou, G.; Loukas, A.G.; Vasiliades, L.; Aronica, G.T. Flood inundation mapping sensitivity to riverine spatial resolution and modelling approach. Nat. Hazards 2016, 83, 117–132. [Google Scholar] [CrossRef]
- Quispe, M. Arequipa: “Base del Puente Grau Estaría Desprendiéndose por Falta de Mantenimiento”, Alerta Especialista. Available online: https://elbuho.pe/2023/03/arequipa-base-del-puente-grau-estaria-desprendiendose-por-falta-de-mantenimiento-alerta-especialista/ (accessed on 18 August 2023).
- Carpio, J.G. Texao: Arequipa y Mostajo. La Historia de un Pueblo y un Hombre; Universidad de Indiana: Bloomington, IN, USA, 1983; Volume Tomo III. [Google Scholar]
- Méndez, R. Cierran Puentes en Arequipa por Incremento del Caudal del río Chili. Available online: https://andina.pe/agencia/noticia-cierran-puentes-arequipa-incremento-del-caudal-del-rio-chili-399604.aspx (accessed on 18 July 2023).
- RPP Noticias. Cierran Tres Puentes Ante Posible Desborde Del río Chili en Arequipa. Available online: https://rpp.pe/peru/actualidad/cierran-tres-puentes-ante-posible-desborde-del-rio-chili-en-arequipa-noticia-339102 (accessed on 28 July 2023).
- Paredes, J.C. Gestión de Riesgos Bajo el Enfoque del PMI en Obras Viales Existentes—Caso: Puente Bajo Grau, Arequipa—2018; Universidad Católica de Santa María: Arequipa, Peru, 2019. [Google Scholar]
- La República. Arequipa: Pilares y Cornisas del Puente Bolognesi se Están Erosionando. Available online: https://larepublica.pe/sociedad/1412891-pilares-cornisas-puente-bolognesi-erosionando/ (accessed on 18 July 2023).
- Caja1. El Puente Bolognesi. Available online: https://loslonccos.com.pe/el-puente-bolognesi/ (accessed on 25 July 2023).
- Frase Corta. Un día Como Hoy Fue Inaugurado el Puente San Martín. Available online: https://www.facebook.com/frasecorta/photos/a.1554014347966348/5836343223066751/?type=3 (accessed on 25 July 2023).
- Exitosa Noticias. Arequipa: Cierran dos Puentes Ante Incremento de Caudal del río Chili. Available online: https://exitosanoticias.pe/v1/arequipa-cierran-dos-puentes-ante-incremento-de-caudal-del-rio-chili/ (accessed on 18 July 2023).
- Martínez, F. La Verdadera Historia del Puente Fierro de Arequipa: ¿lo Construyó el Creador de la Torre Eiffel? Available online: https://larepublica.pe/sociedad/2022/07/22/arequipa-conoce-la-verdadera-historia-del-puente-fierro-lo-construyo-el-creador-de-la-torre-eiffel-puente-bolivar/ (accessed on 25 July 2023).
- Eguiluz, P. Los Puentes Sobre el río Chili. Available online: https://percyeguiluz.blogspot.com/2016/07/los-puentes-sobre-el-rio-chili.html (accessed on 25 July 2023).
- El Búho. Lluvias en Arequipa: Desborde de Torrenteras en la La Isla, Terminal Terrestre y Paucarpata. Available online: https://elbuho.pe/2020/02/lluvias-en-arequipa-desborde-de-torrenteras-en-la-isla-terminal-terrestre-y-paucarpata/ (accessed on 25 July 2023).
- Méndez, R. Cierran tres puentes en Arequipa como medida de prevención ante crecida del río Chili. Available online: https://andina.pe/agencia/noticia.aspx?id=344650 (accessed on 18 July 2023).
- Redacción RPP. Ante Las Intensas Lluvias Que se Registran en la Ciudad de Arequipa las Autoridades Inspeccionaron Puentes y Zonas Que Podrían Ser Afectadas por la Crecida. Available online: https://rpp.pe/peru/actualidad/arequipa-inspeccionan-zonas-vulnerables-del-rio-chili-noticia-437213 (accessed on 28 July 2023).
- Diario Sin Fronteras. Deberan Retirar Puente Bailey, Que Une Tiabaya con Hunter. Available online: https://diariosinfronteras.com.pe/2021/08/23/deberan-retirar-puente-bailey-que-une-tiabaya-con-hunter/ (accessed on 18 July 2023).
- Cruz, O. Arequipa: Habilitan Puente Bailey Después de 2 Años. Available online: https://diariocorreo.pe/edicion/arequipa/arequipa-habilitan-puente-bailey-despues-de-2-anos-noticia/?ref=dcr (accessed on 28 July 2023).
- LR Arequipa. Arequipa: Puente Bailey Que Une Distritos de Hunter y Tiabaya Aún no Sera Desmontado. Available online: https://larepublica.pe/sociedad/2021/08/28/arequipa-puente-bailey-que-une-distritos-de-hunter-y-tiabaya-aun-no-sera-desmontado-lrsd/ (accessed on 15 November 2022).
- Google Earth. Available online: https://earth.google.com/web/@-16.39255346,-71.53891603,570.32857418a,0d,35y,-0h,0t,0r?utm_source=earth7&utm_campaign=vine&hl=es-419 (accessed on 22 November 2022).
- Liu, W.-C.; Hsieh, T.-H.; Liu, H.-M. Flood Risk Assessment in Urban Areas of Southern Taiwan. Sustainability 2021, 13, 3180. [Google Scholar] [CrossRef]
- Glas, H.; De Maeyer, P.; Merisier, S.; Deruyter, G. Development of a low-cost methodology for data acquisition and flood risk assessment in the floodplain of the river Moustiques in Haiti. J. Flood Risk Manag. 2020, 13, e12608. [Google Scholar] [CrossRef]
- Garrote, J.; Díez-Herrero, A.; Escudero, C.; García, I. A Framework Proposal for Regional-Scale Flood-Risk Assessment of Cultural Heritage Sites and Application to the Castile and León Region (Central Spain). Water 2020, 12, 329. [Google Scholar] [CrossRef]
- Kuroiwa, J. Gestión del Riesgo de Desastres en el siglo XXI, 1st ed.; NSG SAC: Lima, Peru, 2019. [Google Scholar]
- Geng, Y.; Zheng, X.; Wang, Z.; Wang, Z. Flood risk assessment in Quzhou City (China) using a coupled hydrodynamic model and fuzzy comprehensive evaluation (FCE). Nat. Hazards 2020, 100, 133–149. [Google Scholar] [CrossRef]
- Ettinger, S.; Mounaud, L.; Magill, C.; Yao-Lafourcade, A.-F.; Thouret, J.-C.; Manville, V.; Negulescu, C.; Zuccaro, G.; De Gregorio, D.; Nardone, S.; et al. Building vulnerability to hydro-geomorphic hazards: Estimating damage probability from qualitative vulnerability assessment using logistic regression. J. Hydrol. 2016, 541, 563–581. [Google Scholar] [CrossRef]
- Bathrellos, G.D.; Karymbalis, E.; Skilodimou, H.D.; Gaki-Papanastassiou, K.; Baltas, E.A. Urban flood hazard assessment in the basin of Athens Metropolitan city, Greece. Environ. Earth Sci. 2016, 75, 319. [Google Scholar] [CrossRef]
- Mani, P.; Chatterjee, C.; Kumar, R. Flood hazard assessment with multiparameter approach derived from coupled 1D and 2D hydrodynamic flow model. Nat. Hazards 2014, 70, 1553–1574. [Google Scholar] [CrossRef]
- Ministerio de Transportes y Comunicaciones. Manual de Carreteras: Diseño Geométrico DG—2018. Available online: https://portal.mtc.gob.pe/transportes/caminos/normas_carreteras/documentos/manuales/Manual.de.Carreteras.DG-2018.pdf (accessed on 25 July 2023).
- Ministerio de Transportes y Comunicaciones. Manual de Puentes. Available online: https://www.gob.pe/institucion/mtc/normas-legales/257462-19-2018-mtc-14 (accessed on 25 July 2023).
- Centro Nacional de Estimación, Prevención y Reducción del Riesgo de Desastres. Manual para la Evaluación de Riesgos Originados por Fenómenos Naturales—2da Versión. Available online: https://www.cenepred.gob.pe/web/wp-content/uploads/Guia_Manuales/Manual-Evaluacion-de-Riesgos_v2.pdf (accessed on 25 July 2023).
- Ministerio de Transportes y Comunicaciones. Manual de Hidrología, Hidráulica y Drenaje. Available online: http://transparencia.mtc.gob.pe/idm_docs/normas_legales/1_0_2950.pdf (accessed on 25 July 2023).
- Instituto Nacional de Defensa Civil. Manual básico para la estimación del riesgo. Available online: http://bvpad.indeci.gob.pe/doc/pdf/esp/doc319/doc319_contenido.pdf (accessed on 25 July 2023).
- National Defense Research Institute. Data Collection Methods. Semi-Structured Interviews and Focus Groups. Available online: https://www.rand.org/content/dam/rand/pubs/technical_reports/2009/RAND_TR718.pdf (accessed on 25 July 2023).
- AUTODEMA. Información Referente a Represa Aguada Blanca; Informe N° 1432-2022-GRA-PEMS-GGRH-SGOM; AUTODEMA: Arequipa, Peru, 2022. [Google Scholar]
- Ramos, C.; Saldivar, G. Análisis de Riesgo Frente a Máximas Avenidas Con el uso del Producto Grillado Pisco PD en Las Quebradas Polanco, San Lázaro, Miraflores y Mariano Melgar en la Provincia de Arequipa; Universidad Católica de Santa María: Arequipa, Peru, 2022. [Google Scholar]
- Breña, A. Hidrología Urbana; Universidad Autónoma Metropolitana: Mexico City, Mexico, 2003. [Google Scholar]
- ANA (Autoridad Nacional del Agua). Estudio de Delimitación de la Faja Marginal del río Chili; Autoridad Nacional del Agua: Lima, Peru, 2015. [Google Scholar]
- ASF DAAC. ALOS_PALSAR_ Hi-Res Terrain Corrected, JAXA/METI ALPSRP239236850-RTC_HI_RES ASF. Available online: https://datapool.asf.alaska.edu/RTC_HI_RES/A3/AP_23923_FBD_F6850_RT1.zip (accessed on 29 November 2022).
- Chow, V. Hidráulica de Canales Abiertos; McGraw Hill: New York, NY, USA, 1994. [Google Scholar]
- Concha, C.; Miranda, A. Análisis del Riesgo de Inundación de la Cuenca del río Chili en el Tramo de Chilina a Uchumayo—Arequipa; Universidad Católica de Santa María: Arequipa, Peru, 2016. [Google Scholar]


| Item | Bridge | Observation | Lifespan (Years) |
|---|---|---|---|
| P01 | Grau | The bridge presents cracks and detachments in its ashlar base [31]. | 135 [32]. |
| P02 | Bajo Grau | Restricted to vehicular traffic due to rainfalls in 2012 and 2011 [33,34]. | 31 [35]. |
| P03 | Bolognesi | Bridge in operation since colonial times [33]. Heavy rainfalls weakened its structure [36]. | 415 [37]. |
| P04 | San Martin | Restricted to vehicular traffic due to rainfalls in 2012 and 2011 [33,34]. | 64 [38]. |
| P05 | De Fierro | Restricted to vehicular traffic due to rainfalls in 2019 [39]. It presents problems in one of its ashlar bases [31]. | 152 [40]. |
| P06 | San Isidro | The left side of the bridge is sinking [31]. | 57 [41]. |
| P07 | Tingo | Restricted to vehicular traffic due to rainfalls in 2020 and 2011 [34,42,43]. | 12 [44]. |
| P08 | Bailey | Flooding in areas surrounding the bridge, the National Water Authority reiterated its removal [45]. It was reopened to vehicular traffic [46]. | 07 [47]. |
| Main Precedent Studies | |||
|---|---|---|---|
| ID | Author | Year | Assessment Parameters Considered in the Research |
| B1 | Espinoza and Booker [17]. | 2023 | Environmental and physical vulnerability of bridges. Temperature in relation to climate change, water quality, bridge construction materials, proximity to settlements, flood gauge, foundation protection against scour, deck erosion, flooding, and compliance with current regulations. |
| B2 | Pregnolato et al. [6]. | 2022 | Hydrodynamic thrust forces in flooding. |
| B3 | Liu et al. [49]. | 2021 | Social parameters, e.g., the economy of the population, education level, and age, as well as safety facilities, shelters, and hospitals. |
| B4 | Glass et al. [50]. | 2020 | Type of housing and current data of the population in terms of economic and social risk. |
| B5 | Garrote et al. [51]. | 2020 | Material of construction of the structure, water depth, and flood velocity. |
| B6 | Bento et al. [18]. | 2020 | Type and support material of the foundation, history of scour problems, type of river, and the importance of the bridge according to the traffic flowing over it. |
| B7 | Akay and Baduna [19]. | 2020 | Land use in the basin, surface condition, and frequency of flood recurrence. |
| B8 | Julio Kuroiwa [52]. | 2019 | Flow velocity and construction material from nearby houses. |
| B9 | Geng et al. [53]. | 2019 | Flood depth, submerged area and duration of flooding, population density, and rate of urbanization. |
| B10 | Bhatkoti et al. [7]. | 2016 | Climate change and the increase in impervious areas upstream. |
| B11 | Ettinger et al. [54]. | 2016 | Height ranges in terms of flooding, observed damage, and soil imperviousness. |
| B12 | Bathrellos et al. [55]. | 2016 | Slope of the study area, permeability, and vegetation cover of the soil. |
| B13 | Mani et al. [56]. | 2013 | Depth and duration of flooding. |
| Main Design Codes | |||
| ID | Author | Year | Assessment parameters considered in the research |
| B14 | Ministry of Transportation and Communications [57]. | 2018 | Bridge clearance height, material of construction, and lifespan. |
| B15 | Ministry of Transportation and Communications [58]. | 2018 | Bridge clearance height. |
| B16 | National Center for Disaster Risk Assessment, Prevention and Reduction [59]. | 2014 | Life span, material, state of infrastructure conservation, material of housing in populated centers, and training for residents. |
| B17 | Ministry of Transportation and Communications [60]. | 2008 | Abutment protection, scouring, and bridge clearance height. |
| B18 | National Institute of Civil Defense [61]. | 2006 | Climate change, water quality, proximity to population centers, and compliance with current regulations. |
| Environmental Dimension | ||||||
|---|---|---|---|---|---|---|
| ID | Variable | Very Low: 1 | Low: 2 | Medium: 3 | High: 4 | Very High: 5 |
| A1 | Climate change | Temperature levels consistent over time. | Slightly above average temperature levels. | Levels are moderately above average levels. | Above average temperature levels. | Temperature levels are well above average. |
| A2 | Water quality | No degree of contamination. | Low pollution level. | Moderate level of contamination. | High level of contamination. | Very high level of contamination. |
| A3 | Ecological conditions | Conservation of natural resources; no deforestation nor pollution. | Low level of exploitation of natural resources and low level of pollution. | Moderate level of exploitation of natural resources and level of pollution. | High level of exploitation of natural resources and pollution. | Very high level of exploitation of natural resources, deforestation, and pollution. |
| A4 | Waste that interrupts the flow of the river | The river is free of waste and/or garbage. | The river has a small amount of light trash, such as plastic bags and bottles. | Small to medium-sized debris such as branches, car parts, and tires are present in small quantities. | It presents medium-sized debris in regular quantities such as car parts, tires, and tree trunks. | It presents large debris in large quantities, such as tree trunks. |
| Technical Dimension | ||||||
| ID | Variable | Very low: 1 | Low: 2 | Medium: 3 | High: 4 | Very High: 5 |
| T1 | Construction material | Reinforced concrete. | Steel. | Local materials of considerable strength. | Wood. | Adobe, cane, and less resistant materials. |
| T2 | State of conservation | No deterioration. | Slight deterioration of structural finishes due to normal use. | There is no deterioration and, if there is, it is not compromised and is remediable, or the structural finishes and installations have visible deterioration due to misuse. | The structure shows signs of deterioration that compromise it, although there is no danger of collapse, and the structural finishes and installations have visible flaws. | The infrastructure is so deteriorated that it is likely to collapse. |
| T3 | Flow protection in pillars and abutments | The piers and/or abutments are extremely well protected against extraordinary floods, which makes it possible to assume zero vulnerability. | The pillars and/or abutments are highly protected against extraordinary floods. | The pillars and/or abutments are moderately protected against extraordinary floods. | Pillars and/or abutments are poorly protected against extraordinary floods. | Pillars and/or abutments are unprotected against extraordinary floods. |
| T4 | Height of the base of the board (a) | The height allows the water to flow without inconvenience. It has more than 2 m of difference between the water surface and the base of the board. | The height allows the water to flow smoothly. It has less than 2 m of difference between the water surface and the base of the board. | The height allows water to flow normally. It is less than 30 cm between the water surface and the base of the board. | The height does not allow the water to flow normally. The water level reaches the base of the board. | The height does not allow water to flow normally. Water levels exceed the level of the board. |
| T5 | Depth of scour in shallow foundations (b) | Scour depth with a safety margin of more than 1 m. | Scour depth with a safety margin of less than 1 m. | Scour depth reaches the foundation base. | Scour depth exceeds by less than 1 m. | Scour depth exceeds more than 1 m. |
| T6 | Current capacity of upstream dams (c) | Capacity between 81 and 100%. | Capacity between 61 and 80%. | Capacity between 41 to 60%. | Capacity between 21 and 40%. | Capacity between 0 and 20%. |
| Social Dimension | ||||||
| ID | Variable | Very low: 1 | Low: 2 | Medium: 3 | High: 4 | Very High: 5 |
| S1 | Poverty status or human development | Nearby population without poverty. | Nearby population with the lowest percentage of poverty. | Nearby population with median poverty. | Nearby population with high poverty. | Nearby population living in total or extreme poverty. |
| S2 | Disaster Prevention and Response (DPR) training programs for the population. | The population is constantly being trained in DPR, being updated, and participating in drills, with dissemination and total coverage. | The population is constantly trained in DPR, and its dissemination and coverage are total. | The population is regularly trained in DPR, and its dissemination and coverage are widespread. | The population is scarcely trained in DPR, and its diffusion and coverage are scarce. | The entire population does not have or develop any DPR training program. |
| S3 | Proximity to population centers | Very far, >5 km. | Far away, 3–5 km. | Medium proximity, 1–3 km. | Nearby, 0.2–1 km. | Very near, 0–0.2 km. |
| S4 | Material of nearby houses (d) | Masonry and reinforced concrete. | Wood and/or quincha reinforced with diagonal elements. | Quincha (cane with mud). | Adobe or Tapial. | Mat and/or cardboard. |
| Economic Dimension | ||||||
| ID | Variable | Very low: 1 | Low: 2 | Medium: 3 | High: 4 | Very High: 5 |
| E1 | Time in operation | Less than 10 years. | Between 10 and 25 years old. | From 25 to 50 years old. | From 50 to 75 years old. | More than 75 years in operation. |
| E2 | Importance according to the volume of vehicular traffic | Very few vehicles transiting per day. | Few vehicles transiting per day. | A regular number of vehicles transiting per day. | It is used by many vehicles per day. | It carries a high number of vehicles daily. |
| E3 | Closure to vehicular traffic due to hydrological risk | The bridge has not been closed to vehicular traffic due to hydrological risk. | The bridge was planned to close due to hydrological risk. | The bridge has closed to vehicular traffic due to hydrological risk once. | The bridge has been closed to vehicular traffic due to hydrological risk twice. | The bridge has closed due to hydrological risk more than twice. |
| E4 | History of flooding (e) | The bridge has never flooded. | The bridge flooded on one occasion. | The bridge flooded on two occasions. | The bridge flooded on three occasions. | The bridge flooded on four occasions. |
| ID | Questions |
|---|---|
| PR1 | To what extent do you think that the criteria presented will enable a good assessment of different types of bridges with respect to their hydrological vulnerability? |
| PR2 | What recommendations could you give to improve or optimize the matrix? |
| PR3 | What recommendations would you give to implement the evaluation? If it is for the case of a provincial municipality and/or public entities, what process could be followed? |
| Answer | Important Extract | Validation (V)/Recommendation (R) |
|---|---|---|
| R.1.1. | “…the criteria will allow for a proper evaluation…” | V |
| R.1.2. | “Verify each year the performance of the matrix once implemented.” | R |
| R.2.1. | “Optimal criteria.” | V |
| R.2.2. | “I don’t see the need for a matrix optimization.” | V |
| R.3.1. | “…an integral analysis of the infrastructure systems is very important because this will enable prioritizing interventions” | V |
| R.3.2. | “…from a hydrological perspective, the matrix is very consistent.” | V |
| R.4.1. | “It allows a global evaluation of the various aspects related to the operational level of a bridge…” | V |
| R.4.2. | “It is necessary to define, regardless of whether one or several bridges are analyzed, which number between 1 and 5 defines to me that the bridge is vulnerable…” | R |
| R.5.1. | “Precisely, to carry out all these vulnerability, hazard and risk studies, a qualitative and quantitative analysis matrix is always used, as you have indicated…” | V |
| R.5.2. | “…it seems to me that the most basic points are” | V |
| R.6.1. | “…all criteria are well developed…” | V |
| R.6.2. | “…as for the hydraulic modeling, the accurately determination of the roughness values is import…” | R |
| Distribution | Theoretical Delta |
|---|---|
| Normal | 0.0937 |
| Log Normal 2—parameter | 0.1130 |
| Log Normal 3—parameter | 0.0917 |
| Gamma 2—parameter | 0.0807 |
| Pearson III | 0.0764 |
| Log Pearson Type III | does not adjust; the scale parameter (β) is negative |
| Gumbel | 0.0917 |
| Log Gumbel | 0.1761 |
| Chili River | |
|---|---|
| Return Period (Years) | Flow Rate (m3/s) |
| 100 | 247.52 |
| 140 | 259.32 |
| 200 | 271.54 |
| 500 | 301.90 |
| 1000 | 323.78 |
| Bridge | MODELING FLOW RATE (m3/s) | ||
|---|---|---|---|
| Return Period (Years) | |||
| 100 | 200 | 500 | |
| P 01, 02, 03, and 04 | 388.42 | 442.24 | 590.50 |
| P 05 and 06 | 406.32 | 466.14 | 623.30 |
| P 07 and 08 | 476.52 | 543.04 | 766.10 |
| ID | Evaluation | Score |
|---|---|---|
| A1 | Increased temperature due to climate change, which is exacerbated by the progressive loss of the countryside and green areas in the city. | 4 |
| A2 | The section under study presents contamination in terms of microbiological parameters, where they exceed the environmental quality standard. | 4 |
| T9 | The Aguada Blanca dam has reached its useful life expectancy and, due to a lack of maintenance and sediment cleaning, its storage capacity has been reduced to 50%. | 3 |
| ID | Evaluation | Score |
|---|---|---|
| A3 | It has a moderate level of contamination and exploitation of natural resources. | 3 |
| A4 | There is a large amount of algae and grass, as well as logs, tires, and plastic bags. | 4 |
| T1 | The bridge is made of reinforced concrete material. | 1 |
| T2 | The bridge shows signs of deterioration that compromise it, although there is no danger of collapse, and the finishes and installations have visible flaws. There are also cracks on the right side of the bridge, and the bridge’s steel is unprotected in some areas. | 4 |
| T3 | The bridge abutments are unprotected against extraordinary floods. | 5 |
| T4 | The water flow is close to impacting a maximum flood that occurred in 2011 and the hydraulic modeling shows that it impacts the deck and overflows. | 5 |
| S1 | There are houses made of masonry material near the bridge, and the surrounding area is a business housing and farming area, with no poverty indexes. | 1 |
| S2 | Stores and/or businesses that live near the bridge were consulted and indicated that the municipality does not provide them with training on disaster prevention and responses to hydrological events. They mentioned that, eventually, the municipality cleaned the riverbed. | 4 |
| S3 | It was observed that the population lives less than 0.2 km away. | 5 |
| S4 | The houses are made of brick masonry. | 1 |
| E1 | The bridge was inaugurated on 11 August 1959, and has been in operation for more than 63 years. | 4 |
| E2 | It is a bridge over which many vehicles travel, generates high economic income, and is considered very important by the population. | 5 |
| E3 | The bridge was closed to vehicular traffic twice due to hydrological events. | 4 |
| ID | P01 | P02 | P03 | P04 | P05 | P06 | P07 | P08 |
|---|---|---|---|---|---|---|---|---|
| A1 | 4 | 4 | 4 | 4 | 4 | 4 | 4 | 4 |
| A2 | 4 | 4 | 4 | 4 | 4 | 4 | 4 | 4 |
| A3 | 3 | 3 | 3 | 3 | 2 | 3 | 3 | 3 |
| A4 | 3 | 3 | 3 | 4 | 1 | 2 | 2 | 2 |
| T1 | 3 | 1 | 3 | 1 | 2 | 1 | 1 | 2 |
| T2 | 3 | 3 | 3 | 4 | 4 | 2 | 2 | 1 |
| T3 | 5 | 3 | 2 | 5 | 2 | 3 | 4 | 3 |
| T4 | 1 | 5 | 1 | 5 | 1 | 1 | 4 | 5 |
| T5 | - | - | - | - | - | - | - | - |
| T6 | 3 | 3 | 3 | 3 | 3 | 3 | 3 | 3 |
| S1 | 1 | 1 | 1 | 1 | 1 | 1 | 2 | 1 |
| S2 | 4 | 4 | 4 | 4 | 4 | 4 | 4 | 5 |
| S3 | 5 | 5 | 5 | 5 | 5 | 5 | 5 | 5 |
| S4 | 1 | 1 | 1 | 1 | 1 | 1 | 1 | 1 |
| E1 | 5 | 3 | 5 | 4 | 5 | 4 | 2 | 1 |
| E2 | 5 | 5 | 5 | 5 | 4 | 5 | 5 | 4 |
| E3 | 1 | 4 | 1 | 4 | 3 | 1 | 4 | 3 |
| E4 | - | - | - | - | - | - | - | - |
| Average | 3.19 | 3.25 | 3.00 | 3.56 | 2.88 | 2.75 | 3.13 | 2.94 |
| Priority | ID | Bridge | Score | Vulnerability |
|---|---|---|---|---|
| 1 | P04 | San Martín | 3.56 | High |
| 2 | P02 | Bajo Grau | 3.25 | High |
| 3 | P01 | Grau | 3.19 | High |
| 4 | P07 | Tingo | 3.13 | High |
| 5 | P03 | Bolognesi | 3.00 | High |
| 6 | P08 | Bailey | 2.94 | Medium |
| 7 | P05 | De Fierro | 2.88 | Medium |
| 8 | P06 | San Isidro | 2.75 | Medium |
Disclaimer/Publisher’s Note: The statements, opinions and data contained in all publications are solely those of the individual author(s) and contributor(s) and not of MDPI and/or the editor(s). MDPI and/or the editor(s) disclaim responsibility for any injury to people or property resulting from any ideas, methods, instructions or products referred to in the content. |
© 2023 by the authors. Licensee MDPI, Basel, Switzerland. This article is an open access article distributed under the terms and conditions of the Creative Commons Attribution (CC BY) license (https://creativecommons.org/licenses/by/4.0/).
Share and Cite
Huarca Pulcha, A.; Espinoza Vigil, A.J.; Booker, J. Prioritizing Riverine Bridge Interventions: A Hydrological and Multidimensional Approach. Designs 2023, 7, 117. https://doi.org/10.3390/designs7050117
Huarca Pulcha A, Espinoza Vigil AJ, Booker J. Prioritizing Riverine Bridge Interventions: A Hydrological and Multidimensional Approach. Designs. 2023; 7(5):117. https://doi.org/10.3390/designs7050117
Chicago/Turabian StyleHuarca Pulcha, Alan, Alain Jorge Espinoza Vigil, and Julian Booker. 2023. "Prioritizing Riverine Bridge Interventions: A Hydrological and Multidimensional Approach" Designs 7, no. 5: 117. https://doi.org/10.3390/designs7050117