Article

Efficiency Improvement with Data Center Monitoring Based on Building Information Modeling on the Facility Management Stage

1
Doctoral School of Informatics, University of Debrecen, 4032 Debrecen, Hungary
2
Department of Basic Technical Studies, Faculty of Engineering, University of Debrecen, 4032 Debrecen, Hungary
*
Author to whom correspondence should be addressed.
Submission received: 26 October 2022 / Revised: 5 December 2022 / Accepted: 19 December 2022 / Published: 2 January 2023

Abstract

:
Building Management Systems can be used for effective monitoring, management, planning, and improving the quality of work on large objects (office buildings, factories). Moreover, these systems can reduce costs during the operational phase. One of the technically complex and expensive facilities in which functions of Building Management Systems are used are data centers. To achieve a high level of efficiency at the Facility Management stage, it is important to work with data centers from the design stage. Data center design issues can be solved using Building Information Modeling, but during the transition to the operation of the facility some problems arise, namely the correct data export for Facility Management, the connection of real sensors with the model, and the receipt of data. All of these also affect the efficiency of the data center systems management. This article introduces a novel methodology for interconnecting Building Information Models with real sensors in data centers, which can provide a basis for further optimization. Furthermore, it can result in a more efficient operation in the operational phase. The proposed method is implemented and the experience gained as a result of the application is described.

1. Introduction

Data centers—as specialized facilities—include [1,2]:
  • Information infrastructure, including server equipment, provides the data center functions, namely data storage and processing.
  • Telecommunications infrastructure allows to interconnect the data center elements and transfer the data between the users and the data center.
  • Engineering infrastructure including several systems: air conditioning and ventilation system, uninterruptible power supply, fire extinguishing, low current systems and access control, other systems according to the specifications [3].
The data center design has a large impact on the profitability and efficiency of companies. Preparation for the proper operation of data centers requires specific methods and approaches, one of which is data modeling.
Although, in most cases, Building Information Modeling (BIM) technologies are applied to the design and construction of buildings, it can also be used during the operational phase. The new methodology proposed in this article is based on a novel use of BIM for Facility Management (FM): a direct connection of real sensors with their digital models is established, and new families are defined, which include several operational parameters that vary during the operation of the facility.
The aim of the study is to improve the operation of data centers at the FM stage. The essence of the problem is that data centers are designed and built using either computer aided design (CAD) or BIM and then, separately from this process, a Building Management System (BMS) is created for the operation of the facility. As a result, the design of an object and the creation of a BMS are disparate processes. This article suggests designing directly in BIM and then using FM programs to combine the BIM model with BMS, thereby eliminating the duplication of work and reducing the possibility of errors.
The methodology has been implemented in a project referred to as ‘JSC CROC project’ in the article, and the project data are used in the analysis. To test the methodology, a BIM family was created for 54 temperature sensors and 5 humidity sensors evenly spaced in a room. Using FM software, the digital copies of the sensors were connected to real sensors located in 18 cabinets in the existing data center, and continuous data collection from each of these sensors was ensured.
According to Green Grid, data center Power Usage Effectiveness (PUE) is the ratio of the total amount of energy used by the data center to the amount of energy utilized by the computing equipment [4]:
PUE = Total   power   in   the   data   center Total   power   utilized   by   IT   equipment   in   the   data   center
This ratio will always yield a value greater than 1, and the less efficient data center is, the larger the PUE number is. Data Center infrastructure Efficiency (DCiE) is the inverse of PUE:
DCiE = 1 PUE
The Table 1 shows the levels of efficiency with PUE and DCiE indicators [5].
Constant control of the temperature range and humidity in data centers improves energy efficiency. According to the graph in Figure 1, power consumption increases significantly from an average of 27 °C, depending on the environmental class of the data center.
The energy consumption of IT equipment is directly related to the power demand of the fans used for cooling the equipment; the cooling power requirement of a data center can be computed as a function of rack inlet temperature. Increasing temperature results in enhanced power consumption and reduced efficiency of IT equipment. Moreover, a rapid growth occurs when the temperature exceeds 27 °C, and the electricity consumption can increase up to 20% in the range of 27–35 °C. That is why the temperature range of 18–27 °C is recommended by ASHRAE [7].
Maintaining the proper temperature and indoor humidity ranges based on continuous monitoring of data centers can provide significant energy savings. For example, to ensure the required reliability of data center equipment, the temperature and the humidity can be controlled through the airflow; an increased volume of cool air is drawn in by equipment as the temperature rises.
Temperature sensors have unique parameters, such as the temperature inlet and outlet of the rack, and sensor identification number. Humidity sensors also have a unique ID and varying humidity parameters. The digital models of temperature and humidity sensors with the necessary parameters are created and implemented in a real operating data center equipped with real sensors by using FM software. During the operation of the data centers, data was collected from the sensors, allowing to evaluate the new methodology.
The Flow chart in Figure 2 describes the process providing the connection between BIM and real sensors. It illustrates that the proposed method solves several problems, namely the traditional connection to the BMS and the connection to the BIM operational model improving the reliability of data exchange. If a problem in the connection between the FM program and the BIM model occurs, the traditional BMS continues to operate normally.

2. Literature Review

The range of studies linking data centers and BIM is very limited in the literature, and there is especially little research in the field of the application of FM for data centers.
The concept of using BIM for automation data centers design is given in [8]. The methodology proposed by the authors is based on the extended use of BIM for the operation and maintenance of data centers.
As data centers are integrated parts of the enterprise information systems, it seems to be natural to use the tools for data center design that are successfully used in other fields of design and operation. Despite the importance of this task, so far, this topic is discussed only by a few researchers. Two of the sources providing studies in this field are [9,10].
Wei et al. [9] suggested the use wireless sensor networks (WSN) to monitor thermal performance parameters and further the prediction of them. They also described an approach by integrating BIM and WSN to improve the data center thermal performance and energy efficiency. However, the methodology was proposed without checking using FM software to collect data from sensors in the BIM.
Rossella et al. [10] reviewed different methods of data exchange between BIM and FM software and applied the data exchange method to the performance indication model (PIM) pilot case study with regards to surgery rooms in healthcare building.
Karim et al. [11] give examples that show the effectiveness of using various methods of model preparation for building in Qatar University, for further operation and maintenance.
Table 2 highlights that the traditional ways to prepare models for further use for FM are less effective than designing directly in BIM. Moreover, when preparing a project first, for example in CAD, and then transferring it to BIM, errors usually arise and duplication of work tends to occur.
Although several methods for studying existing objects are available, they have significant disadvantages. Techniques associated with 3D scanning are rather expensive, and the methods based on photogrammetry are less accurate.
The data capture techniques discussed in [11] and described in Table 2 are the following:
  • CAD to 3D BIM Models—Architecture Structural MEP; Fittings, fixtures, non- textured model (Interior and Exterior);
  • Scan to 3D BIM Models—Architecture Structural MEP Full 3D textured model (Interior and Exterior); Point cloud-based on laser beams;
  • UAV to 3D BIM Models—Full 3D textured model (Exterior only); Point cloud based on photogrammetry;
  • 3D BIM Models to BMS.
Table 3 shows some important projects available in the literature, where the connection between BIM and FM is discussed.
In this paper, a practical example is presented to show the issue of design and subsequent preparation of a model for its use in FM. The importance of this study lies in the fact that the proposed method demonstrates the direct relationship among the following three components: temperature and humidity sensors, FM software, and BIM. All these components work together, thereby eliminating errors.

3. Main Stages of Creating Building Management Systems for Data Centers

BMS manages all areas and functions of systems in facilities. It brings individual technical systems together, collects their data, and automates their control. The integration of BIM technologies and the design of data centers have become a necessary process. The use of BIM for FM makes it possible not only to model an object, but also to manage objects throughout their entire life cycle.
A BMS applied for data centers allows solving problems of maintaining the continuity of power supply, water supply, air conditioning of the premises of the building, control of the fire extinguishing system and telecommunication systems, access control systems and video surveillance, etc. The documentation and the system building process have the following steps in a classic BMS:
1. Development of documentation in 2D (with AutoCAD or similar programs). The documentation must include: block diagram of connecting elements; equipment layout plan; connection diagrams of elements; and specification.
2. Installation of all necessary sensors and controllers and their connections to each other.
3. Configuration of software and central server; creation of all connections and circuits in specialized software.
The disadvantages of the traditional BMSs that can be eliminated with the application of the proposed method are as follows:
1. Duplication of work: 2D drawings and diagrams are created by an engineer, and then they are transferred to a specific program for sequential operation and sets the necessary parameters by another one.
2. The spatial location of parts is undetermined because of 2D representation, there is no way to indicate the location of the object on the equipment plan accurately.
3. Changes in the location of the equipment are recorded manually with the high probability of errors.

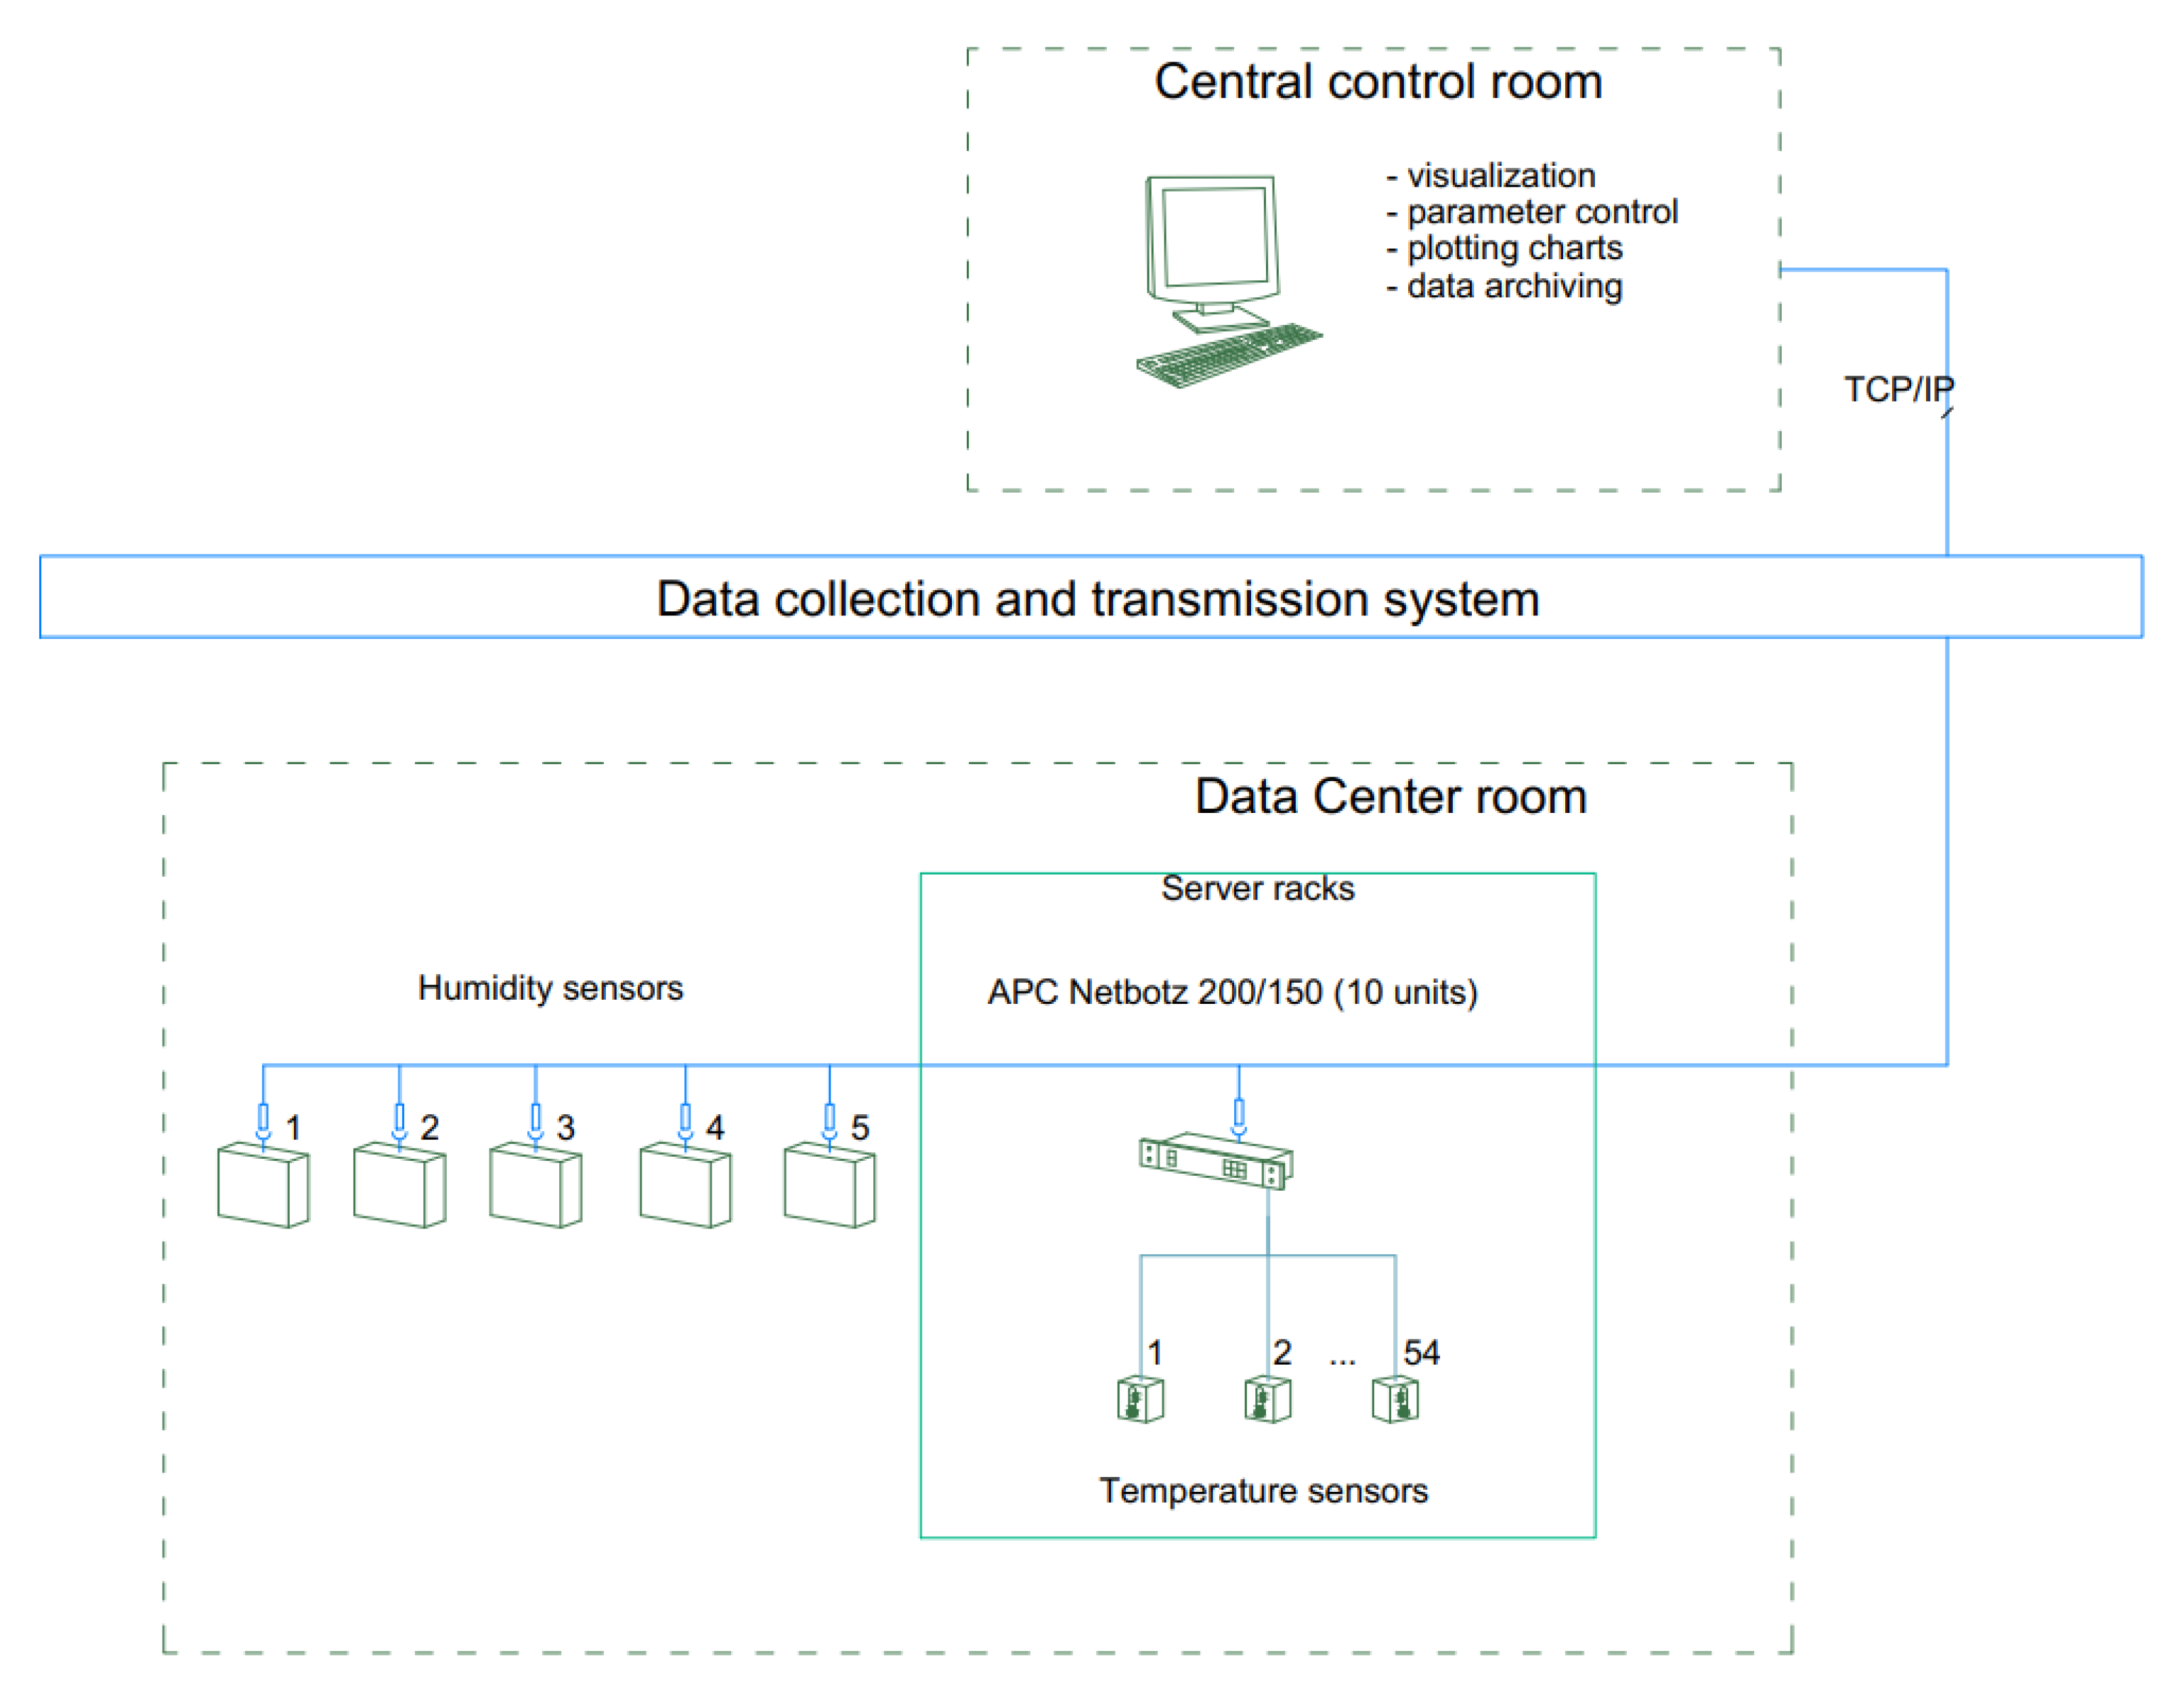
3.1. Structure of the Building Management Systems

A BMS in data centers is usually connected to several systems, such as the power supply system with devices for monitoring the state of the distribution part, diesel generator sets, and uninterruptible power supplies (UPS); the air conditioning system of technological premises; the automatic installation of gas fire extinguishing; and the general ventilation control system. A BMS is a completely autonomous, functionally complete solution. The structure of the system includes a set of technological equipment, measuring and control instruments, and automation equipment.
The structure of a BMS includes primary measuring sensors and actuators; data collection modules are located in local automation cabinets. Communication and data transmission channels connect modules and sensors. The BMS server allows for the collection of data for further control by using the operator’s workstation.

3.2. Description of the Main Automation Equipment

The main automation equipment includes:
  • Humidity and temperature sensors.
The humidity and temperature sensors are designed to reflect the temperature and humidity indicators in the data center premises. The recommended humidity parameters are in the range of 40–60%. The data center room temperature sensors are typically mounted in potentially hot areas near each HVAC unit to monitor their operating status. The settings, depending on the room, are most often in the range of 18–27 °C. Temperature parameters at the rack inlet and outlet (cold and hot aisles) are also monitored separately. ASHRAE recommends front and rear sensors for each rack (top, middle, and bottom) [20]. Their number depends on the number and heat dissipation of the active equipment installed inside. The temperature ranges are as follows: 18–27 °C at the entrance to the rack; less than 20 °C at the outlet of the rack.
2.
Switch
A network switch is a device designed to connect equipment to a computer network within one or more network segments. The switch operates at the link layer of the OSI network model.
3.
BMS server
BMS server designed to collect data from sensor equipment is installed in the cabinets and data center. It is integrated into the BMS data exchange network according to the Ethernet standard.
4.
Operator panel software
Operator panel software intended for organizing local control and outputting information from sensors. In case of failure, the software provides control and visualization functions of the data presentation.

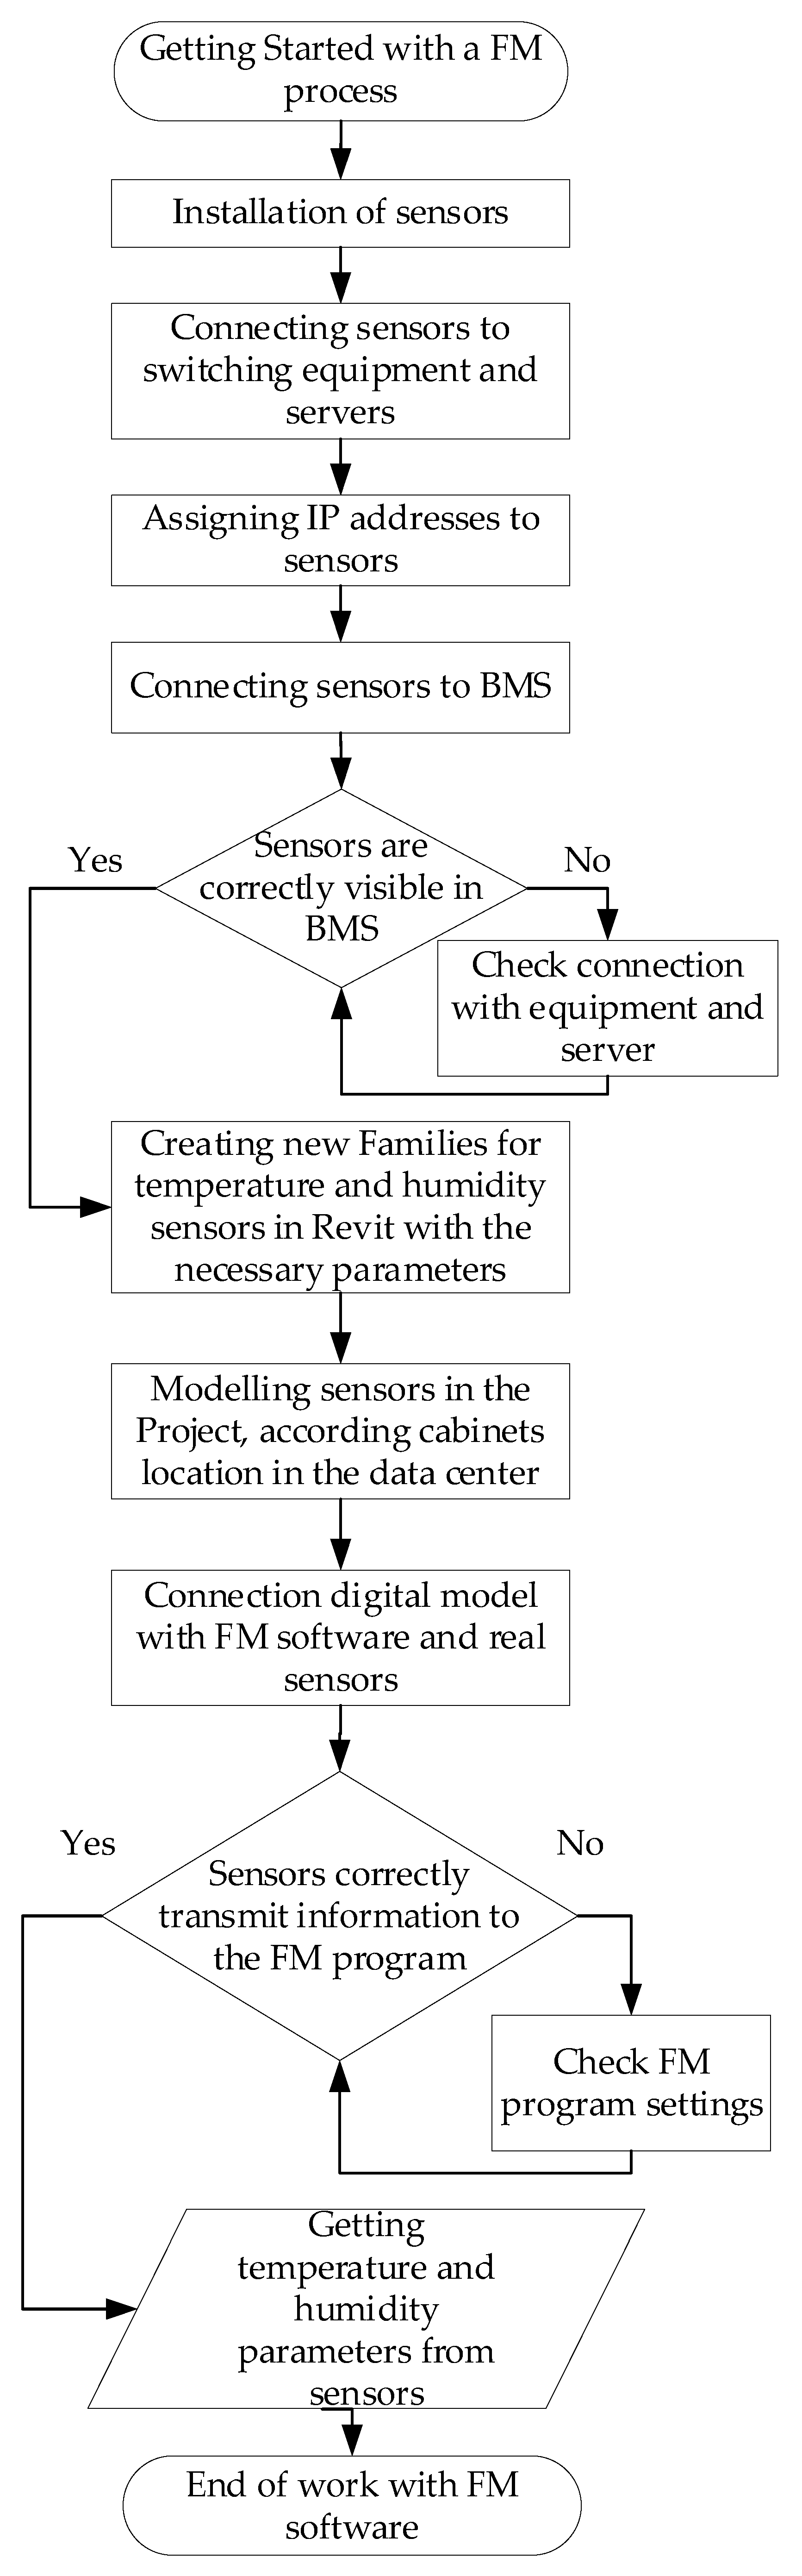
3.3. Connecting Sensors to the BMS

Temperature and humidity sensors are sensitive elements and are located together with a digital-to-analog converter; a cable is connected to it, through which electrical signals pass. The sensors are connected to the controller with RJ-45 connectors. The controllers can communicate using TCP/IP, SNMP, and other protocols. The data (signals) coming from the sensors are processed in the controller, recorded in the memory, and transferred to the software on the server via the IP network. Furthermore, by using the web application of the BMS program, we can access the data and set thresholds.
The diagram in Figure 3 describes the process of connecting sensors to the BMS system.
Our data are from a data center with 18 racks, 54 temperature sensors, and 5 humidity sensors. These sensors are connected to the controllers. To connect them, controllers and expansion boards of the APC were used. Up to 6 sensors can be connected to one controller or expansion board. Accordingly, in our case, there were 10 such controllers and expansion cards.

4. Implementation BIM for FM

From the point of view of the BIM model, the main sensors that need to be added to the model are humidity sensors and temperature sensors. It is crucial to keep track of accurate information about the environment in which the servers are located in real time.
The use of equipment’s internal thermometers for data acquisition, which is typical in practice, has several disadvantages, the main ones being that the temperature data are reflected from the sensor installation point and do not show the real condition of the cabinet as a whole. Furthermore, servers do not include humidity sensors, which are also important for the normal operation of a data center.
Thus, the optimal operation of data centers requires the installation of a certain number of temperature and humidity sensors at certain places in the data center, which leads to a layout optimization problem of the sensor system that also can be studied in the proposed model.
It is recommended to use sensors with a cable connection to eliminate the possible interferences received when using an electromagnetic signal (see e.g., an example of using wi-fi sensors in [9]).
To connect physical sensors to the model, it is necessary to create families of these sensors in Revit and select the software for FM.

4.1. Preparing New Families According to the Requirements of the Proposed Model

To build the model families, temperature and humidity sensors were created with the following parameters: Name; Manufacturer; Equipment code; Type, brand; Unit of measurement; Inlet and outlet temperature or humidity; ID; Note; and the size of the sensors. All these characteristics are needed at the operational stage. Furthermore, they are automatically inserted into the specification of new sensors created in Revit and also exported to the FM model.

4.2. Data Export from BIM to FM

The framework used for FM in order to organize the communication with BIM properly is crucial. The most important practical examples of using BIM for FM are given in [10]. The main ways to exchange information are as follows:
  • through the IFC file transfer of the model and through the XML properties of the model elements;
  • through the IFC file transfer of the model and through the COBie properties of the model elements;
  • creating an FM model manually;
  • using special software for direct data transfer to the FM model.
In addition to the graphic component, an important element of the families in Revit for FM is the information component. The issue of transferring data to the FM model is open, as it depends on the needs for data exchange at a particular facility. In the first two methods, graphical and object parameters have to be transferred separately.
Although the most popular way to exchange data is COBie, in this research, a direct export from Revit to FM software is applied because of the special requirements of our system and the following disadvantages of COBie.
COBie is an exchange format typically used to export data for manageable assets from BIM design software into a data format that can be easily imported into FM and Operations and Maintenance software. COBie aids to collect important project data such as equipment specification lists, warranties, product data sheets, maintenance schedules, and life span. This information is crucial to assist the operation and maintenance of the facility [21]. COBie can be handed to the facility managers by importing it into Computerized Maintenance Management System (CMMS) software or by Microsoft Excel spreadsheet format, which is the most popular [22]. The information transferring into a COBIe file and the file structure are described in detail in [23]. The COBIe file structure is presented in Appendix A. A disadvantage of this method is that a COBie file transfers only a table of the main project parameters, it does not contain the parameters we need, such as the temperature sensor parameters. The graphic objects are transferred by means of conversion to the IFC format.
Consequently, it is more efficient to directly transfer data to the program for FM. This method allows the transfer of both graphical information about objects and their properties. Furthermore, in the proposed methodology, the following functions from FM software have an important role:
  • Transfer the 3D model with all the necessary parameters to the software for FM.
  • Supplement the model with the necessary information: scans of drawings, datasheets.
  • Connecting of real sensors and elements of engineering systems to the program.
  • Indication and display of emergency situations, with the ability to identify the object in 3D.
  • Creation of scheduled maintenance schedules and assignment of responsible persons.
When implementing our model (in the JSC CROC project), EcoDomus software for our study purpose [24] was used, which provides the abovementioned functions. Communication between EcoDomus and BMS also allows us to display graphics from the equipment’s sensors, providing access to relevant information to all building engineers. Communication between BMS and EcoDomus is organized through a web interface. Essentially, EcoDomus receives the same data as the BMS system.
To test the methodology presented in this article, models were created for 54 temperature sensors and 5 humidity sensors evenly spaced in the room. The digital copies of the sensors were connected with the FM software to real sensors located in 18 cabinets and areas in the operating data center.
Figure 4 shows the location of temperature and humidity sensors in the data center room, as well as inside the racks. Since sensors from adjacent racks are connected to the same controller, pairs of racks are marked with the same letter.
The data coming from the sensors were collected over 24 h. It allowed us to check changes in temperature and humidity during this period of time from each of these sensors. The average parameters of temperature and humidity are presented in the Appendix B and Appendix C.

5. Discussion

Improvement of the design and operation stages of data centers results in the increased efficiency of facilities and significant cost savings. The control of the temperature and humidity distribution inside the data centers is a crucial aspect of operational efficiency. Thus, finding the optimal parameters of the temperature and humidity sensor system (among them the number and position of sensors) is an essential aspect of efficiency improvement. The optimization requires an appropriate data model like the one proposed in this article.
Figure 1 shows that the power consumption of data centers increases significantly from the average of 27 °C, thus the control of the temperature range and humidity in data centers leads to the improvement of the energy efficiency. In addition, our experience in the implementation of a data model in the ‘JSC CROC project’ allows us to talk about significant time savings from the design stage of the data center to its operation. Compared to the experience of working in classical CAD and BMS systems, efficiency improvement is obtained in terms of design stage:
  • the total time of reducing the engineers’ work—by 25% (from 80 to 60 mans-hours in the case study);
  • reduction of time for checking intersections during design stage with other systems—by two times (from 32 to 16 mans-hours in the case study);
  • reduction of the terms of approvals with related systems—by 50% (from 24 to 12 mans-hours in the case study).
The method proposed in this article allows for the detection of deviations from the required parameters of the sensors and the immediate notification of the operator about it. Moreover, unlike the classical BMS, changes in the position of sensors or the addition of new ones are automatically duplicated in the information model.

6. Conclusions

Till now, there have been just a few studies related to the use of BIM for the design, construction, and operation of data centers. The purpose of this study was to demonstrate the concept of a direct connection of BIM from design to operation of a data center providing a practical example of a temperature and humidity monitoring system.
This study presents an approach that combines the BIM design method and its further use for specific FM software. This method is implemented in the project referred to in the article as the ’CROC JSC Project’.
With ready-made CAD drawings, BIM conversion needs much more time and resources compared to creating a project directly in the model. Laser scanning of existing objects is too expensive for general use, whereas creating a BIM model for construction and further facility management offers a competitive solution (see Table 2).
Another important issue that can be treated with the proposed method is the complex process of transferring data from the model to the FM program, where a number of problems may arise. Since the integration of different BMSs with BIM is questionable, according to this study, the best solution is to use software linking BIM and BMS directly. An answer to the main question of this research, ‘How to optimize operation for data centers at the FM stage by using BIM?’, was presented by applying special purpose software to connect BMS and BIM in FM from the design stage to the operation. This approach excludes the possible errors in documentation during the design and construction stage and also reduces time incurred by the unnecessary repetition of work.
The FM software used in the study provides the possibility of direct data export (graphic and informational component); monitoring of sensor parameters in real time; and the ability to use the web interface. Due to the data collected from the sensors during the day in the case study, it was possible to analyze the performance of the proposed methodology and its effectiveness.
The limitations of the study are based on the amount of humidity and temperature sensors used to test proposed methodology. Moreover, due to the fact that the data was collected for the study purpose, time was limited to 24 h.
The issue of future research is the application of the presented technique for larger systems (with a greater number of sensors and with a longer time interval) for further optimization purposes.
Firstly, it is planned to consistently increase the interval for monitoring data from existing sensors: from 24 h to a week, and from a week to a month. This will allow for the analysis and tracking of measurement errors that may occur over a longer interval.
Secondly, it is planned to increase the number of temperature and humidity sensors and cabinets. The model, described in this work, uses 54 temperature sensors and 5 humidity sensors that cover 18 cabinets. This is sufficient for a small data center, but for large industrial data centers, it may not be enough. Therefore, the number of cabinets in which the additional installation of sensors is planned will be increased up to 36 cabinets located in different rooms. This will allow to simulate a data center with several cabinet rooms.
In conclusion, having tested the monitoring of temperature and humidity in several cabinet rooms of the data center, it will be possible to supplement the system with other sensors or use it not only within data centers but also for monitoring smart buildings. Since the principle of building the system presented in the article is universal and applicable to different objects, only the number and type of sensors will be different.

Author Contributions

Conceptualization, S.P.; methodology, S.P. and I.K.; software, S.P.; validation, S.P. and I.K.; formal analysis, S.P. and I.K.; investigation, S.P.; resources, S.P.; data curation, S.P.; writing—original draft preparation, S.P. and I.K.; writing—review and editing, S.P. and I.K.; visualization, S.P. supervision, I.K.; project administration, I.K.; funding acquisition, I.K. All authors have read and agreed to the published version of the manuscript.

Funding

This research received no external funding. The APC was funded by the University of Debrecen.

Institutional Review Board Statement

Not applicable.

Informed Consent Statement

Not applicable.

Data Availability Statement

The data used in the study are original test data obtained from a case study which was a part of a large private ongoing project. As researchers involved in a specific part of the project, the authors have the right to publish the data obtained in the framework of this study. Other (non-relevant) data of the private project are not publishable.

Conflicts of Interest

The authors declare no conflict of interest.

Appendix A

Table A1. COBie structure [25].
Design
ComponentIt defines the independent organized physical objects and features, which may need management, like examination, maintenance, repairing and replacement, throughout the operational phase
FacilityIt defines a geographic benefit or different operative built, normally in a part of infrastructure or building in association with details and the geographic location scope of the project chronological
FloorIt defines a particular portion of space, containing separated horizontal regions, vertical levels, and subdivisions with allocated spaces
SpaceIt defines the area type like occupied space, service area and under maintenance area, including unoccupied spaces, but not necessarily isolated spaces
SystemIt defines set of Components that can managed and arranged to provide corporate functions
TypeIt defines the Component specifications such as materials, items and products
ZoneIt defines a group of Spaces, which have a particular Attribute in common, like condition, activity, entry and management
Common
AttributeIt defines a particular specification that related to an asset
ConnectionIt defines a common relationship between two components
ContactIt defines a person or an association which responsible for the lifecycle of a Facility
CoordinateCoordinate It defines a location related to Component, Space, Floor or Facility
DocumentIt defines an external document related to an asset
IssueIt defines the lake of information or hazard that related to the assets
Build
JobIt defines a task that related to Type throughout the operational phase
ResourceIt defines an ability or material that is necessary to accomplish a Job
SpareIt defines a part that related to a Type and can be replaced with another part

Appendix B

Table A2. Average temperature data from the sensors used in the case study.
Temperature Sensors
Rear SideRear SideFront Side
Cabinet 1TS 1.1TS 1.2TS 1.3
23.18 °C23.60 °C18.54 °C
Cabinet 2TS 2.1TS 2.2TS 2.3
22.99 °C23.33 °C19.00 °C
Cabinet 3TS 3.1TS 3.2TS 3.3
22.53 °C23.18 °C19.04 °C
Cabinet 4TS 4.1TS 4.2TS 4.3
22.76 °C23.72 °C19.31 °C
Cabinet 5TS 5.1TS 5.2TS 5.3
22.68 °C22.38 °C18.93 °C
Cabinet 6TS 6.1TS 6.2TS 6.3
22.95 °C23.75 °C19.04 °C
Cabinet 7TS 7.1TS 7.2TS 7.3
23.68 °C22.72 °C19.50 °C
Cabinet 8TS 8.1TS 8.2TS 8.3
23.45 °C22.41 °C19.16 °C
Cabinet 9TS 9.1TS 9.2TS 9.3
23.45 °C22.91 °C19.20 °C
Cabinet 10TS 10.1TS 10.2TS 10.3
23.72 °C23,37 °C19.50 °C
Cabinet 11TS 11.1TS 11.2TS 11.3
23.07 °C23.22 °C19.31 °C
Cabinet 12TS 12.1TS 12.2TS 12.3
22.53 °C23.83 °C19.31 °C
Cabinet 13TS 13.1TS 13.2TS 13.3
23.49 °C23.33 °C19.27 °C
Cabinet 14TS 14.1TS 14.2TS 14.3
21.72 °C23.26 °C19.04 °C
Cabinet 15TS 15.1TS 15.2TS 15.3
22.22 °C22.64 °C19.08 °C
Cabinet 16TS 16.1TS 16.2TS 16.3
21.84 °C24.64 °C19.16 °C
Cabinet 17TS 17.1TS 17.2TS 17.3
23.49 °C22.61 °C19.04 °C
Cabinet 18TS 18.1TS 18.2TS 18.3
22.57 °C22.91 °C18.93 °C

Appendix C

Table A3. Average humidity data from the sensors used in the case study.
Humidity Sensors
HS 1HS 2HS 3HS 4HS 5
35.19%34.70%36.89%35.15%35.36%

References

  1. GOST R 58811-2020; Clause 3.1.13. Data Processing Centers. Engineering Infrastructure. Stages of Creation. National Standard of the Russian Federation. The Federal Agency on Technical Regulating and Metrology: Moscow, Russia, 2020.
  2. Filin, S. Organization of a management system for the operation of a data processing center. Electron. Sci. J. Age Qual. 2018, 2, 35–59. Available online: http://www.agequal.ru/pdf/2018/218003.pdf (accessed on 21 October 2022).
  3. Rybakova, A.; Kagan, P. Application of Building Information Modeling in the Design of Data Centers. Mater. Sci. Eng. 2020, 869, 022006. [Google Scholar] [CrossRef]
  4. Steve, S. The Green Grid, White Paper #50 “Data Center Efficiency and IT Equipment Reliability at Wider Operating Temperature and Humidity Ranges”. Available online: https://www.thegreengrid.org/ (accessed on 21 October 2022).
  5. Mueen, U.; Asadullah, S.; Raed, A. Measuring Efficiency of Tier Level Data Centers to Implement Green Energy Efficient Data Centers. Middle-East J. Sci. Res. 2013, 15, 200–207. [Google Scholar]
  6. Demetiou, D. A Simple Method to Understand Trade-Offs in Data Center Cooling. Electronics cooling. Available online: https://www.electronics-cooling.com/2015/05/a-simple-method-to-understand-trade-offs-in-data-center-cooling/ (accessed on 23 December 2022).
  7. The American Society of Heating, Refrigerating and Air-Conditioning Engineers. Available online: https://www.ashrae.org/ (accessed on 21 October 2022).
  8. Pogorelskiy, S.; Kocsis, I. Automation for structured cabling system in data centers using Building Information Modelling. Int. Rev. Appl. Sci. Eng. 2022, 13, 335–345. Available online: https://akjournals.com/view/journals/1848/aop/article-10.1556-1848.2022.00424/article-10.1556-1848.2022.00424.xml?body=contentreferences-24701 (accessed on 21 October 2022). [CrossRef]
  9. Wei, W.; Wenjia, L.; Deify, L.; Woonki, N. Improving Data Center Energy Efficiency Using a Cyber-physical Systems Approach: Integration of Building Information Modeling and Wireless Sensor Networks. Procedia Eng. 2015, 118, 1266–1273. [Google Scholar]
  10. Rossella, M.; Maurizio, N.; Francesco, P.; Andrej, T. A Methodology for a Performance Information Model to Support Facility Management. Sustainabilty 2019, 11, 7007. Available online: https://www.mdpi.com/2071-1050/11/24/7007/htm (accessed on 21 October 2022).
  11. Karim, S.; Khalid, N.; Murat, G.; Onur, B.; Faisal, F.; Tarek, Z. BIM-based Facility Management Models for Existing Buildings. J. Eng. Res. 2021, 10, 21–37. [Google Scholar]
  12. CRC. Adopting BIM for Facilities Management: Solutions for Managing the Sydney Opera House; Cooperative Research Centre (CRC) for Construction Innovation: Brisbane, Australia, 2007. [Google Scholar]
  13. Su, Y.C.; Lee, Y.C.; Lin, Y.C. Enhancing Maintenance Management Using Building Information Modeling in Facilities Management. In Proceedings of the 28th International Symposium on Automation and Robotics in Construction (ISARC 2011), Seoul, Republic of Korea, 29 June 2011. [Google Scholar]
  14. Teicholz, P. BIM for Facility Managers; John Wiley & Sons: Hoboken, NJ, USA, 2013. [Google Scholar]
  15. Bortolini, R.; Forcada, N.; Macarulla, M. BIM for the integration of Building Maintenance Management: A case study of a university campus. In Proceedings of the 11th European Conference on Product & Process Modelling (ECPPM), Limassol, Cyprus, 7–9 September 2016. [Google Scholar]
  16. Thabet, W.; Lucas, J. Asset Data Handover for a Large Educational Institution. Case-Study Approach. J. Constr. Eng. Manag. 2017, 143, 05017017. [Google Scholar] [CrossRef]
  17. Lucas, J.; Thabet, W. Case-Study Approach to Explore Methods for Transferring BIM-Based Asset Data to Facility Management Systems. In Proceedings of the Construction Research Congress (CRC 2018), New Orleans, LA, USA, 2–4 April 2018. [Google Scholar]
  18. Pishdad-Bozorgi, P.; Gao, X.; Eastman, C.; Self, A.P. Planning and developing facility management-enabled building information model (FM-enabled BIM). Autom. Constr. 2018, 87, 22–38. [Google Scholar] [CrossRef]
  19. Koch, C.; Hansen, G.K.; Jacobsen, K. Missed opportunities: Two case studies of digitalization of FM in hospitals. Facilities 2019, 37, 381–394. [Google Scholar] [CrossRef]
  20. ASHRAE. Thermal Guidelines for Data Processing Environments, 3rd ed.; ASHRAE Datacom Series; ASHRAE: Washington, DC, USA, 2012. [Google Scholar]
  21. Becerik-Gerber, B.; Jazizadeh, F.; Li, N.; Calis, G. Application Areas and Data Requirements for BIM-Enabled Facilities Management. J. Constr. Eng. Manag. 2012, 138, 431–442. [Google Scholar] [CrossRef]
  22. Sabbagh, M.; Sinan, M. BIM and COBie for Facility Management. Int. Refereed Acad. J. Struct. Inf. Model. 2019, 1, 10–20. [Google Scholar]
  23. Lee, J.; Jeong, W.; Faghihi, V.; Kang, J. Automatic Generation of COBIE Data from Revit, Conference Paper. In Proceedings of the 30th International Symposium on Automation and Robotics in Construction and Mining (ISARC 2013), Montreal, QC, Canada, 11–15 August 2013. [Google Scholar]
  24. EcoDomus Software. Available online: https://www.ecodomus.com/ (accessed on 21 October 2022).
  25. Wang, G.; Philip, M.; McKinley, M. BIM for Facilities Management: Providing value at the Howard Hughes Medical Institute. J. Natl. Inst. Build. Sci. 2017, 5, 10–14. [Google Scholar]
Figure 1. (a) ASHRAE Volume Server power increase vs. Inlet temperature and (b) ASHRAE Volume Server air flow rate increase vs. Inlet temperature [6].
Designs 07 00003 g001
Figure 2. Connection process between BIM and real sensors using FM software [JSC CROC project].
Designs 07 00003 g002
Figure 3. Connection of sensors to the BMS system [JSC CROC project].
Designs 07 00003 g003
Figure 4. Location of temperature and humidity sensors in the data center room, as well as inside the racks [JSC CROC project].
Designs 07 00003 g004
Table 1. Efficiency values of Data Center [5].
PUELevel of EfficiencyDCiE
3Very inefficient33%
2.5Inefficient40%
2Average50%
1.5Efficient67%
1.2Very Efficient83%
Table 2. Comparison of different data collection methods for subsequent integration into BMS [11].
CAD to 3D BIM ModelsScan to 3D BIM ModelsUAV to 3D BIM Models3D BIM
Models to BMS
Data sourceExecutive drawings, specificationsMeasurements of a real buildingMeasurements of a real buildingNA
Total cost ($) of the technology (hardware and software)(~US 4000)(~US $20,000)(~US $1700)(~US $5040)
Total time (Man-hours)160.2523.564
Minimum data accuracy (%)10099.498.9100
Accuracy considerationFully accurateMax error 2 cm/any dimensionMax 4 to 5 cm/100 mNA
Table 3. Examples of information exchange between BIM and FM in the literature.
Name of the ProjectPurposeMethods of Information Exchange
Sydney Opera House ([12], 2007)Preparation BIM based CAD documentation for further FMIFC model (integrated data model)
Taiwan’s school ([13], 2011)Extend BIM into the maintenance phase and to create a single repository of facility data for facilities maintenanceApplication Programming Interface and C# programming language
University of Chicago, ([14] pp. 294–314, 2013) Supporting actions on the FM stageSpreadsheet (modified version of COBie)
Terrassa Campus ([15], 2016)Studying the advantages of the integration of FM and BIMApplication of specific identifier number for objects
Laboratory and office building ([16,17], 2018)Using more efficient data acquisition during FMComparison among different methods: manual; spreadsheet; CSV; IFC
Public University building ([18], 2018)To develop and maintain central database to support FMCOBie and IFC
Scandinavian and Denmark hospitals, cases A and B ([19], 2018)Supporting elements of digital model at the FM stageManual combination of operational information in FM (case A); specified classifications of systems (case B)
Disclaimer/Publisher’s Note: The statements, opinions and data contained in all publications are solely those of the individual author(s) and contributor(s) and not of MDPI and/or the editor(s). MDPI and/or the editor(s) disclaim responsibility for any injury to people or property resulting from any ideas, methods, instructions or products referred to in the content.

