Article

Testing of a Low-Cost Dry Cell Prototype for Oxyhydrogen Production

1
Cátedra de Energias Renováveis, Departamento de Eng. Mecatrónica, Universidade de Évora, Rua Romão Ramalho 59, 7000-671 Évora, Portugal
2
Laboratório Associado de Energia, Transporte e Aeronáutica (LAETA), Departamento de Física, ECT, Universidade de Évora, Rua Romão Ramalho 59, 7000-671 Évora, Portugal
3
INEGI Alentejo, Universidade de Évora, Largo dos Colegiais 2, 7000-803 Évora, Portugal
4
Low Carbon & Resource Efficiency, R & Di, Instituto de Soldadura e Qualidade, 4415-491 Grijó, Portugal
*
Author to whom correspondence should be addressed.
Designs 2022, 6(5), 79; https://doi.org/10.3390/designs6050079
Submission received: 18 July 2022 / Revised: 31 August 2022 / Accepted: 1 September 2022 / Published: 7 September 2022
(This article belongs to the Special Issue Battery System Design)

Abstract

:
This work aims to study the production of oxyhydrogen gas by a small low-cost prototype consisting of six dry cells. Firstly, a molecular composition study of the gas was carried out, presenting concentrations of 67% H2 and 28% O2. The deviation from the stoichiometric yield is discussed to be caused by water vapor production and/or oxygen dissolution in the liquid phase. Secondly, an efficiency study was done, considering the ratio between the reversible voltage of an electrolytic cell and the voltage applied to the dry cell by an external power source. Different working conditions (electrolyte concentration, 3% (w/w) of KHO and 20% (w/w) of KHO) have been tested to analyze their effect on the efficiency of the system. The results show that a lower electrolyte concentration increases the applied cell voltage, and so the necessary power input for gas production to occur, resulting in lower cell efficiency. Overall, the efficiencies are below 69.8 ± 0.6% for the studied electrolyte concentrations and approach approximately the same value around 50% for higher powers.

1. Introduction

Molecular hydrogen (H2) can be used as fuel for energy production and is considered a secondary energy vector, since it does not exist in its pure form in nature. Hydrogen can be obtained through various processes and from various sources, including through the reformation of natural gas or biofuels; gasification of biomass and coal; electrolysis of water or water vapor at high temperatures; thermochemical cycles; and photocatalytic processes [1].
Hydrolysis is any chemical reaction in which water molecules break down one or more of their chemical bonds. Electrolysis, in turn, consists of separating water into hydrogen (H2) and oxygen (O2) using electrical energy [2], and occurs in electrolytic cells. This process has an efficiency as high as 85%, however, the amount of electricity required makes the overall process inefficient and often expensive [1].
Electrolysis is commonly made with the use of wet cells, which have two electrodes, an anode, and a cathode, made from some inert metals, such as platinum and stainless steel, or graphite. The electrodes are immersed in a water solution with an acid or a base, forming an electrolyte, in order to increase the electrical conductivity of the solution. This aims to reduce the enormous amount of energy required to perform the electrolysis of pure water, since it is not a good electrical conductor [2]. The electrolyte, when dissolved in water, results in a solution capable of conducting electricity. The electrolyte dissociates into cations and anions, with cations attracted by the negative pole and anions by the positive pole of the electrolytic cell. This allows the continuous flow of electricity, increasing the conductivity of the solution, which, in turn, depends on the mobility of the ions [2]. For electrolytes of basic solution, potassium hydroxide (KOH) stands out, with typical concentrations between 20% and 30% (w/w) [3]. This electrolyte prevents corrosion problems caused by acidic electrolytes. A cheaper alternative is sodium hydroxide (NaOH), however, it presents a lower electrical conductivity [3,4]. As an acidic solution, strong acids are commonly used, such as sulfuric acid (H2SO4) [5].
When voltage is applied to the electrodes, connecting the positive pole of an electric power source to the anode and the negative pole to the cathode, with the flow of electric current through the cell, electrolysis occurs [1]. For an alkaline electrolyte, on the side of the cathode, there is a reduction of water (Equation (1)), forming hydrogen and hydroxide ions; and on the anode side, hydroxide ions (Equation (2)) oxidize, forming water and oxygen:
Cathode (reduction):
2 H 2 O   ( l ) + 2 e H 2 ( g ) + 2 O H ( a q )
Anode (oxidation):
2 O H ( a q ) 1 2 O 2 ( g ) + H 2 O ( l ) + 2 e
The resulting electrons are attracted by the positive pole of the power source, and new electrons are injected into the cell by the negative pole, allowing the reduction of more H2O molecules. For an acidic electrolyte, the reactions that occur are different: on the anode side, water oxidizes (Equation (3)), and on the side of the cathode, H+ protons reduce (Equation (4)):
Anode (oxidation):
H 2 O   ( l ) 2 H + ( g ) + 1 2 O 2 ( g ) + 2 e  
Cathode (reduction):
2 H + ( g ) + 2 e H 2 ( g )
For both cases, the global reaction is:
H 2 O ( l ) H 2 ( g ) + 1 2 O 2 ( g )
Equations (1) and (4) are called hydrogen evolution reactions (HER), and Equations (2) and (3) oxygen evolution reactions (OER) [6].
Through Equations (3) and (4), it is possible to determine the equilibrium potential of an electrolytic cell at standard conditions. The equilibrium potential is associated with a microscopic dynamic balance between species, which occurs when no current flows through the system. This potential can be calculated from the species’ standard reduction potentials, U o [2].
U o H + / H 2 = 0.00   V
U o H + / H 2 O = + 1.23   V
U o c e l = U o r e d ,   c a t h o d e U o r e d , a n o d e = 0.00 ( + 1.23 ) = 1.23   V   vs .   N H E
The negative sign implies that the reactions in question do not occur in a spontaneous manner, i.e., it is necessary to apply a voltage of 1.23 V for the reaction to occur. In practice, the voltage will have to be higher than this value as there are losses, and also due to the need to overcome the activation potentials. A similar balance can also be done with Equations (1) and (2), obtaining the same equilibrium potential.
In an energy system involving production, storage, conversion and energy use in remote communities, electrolysis can play an important role. When there is abundant renewable energy, extra energy can be stored in the form of hydrogen through electrolysis. Stored hydrogen can then be used in fuel cells to generate electricity or can be used as a fuel gas for domestic heating applications or even in industry, e.g., welding. Hydrogen produced by renewable energy has the advantage of mobility, as hydrogen production and conversion equipment can be transported to remote areas. Although it has the advantages of availability, flexibility and high purity, for the generalization of its applications, hydrogen production through water electrolysis needs to be optimized in terms of energy efficiency, safety, durability, operability and portability and, above all, reduction in installation and operation costs [4].
The electrolytic cell under study is assembled with a dry cell, shown in Figure 1. Its build, with stainless steel plates as electrodes not fully submerged in the aqueous solution (as it would be the case in a wet cell), separated from each other by sealing rings, allow the flow of water only between the plates [7].
Compared to wet cells, dry cells have some advantages:
  • in dry cells, the electrolyte is stored in an electrolytic container, which also acts as a bubbler, and the electrolyte enters the cell by gravity;
  • dry cells typically require lower electrical current, compared to wet cells, for the production of the same amount of gas, since the gap between the electrodes can be smaller in dry cells than in wet cells;
  • unlike wet cells, dry cells do not require rare metals such as platinum, which reduces their production costs;
  • the maintenance costs of dry cells are also lower [9].
The working principle of dry cells is very similar to wet cells since electrolysis occurs by applying a certain voltage on the electrodes. However, unlike wet cells, where it is possible to fully separate hydrogen from oxygen, dry cells obtain a more or less complex mixture of both gases, called oxyhydrogen (HHO). Oxyhydrogen gas is formed from the principle of water electrolysis. In an alkaline solution, the redox reactions are the same as those previously presented for the wet cell. Oxyhydrogen gas is then formed by the mixture of oxygen and hydrogen (in practical terms, there is as well the presence of water vapor evaporated during the electrolysis as well as residual amounts of other species):
2 H 2 ( g ) + O 2 ( g ) 2 H H O ( g )
For the combustion:
H H O ( g ) + i g n i t i o n H 2 O ( l ) + e n e r g y .  
Nowadays, there are vehicles that run on hydrogen, using it as an additive, which decreases conventional fuel consumption and increases engine efficiency. The use of hydrogen in internal combustion engines has several advantages due to its properties, such as: its wide range of flammability; its low ignition energy; its high self-ignition temperature; its high flame velocity in stoichiometric proportions; its high diffusivity; its very low density; and its small quenching distance [10]. Taking into account the thermal efficiency of an internal combustion engine that operates through an optimal Otto cycle,
η = 1 1 r γ 1 ,
it turns out that if the efficiency is all the higher, the higher the compression ratio,
r = V 1 V 2
where V 1 is the air volume at the bottom dead center (maximum volume) and V 2 is the air volume at the top dead center (minimum volume).
The compression ratio depends on the fuel’s resistance to knock. Compared to gasoline, hydrogen has a higher resistance, so its compression ratio is also higher [10]. On the other hand, efficiency also depends on γ, the ratio between specific heats: γ = c p / c v , which, in turn, depends on the molecular constitution of the fuel. Hydrogen has a much simpler molecular structure, γ ≈ 1.4, more than gasoline at γ ≈ 1.1 [10]. In this way, hydrogen combustion engines can be more efficient than petrol engines [1].
For the exclusive case of oxyhydrogen gas, in the article by Manu et al. [9], results obtained by using this gas as an auxiliary fuel in a diesel engine are presented. The oxyhydrogen gas, produced with a dry cell, before entering the intake system, went through a silica-gel absorber to remove traces of water vapor, which affect engine performance. During the tests, different amounts of oxyhydrogen were used. The main results were a better combustion, resulting in a higher thermal efficiency of the engine; a reduction in fuel consumption, since a part of the conventional fuel has been replaced by oxyhydrogen and due to the better combustion; a higher indicated power with the increase of oxyhydrogen; lower CO2 and CO emissions, due to the decreasing diesel consumption and higher efficiency.
In addition to all the above, in [8], there are some indicative values of some properties of oxyhydrogen gas, relevant for combustion. In order to compare these properties with those of other fuels, hydrogen, gasoline, diesel, methane and propane were selected. It is important to note that, in the case of gasoline and diesel, as they are mixtures of various hydrocarbons whose proportions vary with the manufacturer, merely indicative values are shown, so that, for the adiabatic flame temperature, they approached the octane and the dodecane, respectively. These values are presented in Table 1.
In terms of lower calorific value, oxyhydrogen gas is much more energetic than gasoline, diesel, methane and propane, so its efficiency in combustion processes will be much higher. In relation to hydrogen, its calorific value is slightly higher, at approximately 1 unit. Analyzing several tables of combustion properties of these elements and compounds, the values of the properties are not always the same for the same fuel because the values determined depend on the measurement conditions and reference values. Thus, it is thought that the calorific value of oxyhydrogen gas may be equal to that of H2, since the difference is only ~1 kJ/g, which suggests that this gas will be a simple gas mixture and H2 and O2. Thus, the only difference when using oxyhydrogen or H2 gas lies in the fact that the oxyhydrogen already possesses the O2 needed for the combustion of H2, whereas when burning pure H2 it is necessary to supply the O2 through an external source, such as the atmospheric air.

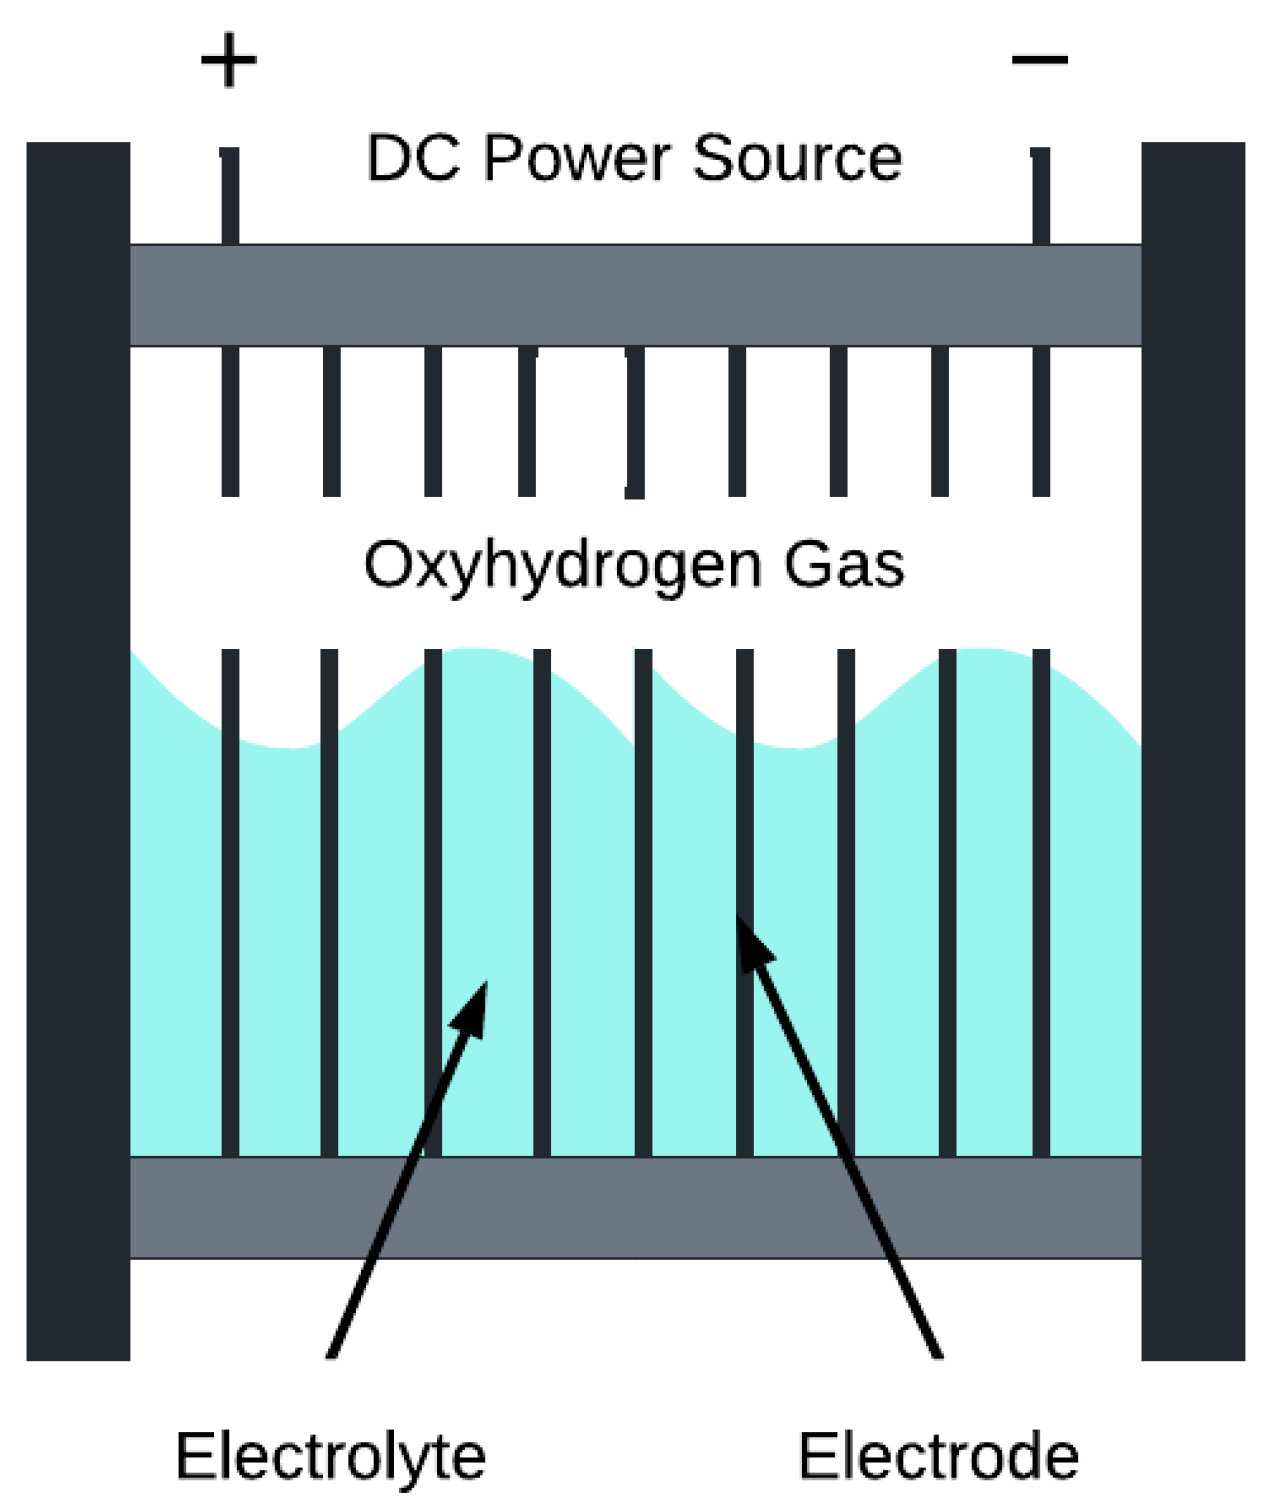
2. Experimental Prototype: Components, Assembly and Operation Principles

In this section, the equipment developed by the manufacturer “Wasser Statt Sprit” [16] is presented, as to produce oxyhydrogen that will be characterized chemically and electrically in Section 3. Its goal is to produce oxyhydrogen gas through a dry cell system, which is burnt at the exit of an arrestor.

2.1. Components and Assembly

The prototype consists of four fundamental elements: (a) the dry cell system, with distilled water with dissolved KOH; (b) the reservoir with distilled water; (c) the bubbler with distilled water, which acts as a safety element; and (d) the arrestor. These elements are connected to each other by hoses (e). The dry cell is assembled with two PVC base plates, with 7 stainless steel plates (h) as electrodes, where 2 of them have poles (f) for the power source to be connected, and 8 sealing rings (g). All the components are shown in Figure 2, and in Figure 3, the complete operating system is shown.
The construction of the prototype was based on the recommendations presented by the manufacturer’s manual [16]. The components required for the construction prototype consist of: acrylic, PVC (polyvinyl chloride) or PE (polyethylene) plates for the dry cell, bubbler and reservoir bases (PVC was used for the studied prototype); stainless steel plates for the dry cell electrodes; acrylic, plexiglas, PVC or PE tubes for bubbler and reservoir (acrylic was used for the studied prototype); EPDM (ethylene propylene diene monomer) rubber seals; hose connections and flexible hoses; copper tube, flame nozzle and female welding bearings for the arrestor; and finally, threaded rods, nuts and washers for fastening.
In Appendix A, the assembly process of the equipment is described. After the assembling of each component, they are connected through the hoses, as shown in Figure 2 and Figure 3. The dimensions of some of the components, namely the bases, acrylic tubes, stainless steel plates and seals are found in the technical drawings in Supplementary Material, designed with AutoCAD® Mechanical 2019.
The reservoir is connected to the dry cell at the bottom and to the bubbler at the top; the bubbler is then connected to the arrestor. The dry cell is supported on the lower corner with the hoses connected to the top corner, which prevents the accumulation of the gas produced, and thus the occurrence of explosions, in addition to increasing efficiency.
In order to produce oxyhydrogen gas with this dry cell, it is necessary to connect an electrical power source. The manufacture recommends that the maximum operating voltage must be 60 V [16], which is a security limit to prevent electric hazards. In relation to the current, the manufacturer [16] recommends: (i) 5 A for experiments with low production rate of gas, such as heating, welding, engine additive; (ii) 5 to 15 A for start-up and (iii) and a maximum limit of 30 A, as water may start to boil. The dry cell temperature should not exceed 45–50 °C. The use of KOH concentrations between 0.5 and 3.0% (w/w) is also suggested.
Subsequently, it is necessary to feed the dry cell with distilled water with dissolved KOH. The solution is introduced into the dry cell until it reaches at most the top hole of the stainless-steel plates, where the tube connected to the reservoir is located, corresponding to about 150 mL for the prototype under study. This mixture is used only in the first dry cell feed, and then only distilled water is replaced in the reservoir, since KOH is practically not consumed during the reactions. The dry cell is fed by the action of gravity, with distilled water from the reservoir, which should be almost filled. The bubbler, in turn, contains 3/4 of its volume with distilled water. It is advisable to use distilled water because it does not contain impurities that may soil the dry cell, and thus decrease its efficiency. Once all this is done, the power supply is connected to the dry cell, and oxyhydrogen gas production begins.
With the presence of a voltage applied to the dry cell plates, the chemical reaction that leads to oxyhydrogen gas production occurs. Due to the low density of this gas, it accumulates at the top of the dry cell, from which it shall pass to the reservoir. Meanwhile, at the reservoir, the gas bubbles in the liquid water rise and the gas is forced to pass to the bubbler. The bubbler acts as a safety device in case there is recoil of the flame into the hose and so into the system. In there, the gas is injected to the bottom, rising again in the form of bubbles, moving through the hose until it reaches the arrestor, where it is burned. All these steps occur simultaneously [16].
For the tests, a DELTA ELEKTRONIKA DC power source was used, model SM6020, with a voltage range up to 60 V and a current range up to 20 A (shown in Figure 4).

2.2. Operation Principles

The total voltage to be applied to the dry cell depends on the number of stainless-steel plates, i.e., cells, and the voltage required for water electrolysis to occur. In an alkaline solution, the voltage required for electrolysis can be determined through thermodynamics by the following Equation [3]:
Δ r G = Δ r H T Δ r S .
where Δ r G is the Gibbs free energy of the reaction, Δ r H the enthalpy of the reaction, T the temperature, in Kelvin, at which the reaction occurs and Δ r S the entropy variation.
Δ r H = n   Δ ° H f ( p r o d u c t s ) n   Δ ° H f ( r e a g e n t s ) ,  
with Δ ° H f the formation enthalpy of the species and n its moles.
Δ r S = n   Δ ° S ( p r o d u c t s ) n   Δ ° S ( r e a g e n t s ) .
Gibbs free energy is equivalent to the minimum work required for dissociation. In the case of the water electrolysis reaction, H 2 O H 2 + 1 2 O 2 , the following value is the enthalpy of the reaction at 25 °C, taking into account the standard formation enthalpy and entropy values in the table in [17]:
Δ r H = 1 × 0 ( kJ mol ) + 0.5 × 0 ( kJ mol ) 1 × [ 285.86 ( kJ mol ) ] = 285.86 kJ mol .
Δ r S = 1 × 130.59 × 10 3 ( kJ mol   K ) + 0.5 × 205.03 × 10 3 ( kJ mol   K ) 1 × 69.91 × 10 3 ( kJ mol   K ) = 1.632 × 10 1 kJ mol   K .
Therefore:
Δ r G = Δ r H T Δ r S = 285.86 ( kJ mol ) ( 273.15 + 25 ) ( K ) × 1.632 × 10 1 ( kJ mol   K ) = 237.203 kJ mol .
According to [3], the reversible voltage to be applied is given by Equation (17), where z is the number of electrons moved or exchanged in the reaction, in this case being equal to 2 (see redox reaction in the introduction) and F, is the Faraday’s constant of 96,485 C mol−1:
U r e v = Δ r G z F = 237   203   ( J   mol 1 ) 2 × 96   485   ( C   mol 1 ) = 1.229   V
To produce 1 mole of hydrogen, is thus necessary a minimum voltage of 1.23 V (Equation (6)) at 25 °C. However, the voltage to be applied will have to be greater given the irreversibilities that occur in the reaction. Thus, when applying, for example, a voltage of 5 V, between two plates of a single cell, only 1.23 V will be used for the electrolysis reaction, whereas the remaining energy is converted into heat. This equates to an efficiency of only ~ 25 % (see Equation (23) below). Moreover, to increase oxyhydrogen production, dry cells have several parallel plates, which are electrically equivalent to several two plates cells in a series. Moreover, according to Sterner et al. [18], the reversible voltage is temperature-dependent. The absolute value of the reversible voltage varies with temperature by a factor of −0.85 mV/K in a two-phase system; thus it decreases with increasing temperature. Consequently, higher electrolysis temperatures lead to lower reversible voltages, facilitating the process.
Additionally, it is possible to calculate the thermoneutral voltage, which is the voltage drop through an electrochemical cell to conduct the cell reaction and to provide the heat necessary to maintain a constant temperature. This means that the necessary heat equals the heat produced by the Joule effect [6]. Considering the standard formation enthalpy calculated in Equation (14), the thermoneutral voltage to produce 1 mole of hydrogen will be:
U t h = Δ r H z F = 285   860   ( J   mol 1 ) 2 × 96   485   ( C   mol 1 ) = 1.481   V
The two voltages considered here are related only for the electrolysis of water, therefore, a higher voltage must be considered due to electrolyte resistance and overvoltages in the electrodes.
The total voltage in the cell corresponds to the sum of the reversible voltage with the overvoltages associated with the ohmic losses in the cell elements U o h m , the activation overvoltage, U a c t , and the overvoltage of concentration, U c o n [19].
U c e l = U r e v + U o h m + U a c t + U c o n
All terms have to be positive, that is, absolute values are added.
U o h m is associated to ohmic losses, which implies heating of the electrolyzing cell by the Joule effect. These losses occur during electrolysis, for example, with the formation of gas bubbles in the vicinity of the electrodes and the opposition of the ions flow being proportional to the applied current [19]. The predominant ohmic losses are associated with ionic losses caused by the electrolyte. In alkaline electrolysis, ionic resistance, r i   (Ω m2), is equal to the ratio between the width of the space filled with electrolyte, δ e l (m), and the ionic conductivity of the electrolyte, σ e l (S/m), which depends on the operating temperature, T (°C) and the molarity, M (mol/L) [19].
r i = δ e l σ e l ( T , M ) .    
The ionic conductivity corresponds to the electrical conductivity of the electrolyte, which, in turn, results from the presence of ions in the aqueous environment, which are displaced under the action of an electric field, thus allowing the conduction of electric current. Ionic conductivity depends on the electrolyte concentration, or its molarity, and temperature, since the greater the amount of electrolyte that exists, the more ions exist to drive the current; at the same time, the higher the temperature, the greater the ion mobility. In the study by Gilliam et al. [20], experimental values are determined for the ionic conductivity of KOH, for different temperatures and molarities. Given the good correspondence of empirical values and the values of other scientific investigations, it was chosen to refer to values provided in the mentioned article [20]. For the prototype under study, the spacing between the stainless-steel plates, i.e., the electrolyte thickness is 1.0 mm, whereas r i   is in Ω m2, and to convert into Ω, r i is divided by the area through which the electrolyte circulates, which, in the case of the prototype, corresponds to the internal electrode surface area less the part of the plate that is not in contact with the electrolyte–electrolyte level immediately under the top hole of the steel plates: A ≅ 191.908 cm2.
Furthermore, electrodes also have a certain resistivity, r e , which, in the case of stainless-steel, is 6.9 × 10 7     m , at 20 °C [21]. Taking into account the dimensions of the stainless-steel plates, with 16 × 16   cm 2 of surface area and 1.0 mm thickness, and the temperature coefficient for the resistivity of steel, of α = 9.4 × 10 4     K 1 [21], there is a resistance of the electrode at 25 °C, of:
R e = r e [ 1 + α ( 25 20 ) ] × L A = 6.9 × 10 7 ( m )   [ 1 + 9.4 × 10 4   ( K 1 ) ( 25 20 ) ( K ) ] × 1.0 × 10 3 ( m ) 0.0191908 ( m 2 ) = 3.612 × 10 8    
Because there are two electrodes, the value of R e will have to be multiplied by 2 to calculate the cell voltage. The difference in potential associated with these resistances follows Ohm’s law,
U o h m = I ( R i + 2 R e ) .  
The activation voltage, U a c t , is the overvoltage in the electrodes caused by the kinetics of the ions [19]. Even when the required reversible voltage is provided, the electrode reactions are null or slow. The charge between chemical species and electrodes must be exceeded, which depends on the catalytic properties of electrode materials. U a c t is influenced by the operating temperature, electrode material, electrolyte type and concentration and the current density applied.
The last term, the concentration voltage, U c o n , is caused by mass transportation processes [19]. Transport limitations reduce the reagent concentration of the products at the interface between the electrode and the electrolyte. Typically, the concentration overvoltage is much lower than U o h m   and U a c t [19].
In Figure 5, it is represented by an example at 75 °C and 30 bar, excluding concentration overvoltage (adapted from [19]).
Analyzing Figure 5, for small current densities, ohmic overpotential is negligible. This means that ohmic losses are not significant for small currents applied, increasing the efficiency of the process. For higher current densities, ohmic losses will increase (Equation (22)) and the contribution of bubble production to the electrical resistance will also increase (for higher currents Joule effect will heat up the electrolyte leading to an increase in bubble formation due to evaporation at the electrodes’ surfaces). Activation and ohmic overpotentials tend to increase linearly with current densities higher than ~0.1 A/cm2. Activation overpotential tends to a constant value for higher current density, suggesting that, from a certain current density, activation potential may not be influenced by a current as much as it is for smaller currents. In this way, the overall cell voltage increases with increasing current density, as a consequence from the increasing overpotentials.
One way to characterize the efficiency of electrolyte cells is through the quotient between the reversible voltage and the actual cell voltage applied:
η U = U r e v U c e l × 100   % .  
Considering the previous analysis of the cell voltage evolution with current density, if the overall cell voltage increases with current density, then cell efficiency will decrease. The lower efficiency is due to a higher need of energy to overcome the overpotentials as well as higher ohmic losses, so less input energy will be used for electrolysis.

3. Results

3.1. Experimental Preparation and Procedure

Experimental tests have been performed with two different electrolyte concentrations: 3 and 20% (w/w) of KOH, in order to cover the range suggested by the manufacturer [16] and the scientific literature [3], where typically wet cells are operated at 20% (w/w) of KOH. In order to reach the solution of 3% (w/w), 7.053 g of KOH with 85% purity, was dissolved in 200 mL of distilled water, whereas for 20% (w/w), 47.065 g of KOH was dissolved in the same volume of water. Of these 200 mL, only 150 mL were introduced into the dry cell since this is more or less the volume inside the dry cell. After filling the dry cell, the equipment has been connected to the voltage source and it was left to operate for about 20 to 30 min to start-up.

3.2. Molecular Composition of the Gas

Initially, the tests of the molecular composition of the gas have been carried out, which, for the 3% (w/w) of KOH lasted for about 2 h and for the 20% (w/w) about 1 h (due to some experimental limitations). During the testing, it was necessary to continuously monitor the dry cell temperature, measured by a thermocouple positioned to one of the bases. When the temperature exceeded 38 °C, the equipment was turned off and the sides of the dry cell cooled with compressed air to avoid damage to the inside sealings.
The molecular composition of the generated gas has been measured by the measurement equipment INFICON Micro GC Fusion, Version 1.8.1 [22], shown in Figure 6. This equipment performs micro gas chromatograms with good sensitivity and repeatability, being equipped with microelectromechanical systems of thermal conductivity microdetector, offering a limit detection of 1 ppm. The chemical elements detected in this test have different thermal conductivities [22], and, therefore, its presence has been determined by doing a sweep of thermal conductivities. To determine the composition of the gas with greater precision, five to six analyses have been performed to the generated gas (e.g., injection into the equipment), for each set of electrolyte concentration and current applied. The gas has been analyzed according to its molar composition, in %, equivalent to the molar fraction of H2 and O2. The results for each case are presented in the following tables—Table 2, Table 3, Table 4, Table 5, Table 6 and Table 7.
It is important to note that, for the lowest amperages, there are cases where the sum of the percentages of H2 and O2 is slightly higher than 100%. This occurs for very small quantities of produced H2 and O2 and is due to the presence of atmospheric nitrogen (atmospheric air contains about 70% nitrogen) entering the equipment, which has not been considered within the boundary conditions (e.g., limited to the equipment), although measured by the equipment. Thus, it should be noted that the relevance of the presence of nitrogen is higher in measurements made with lower amperages when the dry cell produces a smaller amount of H2 and O2. As more oxyhydrogen gas is produced, there will be a greater amount of H2 and O2, so the concentration of residual nitrogen becomes irrelevant. Additionally, the first and last tests, for both concentrations, were done with the same current, but at different temperatures (due to heating during operation). It is possible to verify that with the increase in temperature, for the same current, the voltage is lower, a result of the reduction of the reversible voltage as well as the increase in the ionic conductivity of the electrolyte-water molecules have greater kinetic energy which facilitates their dissociation.
From the data obtained, it was verified that the relative concentrations of the two gases tend to stabilize, around 67% H2 and 28% O2, which is close to the reaction stoichiometry (Equation (5)) for hydrogen, but not for oxygen. Moreover, the first test, injecting a current of 1 and 2 A into the dry cell for concentrations 3% (w/w) and 20% (w/w), respectively, appears to show a percentage of hydrogen around 70% and oxygen around 30%. This could mean a deviation from reaction stoichiometry, however, after different currents were tested, in which all of them brought percentages close to hydrogen stoichiometry and a deficit for oxygen, the tests with 1 and 2 A, respectively, for 3 and 20% (w/w), were retried and the percentage of hydrogen approached stoichiometry, 67%, but oxygen fell to 28%, i.e., lower than the 33% expected by stoichiometry by about 5%.
This difference in percentage should be in part a consequence of the presence of water vapor. Moreover, it is to be expected that the increase in temperature, caused by the Joule effect due to the passage of current in the dry cell, will increase the amount of water vapor mixed with H2 and O2. The amount of water vapor would therefore tend to increase with the increase in the operation time of the equipment. This is consistent with Table 4 and Table 7, in which the percentage of water is estimated from the deficit of the sum of H2 and O2 percentages, as it tends to increase for increasing temperature. Although the equipment used to make the chromatograms did not allow for measuring the concentration of water vapor, the presence of it was visible at the outlet of the equipment hose as well as along it, where small drops of water were formed. Thus, it is reasonable to assume that oxyhydrogen gas, in addition to being composed of H2 and O2, will also have some percentage in water vapor, especially for higher operating temperatures. It is also important to note that the measured temperature corresponds to the temperature at the base of the dry cell, and not inside, which will certainly be higher. It is thought that water vapor generation occurs at the electrodes, since these should have higher temperatures than the other dry cell components, caused by the current flow.
Another reason for the lower oxygen concentration percentages, as compared with stoichiometry, could be oxygen dissolution in the water in the reservoir and bubbler. The reaction inside the dry cell could produce hydrogen and oxygen in stoichiometric proportions, yet, some of the produced oxygen may be diluted in the distilled water in the reservoir and bubbler, which reduces the measured oxygen concentration at the output of the prototype. Such dissolution will increase with the increase in temperature, which explains the difference in percentages between tests 1 and 5 for both electrolyte concentrations. Both tests have similar applied power, thus similar hydrogen, and oxygen productions, but a lower percentage of oxygen in test 5, as a result of more oxygen dissolution for higher temperatures.

3.3. Efficiency of the Dry Cell

Following the molecular composition measurements for different KOH concentrations, for the efficiency analysis, the current intensity has been changed from 1 to 12 A, in a step of 1 A and recording the corresponding voltage. As it was noted from previous experiments, the test time was different for both KOH concentrations, influencing the dry cell heating. Hence, at these measurements, initial measurements of the dry cell temperatures have been recorded for each concentration. Figure 7 allows for analyzing the evolution of the voltage per cell (6 cells in total) as a function of the current density for the two electrolyte concentrations (internal electrode surface area less the part of the plate that is not in contact with the electrolyte, see above).
Through Figure 7, as expected from Figure 5, the increase in current corresponds to an increase in the cell voltage following a logarithmic tendence up to approximately 0.065 A/cm2, which is the limit of our experiment, and below the linear tendence, resulting from a dominance of Ohmic losses, for current densities above approximately 0.1 A/cm2. Taking into account the electrolyte concentration, the lower it is, which implies a lower ionic conductivity of the solution, the greater the applied voltage. This means that less electrolyte implies higher ohmic resistance of the electrolyte.
It is important to note that the two measurements sets have been performed with different temperatures of the dry cell. Different temperatures will lead to different resistances for the electrodes and electrolyte, so it is not possible to accurately compare the two cases tested. The higher the temperature, the higher the electrical resistance of the electrodes (Equation (21)), and the higher the ionic conductivity of the solution, resulting in a lower ionic resistance, according to the values in [20]. On the other hand, the activation overvoltage in the electrodes also depends on temperature, being, at the outset, lower for higher temperatures since the species have a higher kinetic energy. The same applies to reversible voltage. Thus, it is expected that, for higher temperatures, the applied voltage will be lower. The test for 20% (w/w) was performed at a temperature of about 6 °C higher than for the test with 3% (w/w) of KOH with lower voltages. In this way, it is difficult to conclude if electrolyte concentration or cell temperature is dominant in influencing the applied cell voltage.
For the efficiency study, the theoretical efficiency of the dry cell has been calculated, according to Equation (23), being U c e l equal to the voltage applied by the power source divided by six cells. The reversible voltage U r e v was calculated for the average operating temperature of each experiment considering the temperature dependency factor mentioned in [18]:
U r e v = 1.23 0.85 1000 ( V K ) × ( T 25 ) ( K ) .  
Results are presented in Table 8 and Table 9 and the representation of efficiency as a function of the input power is displayed in Figure 8.
Efficiencies are below η U   ~   69.8 ± 0.6 % and are higher for lower power input, as expected, because for lower currents, ohmic losses are less pronounced. It can be observed that as the power increases, theoretical efficiency decreases considerably. Focusing on the electrolyte concentration, higher concentrations allow for higher efficiencies since the solution has a higher conductivity, facilitates electrolysis and reduces losses. Nevertheless, efficiencies for both electrolyte concentrations tend to approach approximately the same value of η U   ~   50% for higher powers, above 25 W per cell. It should be mentioned again that both tests were made with different cell temperatures, which should be taken into account when comparing the results for both electrolyte concentrations.

4. Discussion

During the assembly and operation of the equipment, some ideas were formulated that could improve and facilitate the operation of the studied equipment. Some of these recommendations are:
  • For an easier filling of the dry cell, reservoir and bubbler, a hole could be inserted at the top of the bubbler and reservoir, so that the air inside can escape during filling. This is because during the filling of these reservoirs, a funnel placed in the upper holes in the bases was used, and sometimes distilled water overflowed. This additional hole must be closed during the operation of the equipment, with, for example, a rubber stopper. Instead of a hole, a T-bond could be used, where one side would serve to fix the tube and the other to let the air escape during filling, and then closed with a lid;
  • To remove the electrolyte from the inside of the dry cell without the need to disassemble it, which may, over time, lead to damage to the seals and, mainly, the threaded rods; therefore, a hole could be inserted in the lower corner of the dry cell bases and all stainless steel plates, the same being closed, during filling and operation, with a rubber stopper that would pass through the different cells so that they remain separate;
  • To ensure that there is no potential difference between the stainless-steel plates at the ends, with the poles for the power source, and the adjacent dry cell bases, it would be best to use a rectangular, blunt EPDM seal on the inside, as suggested by the manufacturer’s manual. This would also avoid unnecessary electrolyte consumption;
  • To control the temperature inside the dry cell, which should not exceed 50 °C, as it may damage the EPDM seals, a thermocouple with its temperature indicator could be put inside. Alternatively, a closed circuit with the water from the reservoir and the bubbler circulating around the dry cell for cooling it could be built. Or, use heat-dissipating materials (with good thermal conductivity) that are thermally resistant;
  • During the tests, some hydrogen leaks were found in the connections and along the tubes, in the order of the parts per million (ppm). Although relatively small, they reduce the efficiency of the equipment, in addition to decrease its safety. As a solution, pipes less permeable to this gas should be used.

5. Conclusions

The tested dry cell seems to produce H2 and O2 in proportions different than expected by the stoichiometry of the water dissociation reaction, especially for O2, where lower concentrations were obtained. Nevertheless, oxyhydrogen gas seems to be mainly a mixture of these two gases. One cause that can explain this deviation is the water vapor generation, which increases with the power applied to the dry cell, since higher currents lead to a more pronounced Joule effect. The Joule effect increases the cell’s temperature and leads to water vapor generation within the cell and to bubbles formation. Water vapor was in fact observed along the hoses and even at the output hose. Water vapor generation affects the dry cell’s efficiency since some energy is used for evaporation instead of producing oxyhydrogen gas. Another possibility is oxygen dissolution in the reservoir and bubbler, which should also increase with temperature.
The cell’s efficiency is also influenced by electrolyte concentration in a way that efficiency is higher when more electrolyte is diluted. Electrolyte is used to increase the solution’s conductivity, and higher conductivities allow for more efficient oxyhydrogen production, since current flows more easily.
Another important factor is temperature, since it influences oxyhydrogen production and efficiency in several ways. According to the results obtained through the tests of the composition of oxyhydrogen gas, it is thought that with the increase in temperature more bubbles will form and more water vapor will be produced, which leads to a pronounced decrease in efficiency. On the other side, higher temperatures will improve the ions’ mobility and may decrease activation overvoltages so that the cell’s efficiency will increase. Moreover, to understand temperature’s role, new tests should be carried out at the same operating temperature but different electrolyte concentrations, to understand the influence of electrolyte concentration on cell efficiency; and with same electrolyte concentrations and different temperatures to understand temperature’s influence.
Finally, in future work, it would be interesting to measure the Faradaic efficiency of the prototype by measuring all the electrolysis products, and this would be done with the use of more advanced equipment, such as a gas-chromatography mass-spectrometer, as was used in [23].

Supplementary Materials

The following supporting information can be downloaded at: https://www.mdpi.com/article/10.3390/designs6050079/s1, Figure S1: The drawings of the prototype parts.

Author Contributions

L.B. and H.G.S. performed the literature review; L.B., H.G.S., P.L.C. and M.I performed the experimental work; L.B. wrote the paper; H.G.S., P.L.C. and M.I. revised the paper. All authors have read and agreed to the published version of the manuscript.

Funding

Hugo G. Silva is grateful to the Physics Department of the University of Évora for supporting his work and to LAETA with funding project UIDB/50022/2020.

Institutional Review Board Statement

Not applicable.

Informed Consent Statement

Not applicable.

Data Availability Statement

Data generated in this study is presented in the tables above.

Acknowledgments

The authors are thankful to Luís Croft Filipe and Ruben A. Pais from ISQ-Laboratory of “Massa-Volume-Química” for the support in performing the measurements discussed in this work. Hugo G. Silva is grateful to Sergio Aranha, from the Physics Department of the University of Évora, for providing technical assistance to the experimental work.

Conflicts of Interest

The authors declare no conflict of interest. The funders had no role in the design of the study; in the collection, analyses or interpretation of data; in the writing of the manuscript, or in the decision to publish the results.

Appendix A

Firstly, all acrylic plates have to be drilled as indicated in the mechanical drawings, with holes 1.5 mm smaller than the diameter of the thread concerned, which are then threaded. The holes in the bases for the threaded rods, which are the holes near the ends, can or are not threaded. Finally, all threaded components that are associated with pipe binding elements, i.e., where is gas flow, must be insulated with Teflon tape.
Dry cell: First, all stainless-steel plates must be cleaned with acetone to remove possible grease marks due to handling. Acetone is a good solution because it leaves no trace and it evaporates quickly. After washing, the plates should be handled only using clean gloves. After drilling, the base plates must be tempered due to the existence of micro cracks that may have occurred during drilling, and subjected to 70 °C in an oven for a few hours to close the microcracks. The heating time depends on the thickness of the material, corresponding, in hours, to one third of the thickness of the plates in mm, i.e., to 20 mm for about 6 h, and 25 mm for about 8 h, etc.
To mount the dry cell, the threaded rods are placed in the outer holes in one of the base plates, and are fixed by means of nuts and washers (Figure A1a). It is advisable to place small plastic tubes on the sticks, as electrical insulation, to avoid short circuits, since a current is applied to the dry cell (Figure A1b). Then, an EPDM rubber seal is placed alternately followed by a stainless-steel plate, taking care to match the holes of all the plates (through which the water circulates and the oxyhydrogen gas is released). The stainless steel plates with poles must be at the ends, first and last, and separated from the bases by a seal (Figure A1c,d). Finally, the other base plate is placed and fixed with the nuts and washers, and the hose is connected in the threaded holes (Figure A1e,f).
Figure A1. Dry cell assembly.
Designs 06 00079 g0a1
Reservoir: EPDM rubber was used for the reservoir as a seal, placed between the bases and the acrylic tube. This seal can be o-ring shaped or with an alternative shape. Seals must also have holes for hose connections. The reservoir must have connections for two pipes connected to the dry cell, for the outlet of the gas produced that goes into the bubbler, and for fixing the pressure gauge. This can be done in a number of ways, such as using a T-connection, both on the base and on the cover.
The reservoir is mounted as follows: the threaded rods are fixed in the base plate with nuts and washers (Figure A2a); one of the EPDM seals is placed, with the acrylic tube on top (Figure A2b,c); the other EPDM seal is placed and with the other base plate, fixing everything again with the nuts; finally, the hose connections, the pressure gauge and the safety valve are connected (Figure A2d).
Figure A2. Reservoir assembly.
Designs 06 00079 g0a2
Bubbler: The bubbler is mounted in the same way as the reservoir, and it is necessary that the oxyhydrogen gas produced enters the bubbler from the bottom (inlet), rising in the form of bubbles, to be able to exit through the top (outlet) to the arrestor. The goal is that the acrylic tube, that is, the entire bubbler, works as a siphon.
Figure A3. The bubbler.
Designs 06 00079 g0a3
Arrestor: The arrestor is a very well-insulated copper tube with fine steel wool, to stay airtight. A copper tube is cut to the desired length of 10 cm and then the ends are burned to eliminate most roughness. Two female threaded adapters are opened and welded to the ends of the copper tube. The set is then filled with about 50 g of very fine steel wool (Figure A4a). Reductions are connected to the adapter on both sides (Figure A4b), and, at one end, the hose connection is placed for the pipe and at the other, the flame nozzle is screwed through the nozzle door (Figure A4c).
Figure A4. Flame-breaker assembly.
Designs 06 00079 g0a4

References

  1. Ghosh, T.K.; Mark, A. Prelas, Energy Resources and Systems, Volume 2: Renewable Resources; Springer: Dordrecht, The Netherlands, 2011. [Google Scholar]
  2. Chang, R.; Overby, J. Chemistry; McGraw-Hill Education: New York, NY, USA, 2019; ISBN 1-260-08531-7. [Google Scholar]
  3. Brauns, J.; Turek, T. Alkaline Water Electrolysis Powered by Renewable Energy: A Review. Processes 2020, 8, 248. [Google Scholar] [CrossRef]
  4. Santos, D.M.; Sequeira, C.A.; Figueiredo, J.L. Hydrogen Production by Alkaline Water Electrolysis. Química Nova 2013, 36, 1176–1193. [Google Scholar] [CrossRef]
  5. Ezzahra, C.F.; Kaddami, M.; Mikou, M. Effect of Operating Parameters on Hydrogen Production by Electrolysis of Water. Int. J. Hydrogen Energy 2017, 42, 25550–25557. [Google Scholar]
  6. Godula-Jopek, A. Hydrogen Production: By Electrolysis; John Wiley & Sons: Hoboken, NJ, USA, 2015; ISBN 3-527-67652-X. [Google Scholar]
  7. Leludak, F.T.; Haus, T.L. Célula de Hidrogênio: Estudo e Construção de Uma Célula Eletrolítica Para Produção de Hidrogênio Gasoso. Cad. PAIC 2013, 14, 383–397, (In Brazilian Portuguese). [Google Scholar]
  8. Choodum, N. A Study of the Optimized Conditions for a Closed-Loop HHO Production System Using A/C Power Supply. Ph.D. Thesis, Prince of Songkla University, Hat Yai, Thailand, 2017. [Google Scholar]
  9. Manu, P.V.; Sunil, A.; Jayaraj, S. Experimental Investigation Using an On-Board Dry Cell Electrolyzer in a CI Engine Working on Dual Fuel Mode. Energy Procedia 2016, 90, 209–216. [Google Scholar] [CrossRef]
  10. Hydrogen Fuel Cell Engines and Related Technologies, Module 3: Hydrogen Use In Internal Combustion Engines, College of the Desert. 2001. Available online: http://www.tuks.nl/pdf/Reference_Material/ICE_and_Water_Injection/College%20of%20the%20Destert%20-%20Hydrogen%20Fuel%20Cell%20Engines%20and%20Related%20Technologies-%202001.pdf (accessed on 16 July 2022).
  11. Hydrogen Fuel Cell Engines and Related Technologies, Module 1: Hydrogen Properties, College of the Desert. 2001. Available online: http://www.tuks.nl/pdf/Reference_Material/ICE_and_Water_Injection/College%20of%20the%20Destert%20-%20Hydrogen%20Fuel%20Cell%20Engines%20and%20Related%20Technologies-%202001.pdf (accessed on 16 July 2022).
  12. Fuels and Chemicals Autoignition Temperatures, The Engineering Toolbox. Available online: https://www.engineeringtoolbox.com/fuels-ignition-temperatures-d_171.html (accessed on 16 July 2022).
  13. Minimum Ignition Energy (MIE). Available online: https://www.euratex.co.uk/110411020.pdf (accessed on 8 July 2021).
  14. Adiabatic Flame Temperatures, The Engineering Toolbox. Available online: https://www.engineeringtoolbox.com/adiabatic-flame-temperature-d_996.html (accessed on 16 July 2022).
  15. Turns, S.R. An Introduction to Combustion: Concepts and Applications; McGraw-Hill: New York, NY, USA, 2000. [Google Scholar]
  16. HHO Workshop. Wasser Statt Sprit. Available online: https://www.wasserstattsprit.info/ (accessed on 16 July 2022). (In German).
  17. Standard Thermodynamic Values at 25 °C, Chemistry Handbook. Available online: http://chemistry-reference.com/Standard%20Thermodynamic%20Values.pdf (accessed on 16 July 2022).
  18. Sterner, M.; Stadler, I. (Eds.) Handbook of Energy Storage; Springer: Berlin, Germany, 2019; Available online: https://link.springer.com/book/10.1007/978-3-662-55504-0 (accessed on 16 July 2022).
  19. Koponen, J. Review of Water Electrolysis Technologies and Design of Renewable Hydrogen Production Systems. Master’s Thesis, Lappeenranta University of Technology, Lappeenranta, Finland, 2015. [Google Scholar]
  20. Gilliam, R.J.; Graydon, J.W.; Kirk, D.W.; Thorpe, S.J. A Review of Specific Conductivities of Potassium Hydroxide Solutions for Various Concentrations and Temperatures. Int. J. Hydrogen Energy 2007, 32, 359–364. [Google Scholar] [CrossRef]
  21. “Electrical Resistivity and Conductivity,” Wikipedia. Available online: https://en.wikipedia.org/wiki/Electrical_resistivity_and_conductivity (accessed on 16 July 2022).
  22. Micro GC Fusion Gas Analyser, INFICON. Available online: https://www.inficon.com/v1/attachment/4b9f2fc3-5b8e-4245-ae33-749f6fcab95c (accessed on 16 July 2022).
  23. Matthews, J.C.; Wright, M.D.; Martin, D.; Bacak, A.; Priestley, M.; Bannan, T.J.; Silva, H.G.; Flynn, M.; Percival, C.J.; Shallcross, D.E. Urban tracer dispersion and infiltration into buildings over a 2-km scale. Bound. Layer Meteorol. 2020, 175, 113–134. [Google Scholar] [CrossRef] [Green Version]
Figure 1. Scheme of a dry cell. Adapted from [8].
Designs 06 00079 g001
Figure 2. The dry cell system used in this work: (a) Dry cell, (b) Reservoir with Manometer, (c) Bubbler, (d) Arrestor, (e) Hoses, (f) Poles, (g) Sealing rings, (h) Stainless steel plates–electrodes.
Designs 06 00079 g002
Figure 3. Prototype dry cell with power source.
Designs 06 00079 g003
Figure 4. DELTA ELECTRONIKA Power Supply SM6020 used for the dry cell tests.
Designs 06 00079 g004
Figure 5. Cell voltage vs current density applied, with distinction between reversible voltage, activation overpotential and ohmic overpotential. Adapted from [19].
Designs 06 00079 g005
Figure 6. INFICON Micro GC Fusion.
Designs 06 00079 g006
Figure 7. Evolution of the applied voltage with the current, for 3 and 20% (w/w) of KOH.
Designs 06 00079 g007
Figure 8. Efficiency evolution with injected power, for 3 and 20% (w/w) of KOH.
Designs 06 00079 g008
Table 1. Properties of oxyhydrogen, H2, gasoline, diesel, methane and propane.
OxyhydrogenHydrogen-H2GasolineDieselMethane-CH4Propane-C3H8
Autoignition temperature at 1 atm570 °C [8]585 °C [11]230–480 °C [11]210 °C [12]540 °C [11]490 °C [11]
Minimum ignition energy20 μJ (STP *) [8]20 μJ
(25 °C and 1 atm) [11]
800 μJ [13]-280–300 μJ [13]250–260 μJ [13]
HHV ** at 25 °C and 1 atm-141.86 kJ/g [11]44.5 kJ/g [11]42.5 kJ/g [11]55.53 kJ/g [11]50.36 kJ/g [11]
LHV *** at 25 °C and 1 atm120.90 kJ/g (H2) [8]119.93 kJ/g [11]47.5 kJ/g [11]44.8 kJ/g [11]50.02 kJ/g [11]45.6 kJ/g [11]
Flame temperature2800 °C [8]2210 °C [14] ****2002 °C (C8H18) [15] ****2004 °C (C12H26) [15] ****1953 °C [15] ****1994 °C [15] ****
* STP conditions: “Standard Temperature and Pressure”, standard temperature and pressure conditions of 273.15 K (0 °C) and 100,000 Pa = 1 bar, respectively. ** HHV: “High Heating Value”, energy released in combustion including water vaporization energy. *** LHV: “Low Heating Value”, energy released in combustion excluding water vaporization energy. **** Adiabatic flame temperature at 1 atm with air as oxidant and at constant pressure. It is the flame temperature of combustion products, in adiabatic process, without changes in kinetic and potential energies.
Table 2. Results of molar concentration in % of H2 with 3% (w/w) of KOH.
H2 [%]
TestsV [V]I [A]P [W]T [°C]InjectionsMeanσ
111.01.011.028.571.310971.786073.577072.538074.086475.088873.06451.4416
211.52.023.029.068.662368.533269.109869.95470.5681-69.36550.8725
312.04.048.030.167.831068.852468.306668.297470.3263-68.72270.9666
412.06.072.031.267.147167.014766.971567.217567.2253-67.11520.1166
512.08.096.032.267.357467.422567.170467.852867.9407-67.54880.3323
610.51.010.538.266.645367.973166.782666.471966.5821-66.89100.6152
Table 3. Results of molar concentration in % of O2 with 3% (w/w) of KOH.
O2 [%]
TestsV [V]I [A]P [W]T [°C]InjectionsMeanσ
111.01.011.028.531.234031.544132.929232.126633.22934.085632.52481.0846
211.52.023.029.029.248429.205329.559230.195730.6151-29.76470.6186
312.04.048.030.128.665029.358629.006728.988830.4064-29.28510.6732
412.06.072.031.228.182228.095028.037628.224328.2087-28.14960.0801
512.08.096.032.228.292028.337728.136928.625828.6713-28.41270.2283
610.51.010.538.227.969228.848128.047627.693327.6198-28.03560.4886
Table 4. Sum of the molar concentration in % of H2 and O2 with 3% (w/w) of KOH. The percentage of water is estimated from the deficit of the sum of H2 and O2 percentages.
TestsV [V]I [A]P [W]T [°C]H2 + O2 [%]σH2O [%]
111.01.011.028.5105.5893 *2.5263-
211.52.023.029.099.13021.49110.8698
312.04.048.030.198.00781.63981.9922
412.06.072.031.295.26480.19674.7352
512.08.096.032.295.96150.56074.0385
610.51.010.538.294.92661.10385.0734
* due to the presence of atmospheric nitrogen.
Table 5. Results of molar concentration in % of H2 with 20% (w/w) of KOH.
H2 [%]
TestsV [V]I [A]P [W]T [°C]InjectionsMeanσ
110.52.021.025.569.768671.165669.749972.691573.586871.39251.7240
211.54.046.027.567.337367.275767.894668.580068.923268.00220.7355
312.06.072.030.767.928067.810568.431867.751568.204868.02530.2864
412.08.096.033.267.355267.551967.444867.894267.322767.51380.2305
511.02.022.036.767.011766.732867.399967.098567.233867.09530.2502
Table 6. Results of molar concentration in % of O2 with 20% (w/w) of KOH.
O2 [%]
TestsV [V]I [A]P [W]T [°C]InjectionsMeanσ
110.52.021.025.530.132630.804229.908232.440232.919931.24101.3650
211.54.046.027.528.148928.336428.762329.055229.332528.72710.4905
312.06.072.030.728.680028.605629.037228.552028.863528.74770.2002
412.08.096.033.228.309128.435228.376228.652928.242528.40320.1571
511.02.022.036.728.084428.043928.271628.119428.137728.13140.0862
Table 7. Sum of the molar concentration in % of H2 and O2 with 20% (w/w) of KOH. The percentage of water is estimated from the deficit of the sum of H2 and O2 percentages.
TestsV [V]I [A]P [W]T [°C]H2 + O2 [%]σH2O [%]
110.52.021.025.5102.6335 *3.0890-
211.54.046.027.596.72921.22603.2708
312.06.072.030.796.77300.48663.2270
412.08.096.033.295.91690.38774.0831
511.02.022.036.795.22670.33644.7733
* due to the presence of atmospheric nitrogen.
Table 8. Results obtained for the calculation of the theoretical efficiency ( η U ) of the dry cell for 3% (w/w) of KOH. The letter “δ” means the experimental error of a given variable.
TestV [V]V/Cell
[V]
I
[A]
Current Density [A/cm2]P
[W]
δP [W]T [°C]ηV
[%]
δηV
[%]
Start-up11.5 3.0 34.5-25.3
111.01.83331.00.005211.03.328.466.91940.5070
211.51.91672.00.010423.03.928.464.00980.4638
311.51.91673.00.015634.54.428.664.00980.4638
412.02.00004.00.020848.05.028.561.34280.4260
512.52.08335.00.026162.55.628.658.88900.3926
612.52.08336.00.031375.06.128.658.88900.3926
712.52.08337.00.036587.56.628.958.88900.3926
813.02.16678.00.0417104.07.328.956.62410.3630
913.02.16679.00.0469117.07.828.956.62410.3630
1013.02.166710.00.0521130.08.328.756.62410.3630
1113.52.250011.00.0573148.58.928.954.52690.3366
1213.52.250012.00.0625162.09.429.054.52690.3366
Average temperature [°C]28.7
Table 9. Results obtained for the calculation of the theoretical efficiency ( η U ) of the dry cell for 20% (w/w) KOH. The letter “δ” means the experimental error of a given variable.
TestV
[V]
V/Cell [V]I
[A]
Current Density [A/cm2]P
[W]
δP [W]T [°C]ηV
[%]
δηV
[%]
Start-up10.5 2.0 21.0-25.5
110.51.75002.00.010421.03.635.469.78060.5564
211.01.83333.00.015633.04.335.566.60870.5070
311.51.91674.00.020846.04.935.563.71270.4638
411.51.91675.00.026157.55.435.463.71270.4638
512.02.00006.00.031372.06.035.561.05800.4260
612.02.00007.00.036584.06.535.461.05800.4260
712.52.08338.00.0417100.07.135.458.61570.3926
812.52.08339.00.0469112.57.635.358.61570.3926
912.52.083310.00.0521125.08.135.258.61570.3926
1012.52.083311.00.0573137.58.635.158.61570.3926
1113.02.166712.00.0625156.09.335.256.36120.3630
Average temperature [°C]35.4
Publisher’s Note: MDPI stays neutral with regard to jurisdictional claims in published maps and institutional affiliations.

