Article

Getting Fit in a Sustainable Way: Design and Optimization of a Low-Cost Regenerative Exercise Bicycle

1
Mechanical Engineering Department, San Jose State University, San Jose, CA 95192, USA
2
Intelliscience Institute, San Jose, CA 95192, USA
*
Author to whom correspondence should be addressed.
Designs 2022, 6(3), 59; https://doi.org/10.3390/designs6030059
Submission received: 6 May 2022 / Revised: 12 June 2022 / Accepted: 16 June 2022 / Published: 18 June 2022
(This article belongs to the Topic Building Energy and Environment)

Abstract

:
With the increase in demand for more sustainable energy sources, recent researchers have been looking into harvesting energy spent by humans for various purposes. One of the available sources of such energy is exercise equipment. While a few products are available in the market to harvest the power expended during an exercise session, these products are costly, and the cost may prohibit a day-to-day user from purchasing those. Motivated by this challenge, this paper describes a long-running research project that uses a static exercise bicycle to sustainably harvest human energy. A regenerative spin bike that uses the friction between a flywheel and a BaneBots wheel was designed and deployed. For the motor mount, two methods are investigated: linear preloading and rotary preloading. A commercially available indoor static bicycle is modified to incorporate the flywheel and the motor attachment. The generated electricity is converted to DC using a three-phase rectifier. A car charger is used for charging any devices attached to the setup. The resulting configuration is very effective in operating small electronic devices. This setup, which uses only off-the-shelf components, can be considered a replacement for its expensive custom-made counterparts.

1. Introduction

Increasing demand for energy and awareness about CO2 emissions [1] has made many companies invest more in researching and developing an environmentally sustainable method for energy harvesting. According to REN21(Renewable Energy Policy Network for the 21st Century) ’s 2021 Report [2], renewable sources contributed 18.1% to our energy consumption and 26% to our electricity generation in recent years (7.5% from biomass, 4.2% from heat energy, 1% from biofuels, 3.6% from water, 2% combined from wind, solar, biomass, geothermal, and ocean power). However, several other sustainable energy sources are overlooked that can provide a solution for the inevitable energy crisis. Human energy is one such energy form.
Different approaches are proposed in the literature to harvest energy from human motion. Piezoelectric footwear and other piezoelectric devices have been gaining popularity recently, e.g., [3,4,5]. In the piezoelectric footwear design, the dynamic force generated by the human heel is harvested and amplified using a piezoelectric circuit embedded in footwear. While several researchers continue to work on this area, these devices face several challenges, including low power output [6]. A backpack for generating power using human kinetic energy has also been proposed by researchers [7]. This work uses a flexible mechanical motion rectifier (MMR) to harvest energy. A few other recent works have focused on generating power from human joints using wearable, lightweight systems that involve minimal user effort [8,9,10]. There are also works focusing on harvesting energy based on the position of the center of mass of the human body [11,12,13]. Recent efforts have also tried to generate electricity from mechanical motions and vibrations [14].
A typical human burns an average of 2000 kCal (8.5 MJ) of energy daily, equivalent to the energy stored in a car’s battery. Many studies investigate the capture and reuse of this human energy e.g., [15,16,17,18]. However, only a few have promised sustainable ways to harvest the energy [19,20,21,22]. Gymnasiums (gyms) are the perfect example of the wastefulness of human energy. In a typical gym, powered exercise equipment consumes massive amounts of energy. Most gyms operate lights, TVs, fans, and speakers regardless of the presence of users. The possibility of capturing the energy burnt by the gym-goers sustainably to operate all these equipment has been mostly overlooked in the literature. If this human energy can be harvested efficiently, the energy consumption by gyms can be reduced to a great extent.
In recent years, several research studies have explored the generation of green energy from gym equipment. A survey of college students found that they were willing to use a campus gym more often if the energy they burnt in the exercise equipment could be used for charging their electronic devices [23]. The mechanical engineering researchers at the University of California at Berkeley have developed a facility within their campus gym to harvest energy and feed it back to the facility [24]. Another similar study from California [25] shows that using a four-switch buck-boost topology, human power can be harvested from gym equipment with more than 90% efficiency. The student researchers at Cal Poly Pomona have created an array of energy-harvesting elliptical machines in their recreation center to power the facility [26]. A similar study is also reported from the University of British Columbia, where energy-harvesting elliptical machines reduced the CO2 production by 0.2 kg/day [27]. Similar efforts have been reported from other parts of the world [28,29,30,31].
Beyond research studies, there have been a few attempts to commercialize green gym technology. In the United States, Adam Boesel created a “green micro-gym” in Oregon [32] that uses a combination of human energy and solar energy to power the gym. A similar attempt has been reported in England by the “Great Outdoor Gym Company” [33]. In addition to feeding the gym equipment, the facility uses human power to light a display board to make the users aware of their contributions to powering the gym.
While many previous attempts to harvest human energy from gym equipment have been successful, most of them suffer from a considerable initial cost to retrofit equipment to produce electricity. The technology needs to address several challenges before it can go mainstream. First, a person cannot generate a good amount of electricity with a bicycle generator in a single workout [34]. Due to the initial cost of the equipment and the relatively minor return, it will take several years for the gyms to make this technology profitable. Many gyms advertise themselves as green gyms to attract environmentally cautious customers without taking any action to harvest human energy [35]. This technology requires significantly more research and refinement before being widely adaptable worldwide.
Motivated by the abovementioned factors, this study targets to develop cost-effective and efficient technology to harvest energy from an exercise bike-powered generator. The target is to use off-the-shelf components and existing technology to gather energy from an exercise bike (static bike) in a laboratory setting and optimize the design using design for manufacturability and assembly (DFMA) considerations. We have explored this concept in a previous study [36] done at the San Jose State University gym facility. While the prior study showed promising results, we found that the technology was not good enough to achieve sustainable results in the long term. Ideally, the device will be compatible with and will not change the footprint of the exercise bike and, at the same time, be easy to maintain. This type of electrical energy generation will help minimize environmental impacts and preserve the environment by reducing the emission of carbon dioxide into the atmosphere. Further, a detailed cost analysis is performed on the new design to calculate the years it will take for an investor to reach the return of their investment point.

2. Methodology

2.1. Design Specifications

To develop the most cost-effective system, all the available technologies in the literature are investigated and compared. Several previous works attempted to create a system to harvest power from exercise equipment. Unfortunately, most of these works only described their design without providing additional data for quantification. In our study, we compared the technology used in these designs and chose the best elements that work for such a system. e.g., the table shows the Pugh chart [37] comparing the energy conversion subsystems of various designs proposed in the literature and the ranking of those systems based on the requirements for our project. The target of this approach was to use the best elements in the existing literature to develop an energy harvesting system that could provide optimum performance.
Based on this preliminary analysis, a friction-driven mechanism has been identified as the ideal candidate. The traditional friction wheel mechanism has been updated with elements from other energy harvesting mechanisms to achieve the project’s end goals. The target is to develop a device that can be retrofitted to any existing exercise bike. The device is also expected to be of high quality and low cost. Figure 1 shows the CAD model of an exercise spin bike, as envisioned, with an RC motor attached. The design uses the friction between a flywheel and a BaneBot wheel to achieve the drive and generate electricity. The BaneBot wheel is attached to the motor using a BaneBot Hub. Achieving the right amount of friction between the flywheel and the BaneBot wheel is critical. It is also crucial to size the BaneBot Hub correctly to fit the motor shaft.

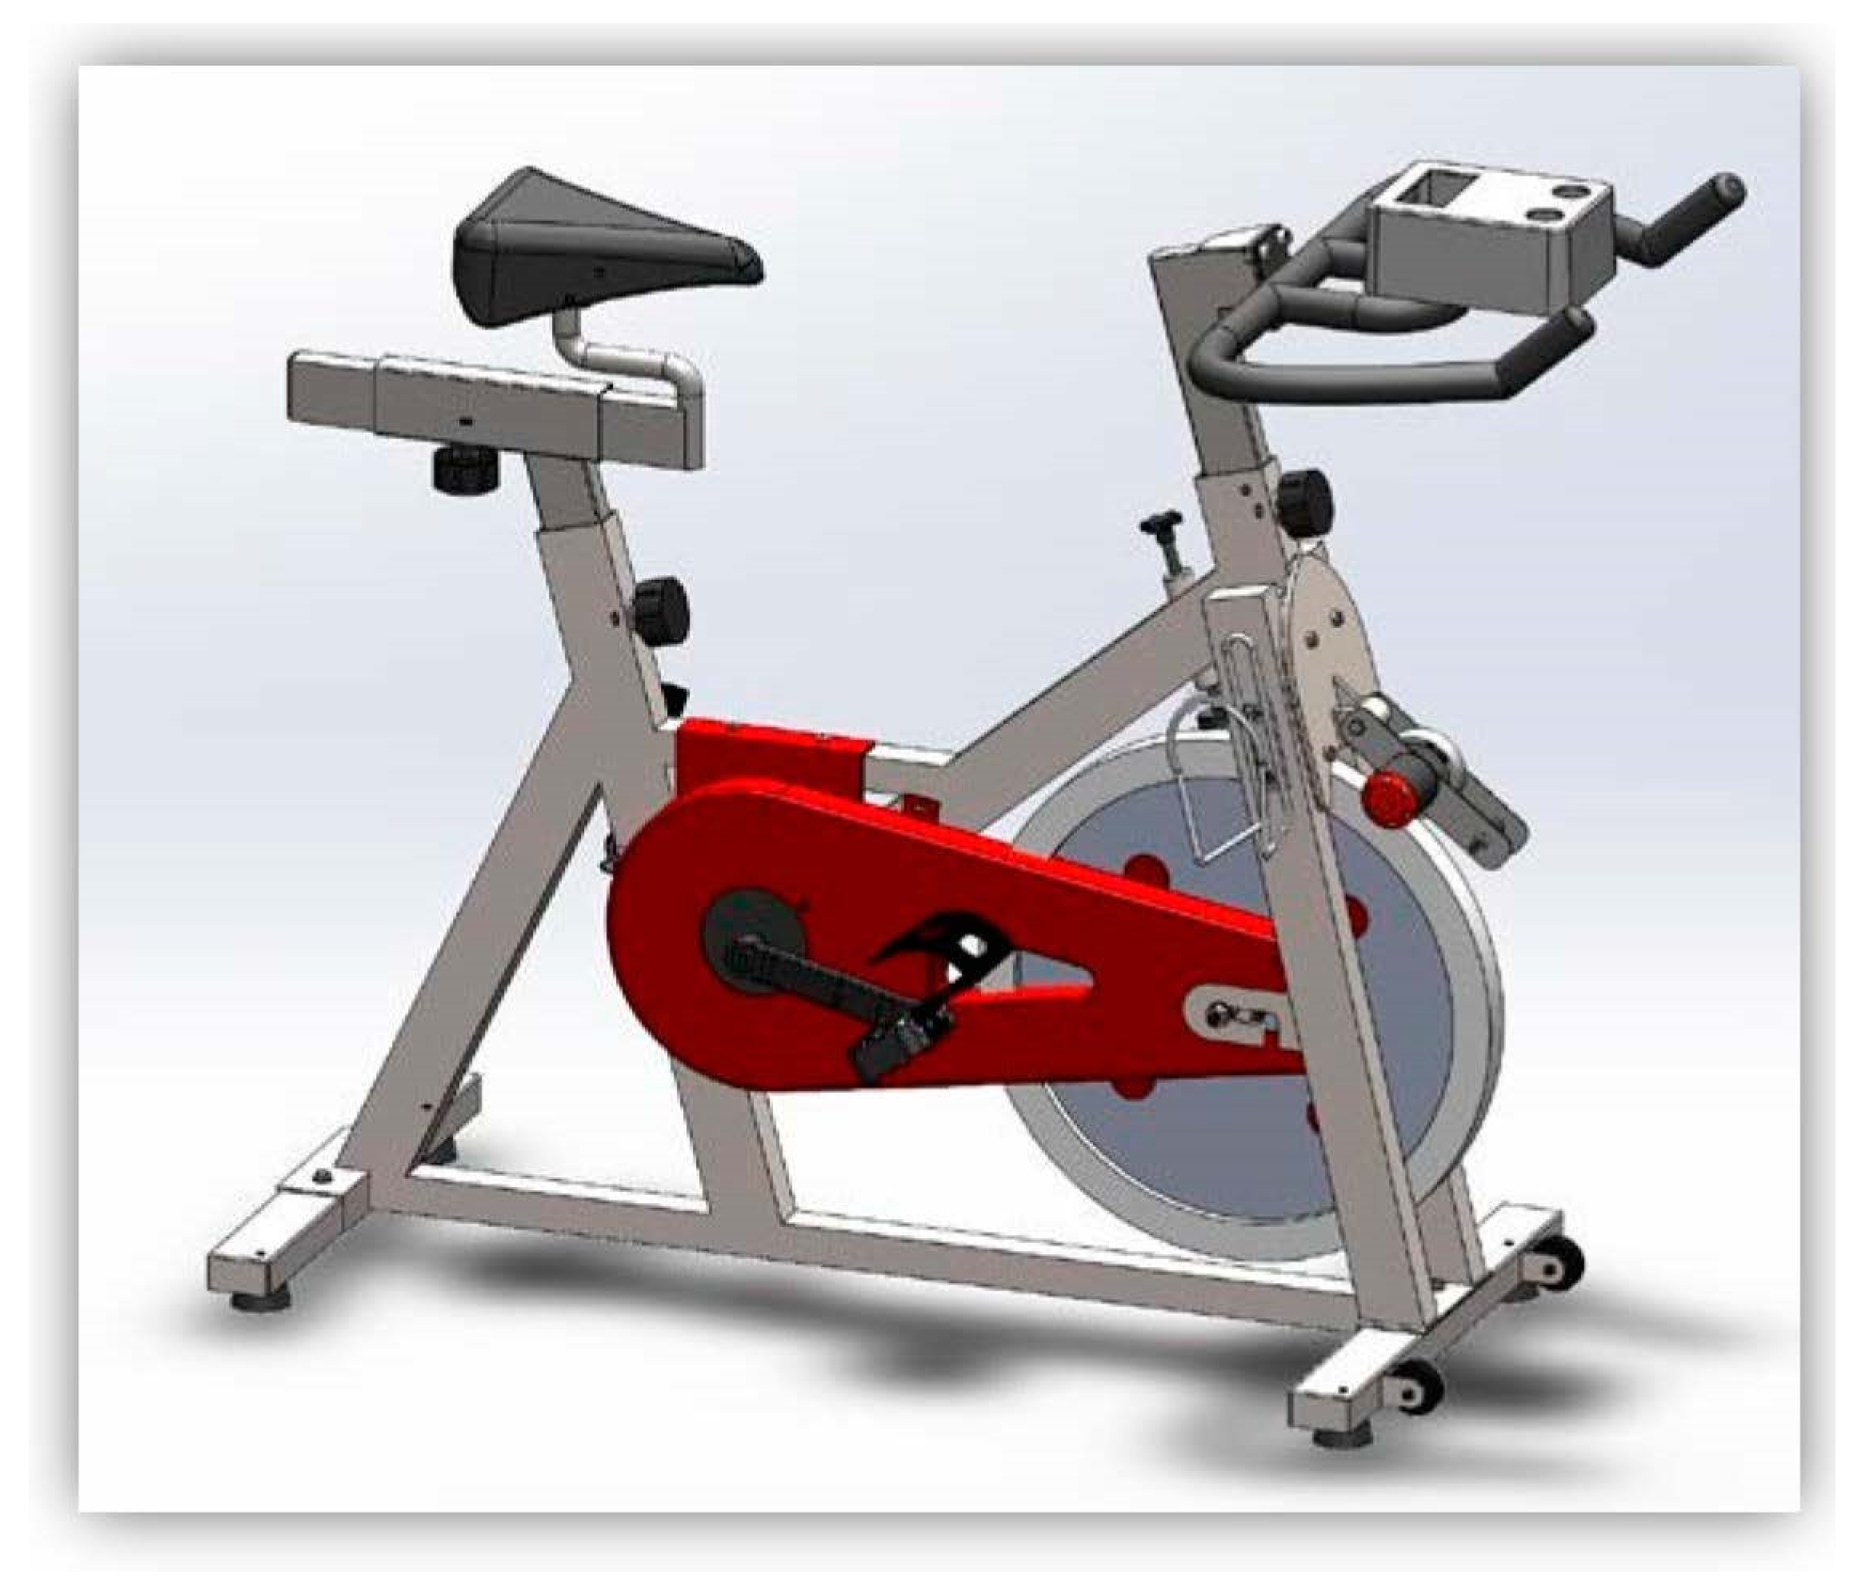
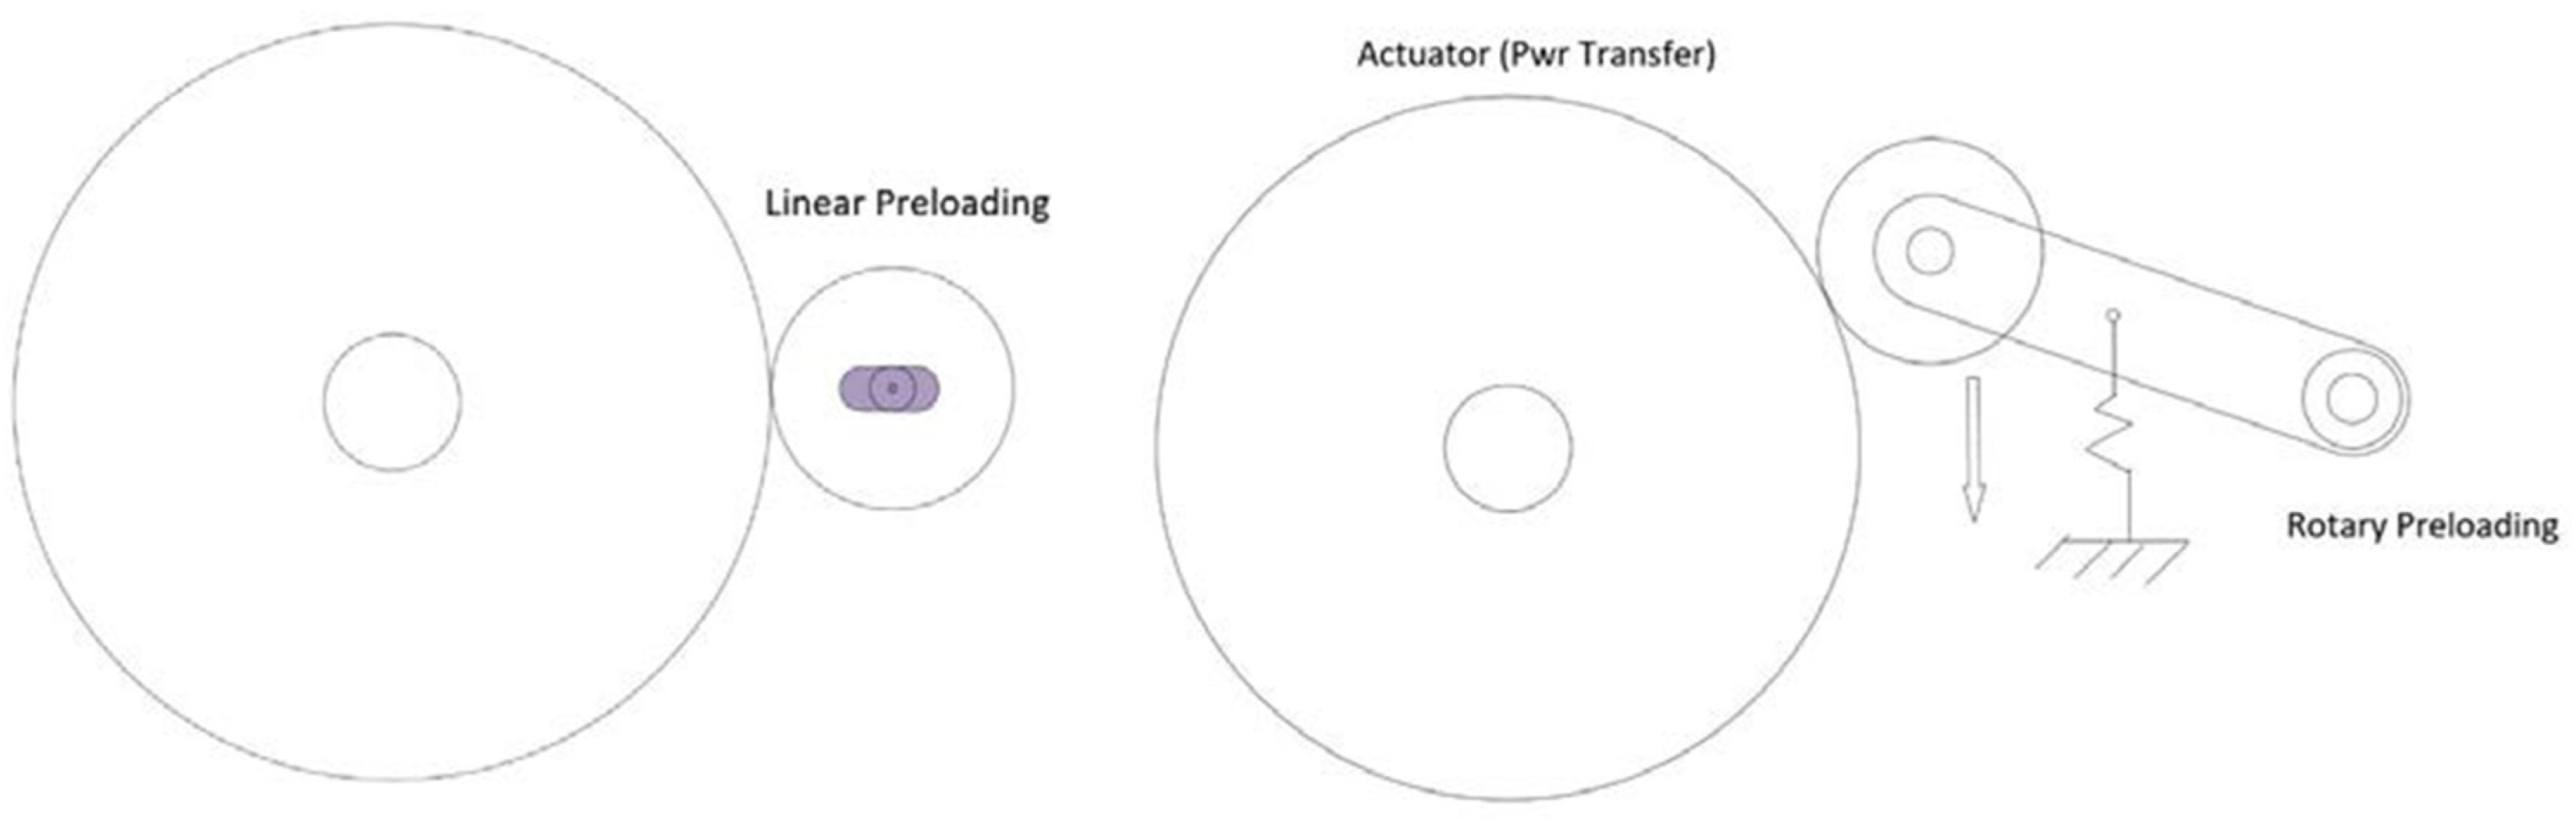
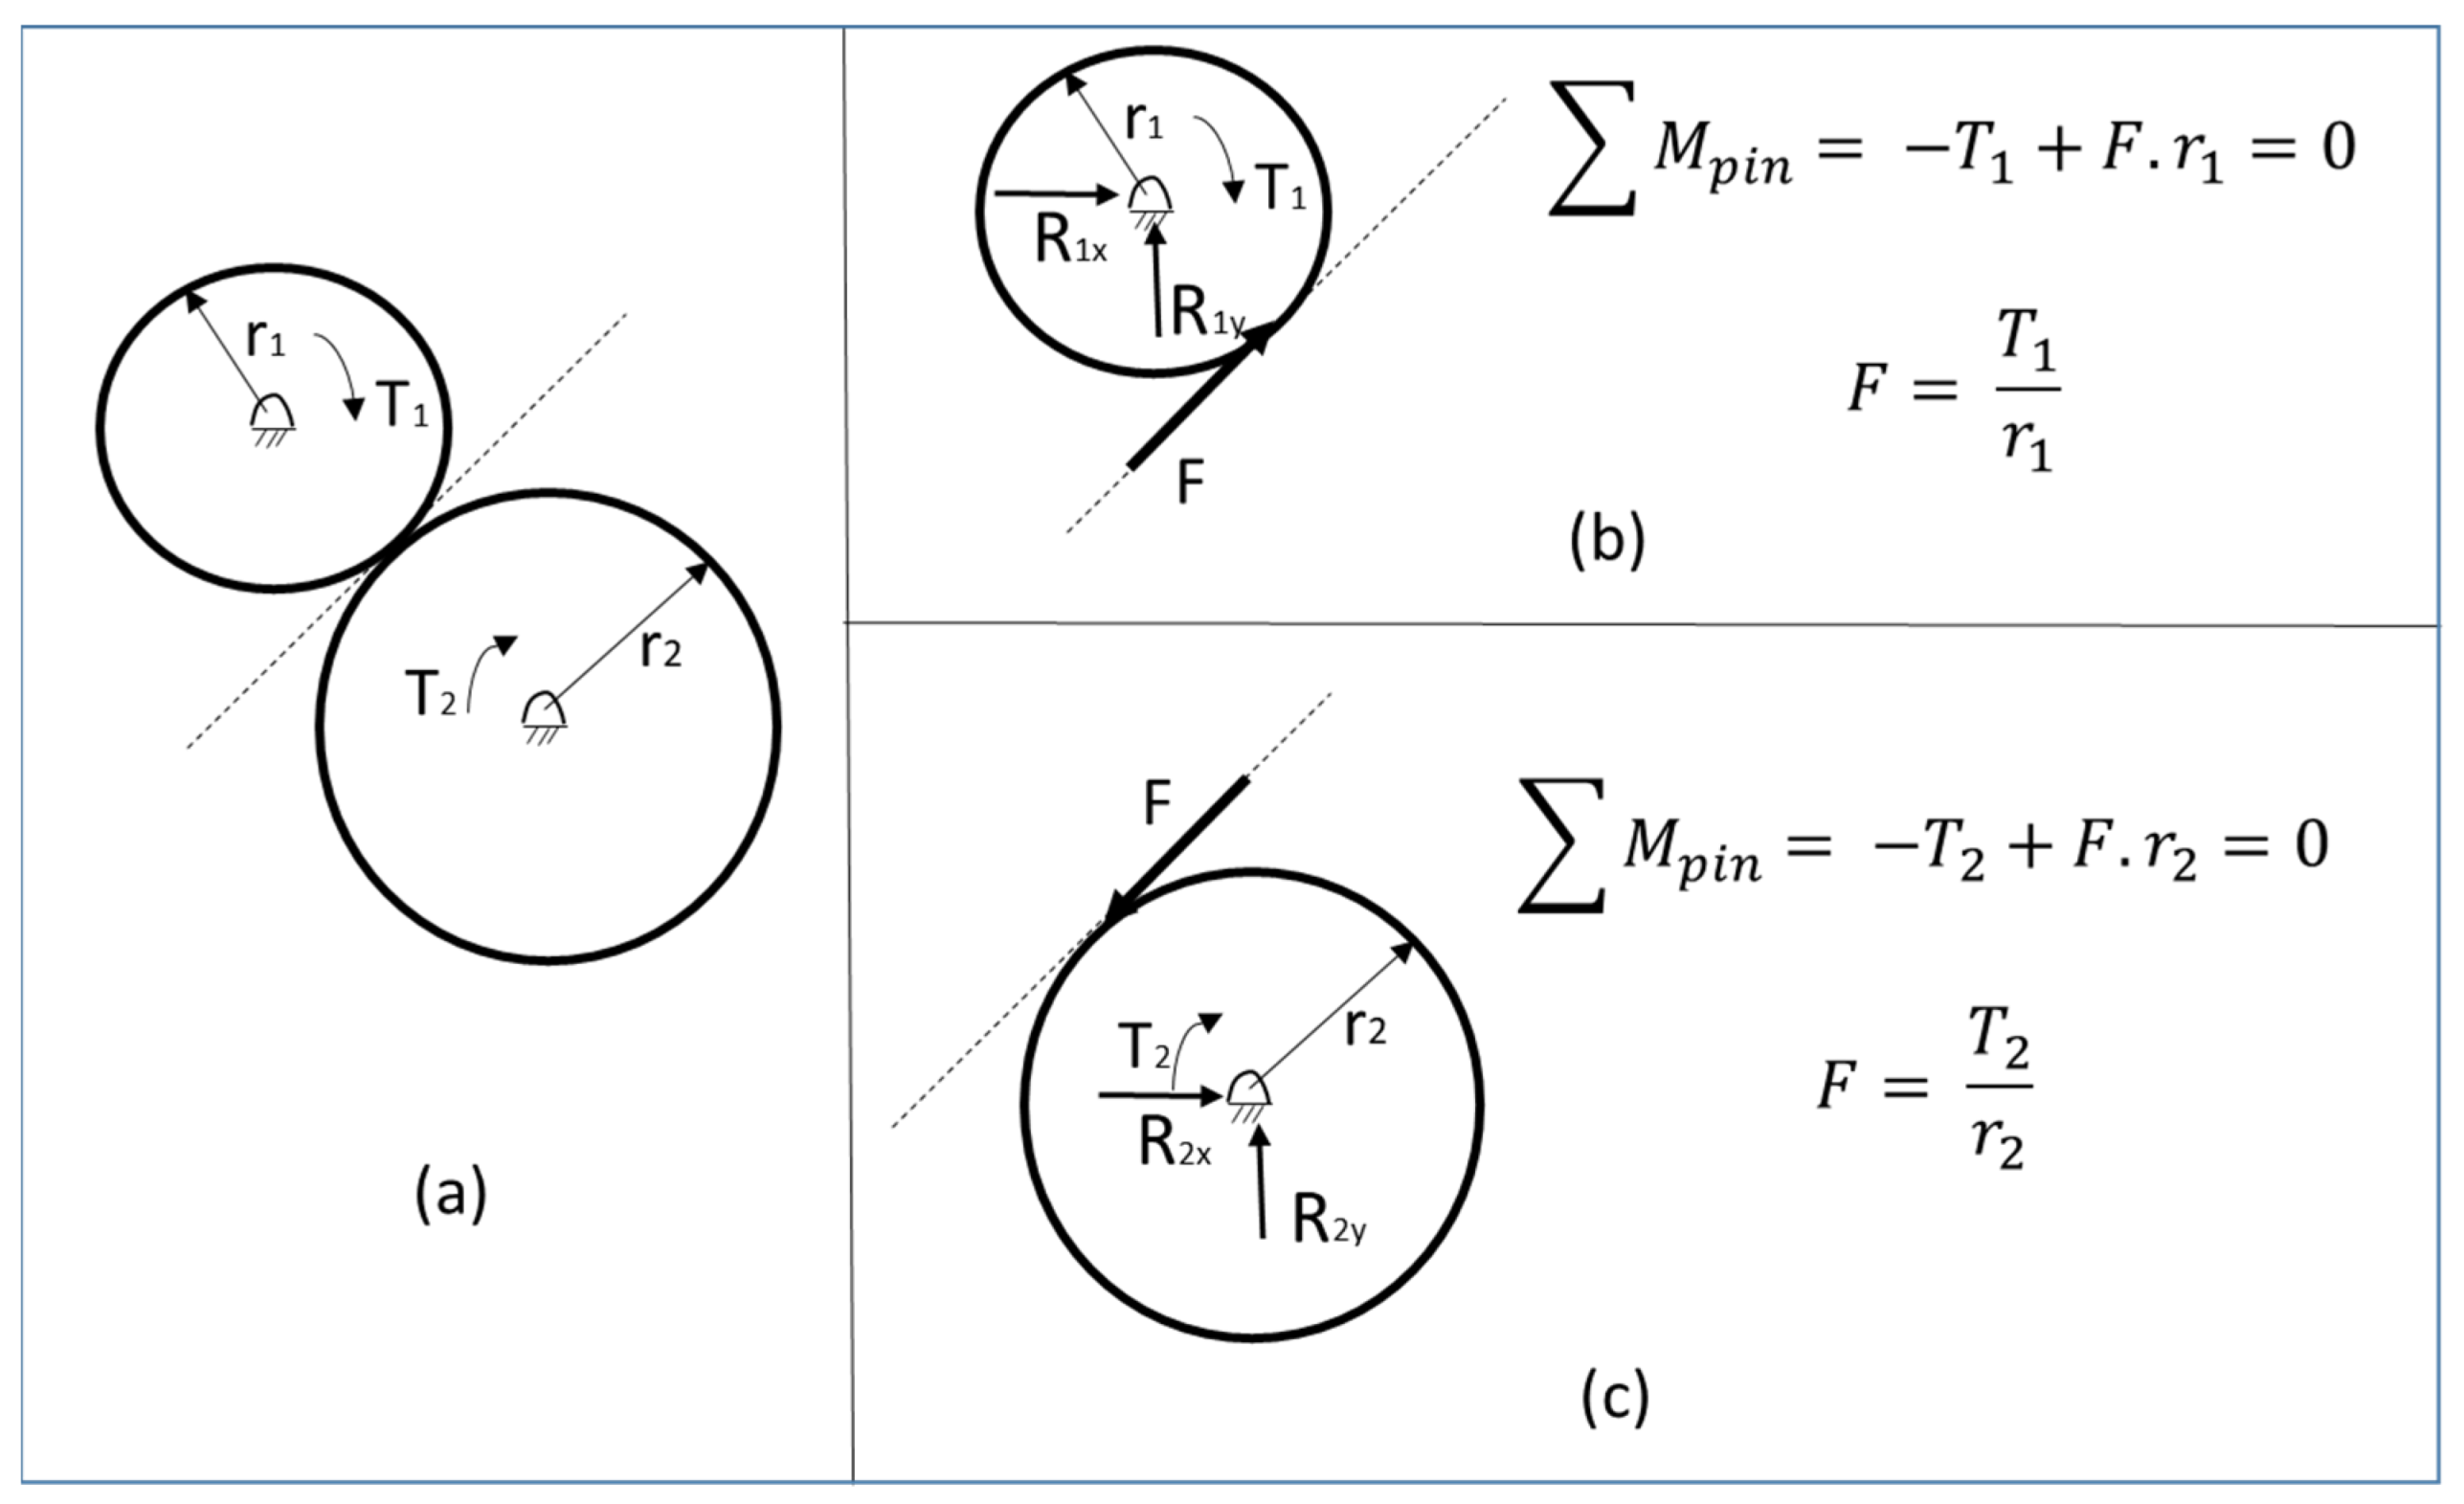
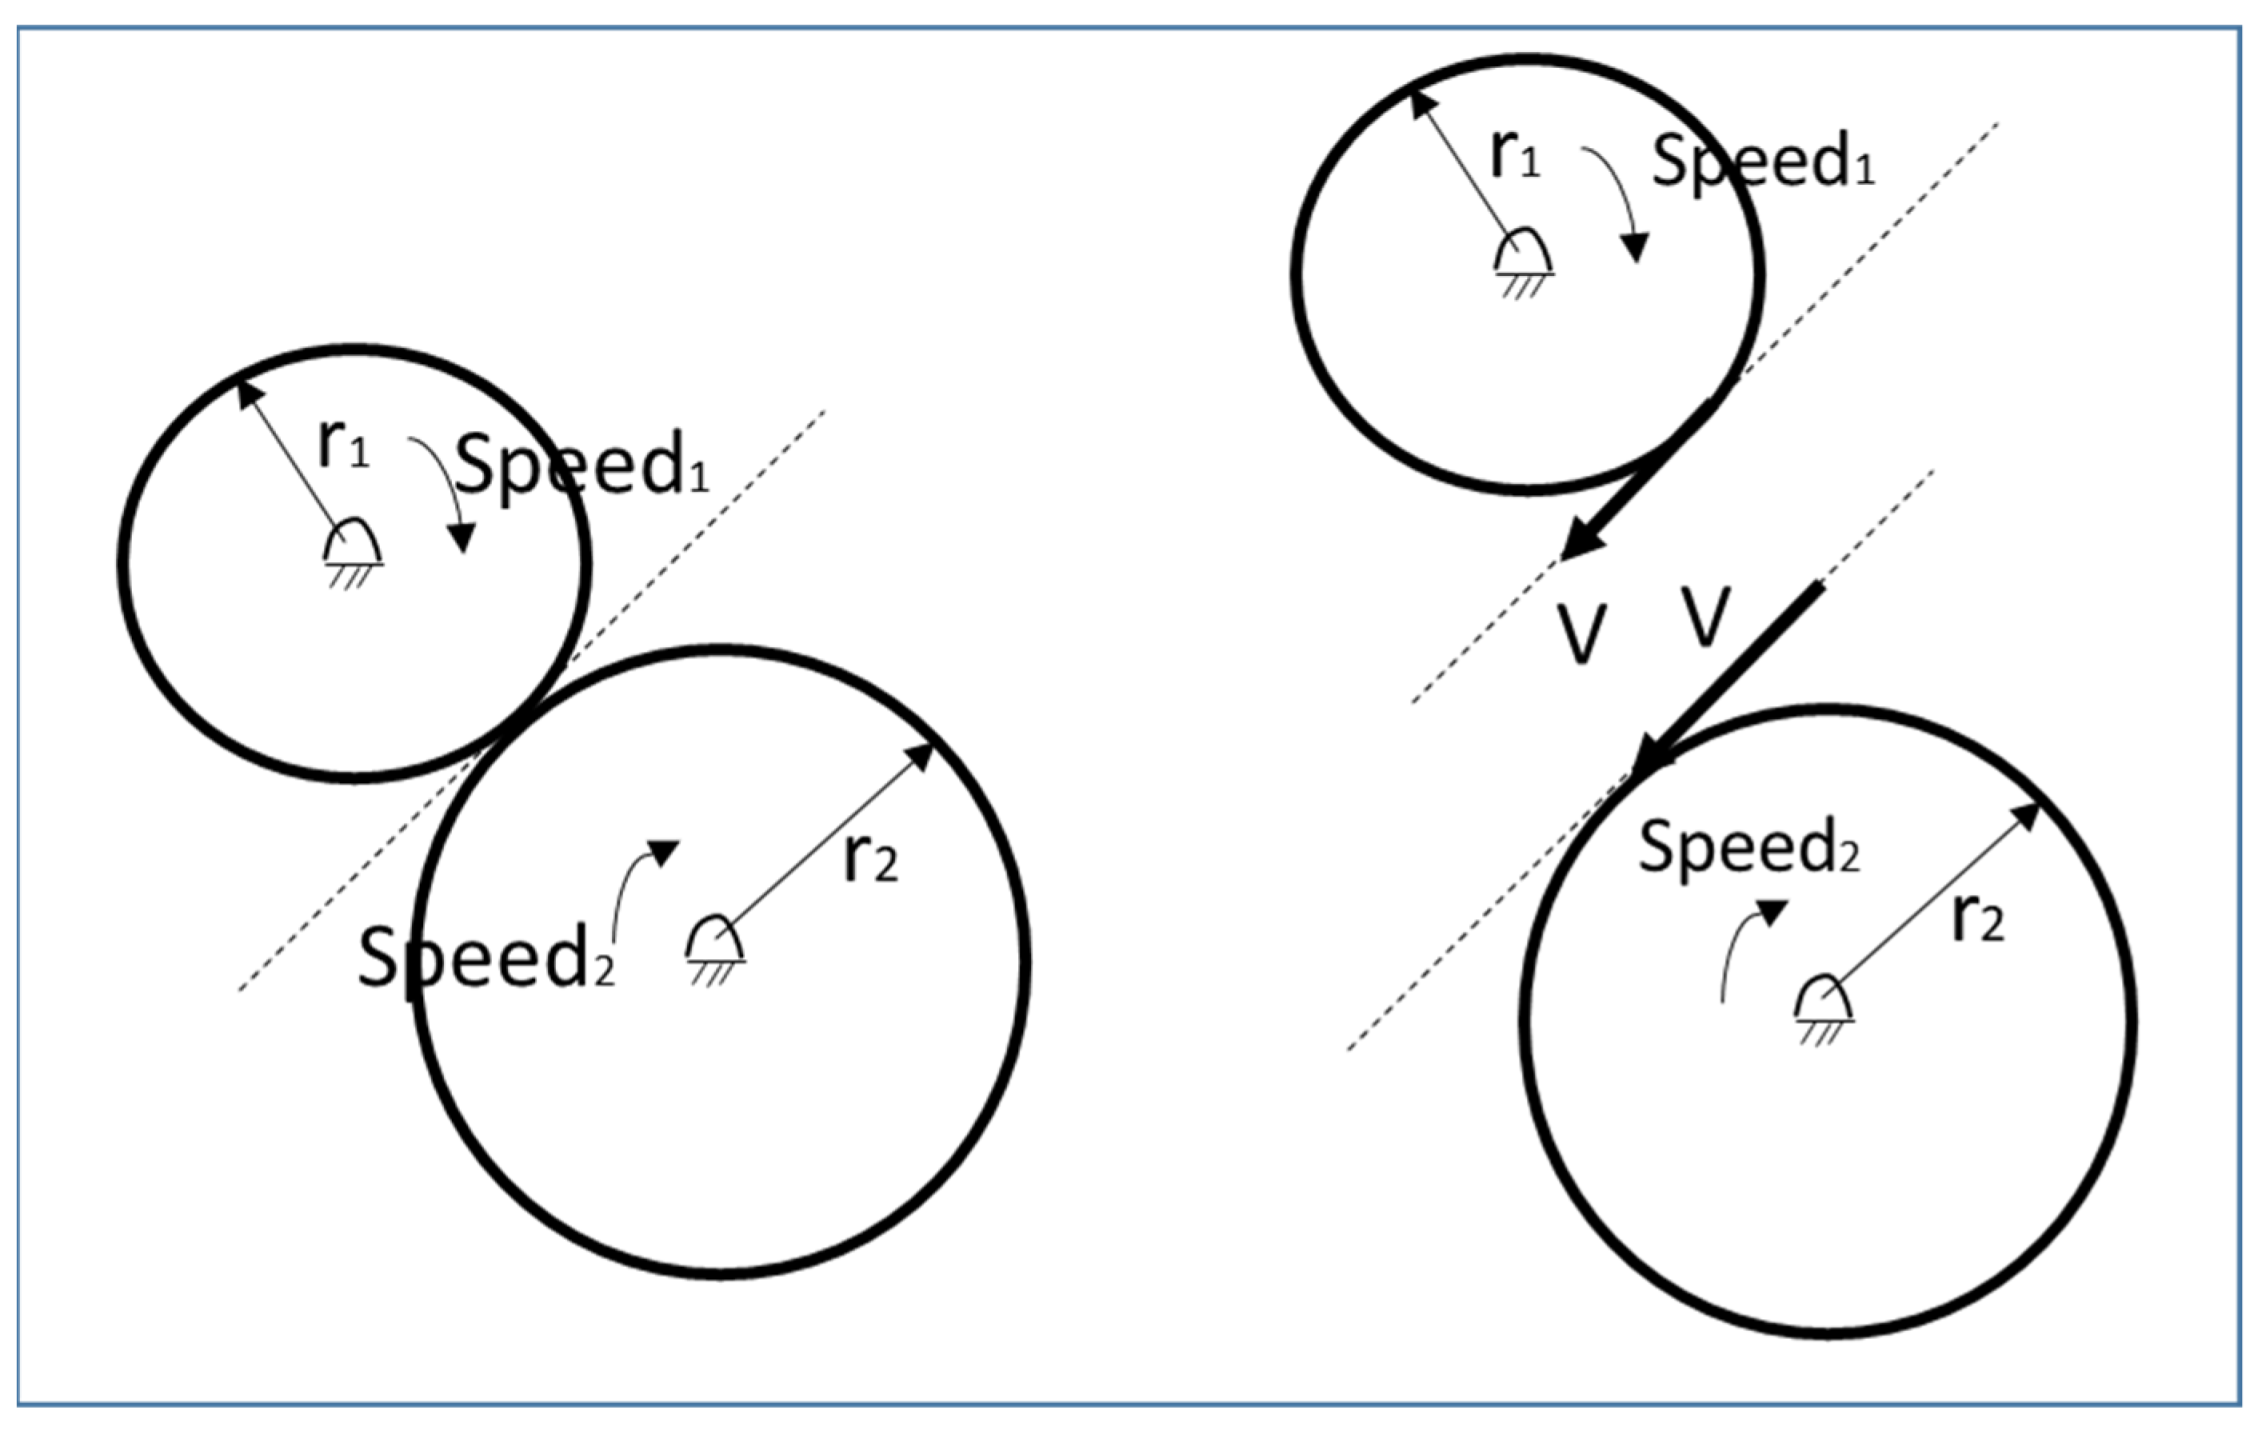
2.1.1. Friction Drive Transmission

Compared to gear or belt-driven systems, the friction drive transmission possesses certain unique advantages. They can transfer torque with high mechanical efficiency and minimal backlash at high speeds. They are also known for quieter operations. Since their operation is smoother, high-speed motors can be utilized, which offers a higher power density [38]. These drives are also mechanically safer and more straightforward to assemble. This system is also simple to manufacture, making it an ideal candidate for our application.
When the user pedals to rotate the flywheel, the motor rotates. There are two methods to mount the motor, as shown in Figure 2.
  • Linear Preloading: The linear preloading method utilizes an oblong hole to mount the motor using a screw and a nut. The motor wheel is pushed against the flywheel and then tightens the nut.
  • Rotary Preloading: The motor is mounted on a pivot arm, and a spring is attached to apply the pressure against the flywheel.
For the linear preloading, the tension must be set precisely for the drive to transmit the power. On the other hand, in the rotary preloading, we need enough force so that it does not slip. In addition, if the flywheel surface is imperfect, the spring system is more forgiving.
A friction drive is very similar to a geared transmission with no teeth. The computations for this drive type are the same as the standard geared transmission. The calculations performed on the friction drive system are shown in Figure 3 and the equations below.
G e a r   r a t i o = T 1 T 2 = R 1 R 2 = C 1 C 2  
where T = torque, R = radii, d = diameter, C = circumference
P o w e r ,   P = 2 π N T 60
where N = rotational speed (RPM), T = Torque (Nm)
I n s t a n t a n e o u s   v e l i c u t y   o f   t h e   p o i n t   o f   c o n t a c t = r e v m i n   ·   π d r e v

2.1.2. Choosing the Motor

The most critical task is determining a highly efficient and durable permanent magnet motor that generates power in a usable voltage range. The goal is to have a motor spin at a rate that will generate 12–15 V when a person pedals the exercise bike.
A Sunny Health SF-BD1423 Belt Drive Indoor Cycling Bike is used to build the prototype in this project. The Sunny Health SF-BD1423’s flywheel diameter is measured at 18 inches. The following relationships are used to calculate the motor RPM (Figure 4).
S p e e d 1 ·   2 π r 1 = V  
S p e e d 2 ·   2 π r 2 = V
S p e e d 1 S p e e d 2 = r 2 r 1 = C 2 C 1  
d f l y w h e e l = 18
d B a n e b o t w h e e l = 2.875  
Pedaling the spin bike at an average pace rotates the flywheel around 250 to 350 RPM. Taking the lower end of that, we have:
S p e e d B a n e b o t w h e e l = S p e e d f l y w h e e l ·   18 2.875 = 1583   RPM  
The motor needs to produce 11–12 V at this RPM.
1583   RPM 11   V = 143.9
1583   RPM 12   V = 131.9
Therefore, the target motor should be around 140 KV.
P = 0.5 KW, Speed = 1583 RPM
Torquemotor = P × 9.549/Speed = 0.5 kW × 9.549/1583 RPM = 3.02 Nm
We also have
T 1 T 2 = R 1 R 2 = C 1 C 2
Using this relationship, we can calculate the torque input by the flywheel.
T o r q u e f l y w h e e l = d 1 d 2   T o r q u e m o t o r
T o r q u e f l y w h e e l = 18 2.875   · 3.02 = 18.91   Nm

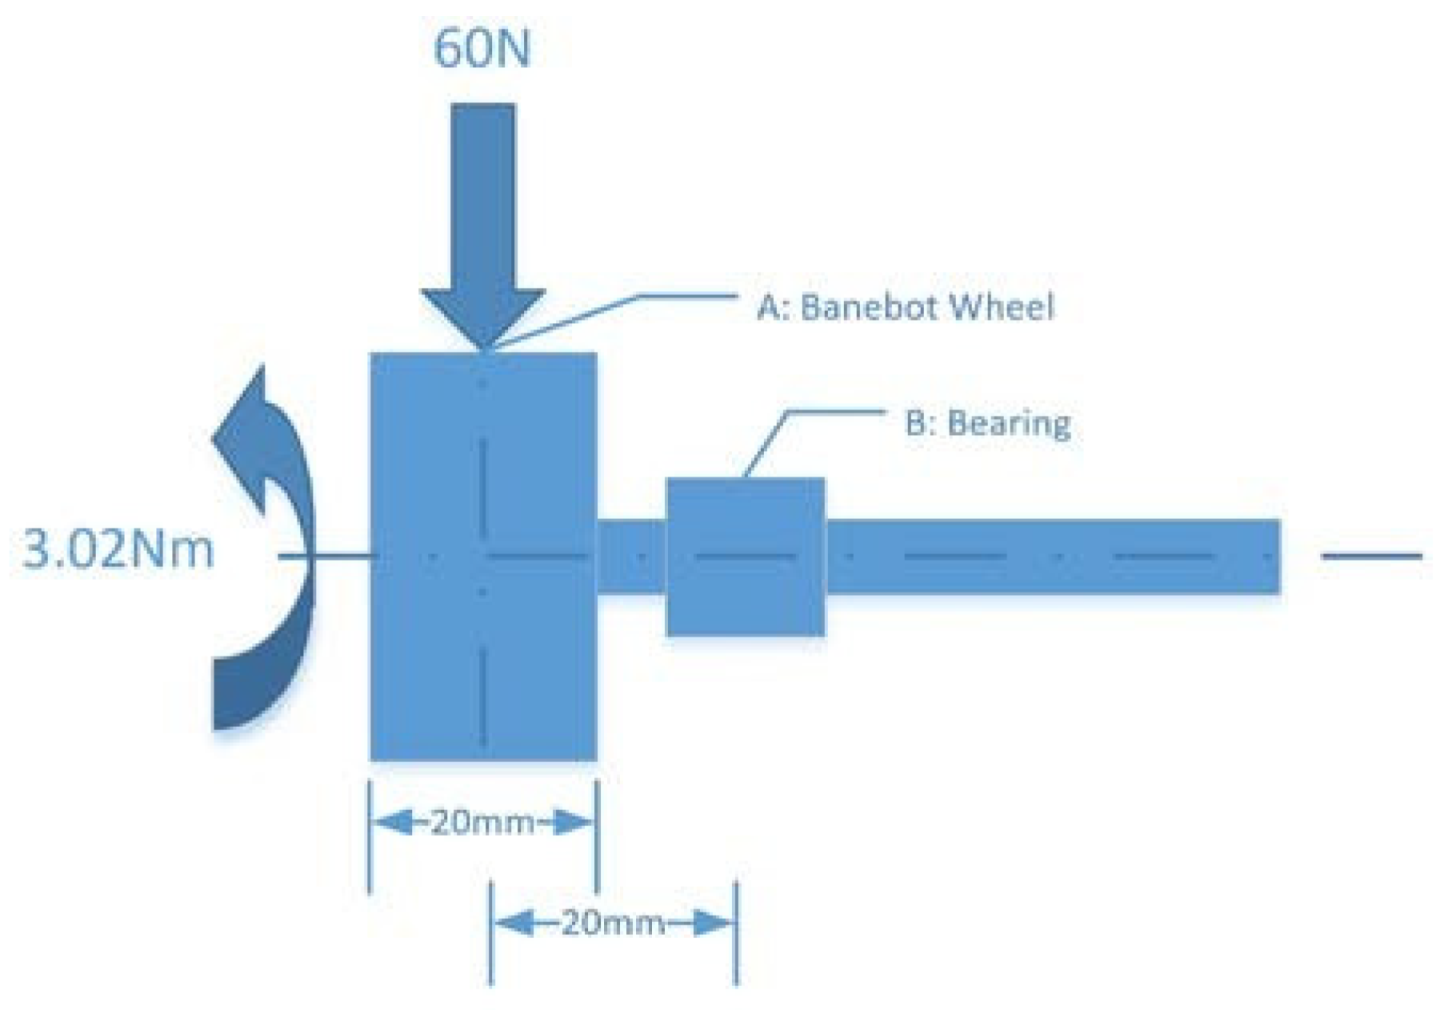
2.1.3. Design of Shaft

One disadvantage of the friction drive is the internal forces transmitted to the shafts. The shafts need to be designed to handle these radial loads, which makes it a combined bending and torsion loading problem (Figure 5).
P = 0.5 kW = 5.0 × 10² W
Speed (N) = 1583 RPM
Radial loading (bending) is 60 N.
Shaft material is mild steel with safe stress τ = 60 MPA
Motor torque is calculated above T = 3.02 Nm or 3.02 × 10³ N·mm
The bending moment at point B, MB = 60 N × 20 mm = 1.2 × 10³ N·mm
Therefore, the Equivalent twisting moment is given by
T e q = T 2 + M 2 = 3.02 2 + 1.20 2
Teq = 3.25 × 10³ N·mm
Furthermore, Teq = π 16 d3· τ (by Strength criteria for shaft design)
Teq = 3.25 × 10³ N·mm = π 16 d3·60
d3 = 3250   N · mm   ·   16 π · 60
d = 6.5 mm

2.1.4. Components and Cost

Table 1 shows the components required and the estimated cost. If the cost of the spin bike and some of the optional parts are removed, the electricity harvesting system can be built for less than $200, not counting the cost of the tools. However, for prototyping, these items are purchased in small quantities. When purchased in bulk, the cost can be reduced significantly. In summary, this design costs way less than similar products in the market.

2.2. Prototype Building

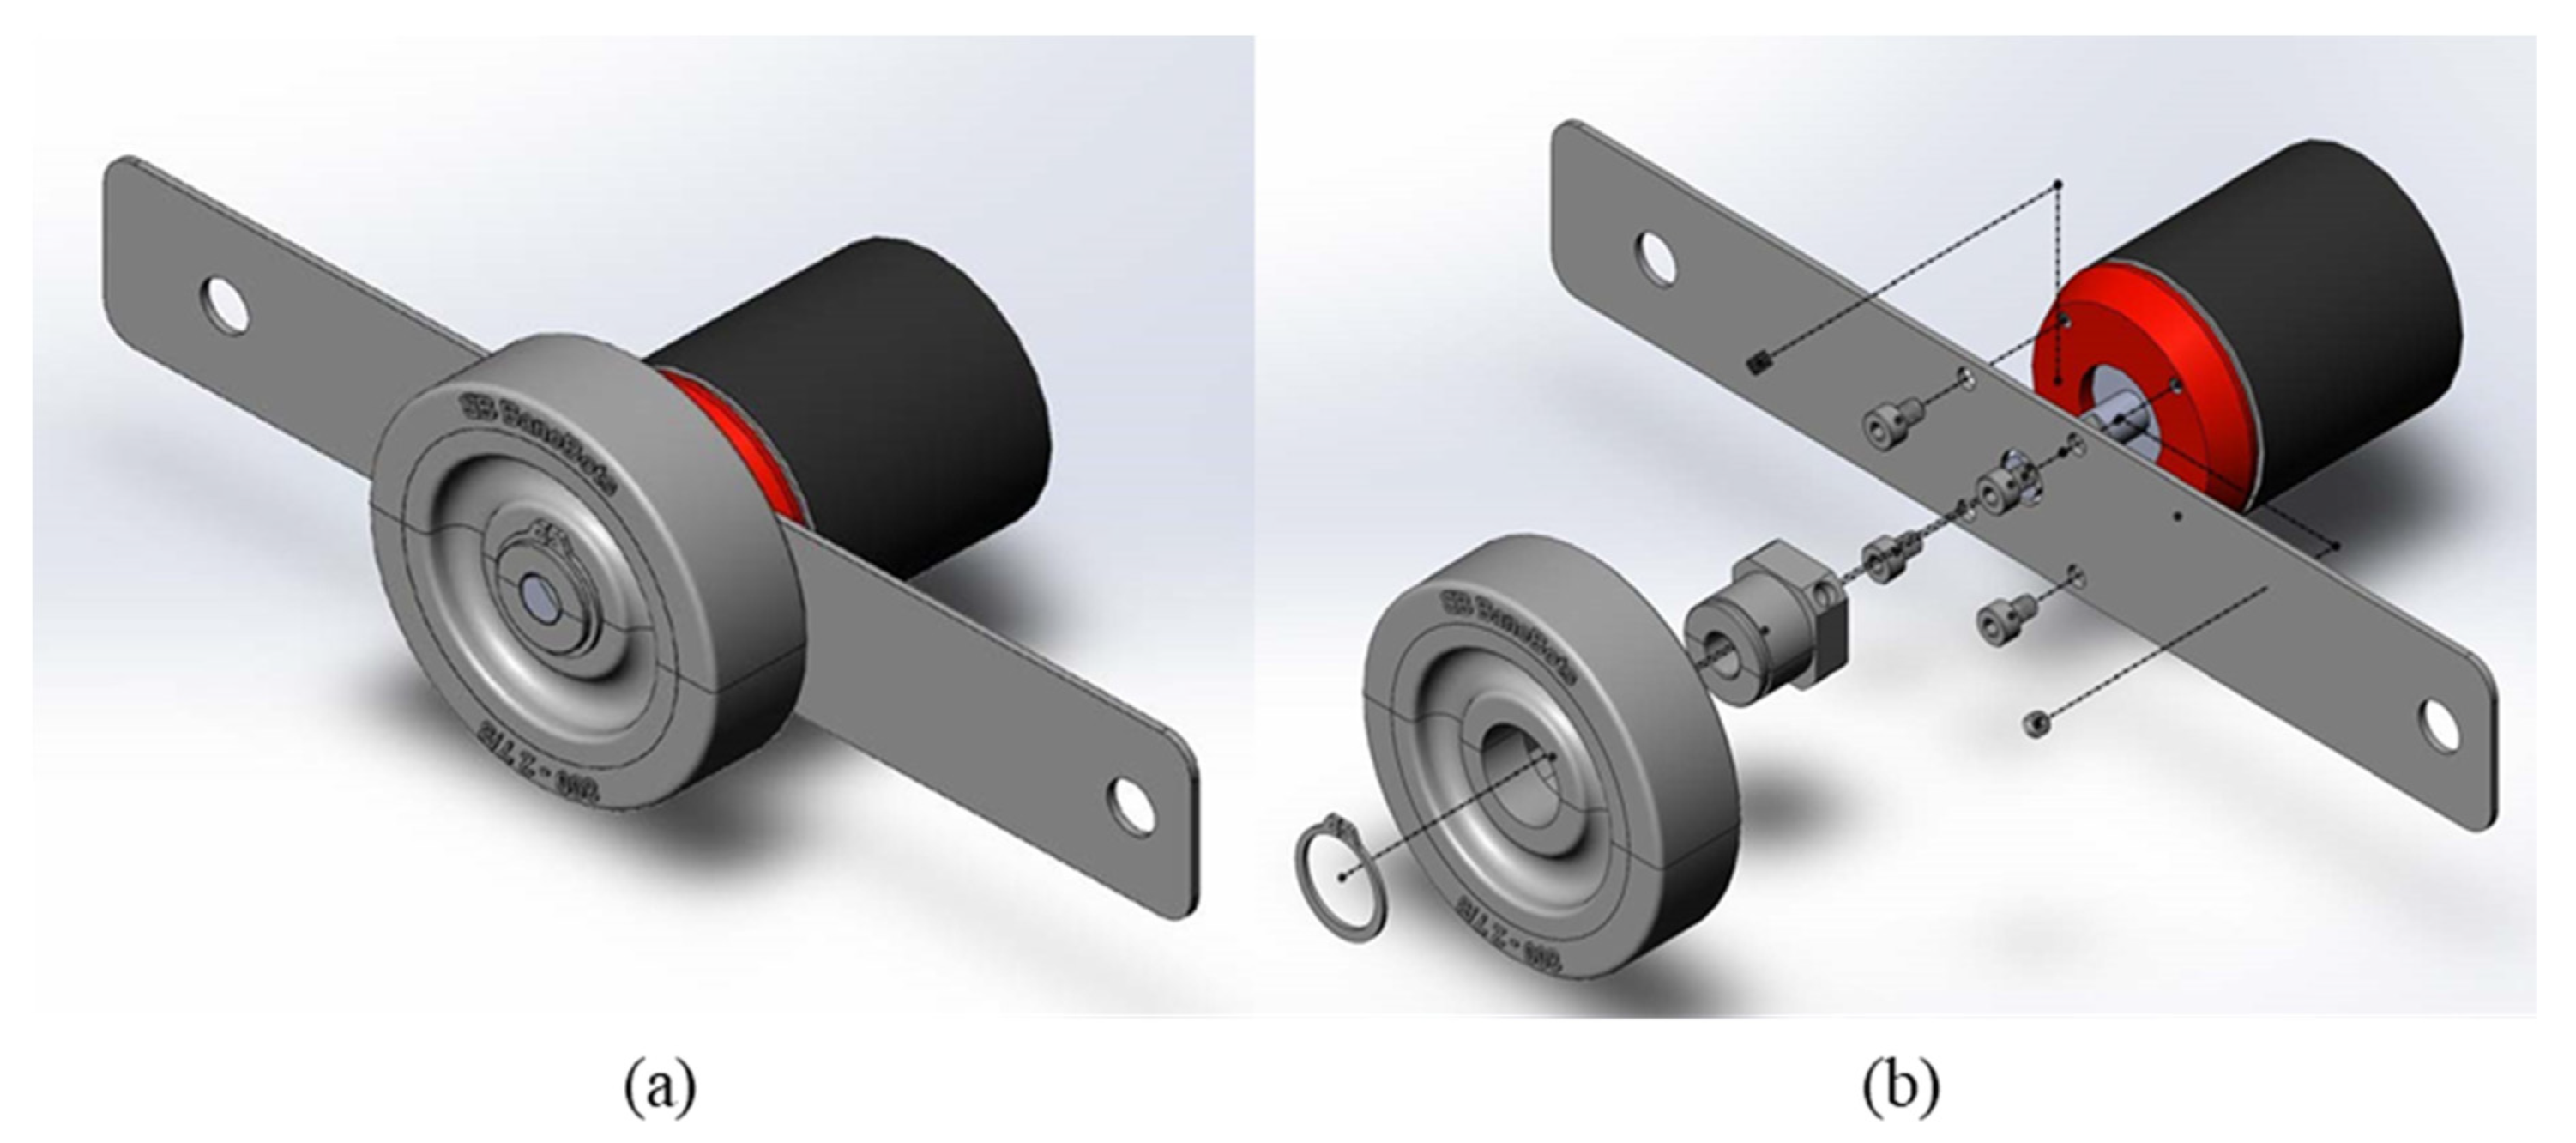
2.2.1. Motor Assembly

Figure 6 shows the motor assembly. Two flat sheet metal brackets are used to mount the motor to the spin bike. The bracket has four screw holes lining up with the hole patterns on the motor at 38 mm spacing. Four hex cap M4 screws are used to secure the motor to the bracket. To secure the Babebot wheel to the motor shaft, a T81 Hub was used. The hub comes with 2 set screws and a snap ring. First, the hub was secured with two set screws, and then the Babebot wheel was slid in and secured with the snap ring.

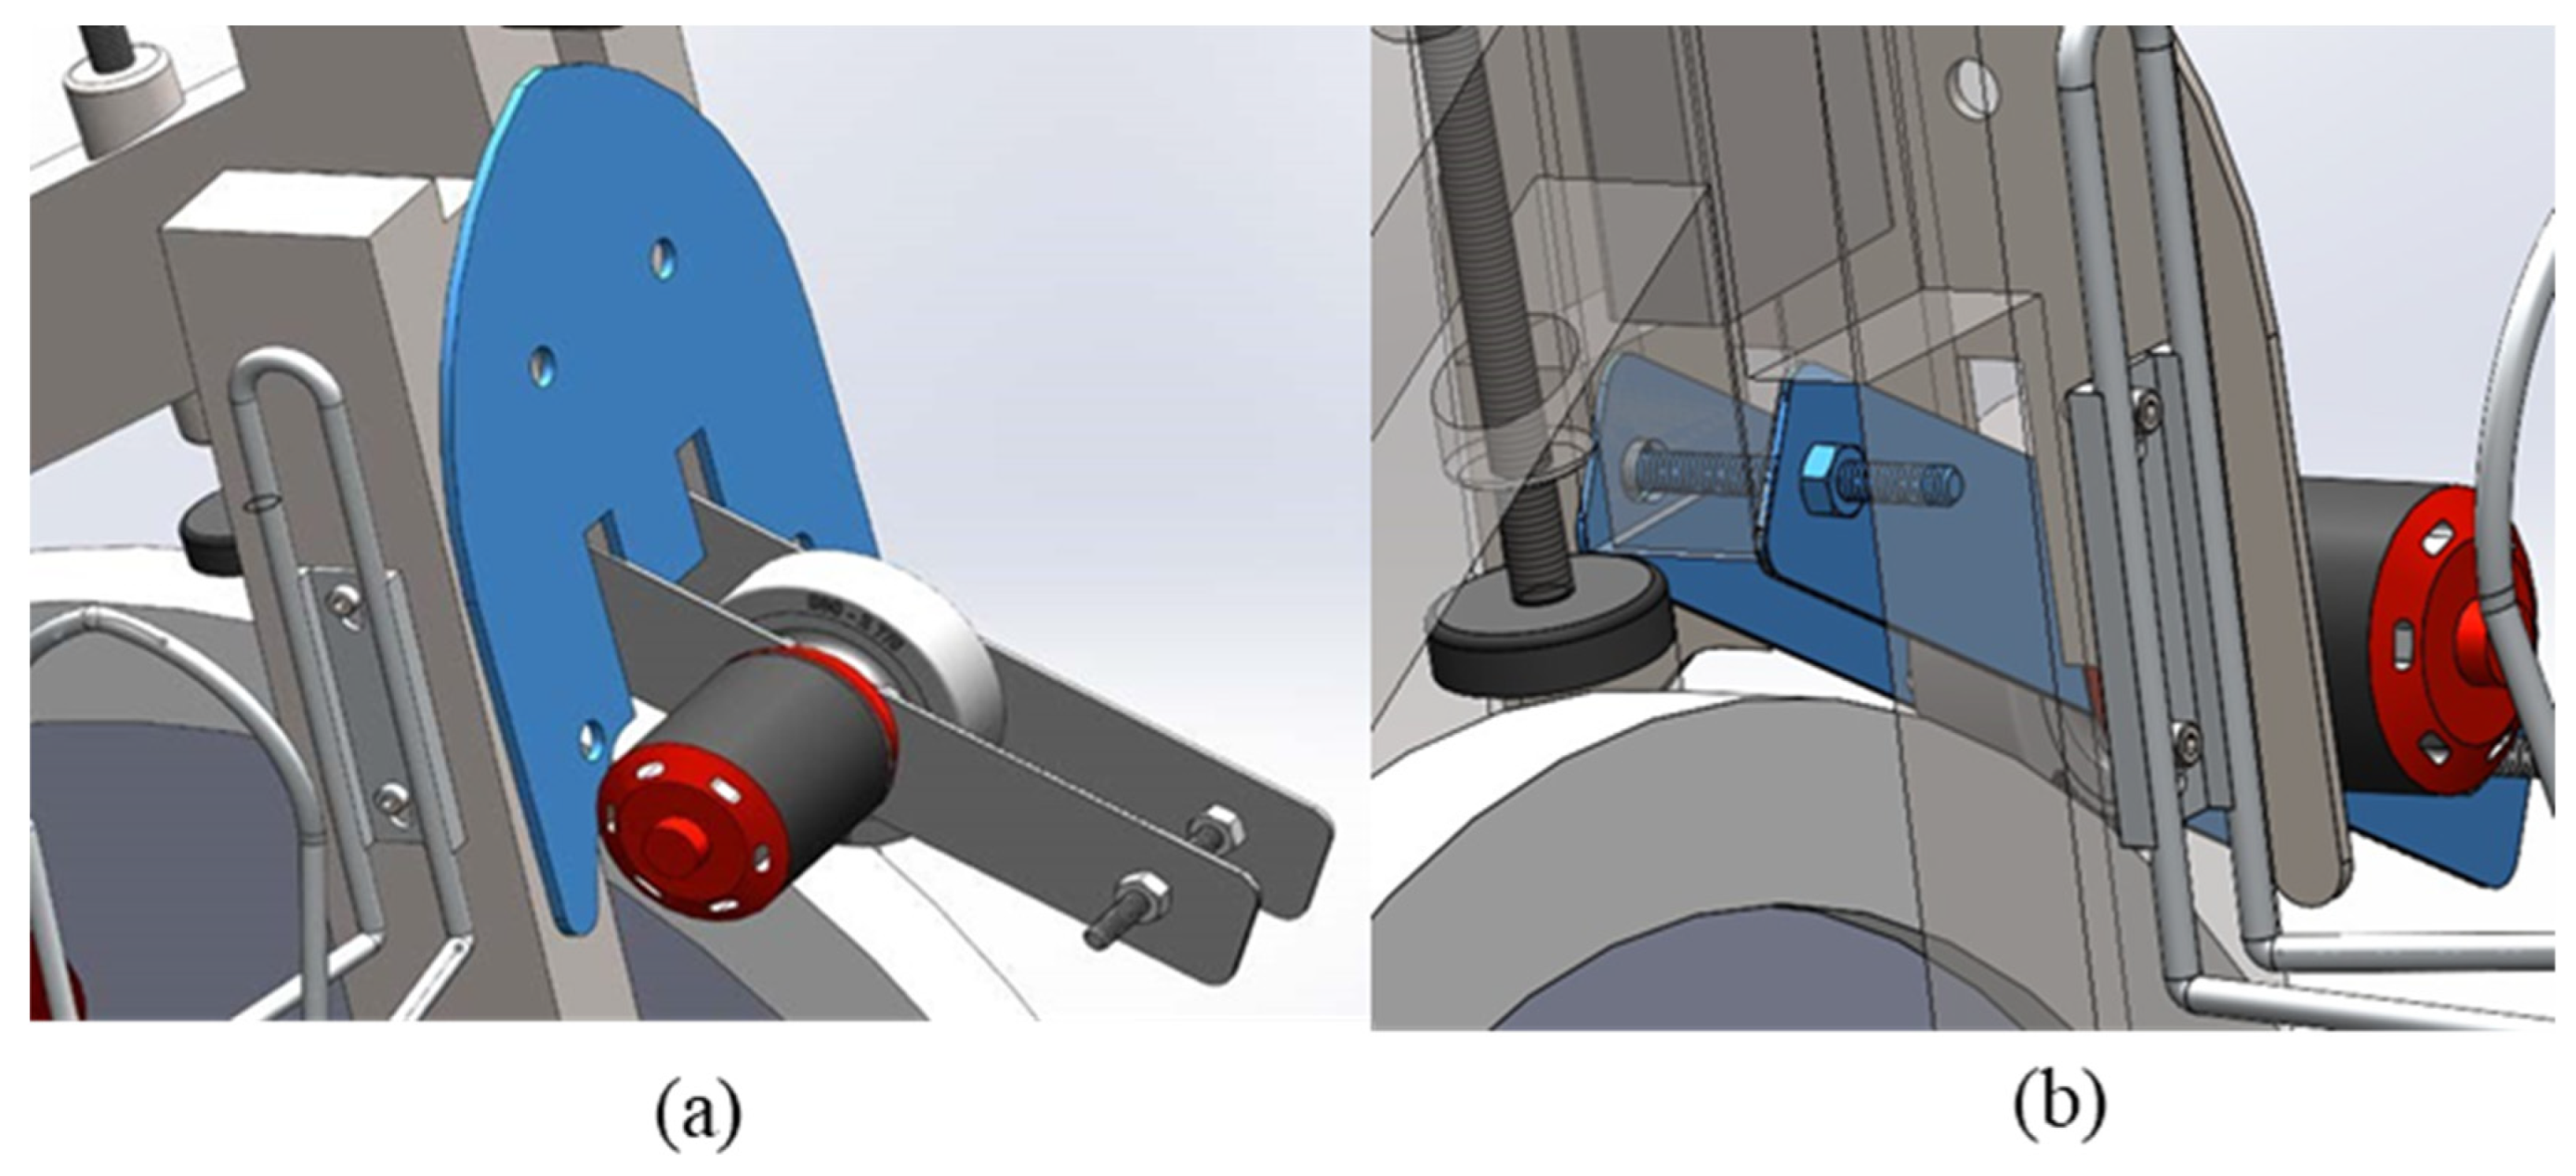
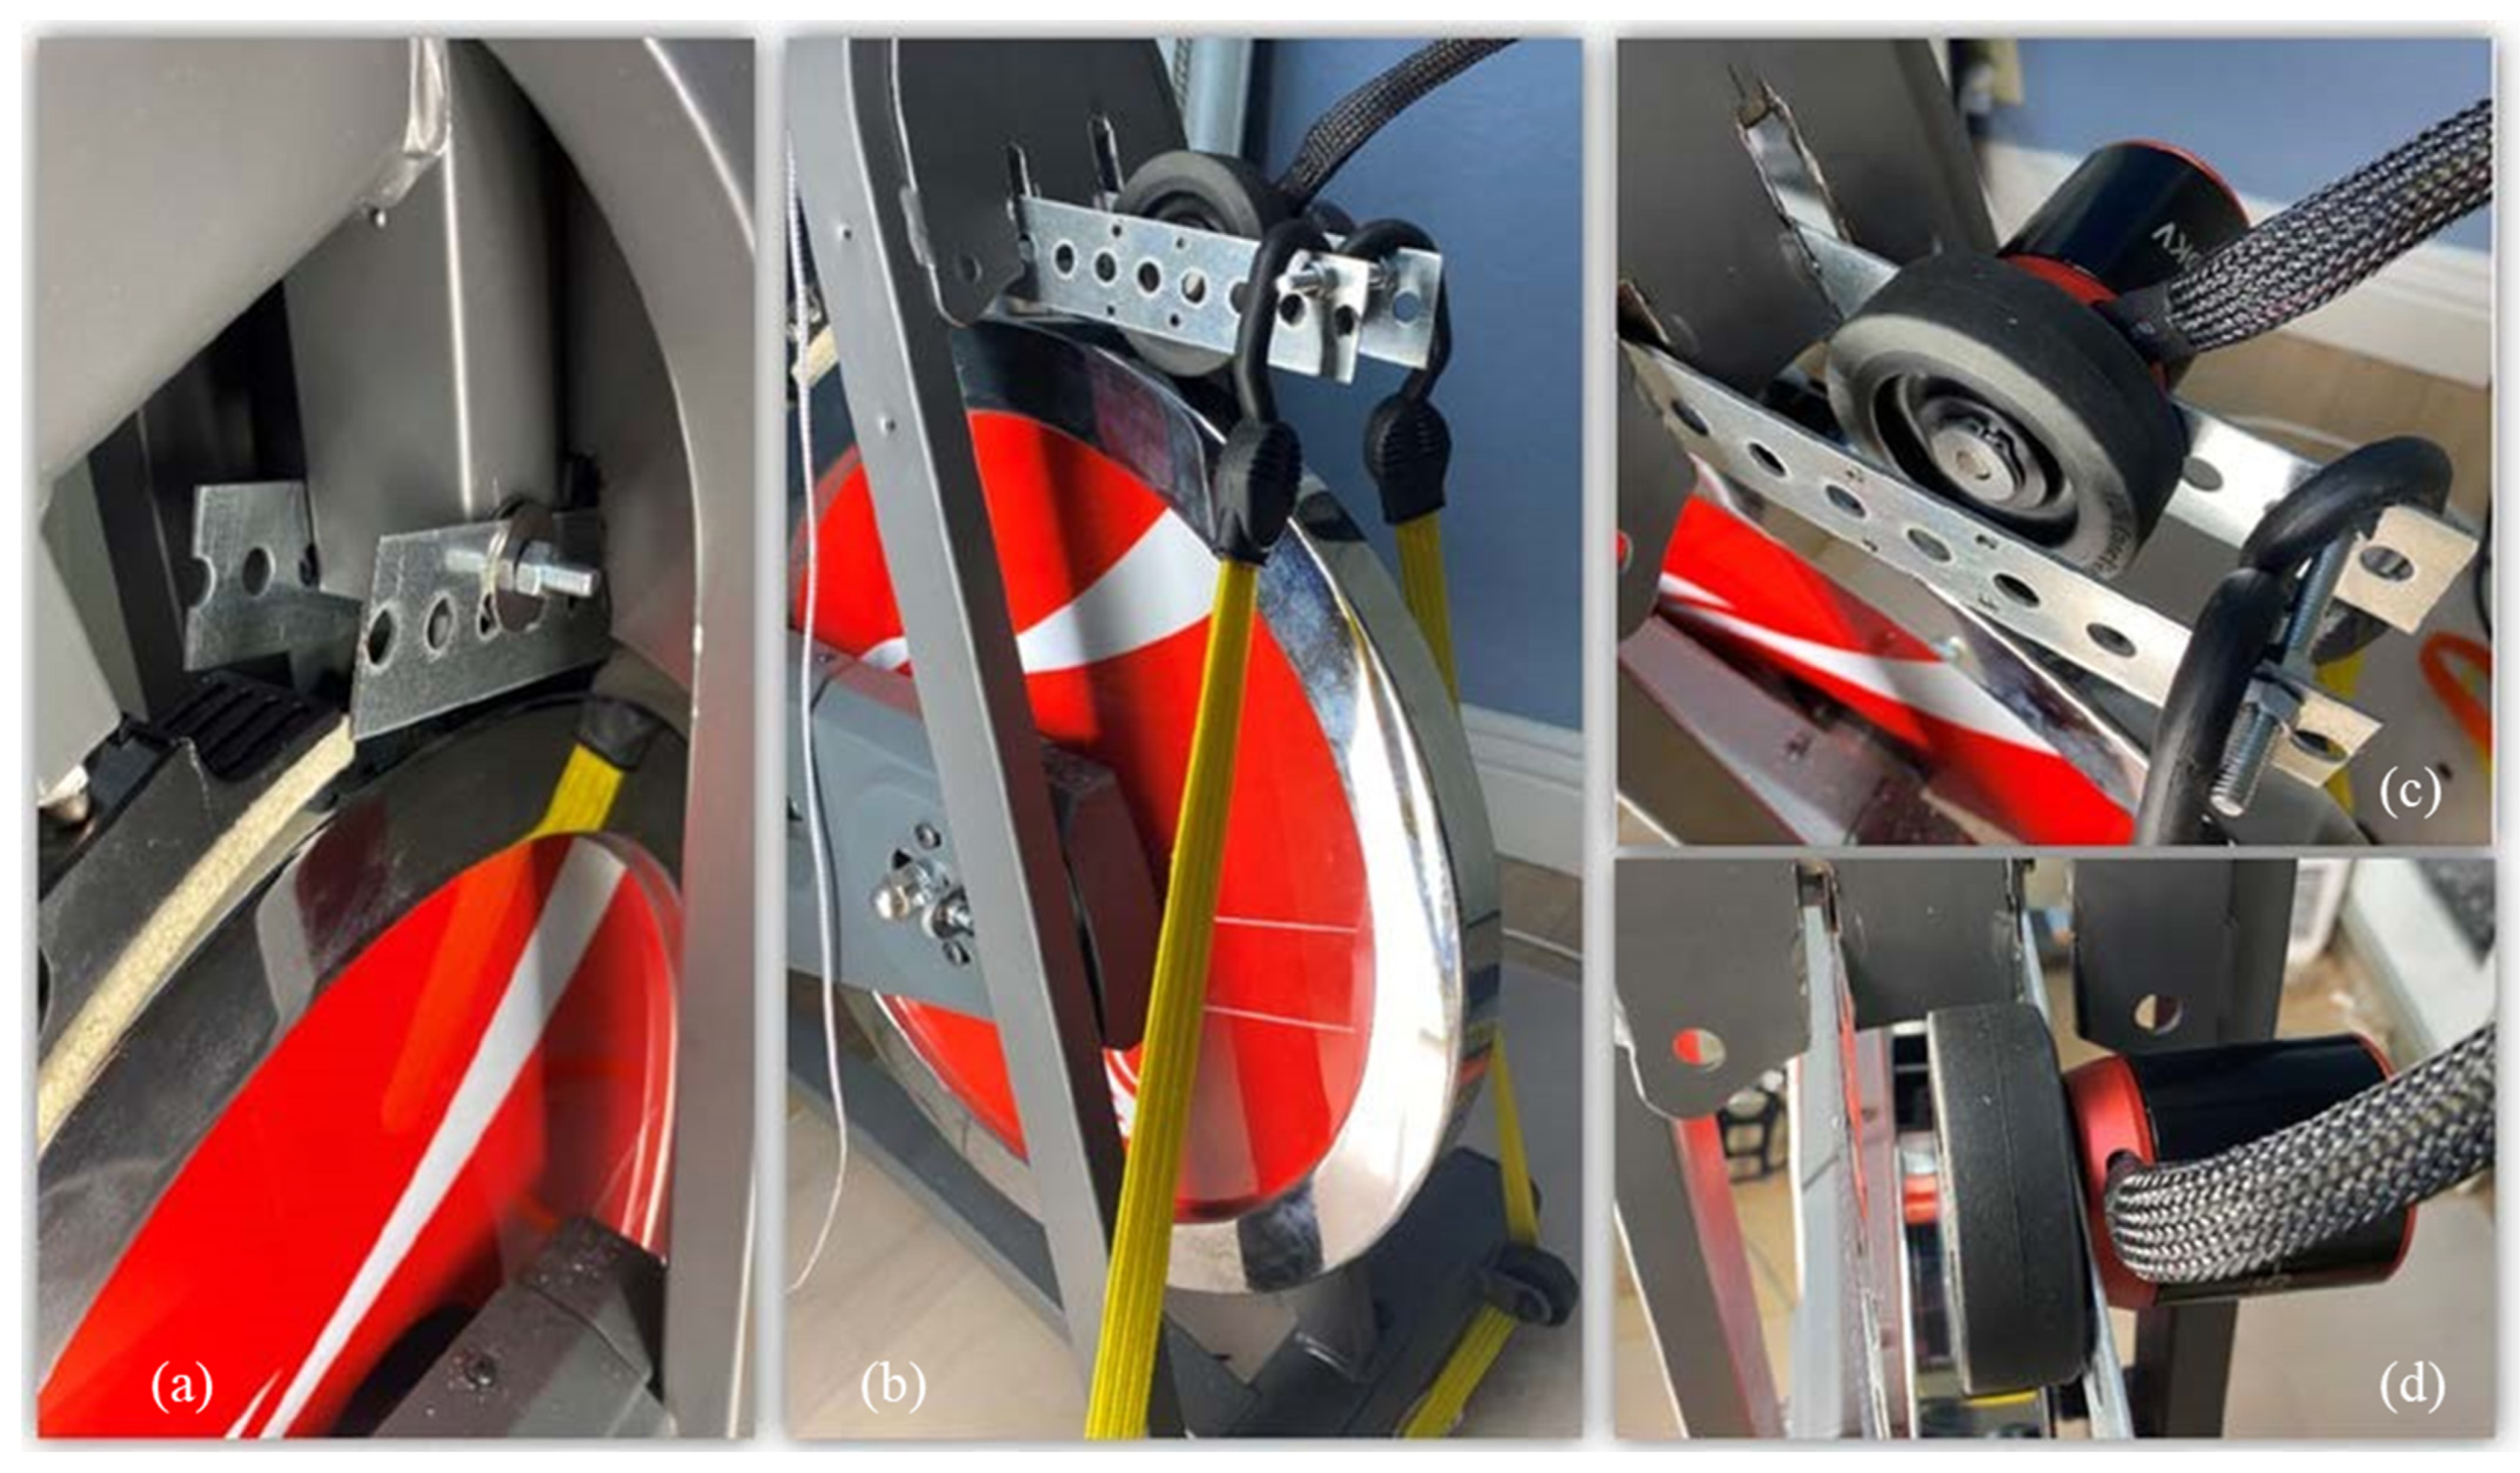
2.2.2. Mounting the Motor Assembly to the Spin Bike Frame

Modification to the spin bike frame is required to mount the motor assembly. The mount is shown in Figure 7. First, the metal frame is drilled through to mount the two parallel brackets with an all-threaded bolt. Access to the inside frame is obstructed, so a more extended drill bit is needed to drill the holes at an angle. It should be noted that this is the only modification needed on the original bike frame for the retrofit.
The front steel plate must be cut out to avoid interference with the motor bracket, as shown in Figure 8. An all-threaded bolt and three hexagonal nuts are used to keep the two flat brackets parallel. A bungee cord applies a radial force to the flywheel so the Banebot wheel does not slip.
The assembly in the finished prototype is shown in Figure 8.

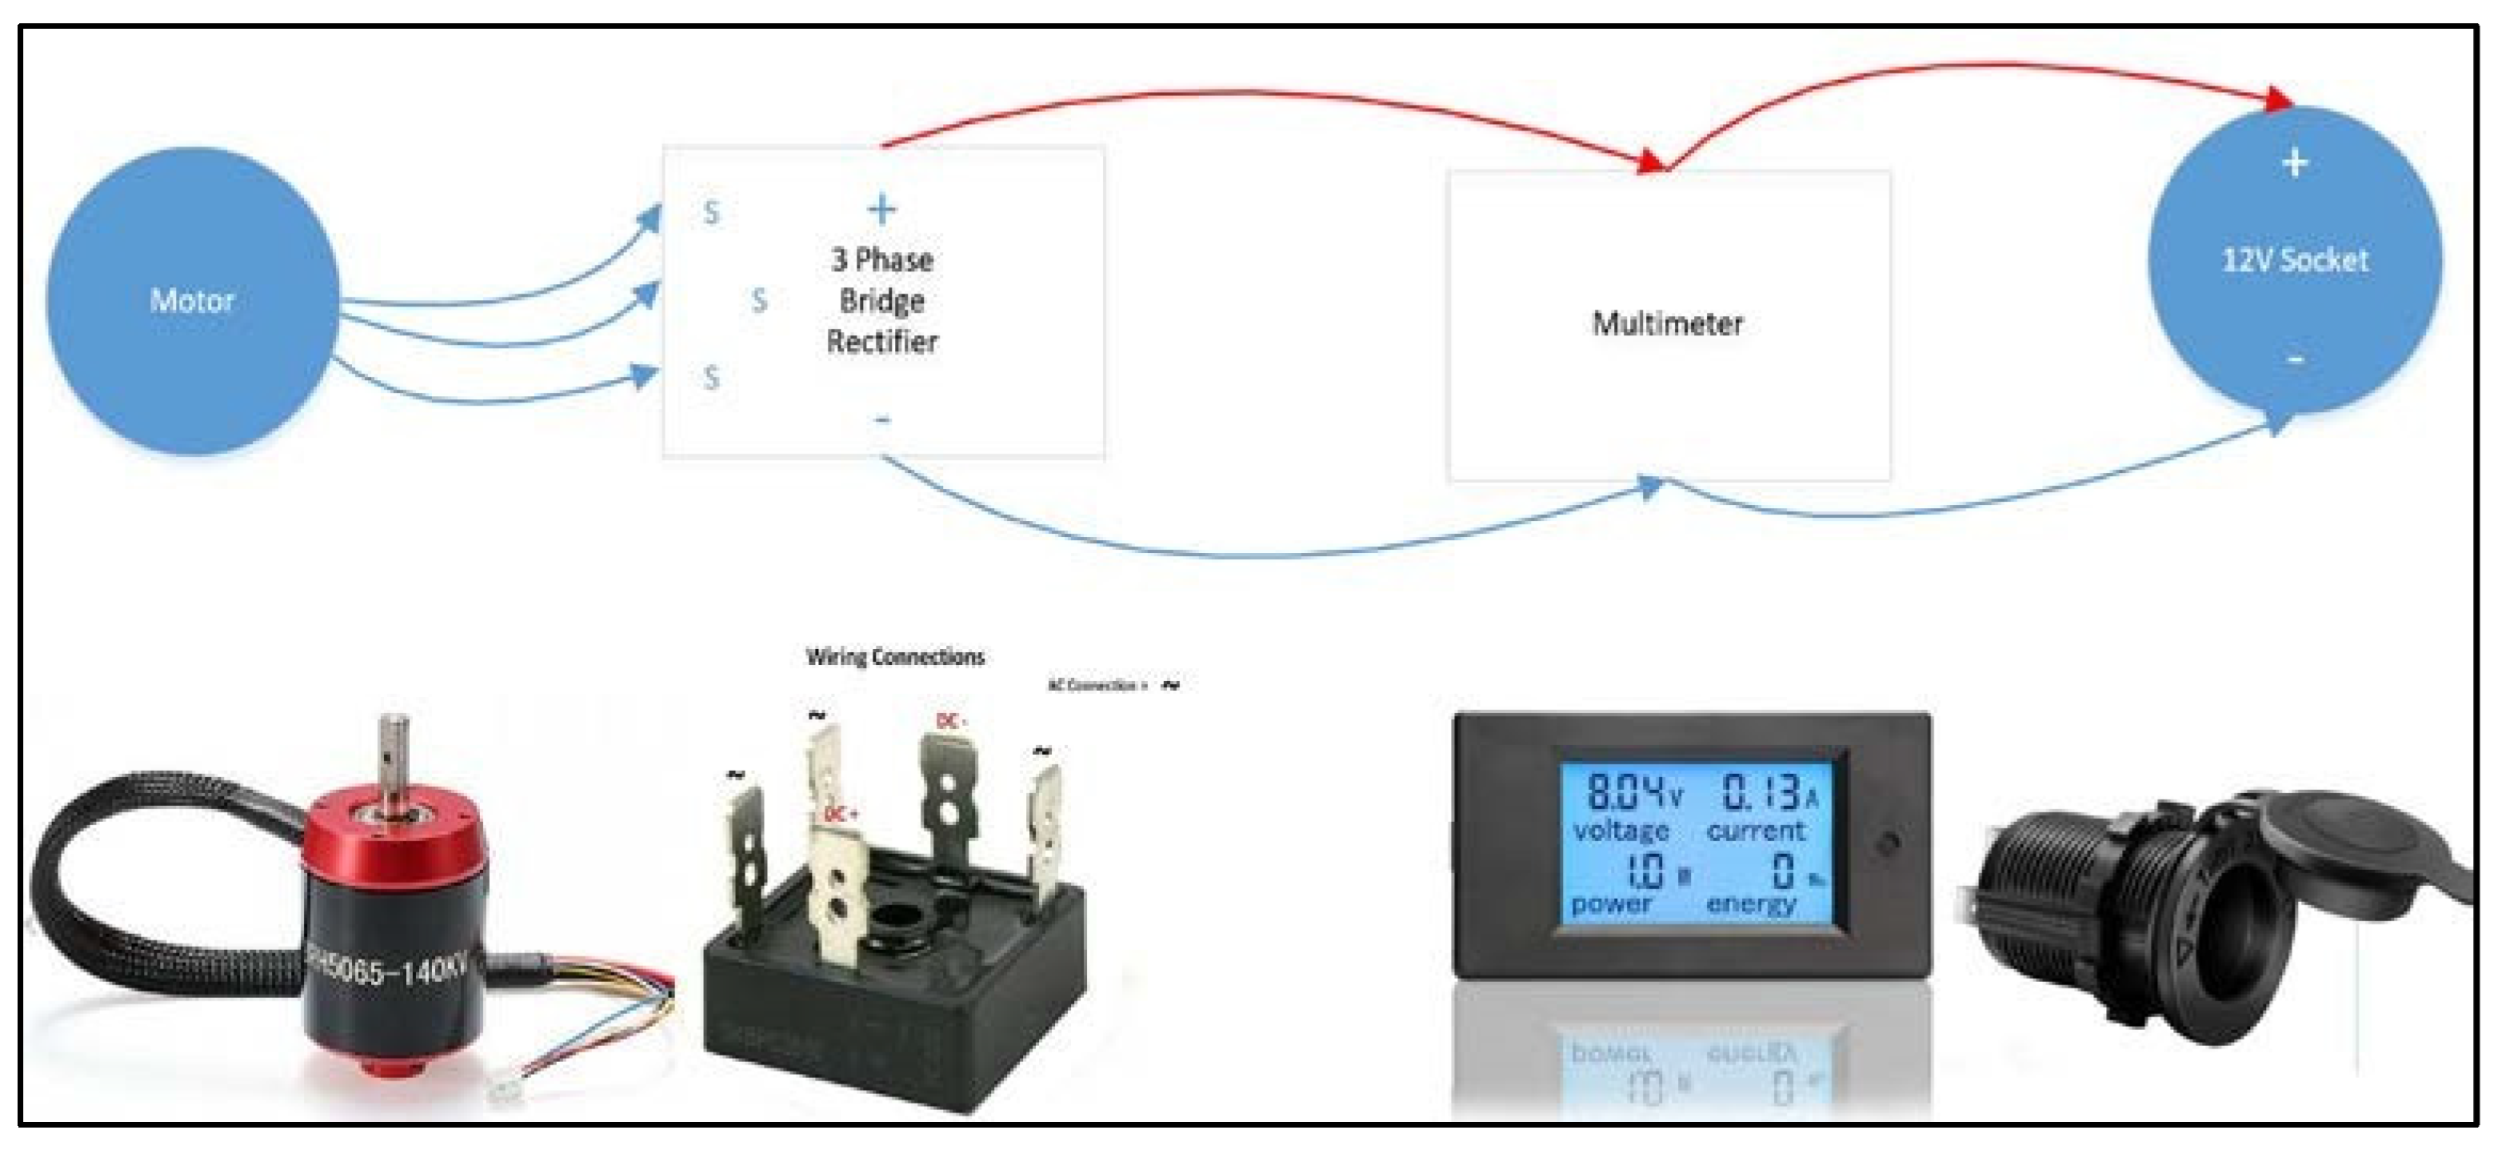
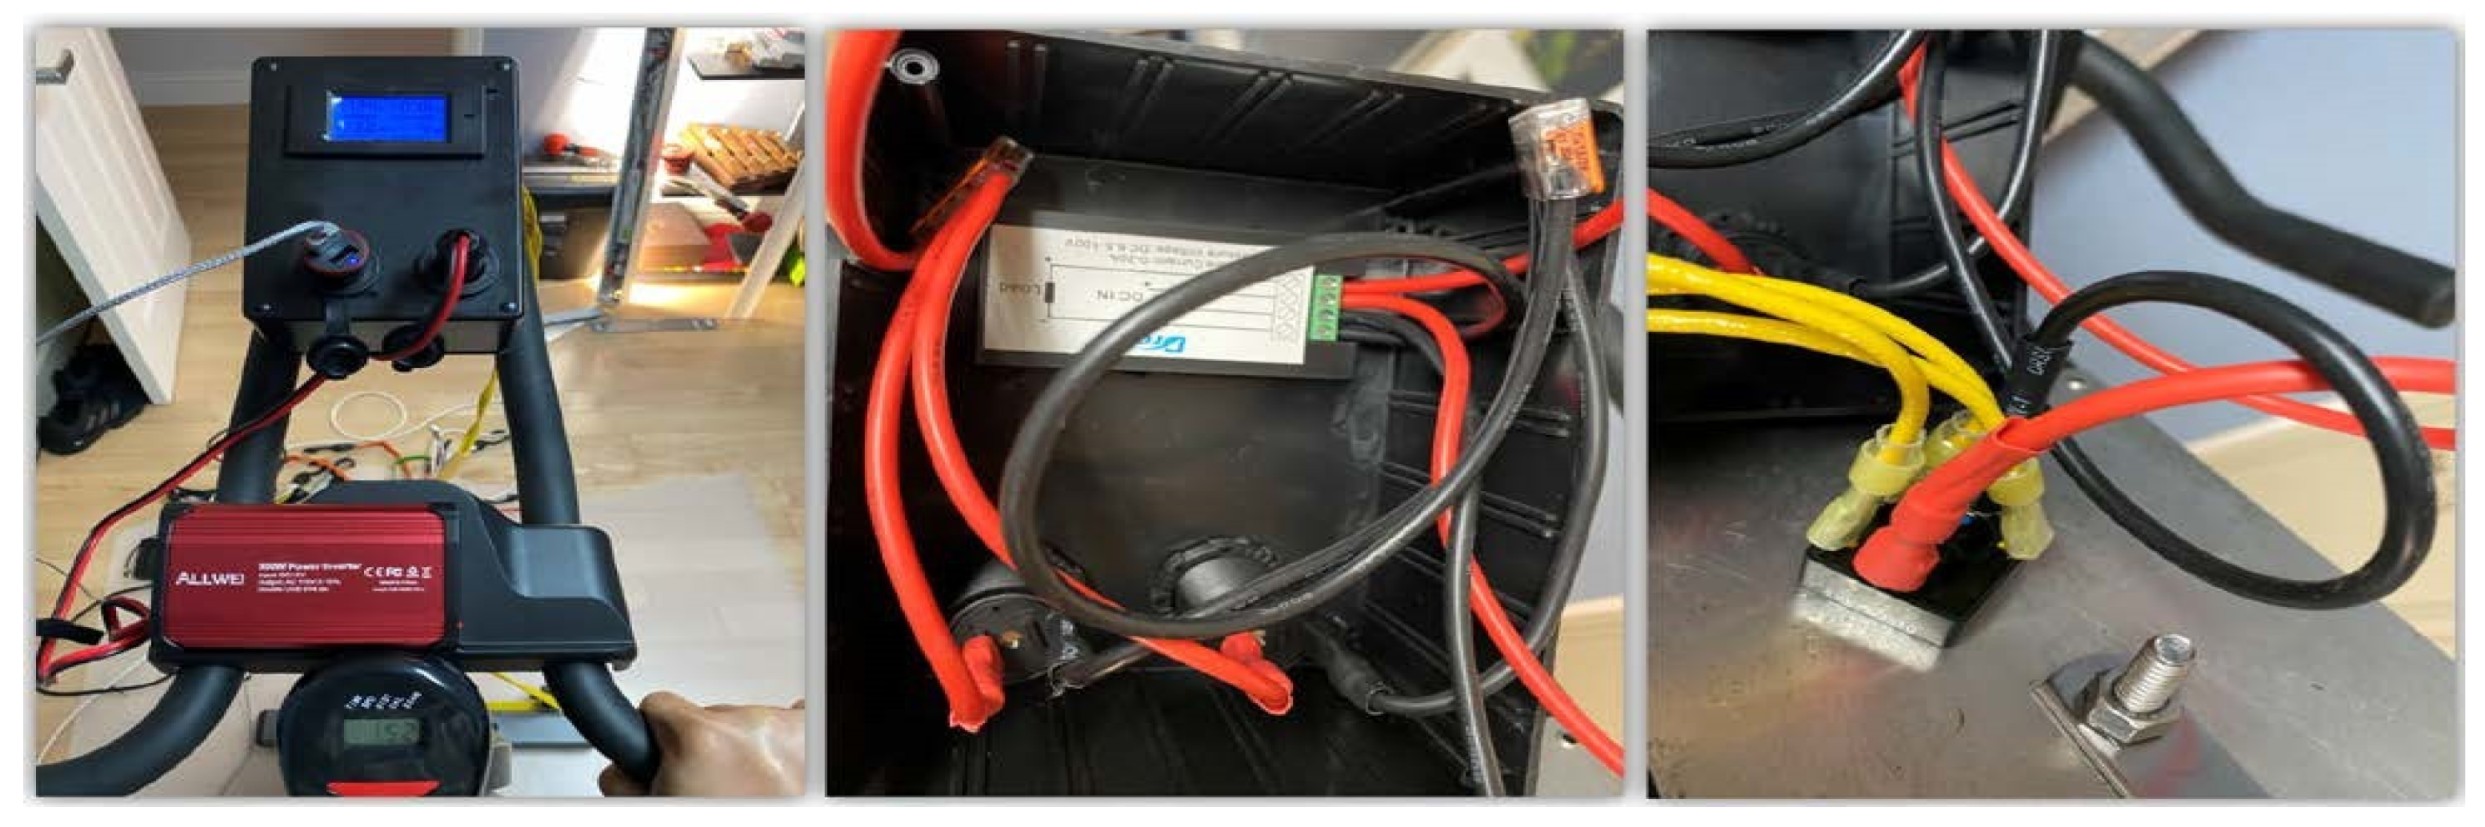
2.3. Electrical Components and Connections

The power generated can be converted to DC using a 3-phase rectifier. Figure 9 shows the simple schematic and components. The multimeter reads out the voltage generated when the motor is spun. The goal is to have 11–15 V recommended for car socket chargers and inverters. Devices can be charged or connected by using 12 V car chargers. The more devices are plugged in, the more power is required and hence more resistance.
A “RadioShack project box” is used to house the 3-phase bridge rectifier, multimeter, two 12 V sockets, and electrical wiring. A Dremel is used to cut out a rectangular slot of 45 mm × 86 mm for the multimeter. A 1.25” spade drill bit is used to make the two slots for the 12 V sockets. The wiring as completed on the prototype is shown in Figure 10.

3. Data Characterization and Comparison with Similar Work

3.1. The Setup

To power up or charge devices, and Anker USB charger is used. This 24 W dual USB charger can output 12 W per port and charge any mobile device or tablet. A Jackery battery pack is added to the system to harvest the excess power for future use. This battery pack has a carport charger that can be plugged directly into the 12 V car sockets. Connecting directly into the 12 V car socket is important to avoid power loss through another connection, such as an inverter. The inverter is used to connect any appliance that requires 110 V AC.

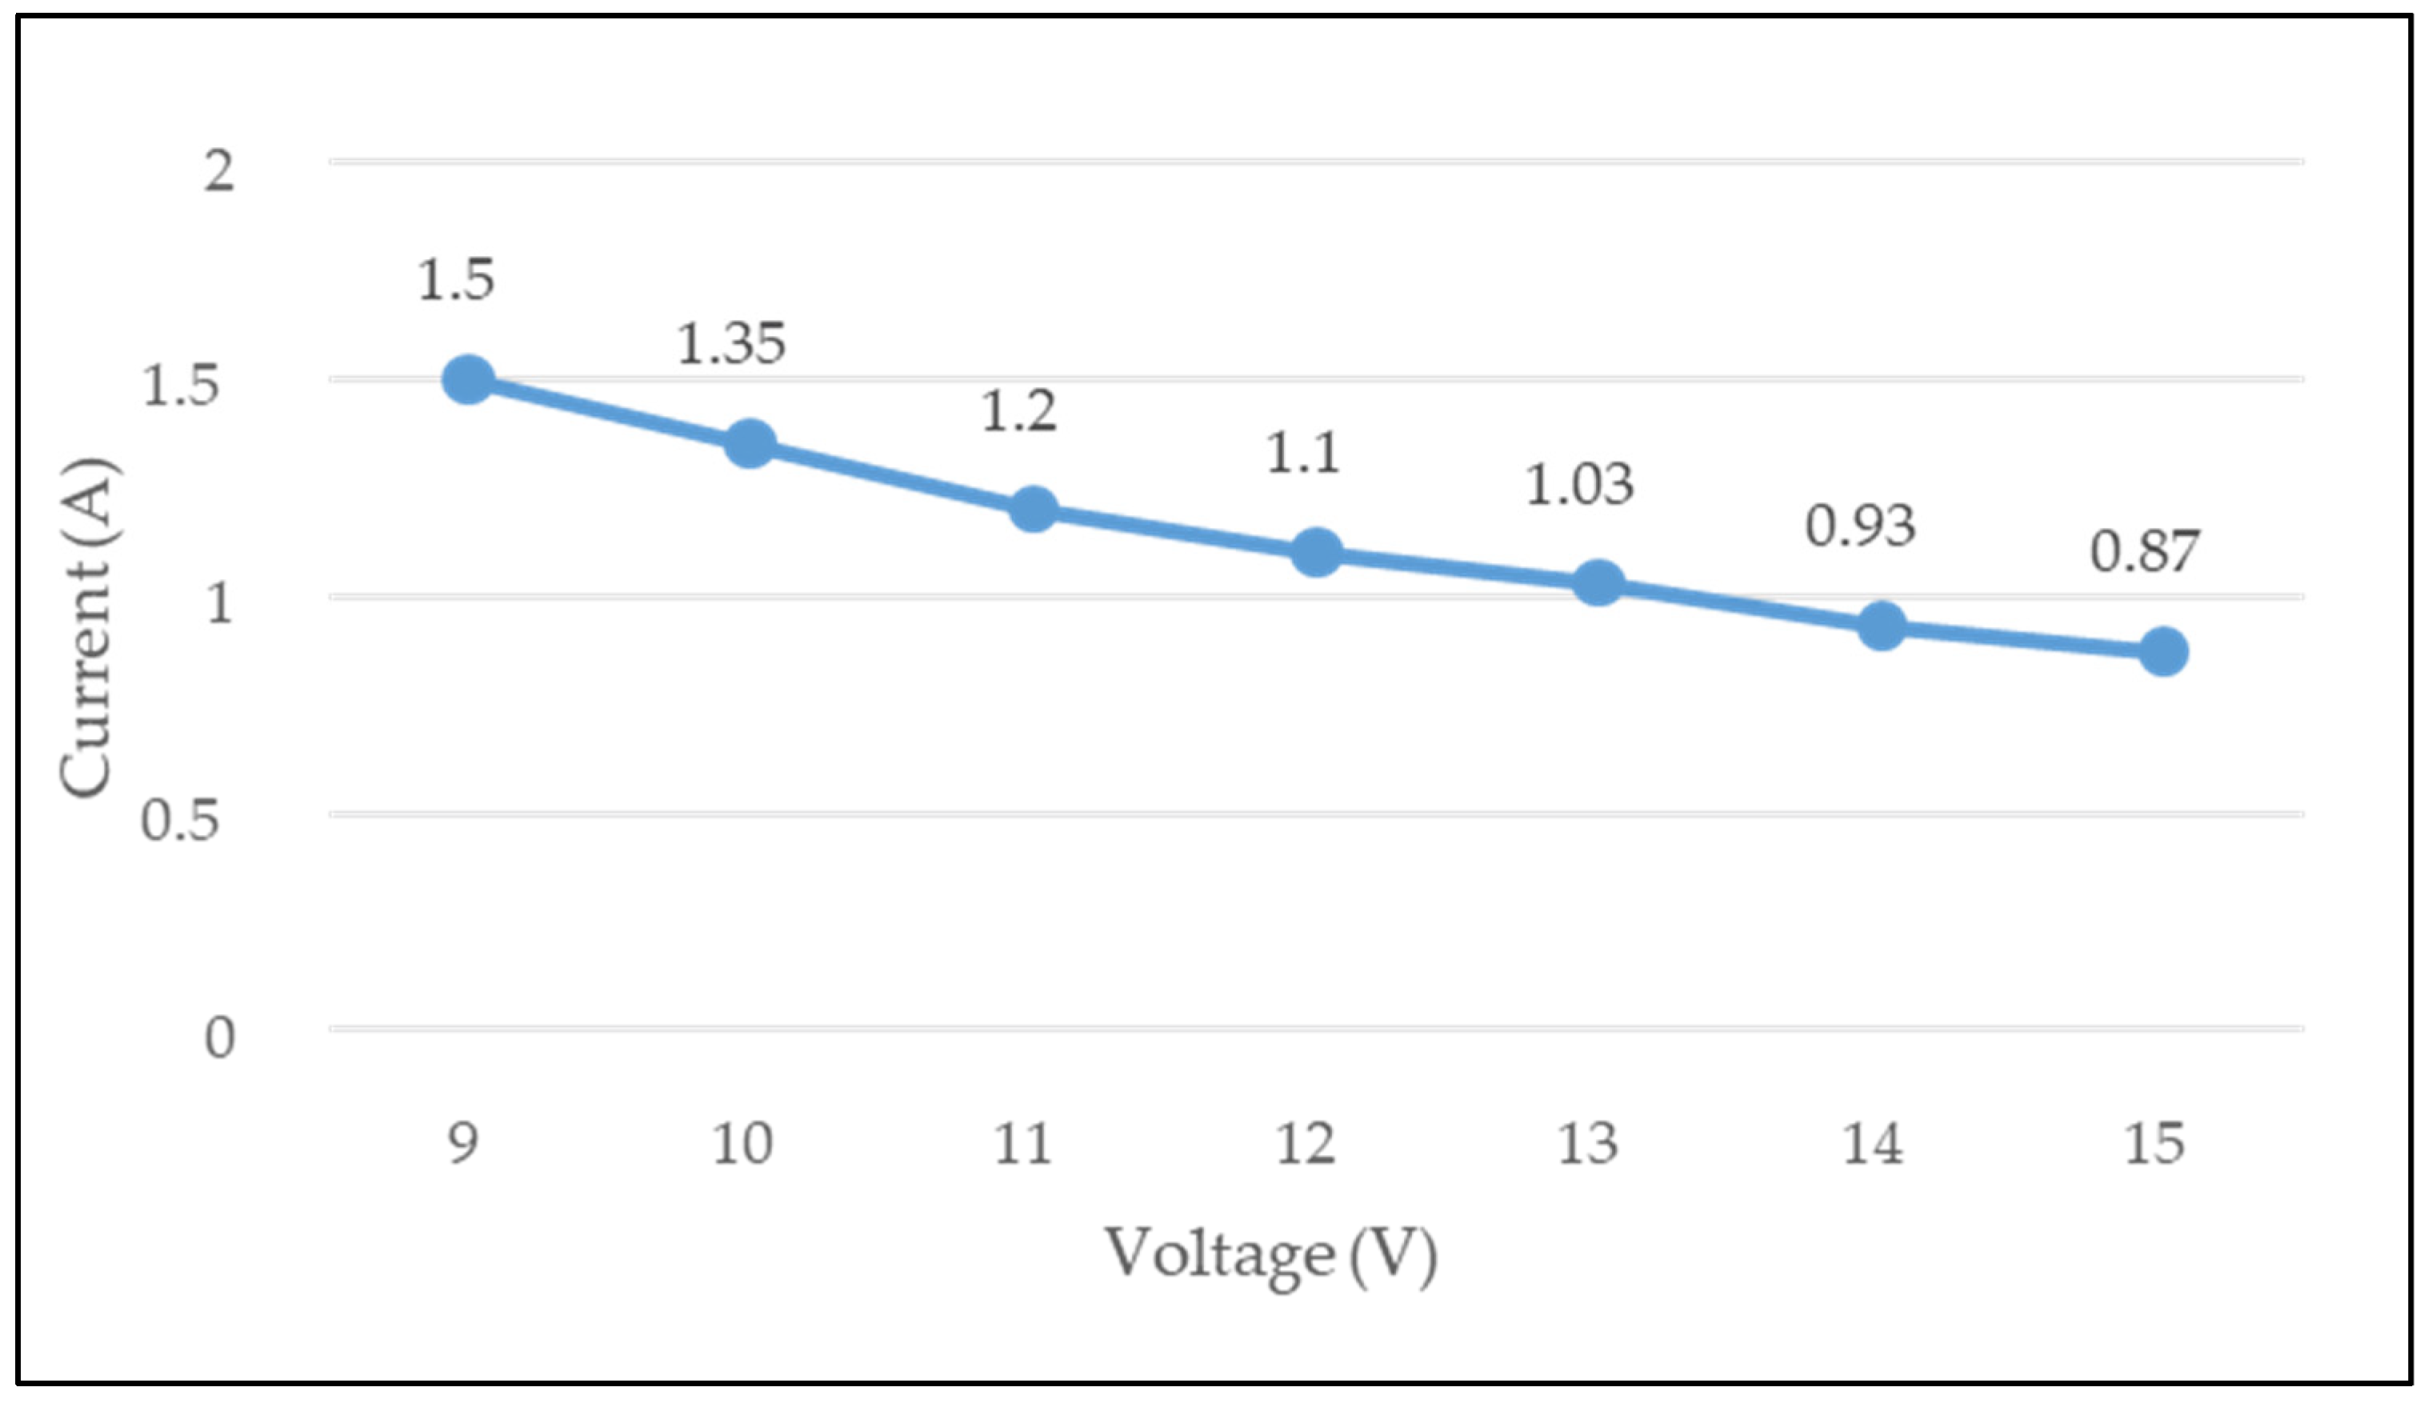
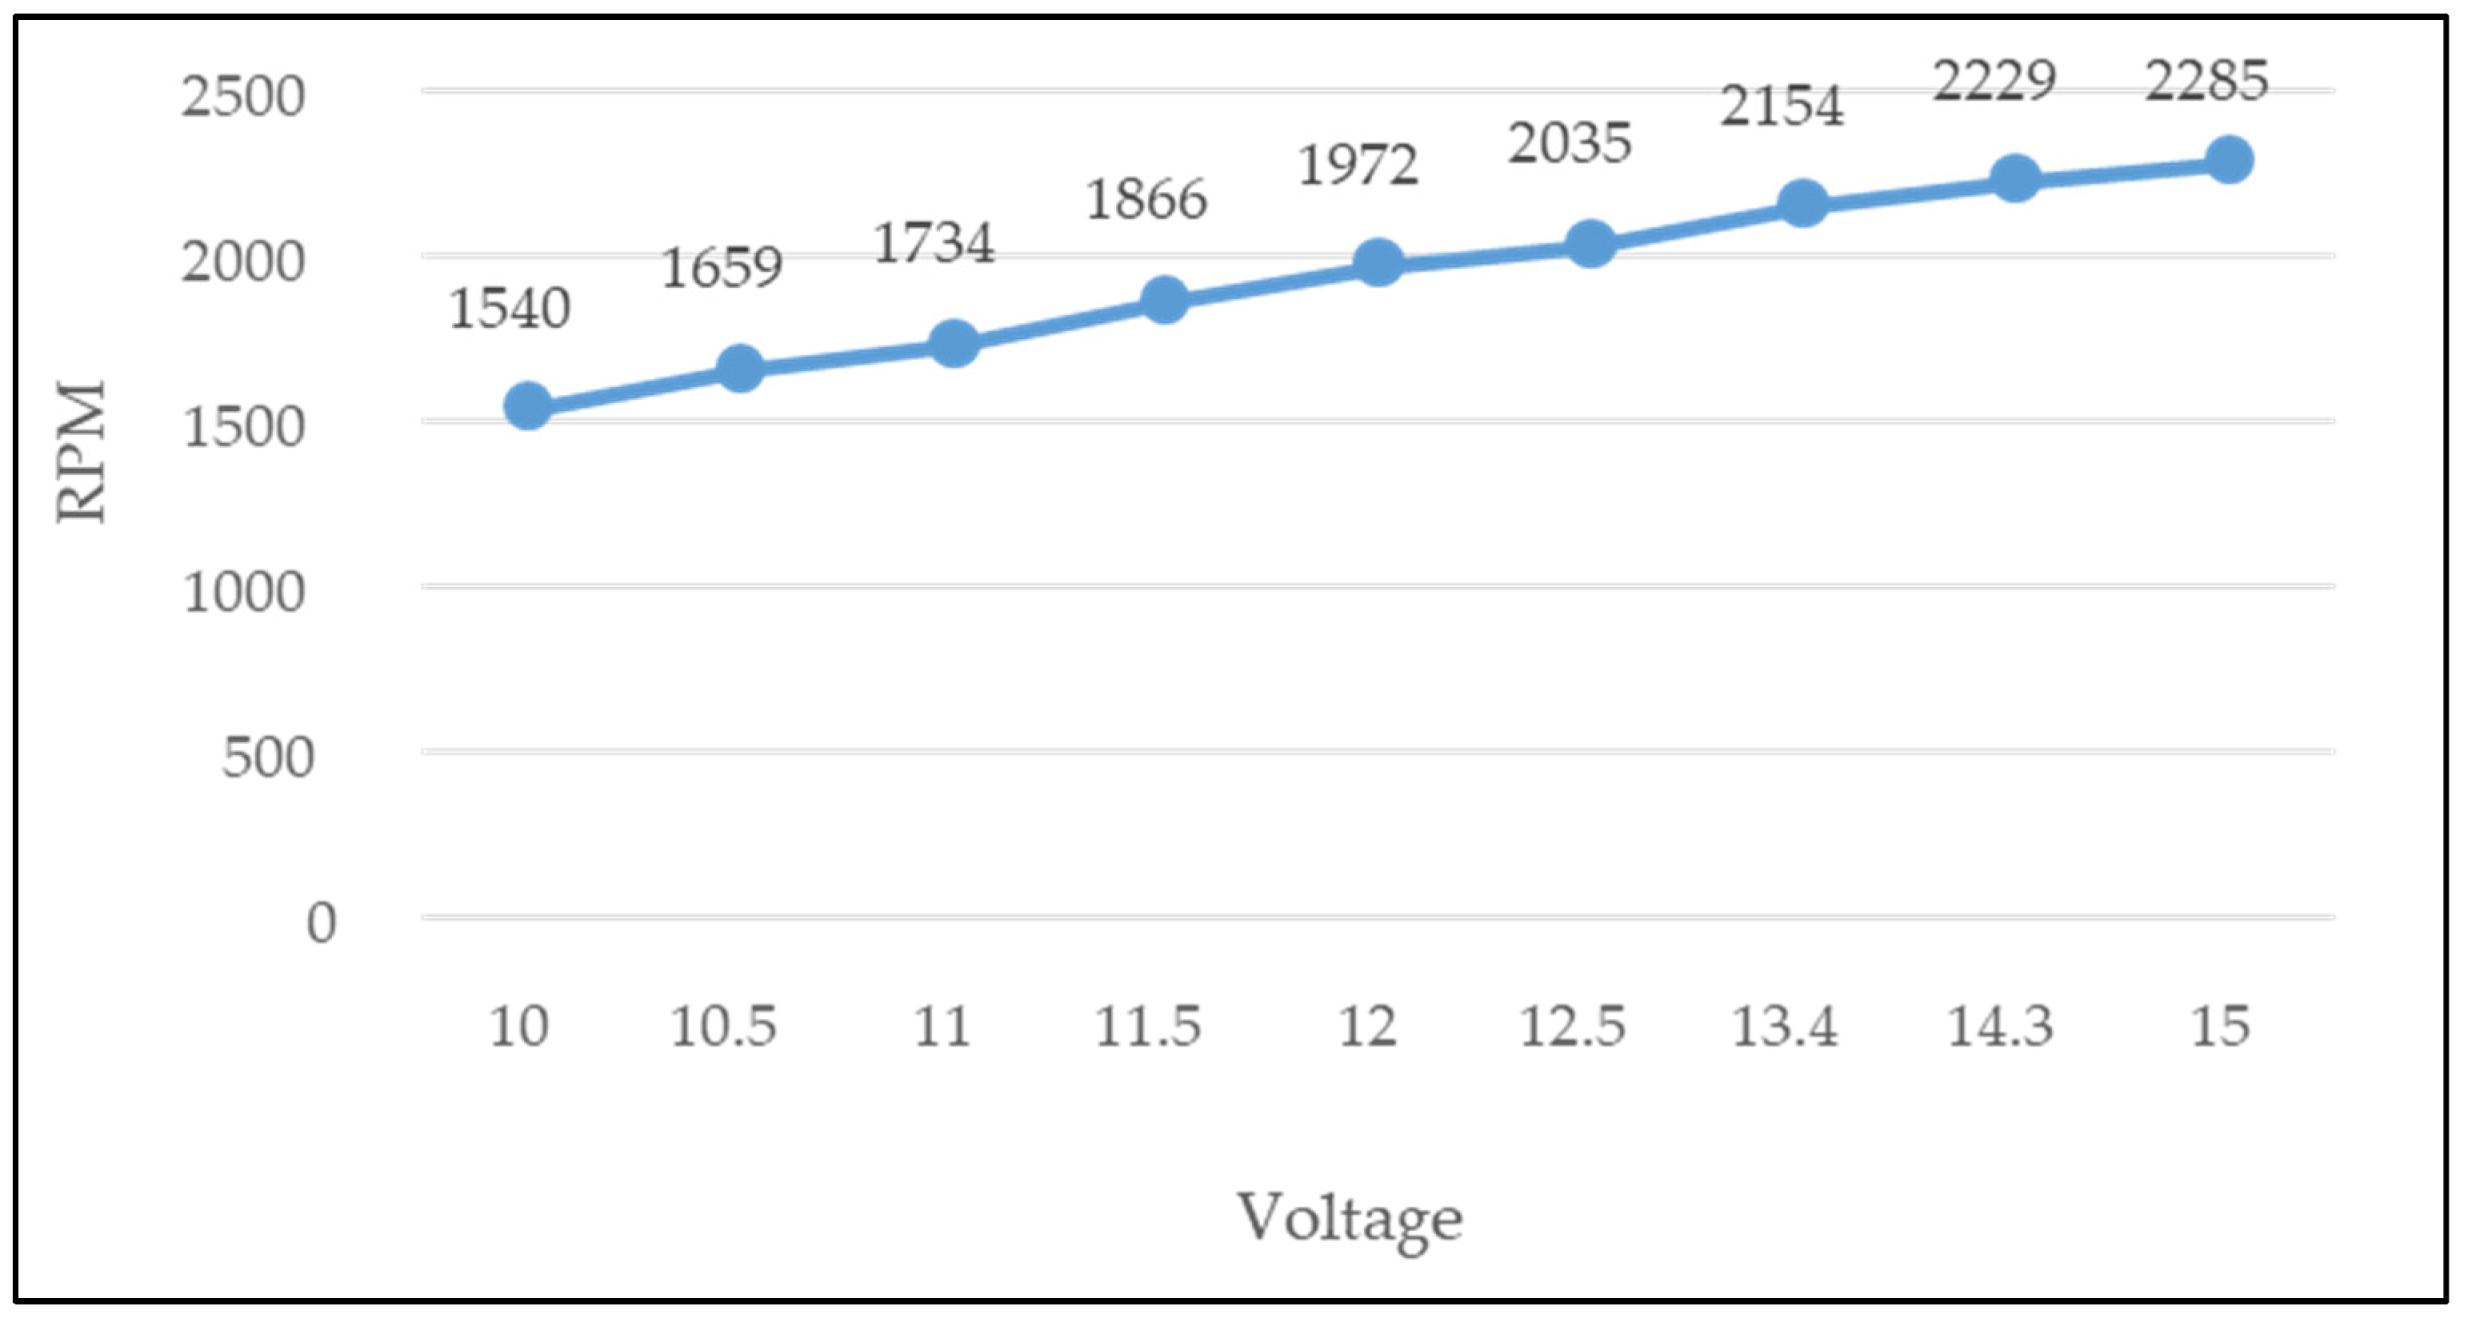
3.2. Results and Discussion

An experiment was conducted with ten participants to evaluate the system’s performance. The sample size was restricted primarily due to the global pandemic (COVID-19). All critical data parameters were recorded, such as exercise duration, input calories, output voltage, current, power produced, and devices percentage charge. All the data points are tabulated in Table 2. Of the eleven participants, ten rarely do or never do any cycling exercise. Fifty percent of the participants said they never go to the gym and rarely do any exercise. The other half of the participants do some kind of exercise but rarely do any cycling exercise. Only one participant (trial #11 and trial #12) is a weekend biker who just picked up the sport for six months.
A basic setup with one iPhone 11 Pro Max and one Jackery, 240 Wh Battery pack, is connected to the system for the first seven trials. The more devices are plugged in, the more power draw required and hence a higher resistance the peddler will feel. With one iPhone and one Jackery battery connected seems to be the sweet spot resistance that most participants think they can pedal for 15 to 30 min without taking a break.
The raw data obtained from the experiment were compared against the theoretical calculations using the Coulomb-count method. According to the Coulomb count method, the state of charge at time t (SOC@t) is equal to the charge at the current time (t−1) divided by the total capacity. The rated charge capacity (Qnominal) for an iPhone 11 Pro Max is 16.8 Ampere-hour (60,480 Coulombs).
S O C @ t = S O C @ ( t 1 ) + I @ t   Δ t Q n o m i n a l  
For example, assuming that the battery charge is at 0% at time t = 0,
S O C @ 15   m i n = S O C @   0   m i n + 4.34   A 0.25   h 16.8   A   h = 6.46 %
From Table 2, the battery is only charged to 3% at 12 min with the current shown on the multimeter. This translates to an efficiency of approximately 46% for the system. Please note that the charge percentage of the iPhone is offered only in whole numbers, and fractions are not available at any given time. Following the same method, theoretical calculations are performed for all the trials, and the results are shown in Table 3. The last column shows the experimental values. It is observed that the retrofit design can perform energy harvesting at 40–50% efficiency consistently.
It is observed that the USB charger always produces a constant output of 13 W. Measurements are taken for every 1 V output increment from 9 V to 15 V (Figure 11). If the voltage increases, the current draw decreases so that the total output is always around 13 W. The charging rate is the same even though the peddling speed is faster. So, the percentage charged is limited by the charger capacity. According to the specification, each USB port is rated at 12 W. However, the recorded data showed 13 W, 8.3 percent higher than the specification. With more advanced technology and newer mobile devices released with much higher battery capacity, it is necessary to have a portable charger with higher output. It is recommended to add a higher-rated charger to take full advantage of our pedaling power for future design iterations.
A digital tachometer is used to record the flywheel’s rotational speed, which is used to calculate the motor’s rotational speed. Figure 12 shows the result of voltage generated vs. the motor RPM.
Theoretically, to generate 12 V, the motor should spin at the speed of 1680 RPM. The recorded value at 12 V is 1972. This is expected due to the energy loss in the motor and 3-phase bridge rectifier. So, from the motor to the AC-DC conversion phase, there is a loss of 17.4%. Energy loss is present in every stage, from production to storage. We can expect another 5–10% loss at the 12 V socket connection, 15% in the battery storage, and another 15% if the inverter converts DC to AC. Losses can be minimized by reducing the number of electrical connections and using mechanical links wherever possible. One of the main reasons a Jackery battery storage is used is its 12 V car socking charging option. This eliminates the inverter from the equation, which saves 15% efficiency.
For the participants who do not exercise regularly, charging an iPhone and the Jackery battery pack is enough resistance to allow them to pedal for 15 to 30 min continuously. For one participant who bikes every weekend, charging two iPhone 11 Pro Max and the battery pack is an easy task. Two iPhone and the battery pack is drawing about 65 W. According to the participant who does cycling weekly, charging two iPhones and the battery pack is about the same as riding his bike on a leveled street. The more devices are plugged in, the heavier the resistance. To make it an actual workout for the subject, the two iPhones are replaced by a desktop electric fan at a “high” setting. This is drawing a total of 115 W. According to the subject, this setting is similar to going upwards on a steady hill. The subject was able to pedal for 30 minutes straight without any exhaustion. The participant reported the ability to continue for an hour in this setting.
Of all the 11 participants, 4 participants generated 13 to 14 V, while four others generated an average of 11.5 to 12.5 V. Three participants generated an average of 10–11.5 V. The voltage distribution is shown in Figure 13. If a person pedals at a speed that only generates at around 11 V, the energy is only enough to charge the iPhone. When the pedaling rate exceeds the one corresponding to 12 V, the excess energy will go to the battery pack. The iPhone charging speed is constant since the output wattage of the USB charger is maxed out at 13 W.
On the other hand, the faster-pedaling speed, the faster the battery pack is charged. Since the battery pack can accept a wide range of voltage from 12 V to 30 V, there is no risk of damaging the battery pack. However, if the inverter is used, the optimal voltage range when using the inverter is 12 to 15 V. An integrated circuit in the inverter protects the inverter from overcharge or undercharge devices. This theory is validated by pedaling at a breakneck speed that generated 20 V, and the inverter shut off the circuit temporarily. After about 30 seconds, the rate is reset to under 15 V and the inverter is turned back on.
Figure 14 and Table 4 show that in the first ten trials with an average of around 12 V, the Jackery battery pack can be fully charged in about 9 h, which is slower than the charging time of 7–8 h stated by the manufacturers if it was charged via a regular AC outlet. However, if we can pedal fast enough and consistently generate 13 to 14 V, the battery can be charged more quickly than plugging into the wall outlet at less than 6 h to completion (Table 5).

3.3. Comparison with Existing Studies

While multiple papers in the literature attempted to develop energy harvesting exercise systems, studies that presented numerical data to demonstrate their effectiveness are scarce. In this subsection, the performance of our Banebot-based exercise bike energy harvester is compared against two other systems developed previously: the design proposed by Anyanwu and Anthony [39] (referred to as “design A”) and the bicycle power generator design by Patowary, et al. [40] (referred to as “design B”). Both the designs use belt drive for transmission of rotation from the flywheel to the generator. In contrast, in the design of the Banebot, friction drive transmission has been employed with rotary preloading, ensuring adequate traction between the flywheel and the motor. Moreover, unlike in the case of Designs A and B, there is minimal energy loss in the BaneBot’s transmission as there is no belt or chain drive.
Both designs A and B have the hind wheel of the setup modified into a flywheel by eliminating the rubber and other parts on the upper surface of the wheel’s rim. The Rim’s upper surface comes in contact with the belt for the pulley arrangement between the flywheel and generator. The flywheel operates like any bike’s hind wheel, employing a chain and sprocket mechanism to transfer the movement from pedals into rotation of the flywheel, causing transmission losses both in the chain drive and belt drive. Moreover, these designs made use of traditional road bikes for their setups, unlike in the case of Banebot, for which a stationary exercise bike has been used, which consists of a heavier flywheel, making the design even more energy-efficient and stable. Figure 15 shows a comparison of the RPM-voltage characteristics of all three designs.
For design A, the scatter plot is almost linear, whereas the variation in voltage is higher comparatively. The voltage in the battery changes from 0 to 24 Volts within 800 RPM of the flywheel. Moreover, the battery selected for Design A is a 12 V DC battery, while the voltage being produced to charge that battery is 24 Volts, which can cause the battery life to depreciate, and depending on the usage frequency, the battery can even die out in a few hours or days. Considering an upgrade to a bigger battery for Design A, the experimental data collected is still impractical for long-term usage, as the Voltage readings are extremely RPM sensitive, which indicates that an experienced biker who rides at higher speeds can wreck the battery in a matter of hours, causing flames or explosions.
For design B, the voltage readings are not as sensitive as those of design A. There is a steady increase in voltage in a linear fashion, which is optimal for battery charge. The Voltage recorded up to the maximum possible speed (4000 RPM) on that particular equipment is under 22 volts. The alignment of the dots in the series indicates a steadier battery charge comparatively. This closely resembles the plot of the experimental data from the BaneBot. It can be observed from the plotted data that the BaneBot produced higher voltages with lower fluctuation in comparison to the Design B. Considering the transmission losses, the battery charging fashion, and battery life assumptions from the results, in comparison, it can be concluded that the BaneBot is the optimal design of the three options.

4. Design Optimization

4.1. Modularity Design

A modular design approach was taken when redesigning the power generator system. The goal is to have the power generation and conversion features added to the existing spin bike without any modification to the spin bike. Modularity will also speed up the factory assembling process and reduce the overall cost of manufacturing the product. The final product will have two main modules: the motor assembly and the control box for AC-DC conversion. The modules will be connected via a single wire harness with an MT30 connector. Minimum assembly is required to mount the motor assembly to the flywheel and secure the control box to the spin bike frame. All the subassemblies and electrical wiring will be readily assembled and tested before packaging and shipping to customers.

4.2. Components to Be Manufactured

To lower the material and labor costs, the following list gives components that need to be designed and manufactured:
  • The control box housing will be an injection-molded ABS. ABS is used for its nonconductive property to prevent users from getting an electrical shock during operation.
  • The mounting plate allows the motor assembly to be easily attached to the spin bike frame and flywheel.
  • Motor mount bracket with holes’ footprint matches that of the motor footprint.
  • The control box base will be made from sheet metal. This will help dissipate the heat from the 3-phase bridge rectifier.
  • MT30 Wire harness allows for modular connection between the motor assembly and the control box. This will save substantial assembly time for not having to solder the wires into the connector.
The rest of the components can be found off-the-shelf either from online retail stores or directly from the manufacturers.

4.3. Plastic Injection Molding Design Considerations

The control box houses the voltage meter, the 3-phase bridge rectifier, the electrical connections between them, and the 12 V sockets. This housing will be made of ABS using a plastic injection molding manufacturing process. The reasons for choosing plastic molding are:
  • Injection molding is the cheapest process at scale for plastic
  • Consistent, repeatable reproduction of a part
  • Mid to high-volume manufacturing
  • The greatest variety of materials, colors, and configurations
  • Can handle a variety of sizes and shapes
  • Custom cosmetics from polish to texturing
There are many design considerations to be considered when designing parts for plastic injection molding, including the tolerances, type of materials, surface finishes, draft angles on part surfaces, wall thickness, bosses, ribs, gussets, and fillets [41].

4.4. Design for Manufacturability and Assembly (DFMA)

Design for Manufacturability and Assembly (DFMA) is a tool that product designers use to eliminate waste and inefficiencies at various points of the product development process [42]. Boothroyd Dewhurst DFM Concurrent Costing tool [43] was used to understand each part’s manufacturing costs. The software interface of this tool has three areas, as shown in Figure 16:
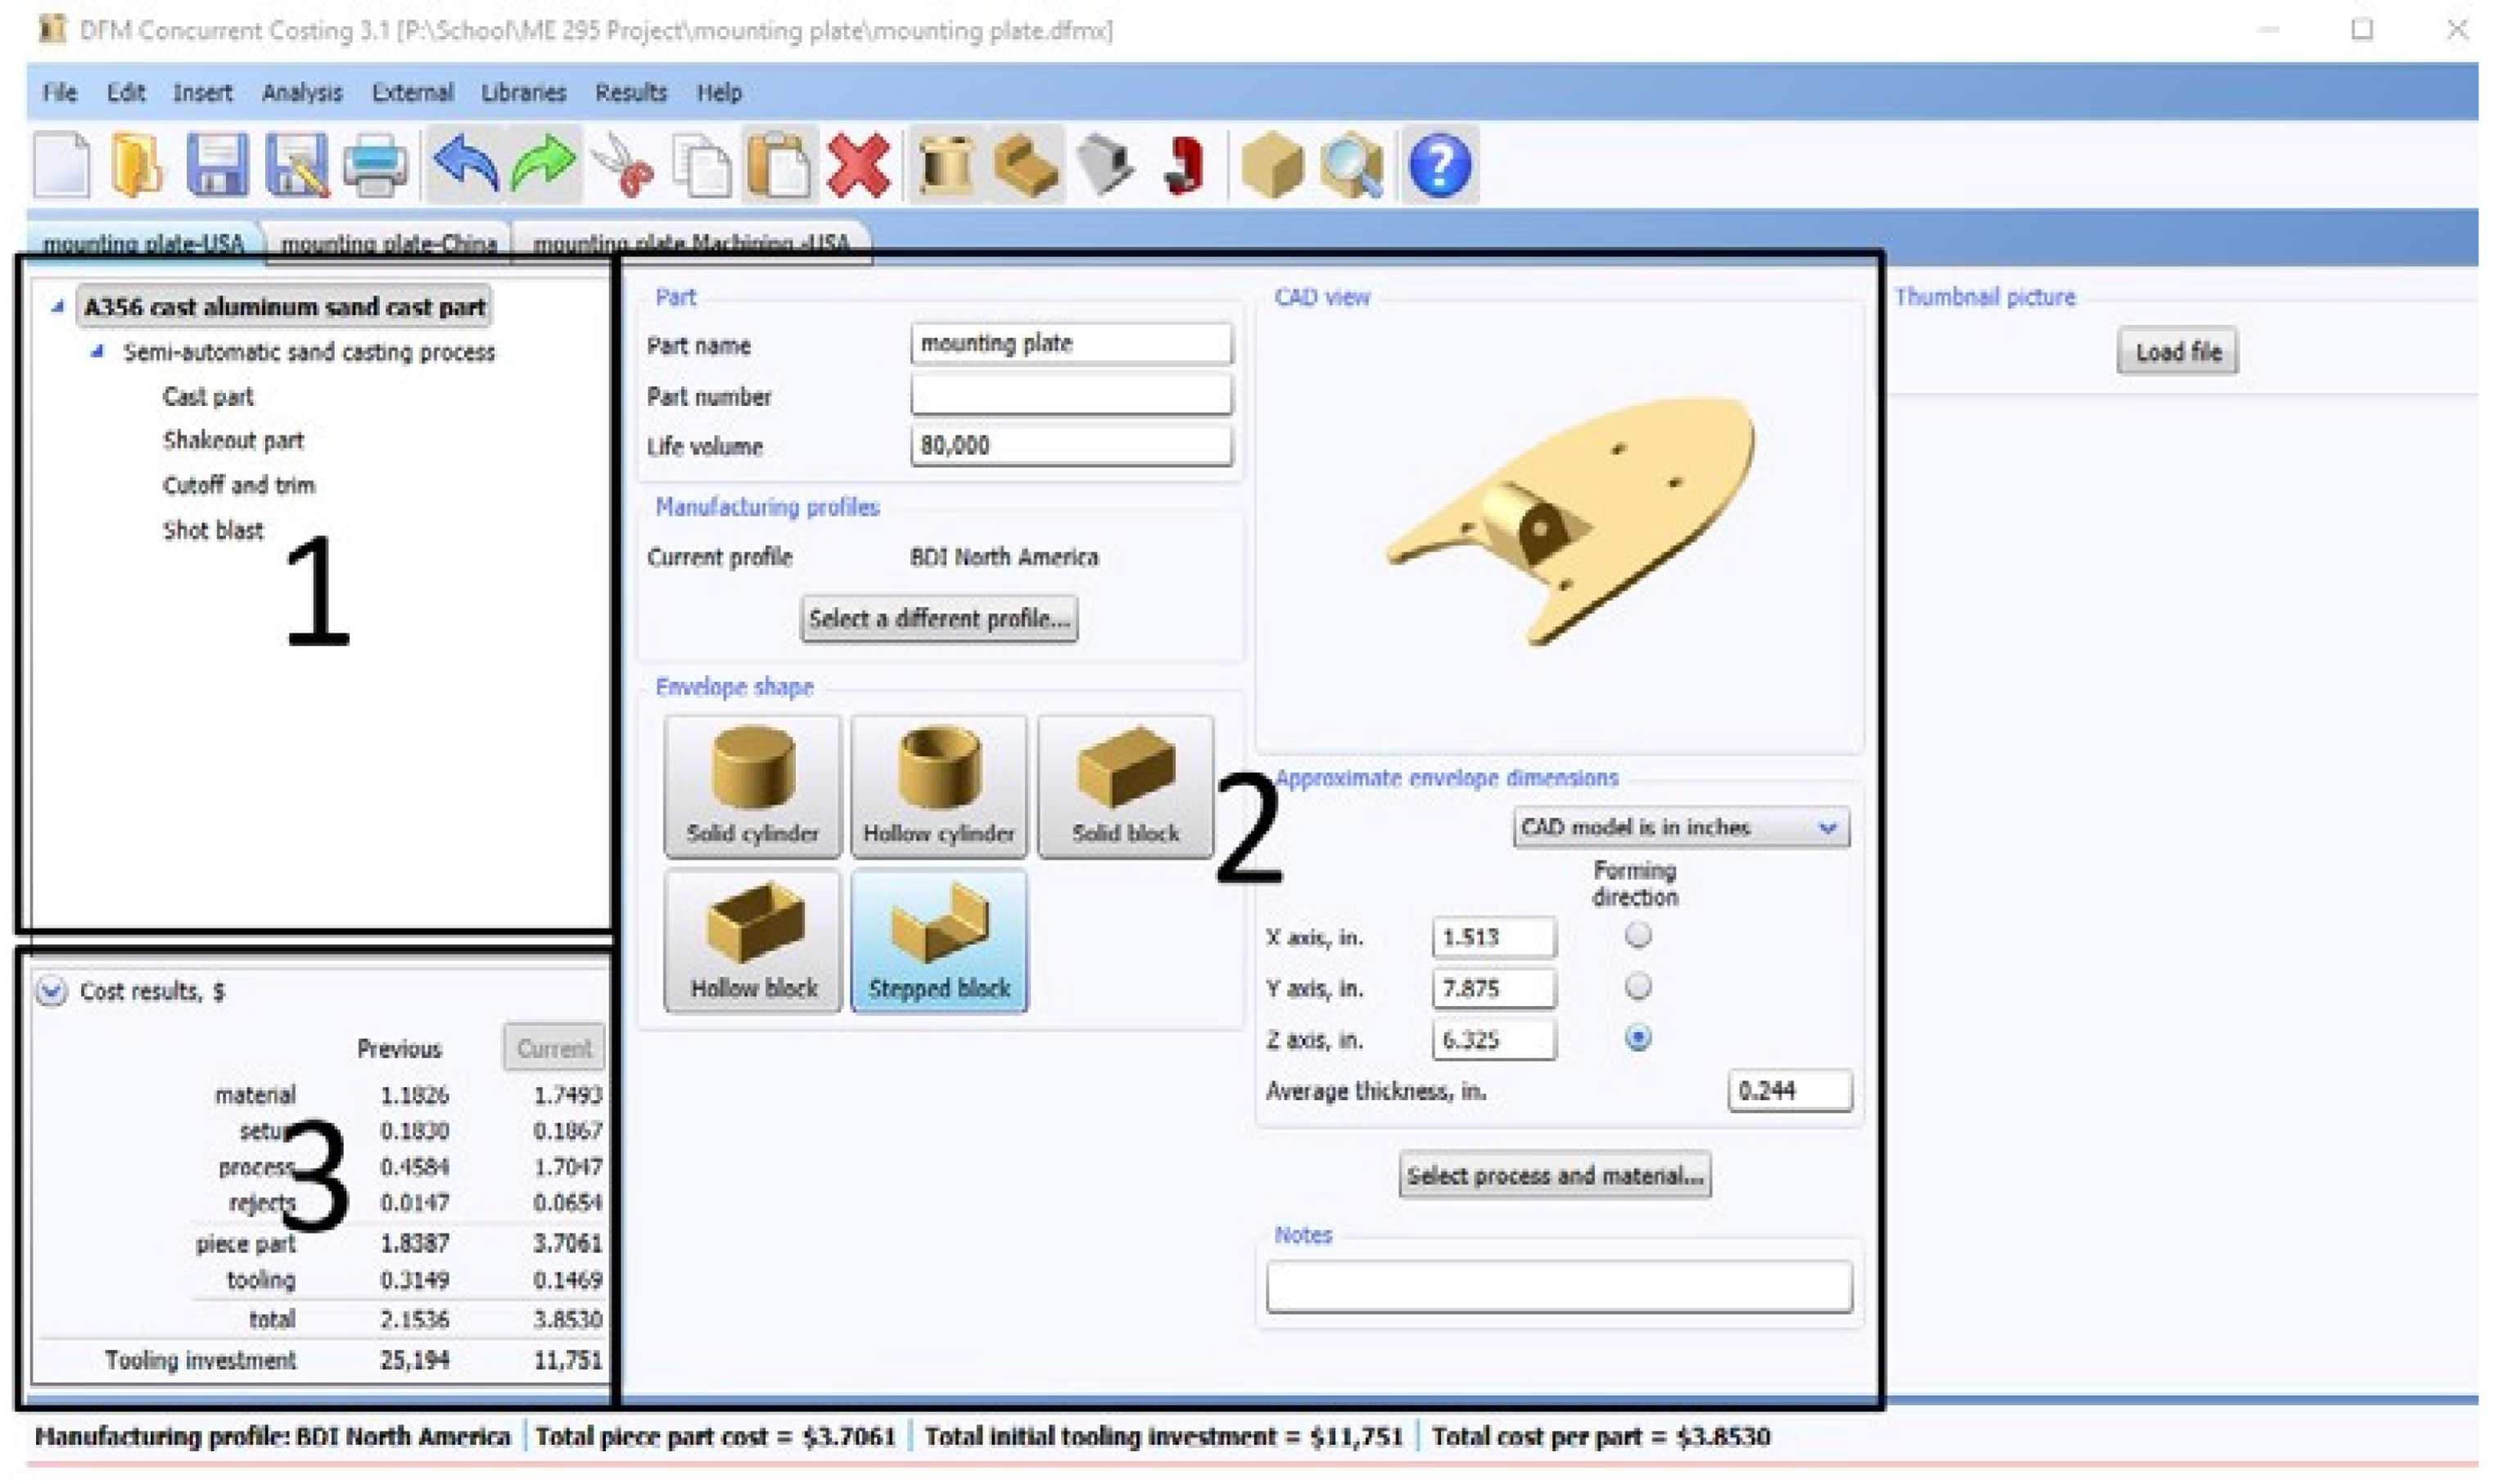
  • The process chart is in the upper left. This area shows the list of steps involved in manufacturing the part.
  • The question panel is on the right-hand side, where the part details are entered.
  • The result box on the lower left shows the cost results regarding materials, setup, process, and rejects. Depending on the manufacturing process, we can also calculate a tooling investment. We add up the four buckets of costs shown at the top to give a part cost and amortize the tooling investment over the specified manufacturing life volume. By adding those together, we can get the total price in DFM concurrent costing.

5. Cost Analysis

5.1. Costed Bill of Materials (BOM)

After conducting DFM and DFA, a costed BOM (Table 6) is put together to estimate the part and the assembly cost. The total preliminary labor and materials cost is $104. Based on this information, a target price for the energy harvester bike can be aggressively set at $400. In the current market, the cheapest commercially available counterpart costs $3000. Customers can assemble this kit and operate the power generator bike in under 15 minutes.

5.2. Return on Investment

The collected data concluded that people who do cycling exercises could pedal the spin bike at a higher speed and easily maintain 13 V to 15 V for 30 to 60 minutes. A person who does cycling exercise regularly can produce 200 Wh in every hour-long exercise session. If this spin bike power generator is placed in a gym, with an estimated using time of 8 h per day, this will generate 1600 Wh per day. Using a utility company cost rate of $0.159 per KWh would save a gym $93.68 per year. It would take 4.28 years to get the return on cost investment. On the other hand, it would take over 17 years to recover the cost for a household of four with two hours of usage per day. Table 7 summarizes the return of investment data for a regenerative exercise bicycle.

6. Contributions of This Work

The idea of generating usable power from exercise equipment is not novel, but not many researchers have attempted to create a complete system that can achieve this functionality. Most of the existing research focuses on either understanding the need for such a device or developing individual components that can contribute to the design of such a system in the future (e.g., [11,12,13,14,15,16,17]). We attempted to create a device that can generate electricity from human energy using off-the-shelf components only. We also performed a design for manufacturability and assembly analysis to optimize the design for future iterations and manufacturing. Further, experimental data are collected to show the efficiency of the device. The novelty of this work is in developing such a working system and collecting data to show the system’s working.

7. Conclusions and Future Work

Today, the energy crisis has become a problem worldwide, and renewable energy research has been trying to address this problem. One such alternate renewable resource, human power generation, is presented in this paper. The rotational energy of the flywheel in a stationary exercise bicycle, generated by pedaling, can be used to charge mobile devices and power small home appliances. This paper presents the design and methodology for developing a static-exercise bike-based energy harvesting system. The proposed system consists of the best elements from the previous designs in the literature. Experiments are performed to quantify the efficiency of the proposed approach. It was observed that for a person doing a little to no exercise, the energy harvester could be used to charge their phones at speed lower than the AC wall outlet. At the same time, a person with a regular exercise habit can charge a phone faster than the wall outlet. Further, this device’s power outcome is compared against two other designs in the literature that provided quantitative measurements. The results show that the design proposed in this paper is more efficient compared to the previous designs.
We plan to continue working on the optimized design for future work. We plan to optimize the design by rebuilding a new prototype with the mounting plate method. More research is needed to tie multiple power generators together and feed the power back to the grid with a grid-tie inverter.

Author Contributions

Conceptualization, V.V. and H.P.; methodology, H.P., S.Z. and V.V.; validation, H.P., V.V. and P.B.; formal analysis, H.P. and P.B.; investigation, H.P., A.P.B. and P.B.; resources, H.P. and S.Z.; data curation, H.P. and A.P.B.; writing—original draft preparation, H.P., V.V., P.B., S.Z. and A.P.B.; writing—review and editing, V.V., S.Z. and A.P.B.; visualization, H.P., V.V. and A.P.B.; supervision, V.V.; project administration, S.Z.; funding acquisition, H.P. and S.Z. All authors have read and agreed to the published version of the manuscript.

Funding

This research received no external funding.

Institutional Review Board Statement

Ethical review and approval were waived for this study as the study was exempt from such a review. The study involved very minimum interventions with humans.

Informed Consent Statement

Informed consent was obtained from all subjects involved in the study.

Data Availability Statement

All the data presented in this study are available in this article.

Conflicts of Interest

The authors declare no conflict of interest.

References

  1. Nazarko, Ł.; Žemaitis, E.; Wróblewski, Ł.K.; Šuhajda, K.; Zajączkowska, M. The Impact of Energy Development of the European Union Euro Area Countries on CO2 Emissions Level. Energies 2022, 15, 1425. [Google Scholar] [CrossRef]
  2. Murdock, H.E.; Gibb, D.; André, T.; Sawin, J.L.; Brown, A.; Ranalder, L.; Collier, U.; Dent, C.; Epp, B.; Hareesh Kumar, C.; et al. Renewables 2021 Global Status Report. In Proceedings of the Technical Report No. Renewable Energy Policy Network for the 21st Century, Online, 28 June 2021; Ren21: Paris, France, 2021. [Google Scholar]
  3. Qian, F.; Xu, T.; Zuo, L. Design, Optimization and Testing of a Piezoelectric Footwear Energy Harvester. Energy Convesrion Manag. 2018, 171, 1352–1364. [Google Scholar] [CrossRef]
  4. Wu, H.; Tang, L.; Yang, Y.; Sih, C. A Novel Two-degrees-of-freedom Piezoelectric Energy Harvester. J. Intell. Mater. Syst. Struct. 2014, 24, 357–368. [Google Scholar] [CrossRef]
  5. Zhao, J.; You, Z. A Shoe-Embedded Piezoelectric Energy Harvester for Wearable Sensors. Sensors 2014, 14, 12497–12510. [Google Scholar] [CrossRef]
  6. Toprak, A.; Tigli, O. Piezoelectric Energy Harvesting: State of the Art and Challenges. Appl. Phys. Rev. 2014, 1, 031104. [Google Scholar] [CrossRef]
  7. Fan, K.; Xia, P.; Li, R.; Guo, J.; Tan, Q.; Wei, D. An Innovative Energy Harvesting Backpack Strategy through a Flexible Mechanical Motion Rectifier. Energy Convers. Manag. 2022, 264, 115731. [Google Scholar] [CrossRef]
  8. Donelan, J.; Li, Q.; Naing, V.; Hoffer, J.A.; Weber, D.J.; Kuo, A.D. Biomechanical energy harvesting, generating electricity during walking with minimal user effort. Science 2008, 319, 807–810. [Google Scholar] [CrossRef]
  9. Fan, J.; Xiong, C.H.; Huang, Z.K.; Wang, C.B.; Chen, W.B. A lightweight biomechanical energy harvester with high power density and low metabolic cost. Energy Convers. Manag. 2019, 195, 641–649. [Google Scholar] [CrossRef]
  10. Zou, H.; Li, M.; Zhao, L.; Liao, X.; Gao, Q.; Yan, G.; Du, R.; Wei, K.; Zhang, W. Cooperative compliant traction mechanism for human-friendly biomechanical energy harvesting. Energy Convers. Manag. 2022, 258, 115523. [Google Scholar] [CrossRef]
  11. Shi, H.U.; Luo, S.; Xu, J.; Mei, X. Hydraulic system based energy harvesting method from human walking induced backpack load motion. Energy Convers. Manag. 2021, 229, 113790. [Google Scholar] [CrossRef]
  12. Shi, H.U.; Yue, Y.; Wang, H.; Xu, J.; Mei, X. Design and performance analysis of human walking induced energy recovery system by means of hydraulic energy conversion and storage. Energy Convers. Manag. 2020, 217, 113008. [Google Scholar] [CrossRef]
  13. Wang, W.; Cao, J.Y.; Zhang, N.; Lin, J.; Liao, W.H. Magnetic-spring based energy harvesting from human motions: Design, modeling and experiments. Energy Convers. Manag. 2017, 132, 189–197. [Google Scholar] [CrossRef]
  14. Zou, H.; Zhao, L.; Gao, Q.; Zuo, L.; Liu, F.; Tan, T.; Wei, T.; Zhang, W. Mechanical modulations for enhancing energy harvesting: Principles, methods and applications. Appl. Energy 2019, 255, 113871. [Google Scholar] [CrossRef]
  15. Bowers, B.J.; Arnold, D.P. Spherical, Rolling Magnet Generators for Passive Energy Harvesting from Human Motion. J. Micromech. Microeng. 2009, 19, 094008. [Google Scholar] [CrossRef]
  16. Rao, Y.; Cheng, S.; Arnold, D.P. An Energy Harvesting System for Passively Generating Power from Human Activities. J. Micromech. Microeng. 2013, 23, 114012. [Google Scholar] [CrossRef]
  17. Sirigireddy, P.; Eladi, P.B. Numerical Design of Novel Piezoelectric Generating Structure that Effectively Utilizes the Force Generated from Human Motion. In Proceedings of the 2020 IEEE International Conference on Power Electronics, Smart Grid and Renewable Energy (PESGRE2020), Cochin, India, 2–4 January 2020. [Google Scholar]
  18. Saha, C.; O’donnell, T.; Wang, N.; Mccloskey, P. Electromagnetic Generator for Harvesting Energy from Human Motion. Sens. Actuators A Phys. 2008, 147, 248–253. [Google Scholar] [CrossRef]
  19. Oh, Y.; Kwon, D.-S.; Eun, Y.; Kim, W.; Kim, M.-O.; Ko, H.-J.; Kang, S.G.; Kim, J. Flexible Energy Harvester with Piezoelectric and Thermoelectric Hybrid Mechanisms for Sustainable Harvesting. Int. J. Precis. Eng. Manuf.-Green Technol. 2019, 6, 691–698. [Google Scholar] [CrossRef]
  20. Su, M.; Brugger, J.; Kim, B. Simply Structured Wearable Triboelectric Nanogenerator Based on a Hybrid Composition of Carbon Nanotubes and Polymer Layer. Int. J. Precis. Eng. Manuf.-Green Technol. 2020, 7, 683–698. [Google Scholar] [CrossRef]
  21. Seo, B.; Cha, Y.; Kim, S.; Choi, W. Rational Design for Optimizing Hybrid Thermo-Triboelectric Generators Targeting Human Activities. ACS Energy Lett. 2019, 4, 2069–2074. [Google Scholar] [CrossRef]
  22. Visconti, P.; Bagordo, L.; Velázquez, R.; Cafagna, D.; De Fazio, R. Available Technologies and Commercial Devices to Harvest Energy by Human Trampling in Smart Flooring Systems: A Review. Energies 2022, 15, 432. [Google Scholar] [CrossRef]
  23. Blechman, A.; Braker, G.; Chodnicki, B.; Dubow, E.; Pernia, K.; Sy, T.; Thompson, M.; Tucker, J. A Study of the Benefits of Retrofitting Cardiovascular Exercise Equipment of a Gym with Human Energy Harvesting Technology. Ph.D. Thesis, University of Maryland, College Park, MD, USA, 2009. [Google Scholar]
  24. Haji, M.N.; Lau, K.; Agogino, A.M. Human Power Generation in Fitness Facilities. In Proceedings of the ASME 2010 4th International Conference on Energy Sustainability, Phoenix, AZ, USA, 17–22 May 2010. [Google Scholar]
  25. Hilario, A.J. Energy Harvesting from Elliptical Machines Using Four-Switch Buck-Boost Topology. Master’s Thesis, California Polytechnic State University, San Luis Obispo, CA, USA, 2011. [Google Scholar]
  26. Lum, M.; Yuen, J. Energy Harvesting from Elliptical Machines: Dc Converter Troubleshooting. Master’s Thesis, Department of Electrical Engineering, California Polytechnic University at San Louis Obispo, San Luis Obispo, CA, USA, 2009. [Google Scholar]
  27. Barois, R.; Caverly, M.; Marshall, K. An Investigation into Using Electricity Harvesting Elliptical Machines as a Renewable Energy Source. UBC Undergrad. Res. 2010. [Google Scholar] [CrossRef]
  28. Chalermthai, B.; Sada, N.; Sarfraz, O.; Radi, B. Recovery of Useful Energy from Lost Human Power in Gymnasium. In Proceedings of the 2015 IEEE 15th International Conference on Environment and Electrical Engineering (EEEIC), Rome, Italy, 10–13 June 2015; IEEE: Piscataway, NJ, USA, 2015. [Google Scholar]
  29. Thiruchelvam, V.; Hammad, C.; Medni, S. Design of Controls, Monitoring and a Energy Storage System for a Energy Harvesting Gymnasium Equipment. In Proceedings of the MATEC Web of Conferences, Cape Town, South Africa, 1–3 February 2016. [Google Scholar]
  30. Suhalka, R.; Khandelwal, M.C.; Sharma, K.K.; Sanghi, A. Generation of Electrical Power Using Bicycle Pedal. Int. J. Recent Res. Rev. 2014, 7, 63–67. [Google Scholar]
  31. Ullah, M.T.; Karim, M.A.B.; Uddin, M.H.; Tauseef, G.M. Harvesting Green Energy from Wastage Energy of Human Activities Using Gymnasium Bicycle at Chittagong City. In Proceedings of the 2015 3rd International Conference on Green Energy and Technology (ICGET), Dhaka, Bangladesh, 11 September 2015; IEEE: Piscataway, NJ, USA, 2015. [Google Scholar]
  32. Boesel, A. Interview with Adam Boesel, Green Micro Gym, 2011 (Audio). 2011. Available online: https://pdxscholar.library.pdx.edu/sustainhist/32/ (accessed on 27 February 2022).
  33. Tgo. The Great Outdoor Gym Company. 2021. Available online: https://www.tgogc.com/ (accessed on 27 February 2022).
  34. Ahsan-Uz-Zaman, K.; Ullah, K.M.; Mishir, M.; Alam, M. Generation of Electrical Power Using Gymnasium Bicycle. In Proceedings of the 2017 IEEE Region 10 Humanitarian Technology Conference (R10-HTC), Dhaka, Bangladesh, 21–23 December 2017; IEEE: New York, NY, USA, 2017. [Google Scholar]
  35. Gibson, T. These Exercise Machines Turn Your Sweat into Electricity. Available online: https://spectrum.ieee.org/these-exercise-machines-turn-your-sweat-into-electricity (accessed on 27 February 2022).
  36. Ihsan, M.; Viswanathan, V. Self-Powering Gyms: A Case Study on Energy Harvesting from a Static Bicycle. In Proceedings of the ASME International Mechanical Engineering Congress and Exposition, Salt Lake City, UT, USA, 10–14 November 2019; IEEE: Piscataway, NJ, USA, 2019. [Google Scholar]
  37. Otto, K.N.; Wood, K. Product Design: Techniques in Reverse Engineering and New Product Development; Tsinghua University Press: Beijing, China, 2003. [Google Scholar]
  38. Ai, X.; Wilmer, M.; Lawrentz, D. Development of Friction Drive Transmission. J. Tribol. 2005, 127, 857–864. [Google Scholar] [CrossRef]
  39. Anyanwu, S.I.; Anthony, A.E. Design and Fabrication of a Pedal Operated Power Generator. Innov. Syst. Des. Eng. 2016, 7, 11–13. [Google Scholar]
  40. Patowary, T.; Hasan, M.; Karim, K. Generation of Electricity by Pedal Power. Master’s Thesis, Department of Electrical and Electronic Engineering, Islamic University of Technology (IUT), Gazipur, Bangladesh, 2016. [Google Scholar]
  41. Rosato, D.V.; Rosato, M.G. Injection Molding Handbook; Springer Science & Business Media: Berlin/Heidelberg, Germany, 2012. [Google Scholar]
  42. Boothroyd, G. Design for Manufacture and Assembly: The Boothroyd-Dewhurst Experience. In Design for X; Springer: Dordrecht, The Netherlands, 1996. [Google Scholar]
  43. Boothroyd, G. Design for Assembly—The Key to Design for Manufacture. Int. J. Adv. Manuf. Technol. 1987, 2, 3–11. [Google Scholar] [CrossRef]
Figure 1. CAD model of a spin bike with an RC motor attached to the flywheel.
Designs 06 00059 g001
Figure 2. Two methods of preloading a friction drive transmission.
Designs 06 00059 g002
Figure 3. (a) Motor and flywheel free body diagram; (b) the free body diagram of the motor; and (c) the free body diagram of the flywheel.
Designs 06 00059 g003
Figure 4. Flywheel and motor speed relationship (free body diagram).
Designs 06 00059 g004
Figure 5. Motor shaft combined bending and twisting moment.
Designs 06 00059 g005
Figure 6. (a) The motor assembly as designed; (b) the exploded assembly view of the design.
Designs 06 00059 g006
Figure 7. (a) The motor mounting and assembly as envisioned; (b) the bike frame modification needed to mount the motor.
Designs 06 00059 g007
Figure 8. The motor assembly in the prototype (a) the modification of the bike frame to mount the motor; (b) the friction drive assembly; (c) the friction drive and the motor assembly; and (d) a closer view of the friction drive with the Motor.
Designs 06 00059 g008
Figure 9. Convert AC to DC with a 3-phase bridge rectifier.
Designs 06 00059 g009
Figure 10. The electrical components on the prototype.
Designs 06 00059 g010
Figure 11. Experimental measurement with a 12 W charger.
Designs 06 00059 g011
Figure 12. The voltage vs. motor RPM characteristics of the design.
Designs 06 00059 g012
Figure 13. The average voltage generated as a function of the number of people using the device.
Designs 06 00059 g013
Figure 14. Percentage of charge as a function of time for the battery pack and the iPhone 11 Pro Max.
Designs 06 00059 g014
Figure 15. A comparison of the flywheel RPM vs. generated voltage characteristics of the three designs being compared.
Designs 06 00059 g015
Figure 16. DFM of mounting plate.
Designs 06 00059 g016
Table 1. A comparison of the energy harvesting subsystems of various designs in the literature. This method was used to select the best subsystems for our design.
Designs 06 00059 i001 Designs 06 00059 i002 Designs 06 00059 i003 Designs 06 00059 i004 Designs 06 00059 i005 Designs 06 00059 i006
Customer NeedsDESIGN ADESIGN BDESIGN CDESIGN DDESIGN EDESIGN F
Power generation efficiencyS00000
UniversalityS00−100
Portability and compactnessS00−111
Works with multiple power sourcesS00000
Integrated USB for mobile devicesS00000
Low noiseS00000
Environment: home or commercialS00000
ErgonomicS−1−1110
AestheticsS−1−1111
DurabilityS−100−10
Energy storageS00000
SafetyS00101
MaintenanceS−100−10
CostS00001
TOTAL +000334
TOTAL −0−4−2−2−20
SUM0−4−2114
Table 2. Components and cost (including the bike).
ItemsCost (USD)
Sunny Health Spin Bike299
RC Motor81.89
35 Amp 3 phase bridge rectifier12
DC meter20
12 GA Wire11
Female Disconnects8
Female Bullet Connector11
Heat Shrink Tubing7
MT60 e wire bullet connectors17
All-Thread rods21
Nuts5
Lock Washer6
Loctite Threadlocker6
Washers12
BaneBots Hub4
BaneBots Wheel3
Project box24
12 V car sockets36
12 V Socket Splitter12
Wago Connectors9
12 V Jackery Battery250Optional
Power Inverter DC to AC30Optional
USB Car Charger Adaptor10Optional
$1000.00
Table 3. Raw data collected from the experiment.
TrialDuration
(min)
Average
Voltage
Average Energy
(WH)
CaloriesPower (W)Battery %Phone %Battery
Accumulation
Phone Two %
11512.0013.2510553.003153-
21411.5011.4311049.003166-
31313.0011.0510851.0042510-
42411.5023.2017658.0032413-
51614.0015.7315059.0041817-
61811.0013.967046.531918-
71511.2011.9012047.602320-
81811.5011.396037.954N/A24-
91811.4011.2914037.623N/A27-
101813.0012.7112042.384N/A31-
113014.0031.8526063.7010354130
123013.4557.75315115.509305225
Table 4. Estimating the battery charge using the Coulomb-count method and comparison with the experimental data.
TrialTrial DurationTotal DurationAverage VoltageAverage CurrentBattery% Accumulation (Theoretical)Battery% Accumulation (Experimental)
11515124.346.463
2142911.54.312.436
31342134.2317.8810
4246611.54.1327.7113
51682144.2134.4117
618100114.2341.9518
71511511.24.2548.2720
81813311.53.354.1724
91815111.43.360.0627
1018169133.2665.8831
1130199144.5569.2741
123022913.458.5994.8352
Table 5. Charging speed in comparison to a wall outlet.
Level of Experience% Charge on the Battery PackTime to Charge (h)Comparison with a Wall Outlet
Little or no exercise312.82Slower than the wall outlet
1009.10 (projected)
Weekend biker181Faster than the wall outlet
1005.56 (projected)
Table 6. Costed BOM for the exercise bike energy harvester.
Part #DescriptionSYS $CostCateoQTYSourceTotal
30,001PACKAGING$3.00$3.30BOXES1DFM ESTIMATE$3.30
30,002FLAT MOUNTING BAR BRACKET REVB$0.24$0.27BRACKET2DFM ESTIMATE$0.53
30,00314 GA HARNESS WITH T30 CONNECTOR$1.08$1.19ELECTRONIC1DFM ESTIMATE$1.19
30,00435A 3 PHASE BRIDGE RECTIFIER$2.66$2.92HARNESS1ALIEXPRESS$2.92
30,005DC VOLTAGE METER$10.06$11.07ELECTRONIC1ALIEXPRESS$11.07
30,00612 VOLT SOCKET$1.73$1.90ELECTRONIC2ALIEXPRESS$3.81
30,0073.1A DUAL USB CAR CHARGER$1.86$2.05ELECTRONIC1ALIEXPRESS$2.05
30,0085 PORT WAGO CONNECTOR$0.18$0.20ELECTRONIC2ALIEXPRESS$0.39
30,00914 GA WIRES$0.50$0.55ELECTRONIC1ALIEXPRESS$0.55
30,010WIRE HARNESS SPADE T30$1.25$1.38ELECTRONIC1DFM ESTIMATE$1.38
30,0111/4″-20 HEX NUT$0.05$0.05HARDWARE8MCMASTER$0.43
30,012Zinc Yellow-Chromate Plated Hex Head Screw, Grade 8 Steel, 1/4″-20 Thread Size, 2-1/2″ Long, Fully Threaded$0.73$0.80HARDWARE2MCMASTER$1.60
30,013Zinc Yellow-Chromate Plated Hex Head Screw, Grade 8 Steel, 1/4″-20 Thread Size, 3/4″ Long$0.12$0.14HARDWARE4MCMASTER$0.55
30,014 M5 BOLT FOR CONTROL BOX AND RECTIFIER $0.12$0.13HARDWARE5MCMASTER$0.66
30,015 M5 NUTS $0.02$0.02HARDWARE1MCMASTER$0.02
30,016 M4X.7MM SOCKET HEAD SCREW $0.09$0.10HARDWARE4MCMASTER$0.39
30,017UBOLT WITH MOUNTING PLATE$1.42$1.56HARDWARE1MCMASTER$1.56
30,018CONTROL BOX$1.07$1.18HOUSING1DFM ESTIMATE$1.18
30,019CONTROL BOX BASE$0.40$0.44HOUSING1DFM ESTIMATE$0.44
30,020RACERSTAR BRH5065-140kV MOTOR$46.95$51.65MOTOR1ALIEXPRESS$51.65
30,021BANEBOT T81 HUB, 8MM SHAFT 60A$3.15$3.47MOTOR HUB1BANEBOTS.COM$3.47
30,022BANEBOTS WHEEL, 2-7/8″X0.8″, HUB MOUNT, 60A, $2.45$2.70MOTOR WHEEL1BANEBOTS.COM$2.70
30,023RECEPTICAL MOUNTING PLATE$1.93$2.12MOUNTING1DFM ESTIMATE$2.12
30,024BUNGEE CORD WITH HOOKS 1M3.933$4.33MOUNTING1ALIEXPRESS$4.33
30,0256″ 14G Red Wire with spade connector-pre-stripped end$0.20$0.22Harness3DFM ESTIMATE$0.66
30,0266″ 14G Blk Wire with spade connector-pre-stripped end$0.20$0.22Harness3DFM ESTIMATE$0.66
MATERIALS COST99.59
LABOR COST3.87
TOTAL COST$103.46
Table 7. Return of Investment calculation.
Wh/DayWh/YearkWhSavings on ElectricityROI (Years)
Regular cycling exercise can produce20073,0007311.6834.25
In a gym with average usage time of 8 h/day1600584,00058493.444.28
In a regular household of 4 with 2 h of usage per day400146,00014623.3617.12
Publisher’s Note: MDPI stays neutral with regard to jurisdictional claims in published maps and institutional affiliations.

