Article

On the Resistance to Buckling Loads of Idealized Hull Structures: FE Analysis on Designed-Stiffened Plates

1
Department of Mechanical Engineering, Universitas Sebelas Maret, Surakarta 57126, Indonesia
2
Department of Mechanical Engineering, Universitas Merdeka Madiun, Madiun 63133, Indonesia
3
Research Center for Hydrodynamics Technology, National Research and Innovation Agency (BRIN), Surabaya 60117, Indonesia
*
Author to whom correspondence should be addressed.
Designs 2022, 6(3), 46; https://doi.org/10.3390/designs6030046
Submission received: 8 April 2022 / Revised: 21 April 2022 / Accepted: 13 May 2022 / Published: 17 May 2022
(This article belongs to the Section Mechanical Engineering Design)

Abstract

:
In this paper, the buckling analysis on simply supported rectangular plates and stiffened panels is carried out. Three different plate thicknesses were proposed (i.e., 3 mm, 4 mm, and 5 mm). The thickness of the longitudinal stringers and sub-stiffeners were also varied. The material that was used was marine grade steel. The load versus the displacement curve and the total energy were measured. The buckling analysis results were examined via finite element (FE) computation. To ensure that the results of the methodology for the finite element were reliable, the benchmark buckling analysis of the experimental test was reconstructed. For the selection of mesh size, the element to thickness ratio method (ELT) was used. The results revealed that the thickness of the plate increases the strength of the stiffened panel. The plate thickness of 5 mm increased by 65.7% and 20.61% compared with the 3 mm and 4 mm plate thicknesses. A change in the thickness of the sub-stiffeners does not significantly change the strength of the stiffened panels. Material S355JR-EN10210 produced a higher ultimate panel collapse load compared with S235JR-EN10025 (A) and S235JR-EN10025 (B).

1. Introduction

The buckling phenomenon is a condition where the stiffeners in a structural member such as a plate or column, are under a thrust load and are deflected in an out-of-plane direction when the load reaches a certain critical value. This deflection in an out-of-plane direction begins to increase rapidly following the buckling. As a result, the stiffness in-plane is reduced, and the load-carrying capacity is decreased. If the load is increased further, the collapse of the entire structure may occur due to progressive buckling [1].
Buckling collapse behavior can be determined using both analytical and numerical methods. Durban and Zuckerman [2] showed that the critical buckling load of the rectangular plate could be measured with the flow and deformation theory. The aspect ratio a/b that was examined ranged from 0.25–4. Furthermore, Elgaaly [3] found that the nonlinear finite element analysis programs, NONSAP and ANSR-III, are able to depict the post-buckling behavior of thin plates to an extraordinary degree of accuracy when compared with analytical solutions and experimental results. This numerical method has several advantages, which are the parameters that can be considered, the reasonable cost, and relatively short time period. The calculation of the dynamic buckling of thin isotropic plates subjected to an in-plane impact can also be performed using a stress failure criterion [4]. In the same year, Cheung et al. [5] showed that the finite strip method (FSM) can be used to perform buckling analysis of plates with abrupt changes in thickness and complex support conditions. In 2007, Shimizu [6] conducted a study on the tension buckling strength of a plate which had a hole in the middle. The study used the numerical method for calculation purposes and seven deferent types of holes (e.g., rectangular, circular, etc.) were proposed. He found that plates which have holes influence the outcome of the tension buckling strength. In the last decade, a study that performed numerical analysis on plates that have curvature has been carried out by Amani et al. [7]. They found that an increase in the curvature of plates raises the elastic buckling load. Parameters such as fire also can be included in the numerical method, as shown in the study by Xing et al. [8] on the local buckling response of stainless-steel plates.
Buckling collapse behavior of the stiffened panels are also of interest for researchers. For instance, Danielson and Wilmer [9] conducted a study (analytical and numerical methods) on the buckling behavior of a rectangular plate with a bulb flat stiffener attached to one side of the panel. In 2011, buckling analysis on the effect of longitudinal stiffeners on stiffened panels was carried out by Kwon and Park [10]. The study was performed using both experimental and numerical methods. They found that the amount of longitudinal stiffeners attached to the panel influences the ultimate panel collapse load. Furthermore, a numerical study conducted by Layachi and Xu [11] showed that the type of sub-stiffeners and the dimension also influences the ultimate panel collapse load. In 2020, an experimental and numerical buckling test of stiffened panels subjected to an in-plane compressive load was conducted by Kong et al. [12]. This study reported that the differences in plate size (i.e., length and width of the stiffened plate) affect the load vs. displacement curve; however, the thickness of the stiffeners attached on the stiffened plate were not the focus of the study and were neglected. Furthermore, the studies that have been mentioned above did not examine the energy produced during the buckling process. Neither of the studies used were based on the element to thickness ratio (ELT) to choose the mesh size in numerical calculations.
In this paper, analytical and numerical analysis of linear buckling on simply supported rectangular plates subjected to in-plane uniaxial load were carried out. Numerical calculation was performed using the finite element (FE) with three deferent elements for the length to thickness ratio (ELT). Rectangular plates were varied into three different aspect ratios a/b and three different plate thicknesses h. The objective was to find the most accurate result of element length to thickness ratio (ELT) compared with analytical calculations. Furthermore, nonlinear buckling analysis of the stiffened panels that were subjected to an in-plane compressive load were also carried out. The effect of the thickness of the longitudinal stringers and sub-stiffeners on the ultimate panel collapse load and the generated energy was carried out using finite element. The main purpose was to determine which is the most satisfactory way of increasing the strength of the stiffened panel, by comparing the load and energy versus displacement curves, respectively. The specimens that were used are based on a real experimental buckling test specimen. Benchmarks were performed to confirm that the methodology and boundary conditions are suitable.

2. Characteristics of Ship Hull Structure

In the last two decades, research that focuses on the analysis of buckling collapse behavior on plates and stiffened panels has been carried out by researchers in considerable detail. In 2003, analysis on compressive buckling and vibration behavior of a stiffened plate subjected to non-uniform in-plane stress distribution has been carried out by Srivastava et al. [13]. In his research, the aspect ratio of the plate a/b ranged from 0.5 to 2. The results show that, due to uniform stress distribution on the long-stiffened plate, the buckling loads of the higher aspect ratios are not significantly affected by the position and load bandwidth. Three years afterwards, Kumar et al. [14] found that the presence of a cutoff in the middle of the plate has a major influence on the strength of the stiffened plate. Seifi and Khoda-yari [15] and Sujiatanti et al. [16] have investigated the effect of the cracked plate on the critical buckling load and ultimate plate collapse load, respectively. Their result shows that the crack on the plate reduces the critical buckling load and ultimate plate collapse load, respectively. In 2018, Xu et al. [17] conducted a study on the ultimate strength of stiffened panels of ship structures. Three different types of stiffeners were proposed and attached to the plates (e.g., flat, angle, and Tee bars). They found very close results of average stress versus displacement curves obtained from the angle and Tee bars. However, average stress versus displacement curves is extremely different when using the flat bar compared with the angle and Tee bars. Xu et al. [17] found that when the column slenderness is 1.010 (weak stiffener), the stiffened panels with angle and Tee bars have a greater ultimate strength than the flat bar; however, the opposite occurs when strong stiffeners were used (column slenderness is 0.165). Table 1 lists the milestone research on the buckling analysis of the plates and stiffened panels in last two decades.

3. Theoretical Concept of Plate Buckling

3.1. Kirchhoff Plate Theory

The simplest plate theory was proposed by Kirchhoff in the 1850s. Kirchhoff theory or classical thin plate theory (CPT) assume that:
  • the deflection in the plate is small, i.e., less than the thickness of the plate;
  • during bending, the middle plane of the plate extant in the neutral surface and does not stretch;
  • the plane sections of the plate can rotate during bending to extant normal to the neutral surface, and distortion does not occur. This state makes the stresses and strains proportional to the distance from neutral surface;
  • the effect of shearing forces is neglected and the loads are completely resisted by the bending moments that are induced in the elements plate;
  • the thickness of the plate is not higher compared to the other dimensions.
Consider buckling on a thin rectangular plate under a biaxial compression load, based on the Kirchhoff or classical thin plate theory (CPT), the governing equation is given in [23]
D 4 w x 4 + 2 4 w x 2 y 2 + 4 w y 4 + N x 2 w x 2 + N y 2 w y 2 = 0 ,
Here, w is the transverse deflection and D is the flexural rigidity of the plate. D can be written as
D = E h 3 12 1 v 2
where h is the thickness of the plate, E is the Young’s Modulus, and v is the Poisson’s ratio.
For two boundary conditions, and for each elastically restrained edge, the equations are given as
D 2 w n 2 + D v 2 w s 2 K r m L w n = 0
with
N w n + D 3 w n 3 + 2 v D 3 w 2 n ± K l m w = 0
where n and s are the normal direction to the edge and the direction along the edge, respectively [24,25].

3.2. Plate Buckling

In general, thin plates are used to build ships and ship-like floating structures. This plate can fail in several situations, such as plate failure due to corrosion [26], yielding fracture [27,28], impact [29,30,31], and buckling [17]. Corrosion can occur due to the influence of conditions from the surrounding environment. Moreover, in the case of impact, collisions between ships, grounding, and collisions with offshore objects are common phenomena. These conditions can be prevented by using sensors and satellite images to improve the safety of ship traffic at sea [32]. In the case of failure caused by buckling, the plate undergoes an event in which the shape of the plate spontaneously bends from straight to curved under a compression load. The milestone research on the plate buckling is summarized in Table 2.
For thin rectangular plates under a compression load (Figure 1), buckling happens when the applied load reaches a certain critical value. For simply supported rectangular plates on all sides, as shown in Figure 1, the critical buckling load is given by [1,23]:
N c r = k c π 2 D b 2
where D can be determined using Equation (2). a and b are unloaded plate length and loaded plate length, respectively. k c is the buckling coefficient where the value depends on the aspect ratio a/b and the type of the supports on the plate edges (boundary condition). The plot of the buckling coefficient versus the aspect ratio a/b is shown in Figure 2.
Figure 3 shows the buckling coefficient depending on the boundary conditions. Here, as an indicator for Figure 3, Case (A) shows all sides simply supported, Case (B) shows its loaded sides clamped and non-loaded sides simply supported, Case (C) shows its loaded sides simply supported and non-loaded sides clamped, and Case (D) shows all sides clamped.

4. Fundamental FE Algorithm

The finite element technique was introduced in 1956 by Turner et al. [38] who described it as a direct stiffness approach. The assumption of the actual structure is represented by an approximation by the discretized structure; that is, with a collection of finite elements having simple elastic properties, which are then connected, so as to represent a true continuum [39].
Mukhopadhyay and Mukherjee [40] and Srivastava et al. [13] have discussed the stiffness matrix of the plate, which arbitrarily orients the stiffener, in great detail. The following presumptions are used in the basic equation of the stiffened panels:
  • Hooke’s law is applied to the plate and stiffener material;
  • Mindlin’s theory is applied to the bending deformation, which is a state before the bending in the plate happens, and the linear elements remain straight when they are perpendicular to the middle plane of the plate;
  • The x- and y-directions become a function of the deflection that occurs in the z-direction;
  • The deflections of the plate are small—less than the thickness of the plate;
  • After bending occurs, it is common and normal for the plate and stiffener to stand straight before bending.
For the stiffened plate that is subjected to in-plane loads, the equation of equilibrium can be written as the following
M q ¨ + K b P K G q = 0
where K b and K G are the elastic and geometric stiffness matrices, respectively. q is the displacement vector.
The buckling and vibration problems q ¨ = 0 , and Equation (6) can be simplified as
K b P K G q = 0
For the free vibration problem with angular frequency ω , Equation (6) can be written as
K b P K G ω 2 M q = 0
The stiffness matrix of the plate element is expressed as follows
K p = 1 + 1 1 + 1 B p T D p B p J p d ξ d η ,
K G p = 1 + 1 1 + 1 B G p T σ p B G p J p d ξ d η ,
M p = 1 + 1 1 + 1 N T m p N J p d ] ξ d η ,
where K p and K G p are the elastic and geometric stiffness matrices, respectively. M p is the mass matrix of the plate. B p and B G p can be expressed as
B p = B p 1 B p 2 B p r B p 9 ,
B G p = B G p 1 B G p 2 B G p r B G p 9 ,
and
J p = J
The stiffness matrix of the stiffener element is expressed as follows
K S = 1 + 1 B S T D S B S J S d ξ ,
K G S = 1 + 1 B G S T σ S B G S J S d ξ ,
M S = 1 + 1 N T m S N J S d ξ ,
where K S and K G S are the elastic and geometric stiffness matrices, respectively. M S is the mass matrix of the stiffener. Here, J S is the Jacobian of the stiffener and represents half of the actual length in an element. B S and B G S   can be expressed as
B S = B S 1 B S 2 B S r B S 9 ,
B G S = B G S 1 B G S 2 B G S r B G S 9
The expression for the matrices is given by
B S r = N r x 0 0 0 0 0 0 0 N r x 0 0 0 0 0 N r x 0 0 N r x N r 0
D S = E A s E F s 0 0 E F s E I s 0 0 0 0 G T s 0 0 0 0 G A s 1.2
B G S = 0 0 N r x 0 0 0 0 0 N r x 0
σ S = σ x A S 0 0 σ x I S
where A s and F s are the area, and the first moment of area with respect to the reference plane, respectively. I s and T s are the second moment of area with respect to the reference plane and the torsional constant, respectively.

5. Benchmarking Analysis

5.1. Analysis Setup and Configuration

A series of experimental buckling tests of stiffened panels were carried out by Quinn et al. [41]. There were two specimens used in the experiment. Figure 4 shows the specimen geometry and the dimension. One specimen has a configuration of three longitudinal stringers with a length of 590 mm each placed on the surface of the plate. It has a height of 28 mm and a 2.8 mm thickness. Three longitudinal stringers were arranged parallel to each other at a distance of 167 mm. The other specimen has a five blade section of sub-stiffeners placed between the longitudinal stringers. They have a height of 8.7 mm and a thickness of 1.4 mm each, Figure 4b. The plate thickness of Specimen A and Specimen B were 2.2 mm. Both specimens were manufactured with Aluminium Alloy 2024-T351.
The experimental tests were performed in a 500 kN capacity hydraulic testing machine. A reinforced epoxy resin base with a thickness of 42 mm was placed at each end of the specimen loading. This resin was used for providing clamped boundary conditions. Strain gauges were applied in the experimental test to determine the initial plate buckling and post-buckling collapse. Measurement specimen displacement used two calibrated displacement transducers, and one was placed on either side of the specimen.

5.2. Validation of FE Methodology

In this study, experimental buckling tests of stiffened panels performed by Quinn et al. [41] were modeled using nonlinear finite element analysis. The analysis was carried out using the commercial FE package ANSYS [42]. Specimen A and Specimen B, alongside longitudinal stringers and sub-stiffeners, were re-created using the shell element. The deformation (plastic) and the load versus displacement will then be compared with the experimental results.
Unfortunately, in the experimental test conducted by Quinn et al. there was no mention of the material properties of Aluminum Alloy 2024-T35; therefore, the material properties of Aluminum Alloy 2024-T3 were assumed and used in this study. It has a density of 2780 kg/m3, a Young’s modulus of 73.4 GPa, and a Poisson’s ratio of 0.33 [43,44]. Table 3 details the material properties of Aluminum Alloy 2024-T3. The total mass of the specimens was not significantly different compared with the experimental data, shown in Table 4. Specimen A has a total mass of 1.974 kg and Specimen B has 1.993 kg, compared with the experimental data at 1.959 kg and 1.968 kg, respectively. Hence, Specimen B’s design was marginally heavier than Specimen A’s. The mass percentage difference of Specimen A and Specimen B were less than 1.27% compared with the experimental data.
The finite element model of Specimen A with the shell elements is presented in Figure 5a, and the total deformation is presented in Figure 5b. The deformation of Specimen A showed that the maximum deformation was located on the left edge of the plate. A considerable portion of deformation can be seen in the center of Specimen A. The top and bottom edges showed slight deformation. The location of the minimum deformation occurred at the top edge, precisely at the longitudinal stringer. Compared with the experiment, the deformation in Specimen A was not significantly different, as shown in Figure 6. The center of the plate, where there was no longitudinal stringer, has a considerable deformation. Deformation on the center of the plate was also seen in experimental data as pointed out by the arrow in Figure 6. This shows that current FE methodology can show related behavior when compared with the experimental result.
The finite element model of Specimen B with the shell elements is presented in Figure 7a, and total deformation is presented in Figure 7b. The maximum deformation of Specimen B is located on the left edge of the plate. A moderate level of deformation can be seen in the center of Specimen B. There was no deformation on the top edge. Slight deformation is presented on the bottom edge.
Figure 8 shows the comparison results between the experimental and finite elements (FE). Compared with the experimental data, the deformation in Specimen B was quite similar. As is evident, a slight deformation occurred in the sub-stiffener. There was deformation in the center of the longitudinal stringer, as pointed out by the arrow in Figure 8. This deformation can be seen in both the experimental data and FE result.

5.3. Mesh Convergence Study

Mesh convergence studies were conducted to find the most suitable mesh size required in the model to ensure that the results of the analysis were not affected by changing the size of the mesh. The selection of the mesh size was always a compromise between accuracy, reasonable computational time, and computer resources [45,46].
A total of ten different mesh sizes ranging from 5 mm to 27.5 mm were selected. The selected mesh sizes and the load versus displacement curves are presented in Figure 9. As is evident, the load versus displacement curve of the all mesh sizes had a good correlation with the results of the experimental data [41]. Mesh sizes from 5 mm to 17.5 mm produced the most accurate results. The highest percentage error was not more than 3.33%. It was found that the best agreement, when compared with the experimental data for the ultimate panel collapse load, was achieved when a 10 mm mesh size was selected for both specimens, as shown in Table 5. Specimen A and Specimen B showed ultimate panel collapse loads at 217.4 kN and 257.1 kN, respectively. These loads are slightly higher compared with the experimental data, at 216.6 kN and 255.0 kN, respectively; however, load errors were not more than 0.38% and 0.84%. It was found that on Specimen B, mesh size with 20 mm and higher produced a lower panel collapse load. The errors were ranging between 6.20% to 6.96%. The highest percentage error occurred when a 25 mm mesh size was selected. Specimen A has an error of 4.09% and Specimen B −6.96%.

6. Integrated FE Study

6.1. Geometrical Design

Analysis of the linear buckling of the simply supported rectangular plate using analytical and numerical methods was conducted in this study. The effect of the aspect ratios a/b and thickness h on the critical buckling load was determined. The analytical calculation was performed using Equation (5). Three geometrical designs for the plates are presented in Figure 10. The aspect ratios a/b equal to 2, 3, and 4 were chosen, as shown in Figure 10. The specimens have the length a = 2000 mm, b = 1000 mm for a/b = 2, a = 1500 mm, b = 500 mm for a/b = 3, and a = 4000 mm, b = 1000 mm for a/b = 4. Plate thickness varied between h = 3 mm, 4 mm, and 5 mm.
Specimen geometries taken from the experimental buckling test performed by Quinn et al. [41] were chosen for nonlinear buckling analysis. Figure 11 shows the geometrical design of the specimens (Specimen A and Specimen B). The base plate has a dimension of 440 mm × 590 mm. The plate thicknesses of Specimen A and Specimen B varied between 3 mm, 4 mm, and 5 mm.
There were three longitudinal stringers attached to the plate on Specimen A. The thickness of these longitudinal stringers varied between 4 mm, 5 mm, and 6 mm. The plate thickness was fixed to 5 mm when the change in longitudinal stringer thickness took place. On the other hand, the thickness of the longitudinal stringers was fixed at 4 mm when the change in plate thickness took place.
On Specimen B, five blade section sub-stiffeners were attached between the longitudinal stringers. Three different thicknesses of sub-stiffener were proposed: 2 mm, 2.5 mm, and 3 mm. The thickness of the plate and longitudinal stringers was fixed to 5 mm and 4 mm when the change in the sub-stiffeners thickness took place, respectively. The thickness of the longitudinal stringers and sub-stiffeners were fixed at 4 mm and 2 mm when the change in the thickness of the plate took place, respectively. The effect of these changes in terms of the thickness on the load versus displacement curves and the generated energy was compared.

6.2. Material Model

The materials used in this study were mild steel (S235JR-EN10025) and high strength steel (S355JR-EN10210). The material properties are described in Table 6 and were obtained experimentally by [47,48]. A comparison of the engineering stress-strain curves and true stress-strain curves is shown in Figure 12a. These materials were widely used in naval architecture and marine engineering [49,50]. All three materials have a density of 7800 kg/m3, a Young’s Modulus of 210 GPa, and a Poisson’s ratio of 0.3.
For the linear analysis, only S235JR-EN10025 (A) was used. The analysis practiced isotropic elasticity, Young’s Modulus 210 GPa, Poisson’s Ratio 0.3, Bulk Modulus 175 GPa, and Shear Modulus 80.77 GPa. For the nonlinear analysis, isotropic hardening power law was used in three materials. The yield stress, ultimate stress, and the exponent values are shown in Table 6. Only S235JR-EN10025 (A) was used to examine changes in plate thickness, longitudinal stringers, and sub-stiffeners thickness.

6.3. Boundary Condition and Scenario

Figure 13 shows the boundary conditions for the linear buckling analysis. All the edges of the rectangular plate were simply supported. Displacement on the top, bottom, left, and right edges were free in the x- and y-direction and fixed in the z-direction. Rotation on the top and bottom edges were fixed in the y-direction and free in x- and z-direction. Rotation on left and right edges were fixed in the x-direction and free in the y- and z-direction. Forces of 10 N/m were applied on the top and bottom edges acting in opposite directions. On the middle of the plate, displacement was free in the z-direction and fixed in the x- and y-direction. Displacement on the parallel side of the middle plate was free in the x- and z-direction and fixed in the y- direction. This boundary condition was used in the three specimens.
Figure 14 shows the boundary conditions’ nonlinear buckling analysis for Specimen A. The top edge was clamped, and displacement was free in the x-direction and fixed in the y- and z-direction. The bottom edge was clamped, and displacement was free in the x- and y-direction and fixed in the z-direction. Rotation on the top and bottom was free in the y-direction and fixed in the x- and z-direction. A displacement of 3 mm in the y-direction was applied on the bottom edge. Both left and right edges were not fixed. On the middle of the plate, displacement occurred in the z-direction and was fixed in the x- and y-direction.
Figure 15 shows the boundary condition of the nonlinear buckling analysis on Specimen B. The top edge was clamped, and displacement was fixed in all directions. The bottom edge was clamped, and displacement was free in the x-direction, 2.75 mm displacement occurred in the y-direction, and was fixed in the z-direction. Rotation on the top and bottom edges was fixed in x- and z-direction and free in the y-direction. There was no displacement on either the left or right edges.
For the size of the mesh, element to thickness (ELT) ratios of 5, 6, and 7 were used in this study. The analysis was carried out using a Static Structural ANSYS [42]. The temperature of the environment was set to 22 °C. Step time ended in 1 s. For the linear buckling, Eigenvalue Buckling analysis was performed after the Static Structural ended. Four mode shapes were created. For the nonlinear analysis, auto time stepping was defined by sub steps with initial sub steps, which were 50, minimum sub steps were 30, and maximum sub steps were 500.

7. Results: Linear Buckling

7.1. Effect of Thickness Change

The analytical and finite element results of the critical buckling load on simply supported rectangular plates are presented in Table 7. The critical buckling load was significant depending on the thickness of the plate. As is evident, the critical buckling load was significantly larger with an increase in the thickness of the plate. This phenomenon was found in all aspect ratios a/b = 2, 3, and 4.
At a 3 mm thickness of the plate, the analytical calculation results showed that the critical buckling load was at 20,498 N/m, 81,994 N/m, and 20,498 N/m for aspect ratio a/b = 2, 3, and 4, respectively. Compared with the 5 mm plate thickness, results showed the critical buckling load values of 94,900 N/m, 379,600 N/m, and 94,900 N/m. These three values increased by exactly 362.97% when compared with the critical buckling load values of the 3 mm plate thickness.
The critical buckling load results from the finite element using the ELT ratio showed that the largest difference compared with the analytical data occurred at ELT ratio = 7 from a/b ratio = 3 with a 5 mm plate thickness. The critical buckling load value was 0.65%, which is higher than the value from the analytical result. The lowest error occurred when the ELT ratio of 5 and 7 were used in the aspect ratio a/b = 2 and 4 with a 3 mm plate thickness. The value of the critical buckling load was 0.01% higher than the analytical value.

7.2. Effect of Geometrical Change

Element length to thickness (ELT) ratios of 5, 6, and 7 showed no significant difference in the outcome; therefore, the result of the analysis of the data from the ELT ratio 5 is presented. 
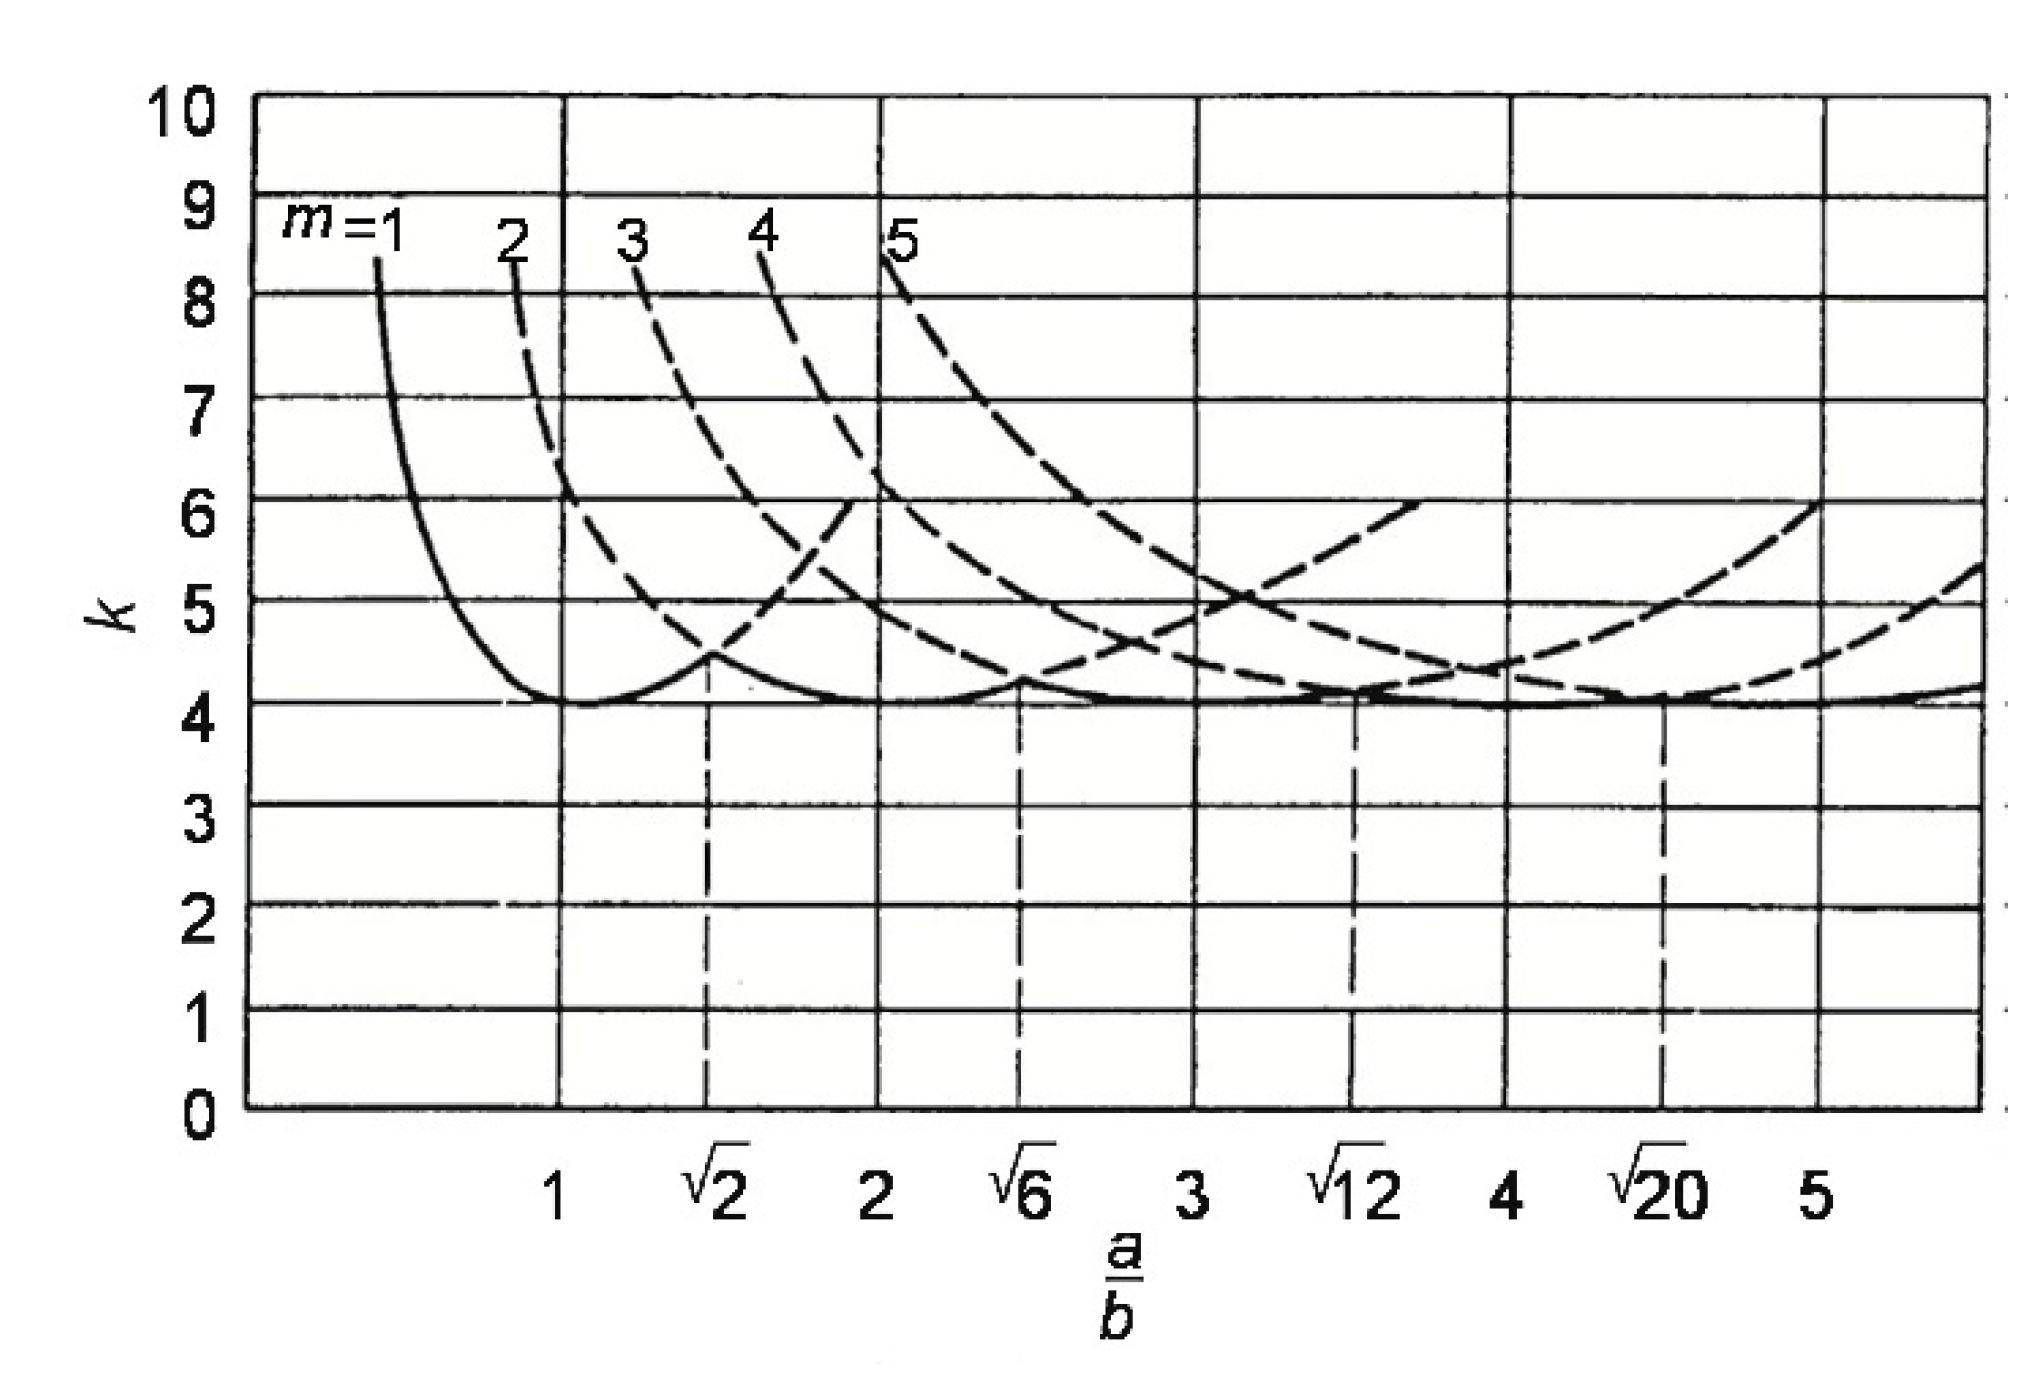
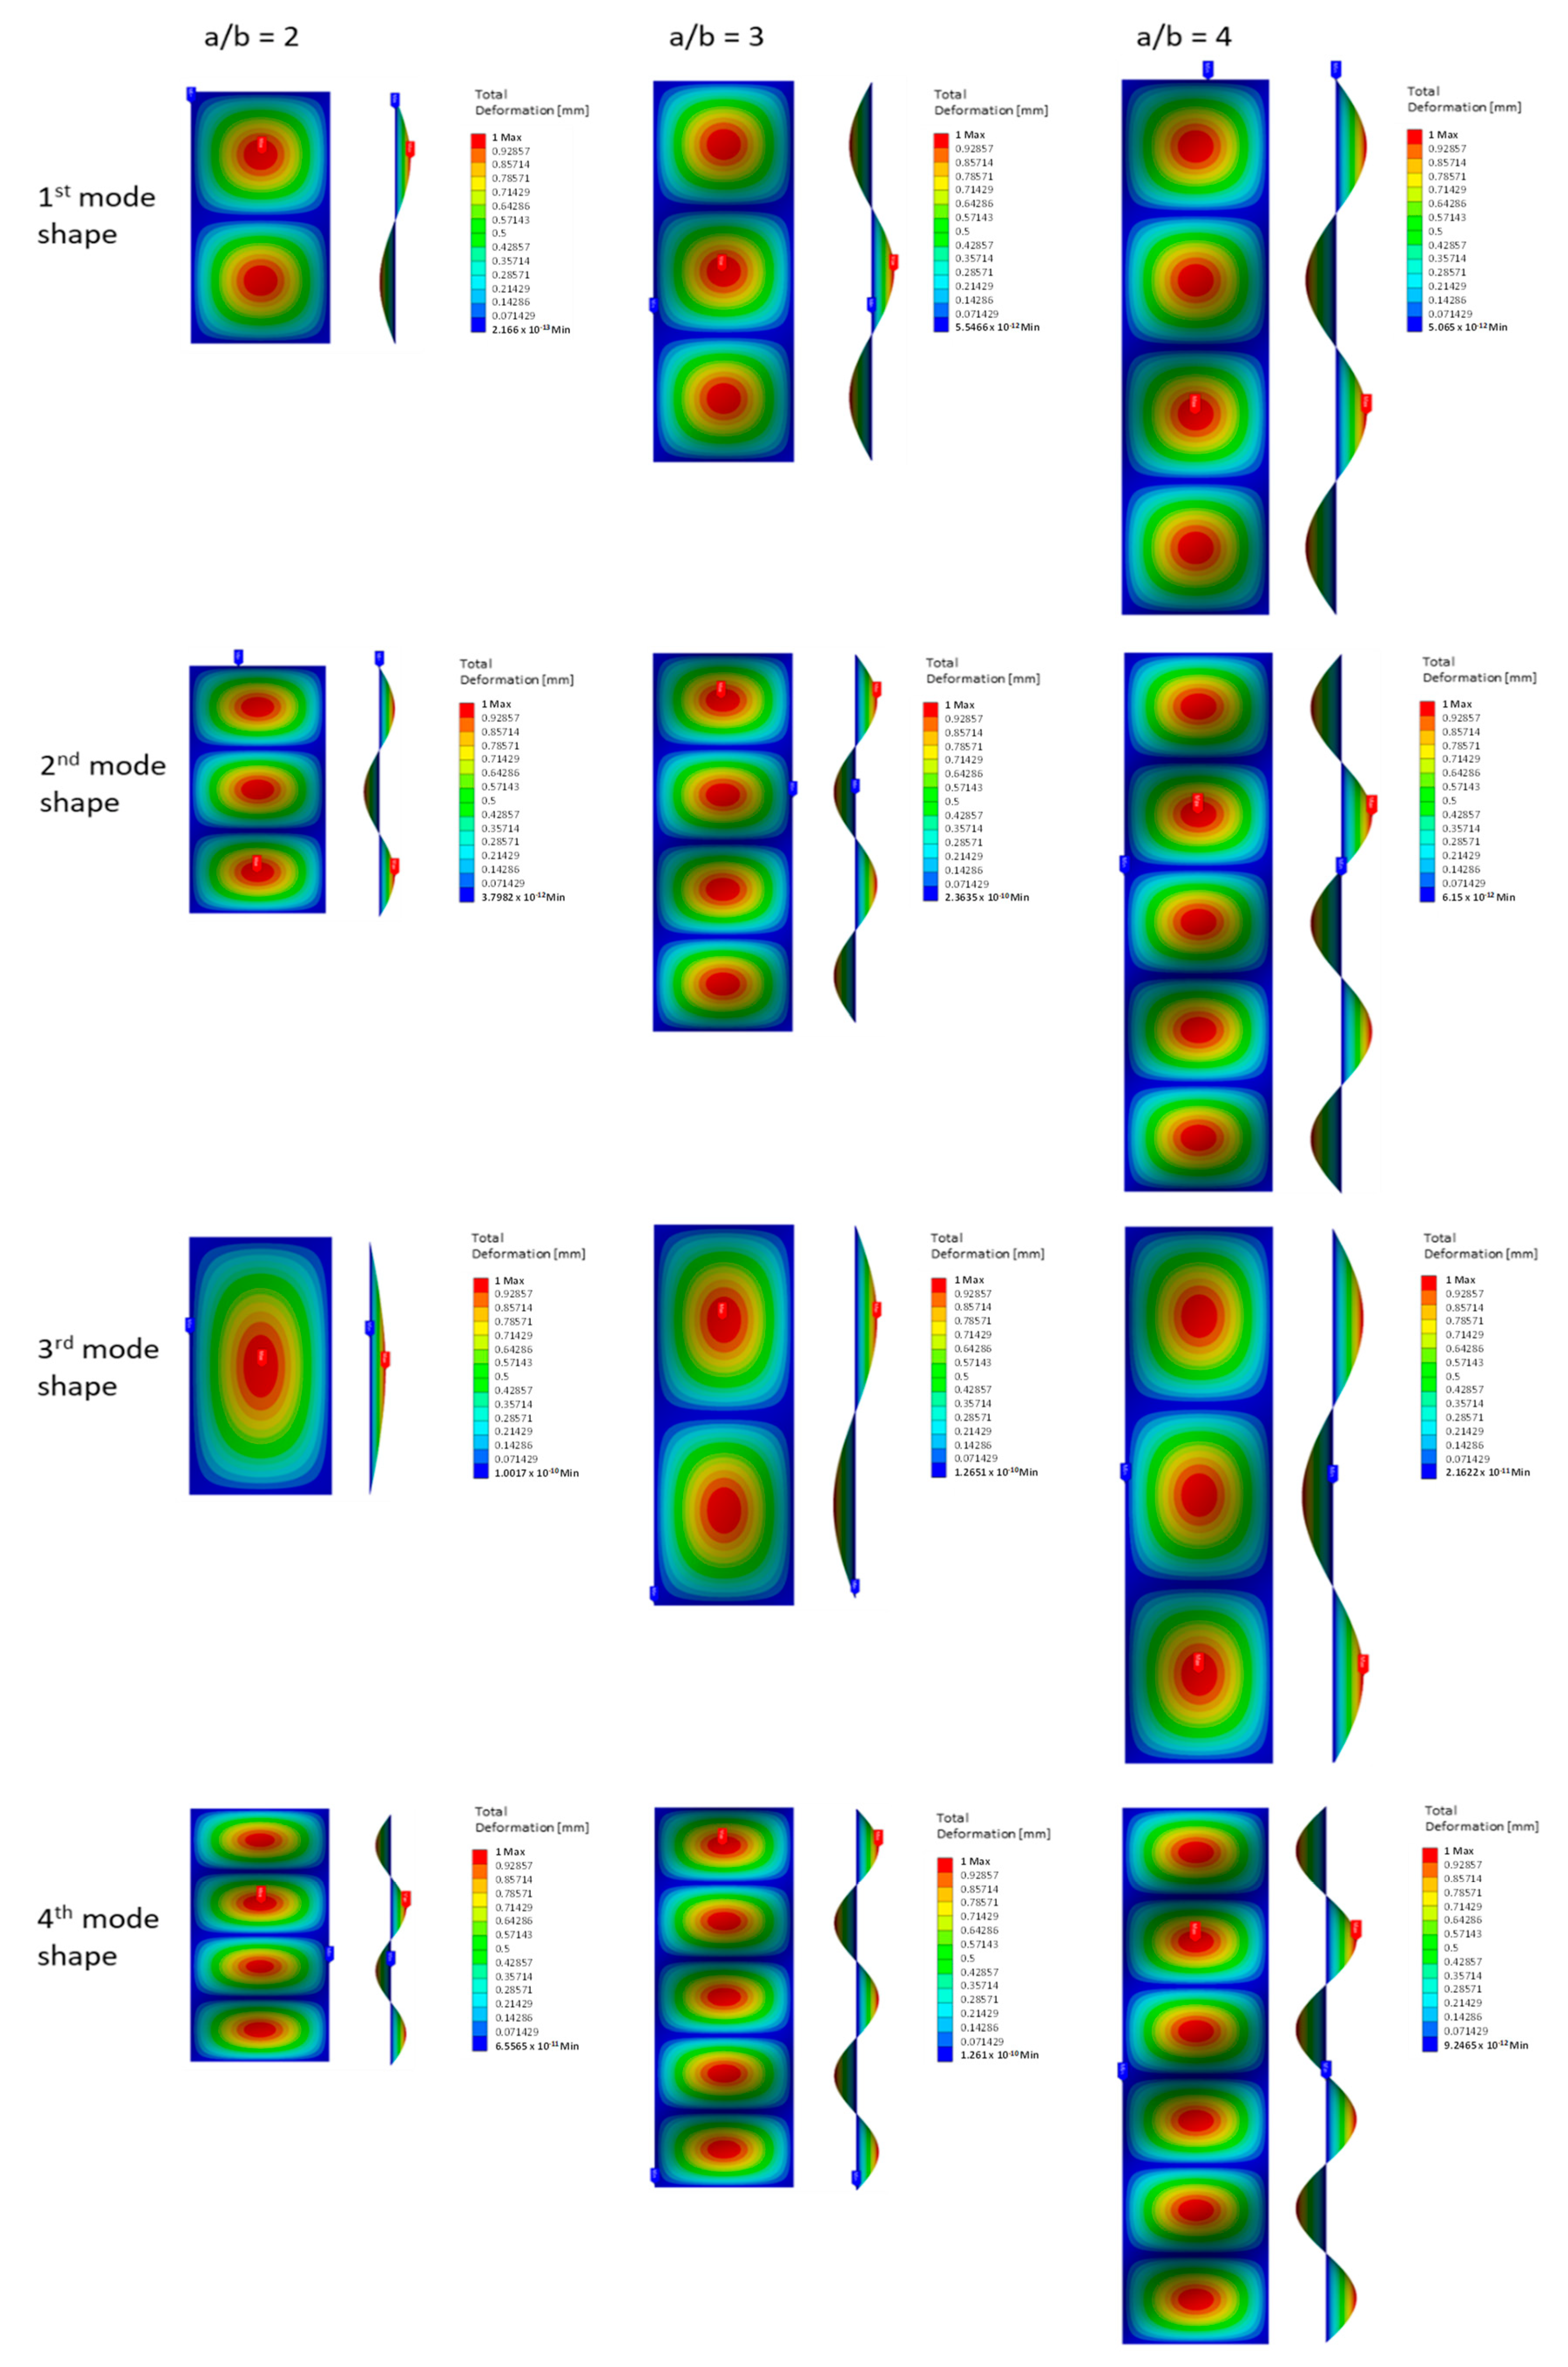
Figure 16 shows the first four mode shapes for the a/b ratio = 2, 3, and 4. As is evident, three aspect ratios gave a different total number of half-wavelengths. Neither one gave the same number of half-wavelengths. The number of half-wavelengths increased as the a/b ratio increased. The total number of half-wavelengths did not depend on the thickness of the plate [1].
For the aspect ratio of plate, a/b = 2, the number of half-wavelengths for the 1st mode shape indicated the presence of two half-wavelengths; however, for aspect ratios a/b = 3 and 4, the number of half-wavelengths increased, and the number of half-wavelengths appeared to be three and four, respectively.
There were three, one, and four half-wavelengths for a/b = 2 that appeared in the 2nd, 3rd, and 4th mode shapes, respectively. For the aspect ratio a/b = 3, the half-wavelengths that appeared in the 2nd, 3rd, and 4th shapes were four, two, and five, respectively. The mode shown in the five, three, and six number of half-wavelengths appeared in the 2nd, 3rd, and 4th mode shapes when the aspect ratio of the plate a/b was 4.
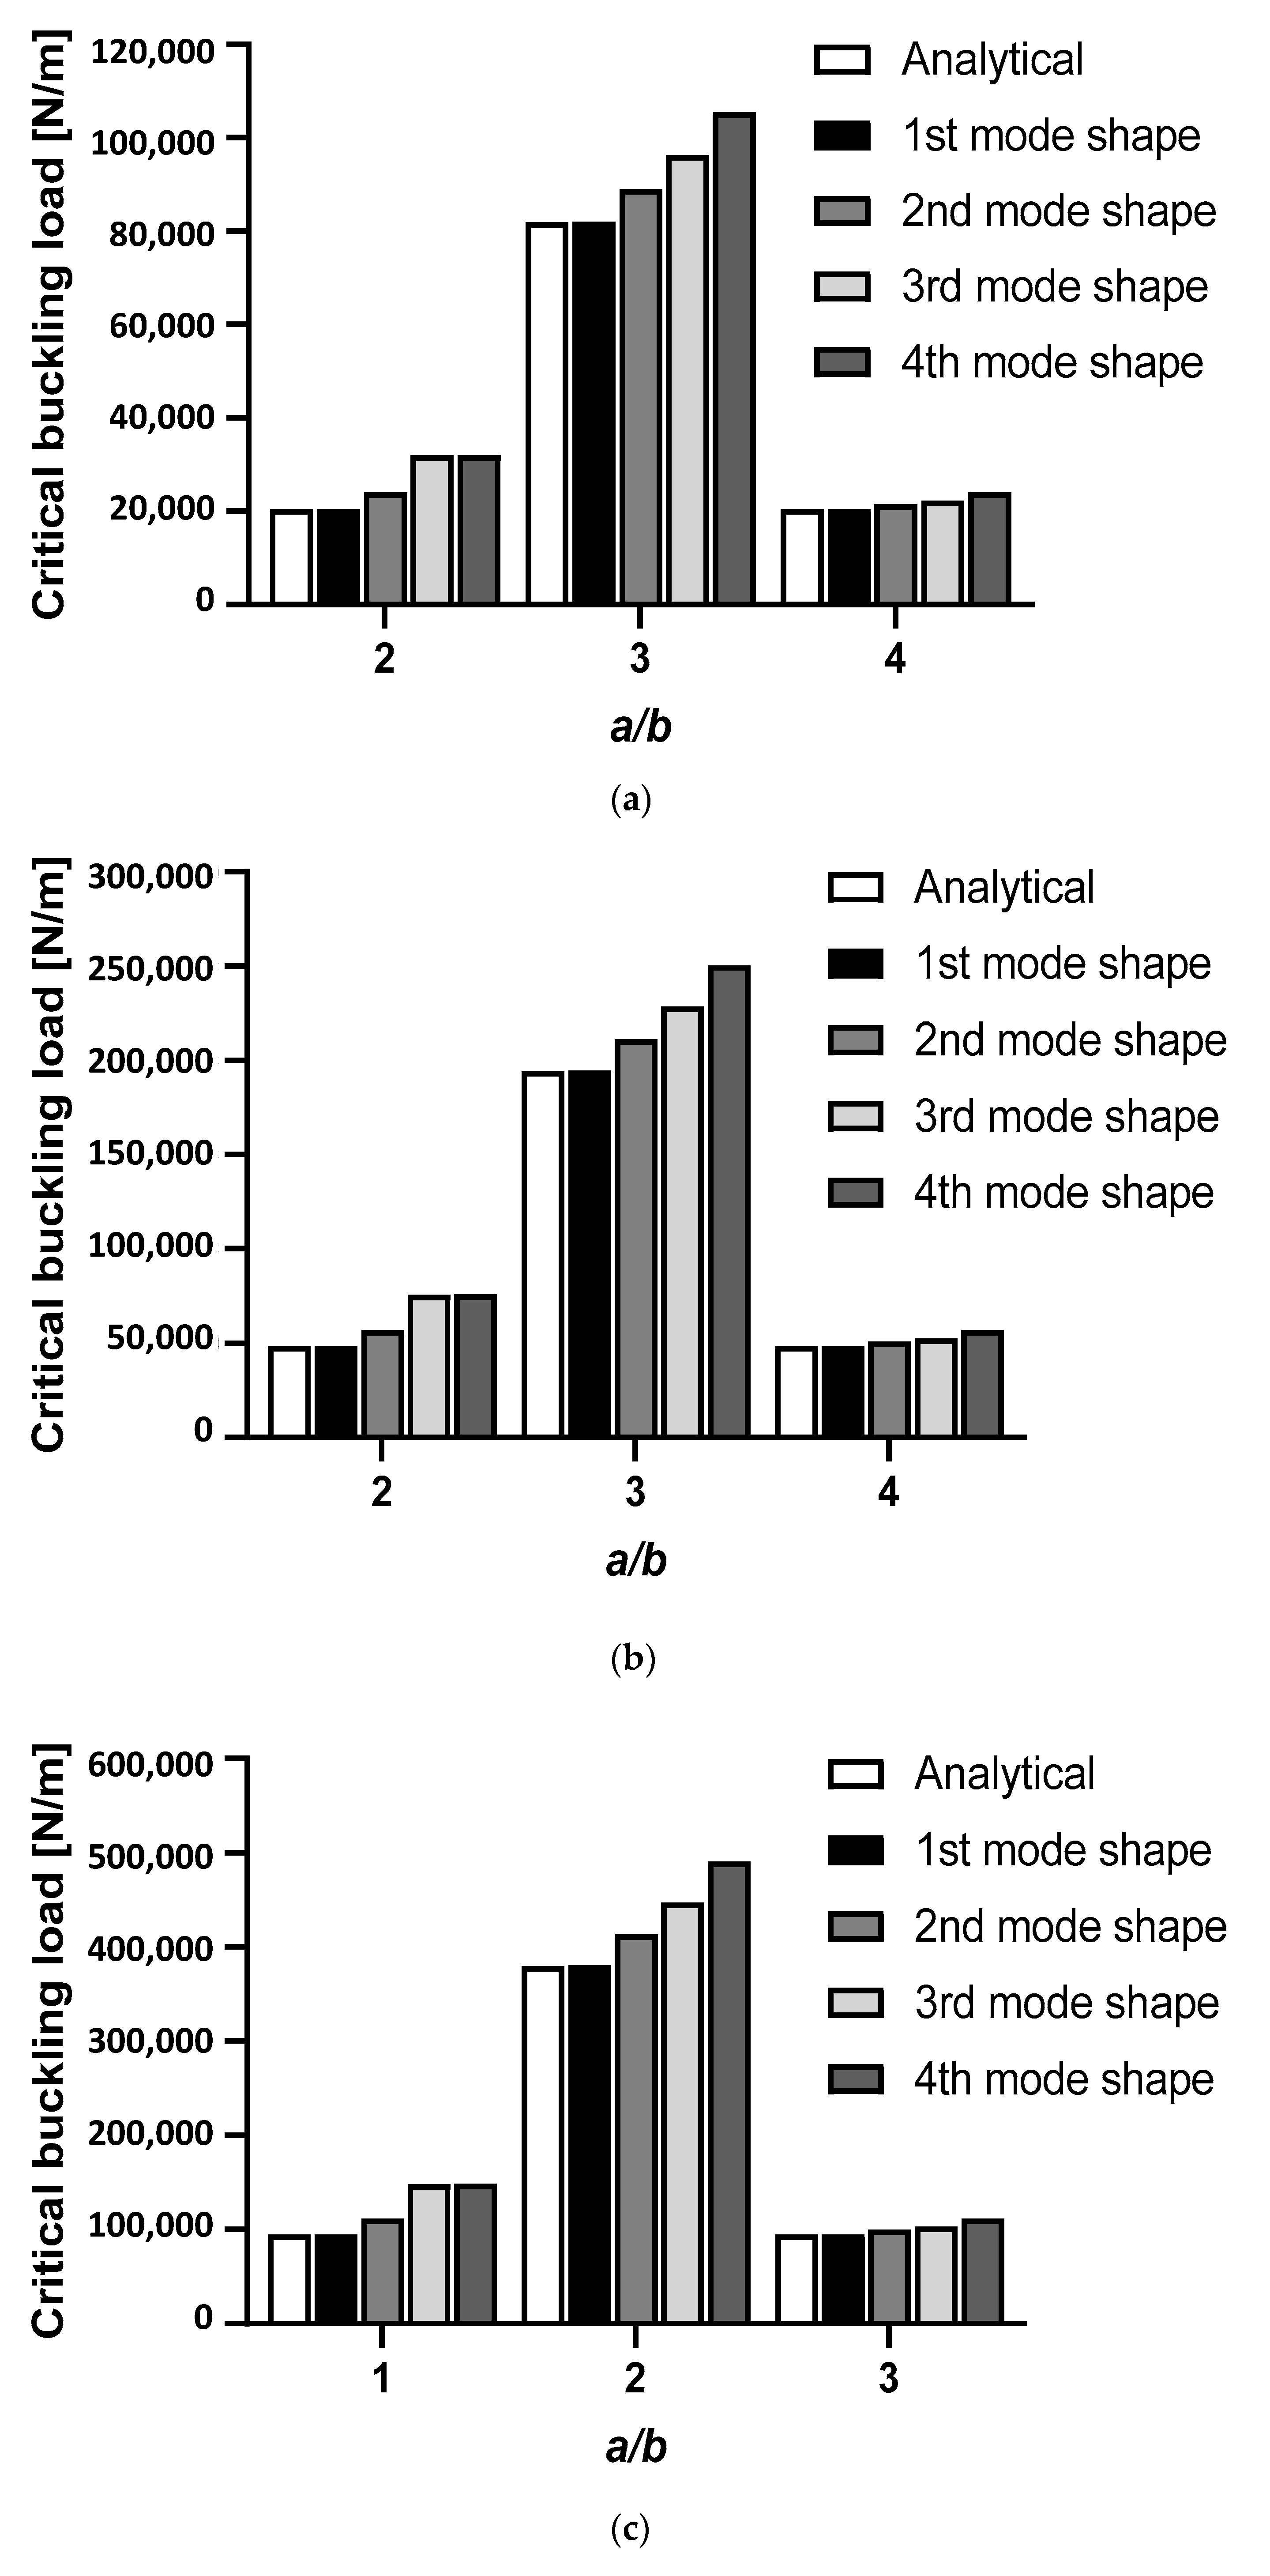
The critical buckling load obtained from the analytical data and from the first four mode shapes is shown in Figure 17. As is evident, the 1st mode shape was in extremely good agreement compared with the analytical calculation. This phenomenon was found in all aspect ratios a/b = 2, 3, and 4. At a thickness of the plate equal to 3 mm, the critical buckling load in 1st mode shape was slightly lower, at about 0.02%, for the a/b = 2 and 4 compared with the analytical data (Figure 17a). Furthermore, the critical buckling load in 1st mode shape in a/b = 3 was slightly higher, at about 0.1%, compared with the analytical data. The 4th mode shape showed a fairly higher critical buckling load value. The difference in the 28.73% error was found in the 4th mode shape at a/b = 3. The highest error was found in plate thicknesses of 3 mm, 4 mm, and 5 mm in the 4th shape mode (Figure 17) which was only found at a/b ratio = 2. For this aspect ratio, 4th mode shapes gave a difference of 56.35%, 56.64%, and 56.49%, which is higher than the analytical data for plate thicknesses of 3 mm, 4 mm, and 5 mm, respectively.

8. Results: Nonlinear Buckling

8.1. Effect of Thickness Change

The load versus displacement curve of three different plate thicknesses in specimen A and Specimen B is shown in Figure 18. The thickness of the longitudinal stringers was fixed = 4 mm in specimen A. In specimen B, the thickness of the sub-stiffeners and the longitudinal stringers were fixed = 2 mm and 4 mm, respectively.
As is shown in Figure 18, the thickness of the plate significantly affected the ultimate panel collapse load of the stiffened panel. The load of the stiffened panel decreased after the ultimate load occurred. Both specimens have the ultimate buckling collapse load which increased along with increasing plate thickness. A plate thickness of 5 mm has an ultimate buckling collapse load that is higher than that of a plate thickness of 3 mm and 4 mm.
A plate thickness of 5 mm in Specimen A gave an ultimate buckling collapse load of 790.7 kN, whereas with the 3 mm and 4 mm plate thicknesses, the ultimate buckling collapse loads were at 477.2 kN and 655.6 kN, respectively. This phenomenon found that the 5 mm plate thickness increased by 65.7% and 20.61% compared with the 3 mm and 4 mm plate thickness, respectively (Figure 18a).
For the case in Specimen B, the 995.2 kN of the ultimate buckling collapse load was obtained from the 5 mm plate thickness, whereas with the 3 mm and 4 mm plate thicknesses, the ultimate buckling collapse loads were at 633.0 kN and 825.8 kN, respectively. This means that the thickness of the 5 mm plate gave an increase of 57.22% and 20.51% compared with the 3 mm and 4 mm plate thicknesses, respectively (Figure 18b).
The total energy created during the buckling process is presented in Figure 19. This energy ended after all displacements were met. It is evident that the plate thickness significantly influenced the total energy during the buckling process. A plate thickness of 5 mm has more energy than a plate thickness of 3 mm or 4 mm. The plate with the 3 mm thickness has the least energy. This was found in Specimen A and Specimen B. Specimen A had a plate thickness of 5 mm and had a total energy increase of 35.72% compared with the plate thickness of 3 mm. An increase of 56.46% of total energy was found in Specimen B at a plate thickness of 5 mm compared with 3 mm.
Ultimate panel collapse loads and the total energy of the three ELT ratios are presented in Table 8. There was no significant difference in the results of the three ELT ratios. The highest difference of the ultimate panel collapse loads occurred when the ELT ratio = 7 in Specimen B with a 5 mm plate thickness. There was a difference of 7.8 kN when the ELT ratio = 7 compared with the ELT ratio = 5. No difference of more than 7.8 kN was found. In the ELT ratio for total energy, Specimen A, with a plate thickness of 5 mm had the highest difference in total energy values for ELT 5 and 7. The total energy from ELT 7 was 59.5 J higher than ELT = 5.
The equivalent strain contour in Specimen A and Specimen B, which occurred due to the buckling process, are presented in Figure 20 and Figure 21. As is evident, plate thickness significantly influences the distribution of the strain. As seen in Figure 20a, there is a fairly high strain in the center of the plate in Specimen A when a plate thickness of 3mm was used. Compared with the 5 mm plate, the strain was less pronounced in the center of the plate (Figure 20c). The plate thickness of 3 mm at time t = 0.35 s seems already to have experienced a quite significant deformation. This deformation becomes more apparent as the buckling process progresses. For stiffened panels with a thickness of plates equal to 4 mm and 5 mm, the deformation was not clearly visible at time t = 0.35 s (Figure 20b,c). A fairly slight deformation occurs with a plate thickness of 5 mm. In Specimen B, a fairly high strain was also seen in the stiffened panels when the plate thickness was 3 mm (Figure 21a). Longitudinal stringers and sub-stiffeners showed a significantly higher deformation at t = 0.75 s and t = 1 s. Deformation was not clearly visible at time t = 0.35 s with plate thicknesses of 4 mm and 5 mm; however, the least strain was achieved by the 5 mm plate thickness (Figure 21b). The maximum strain experienced in the middle longitudinal stiffener was after t = 0.35 s.

8.2. Effect of Geometrical Change

Figure 22 shows the load versus displacement curve from Specimen A and Specimen B with three different thicknesses of longitudinal stringers and sub-stiffeners. The plate thickness was fixed at = 5 mm for both specimens. Thickness of the longitudinal stringers were fixed = 4 mm in Specimen B.
As can be seen in Figure 22, the thickness of the longitudinal stringers in Specimen A moderately affected the ultimate panel collapse load. Stiffened panels with a thickness of 6 mm appeared to have the highest ultimate buckling collapse load strength. This was followed by 5 mm and 4 mm thickness of the longitudinal stringers; however, the thickness of the sub-stiffeners appeared to have a slight effect on the ultimate buckling collapse load in Specimen B. Sub-stiffeners with a thickness of 3 mm were only slightly higher than those of 2 mm. However, the large thickness of the sub-stiffeners still gave the ultimate panels collapse load a higher value than the smaller thickness of the sub-stiffeners.
In Specimen A, the thickness of 4 mm longitudinal stringers gave the ultimate buckling collapse load of 790.7 kN. This value was smaller than the value obtained by the thickness of 5 mm and 6 mm. The ultimate buckling collapse at these thicknesses were at 839.6 kN and 884.0 kN, respectively (Figure 22a). This provided an increase of 6.18% and 11.8% compared to 4 mm, respectively.
For specimen B, there was no significant difference in the ultimate buckling collapse load for the three thicknesses of the sub-stiffeners. Sub-stiffeners with a thickness of 2 mm gave a value of 995.2 kN compared with the 3 mm which was 1025.1 kN. This value gave the 3 mm thickness was 3% higher compared to 2 mm (Figure 22b).
Figure 23 shows the total energy generated during the buckling process. It is evident that the highest total energy difference occurred in Specimen A with a longitudinal stringers thickness of 6 mm followed by 5 mm and 4 mm. At a 6 mm thickness, the total energy generated was 1927 J. Although, for 5 mm and 4 mm thicknesses, the total energy generated were 1727.7 J and 1499.7 J, respectively. The 6 mm thickness increased the total energy by 11.54% and 28.49% compared with the thicknesses of 5 mm and 4 mm, respectively. For Specimen B, the difference in the total energy of the three thicknesses of the sub-stiffeners were not very visible; however, sub-stiffeners with 3 mm have a 2.25% higher total energy compared to 2 mm thickness.
Table 9 shows the ultimate panel collapse loads and the total energy of the three ELT ratios. The highest difference occurred in the total energy when ELT ratio = 7 in Specimen A with the thickness of the longitudinal stringers = 4 mm. There was a difference of 59.5 J from ELT ratio = 7 when compared to the ELT ratio = 5.
Figure 24 and Figure 25 show the equivalent strain contour in Specimen A and Specimen B, respectively. As is evident, the thickness of the longitudinal stringers in Specimen A moderately affected the distribution of the strain. Furthermore, the maximum strain occurred in the longitudinal stringers (Figure 24). At t = 0.35 s, the maximum strain is in the center of the longitudinal stringers for all three thicknesses (4 mm, 5 mm, and 6 mm). Longitudinal stringers experience a fairly high strain. At the 6 mm thickness of the longitudinal stringers, the deformation is quite small compared with the thicknesses of 4 mm and 5 mm when time t is more than 0.35 s. In Specimen B, there was no significant difference found in the distribution of the strain between the 2 mm, 2.5 mm, and 3 mm thicknesses of the sub-stiffeners. It is evident that at time t = 0.35 s, the strain in the stiffened panels seem almost the same even though the size of the thickness of the sub-stiffeners is different. The three thicknesses proposed also show that the maximum and minimum strains are at the top of the stiffened panel. At the end of the buckling process or at time t = 1 s, they also almost show the same distribution of strain. A fairly comprehensive strain distribution exists at time t = 0.75 s. As shown in Figure 25, the difference in strain for time t = 1 s is quite small.

8.3. Effect of Material Change

Figure 26 and Figure 27 show the load versus displacement curves of three different materials. For Specimen A in Figure 26a, the dimension of the specimen used was fixed = 3 mm plate thickness and 4 mm longitudinal stringer thickness. For Specimen B in Figure 26b, the dimension of the specimen used was fixed = 3 mm plate thickness, 4 mm longitudinal stringer thickness, and 2.5 mm sub-stiffeners thickness.
It can be seen in Figure 26 that the S355JR-EN10210 material has a moderately higher ultimate panel collapse load compared with the S235JR-EN10025 (B) and S235JR-EN10025 (A) materials. This incident was found in Specimen A and Specimen B.
In Specimen A, the ultimate panel collapse load value on the S355JR-EN10210 material was 553.1 kN. Moreover, the materials S235JR-EN10025 (A) and S235JR-EN10025 (B) were at values of 477.2 kN and 516.9, respectively. It was found that the material S355JR-EN10210 gave the ultimate panel collapse load values that were 15.91% and 7% higher than the material S235JR-EN10025 (A) and S235JR-EN10025 (B), respectively. In Specimen B, it was also found that the S355JR-EN10210 material had 19.48% and 7.9% higher ultimate panel collapse load values compared to S235JR-EN10025 (A) and S235JR-EN10025 (B), respectively.
The load versus displacement curves of three different materials in Specimen A is presented in Figure 27a. The dimension of the specimen was fixed to 5 mm plate thickness and 4 mm longitudinal stringer thickness. Figure 27b shows the load versus displacement curves of three different materials in Specimen B. The dimension of the specimen was fixed to 5 mm plate thickness, 4 mm longitudinal stringer thickness, and 2.5 mm sub-stiffeners thickness.
Specimen A gave the ultimate panel collapse load for the materials S235JR-EN10025 (A), S235JR-EN10025 (B), and S355JR-EN10210 of 790.7 kN, 899.3 kN, and 990.7 kN, respectively. These values indicated that the material S355JR-EN10210 has 10.16% and 25.29% higher than the material S235JR-EN10025 (B) and S235JR-EN10025 (A). In Specimen B, the S355JR-EN 10,210 material has an ultimate panel collapse load value of 5.53% and is 17.34% higher than that of S235JR-EN10025 (B) and S235JR-EN10025 (A) (Figure 27b).
Table 10 and Table 11 show the total energy produced during the buckling process along with the ELT ratios. It was found that the S355JR-EN 10,210 material had the highest total energy compared with the S235JR-EN10025 (B) and S235JR-EN10025 (A) materials. In Table 10, the highest ELT ratio difference in total energy was found in Specimen B with a plate thickness of 5 mm. The total energy was 6.98% higher in the ELT ratio 6 compared to the ELT ratio 5. This difference in value occurred in the S355JR-EN10210 material.

9. Overall Discussion: Linear vs. Nonlinear Behaviors

For the linear buckling analysis, the findings of this study show that the element length to thickness ratios (ELT) can provide quite good results for the critical buckling load compared with analytical calculations. The highest error of critical buckling load value was only 0.65% higher than the value from the analytical result. This error was obtained when the ELT ratio = 7 and from the specimen with a/b ratio = 3 with the 5 mm plate thickness. No errors higher than 0.65% were found in the all ELT ratios (5, 6, and 7) compared to the analytical data. On the other hand, the smallest error was found in the 5 and 7 ELT ratio with the specimen aspect ratio a/b = 2 dan 4, with 3 mm plate thickness. The error was not more than 0.01% compared to the analytical value. All calculations with the finite element and analytical showed good results and were in accordance with the literature [1]. The number of half-half-wavelengths depending on the aspect ratio a/b is the same as in the literature [1] (Figure 2 and Figure 3).
It is a fact that the a/b ratio of the specimen affects the number of half-wavelengths and the critical buckling load [1]. This fact also can be seen in the simulation with the finite element in this study (Figure 16 and Figure 17). In particular, all the buckling deformation patterns that are shown in Figure 16 exhibit cartesian symmetry. This behavior is due to the fact that the structural system under consideration is symmetric and the material is isotropic, as described by Zucco and Weaver in “The role of symmetry in the postbuckling behaviour of structures” [52]. A total number of two, three, and four half-wavelengths appear in the 1st mode shape of the specimen with an a/b ratio of 2, 3, and 4, respectively. The 1st mode shape gives remarkably good agreement of the critical buckling load compared with the analytical calculation (e.g., the error is not more than 0.02% for the a/b = 2 and 4, and 0.1% for the a/b = 3 compared with the analytical). In the case of plate thickness, it severely affects the value of the critical buckling load, but the reverse is true for the number of apparent half-wavelengths. For instance, the 3 mm thickness of the plate produces the critical buckling load of 20,498 N/m, 81,994 N/m, and 20,498 N/m for aspect ratio a/b = 2, 3, and 4, respectively. These three values are increased exactly by 362.97% compared to 5 mm plate thickness, which is 94,900 N/m, 379,600 N/m, and 94,900 N/m. However, the thickness of the plate seems to not affect the number of half-wavelengths.
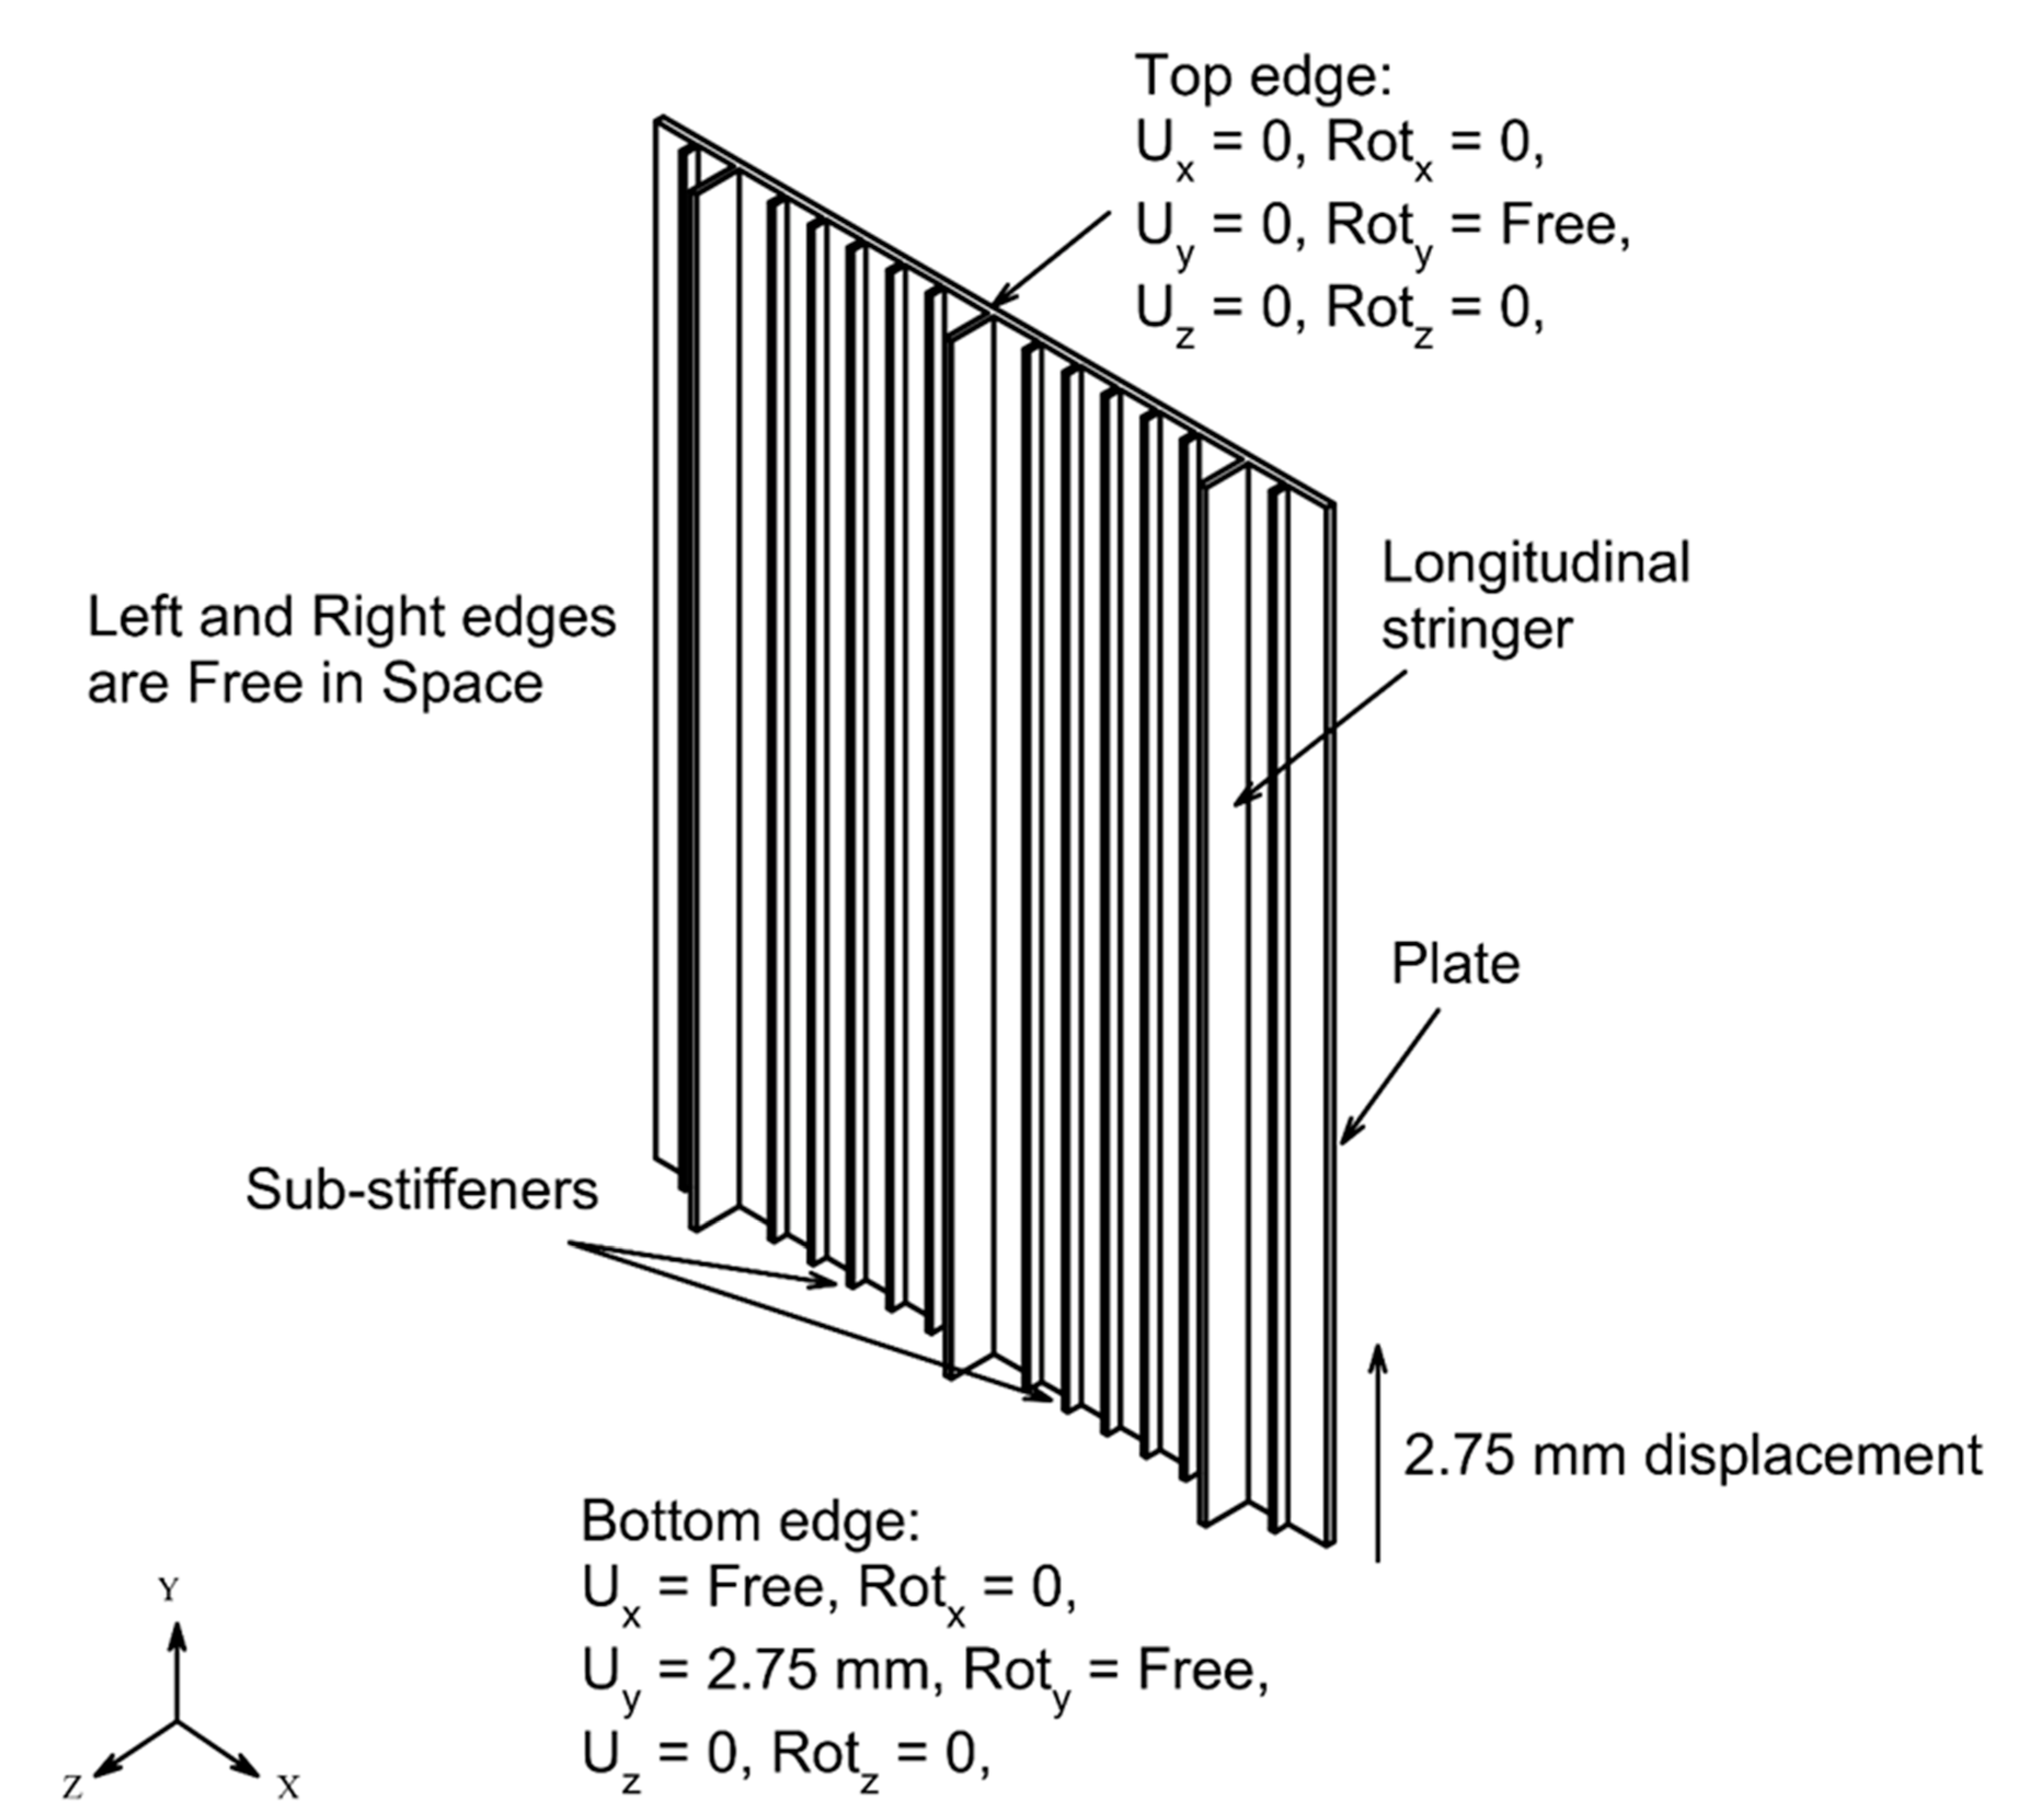
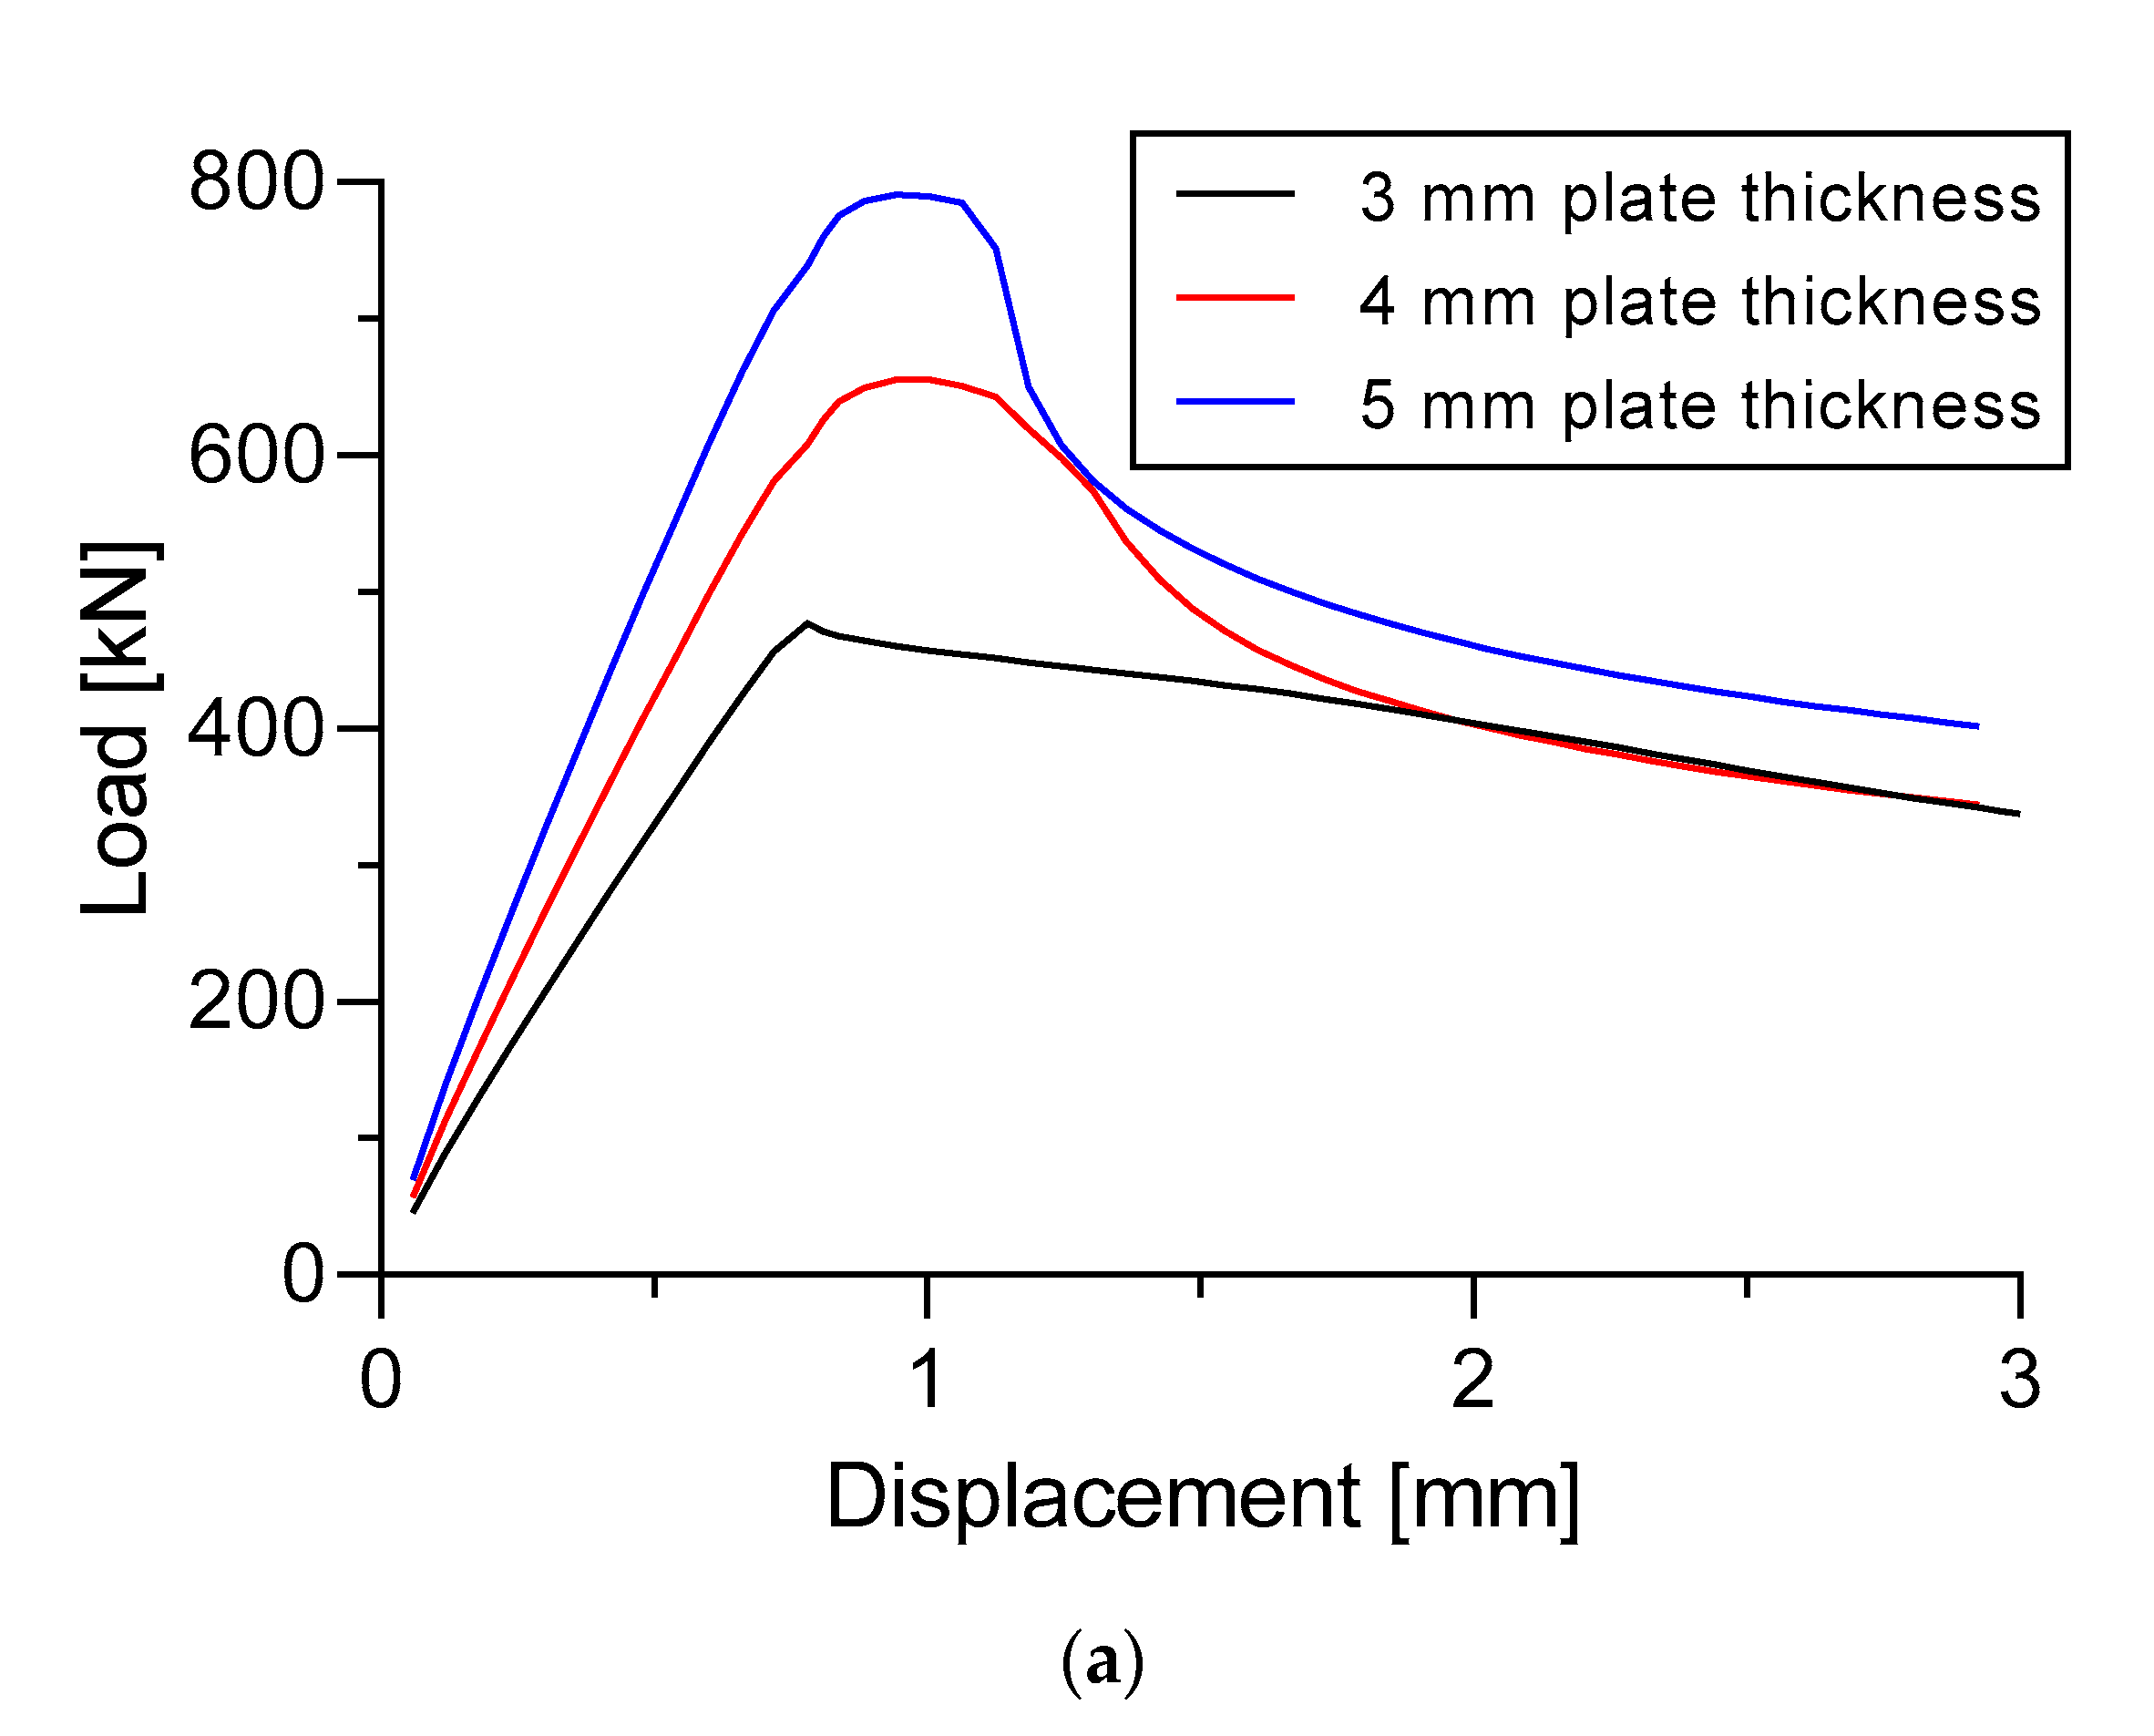
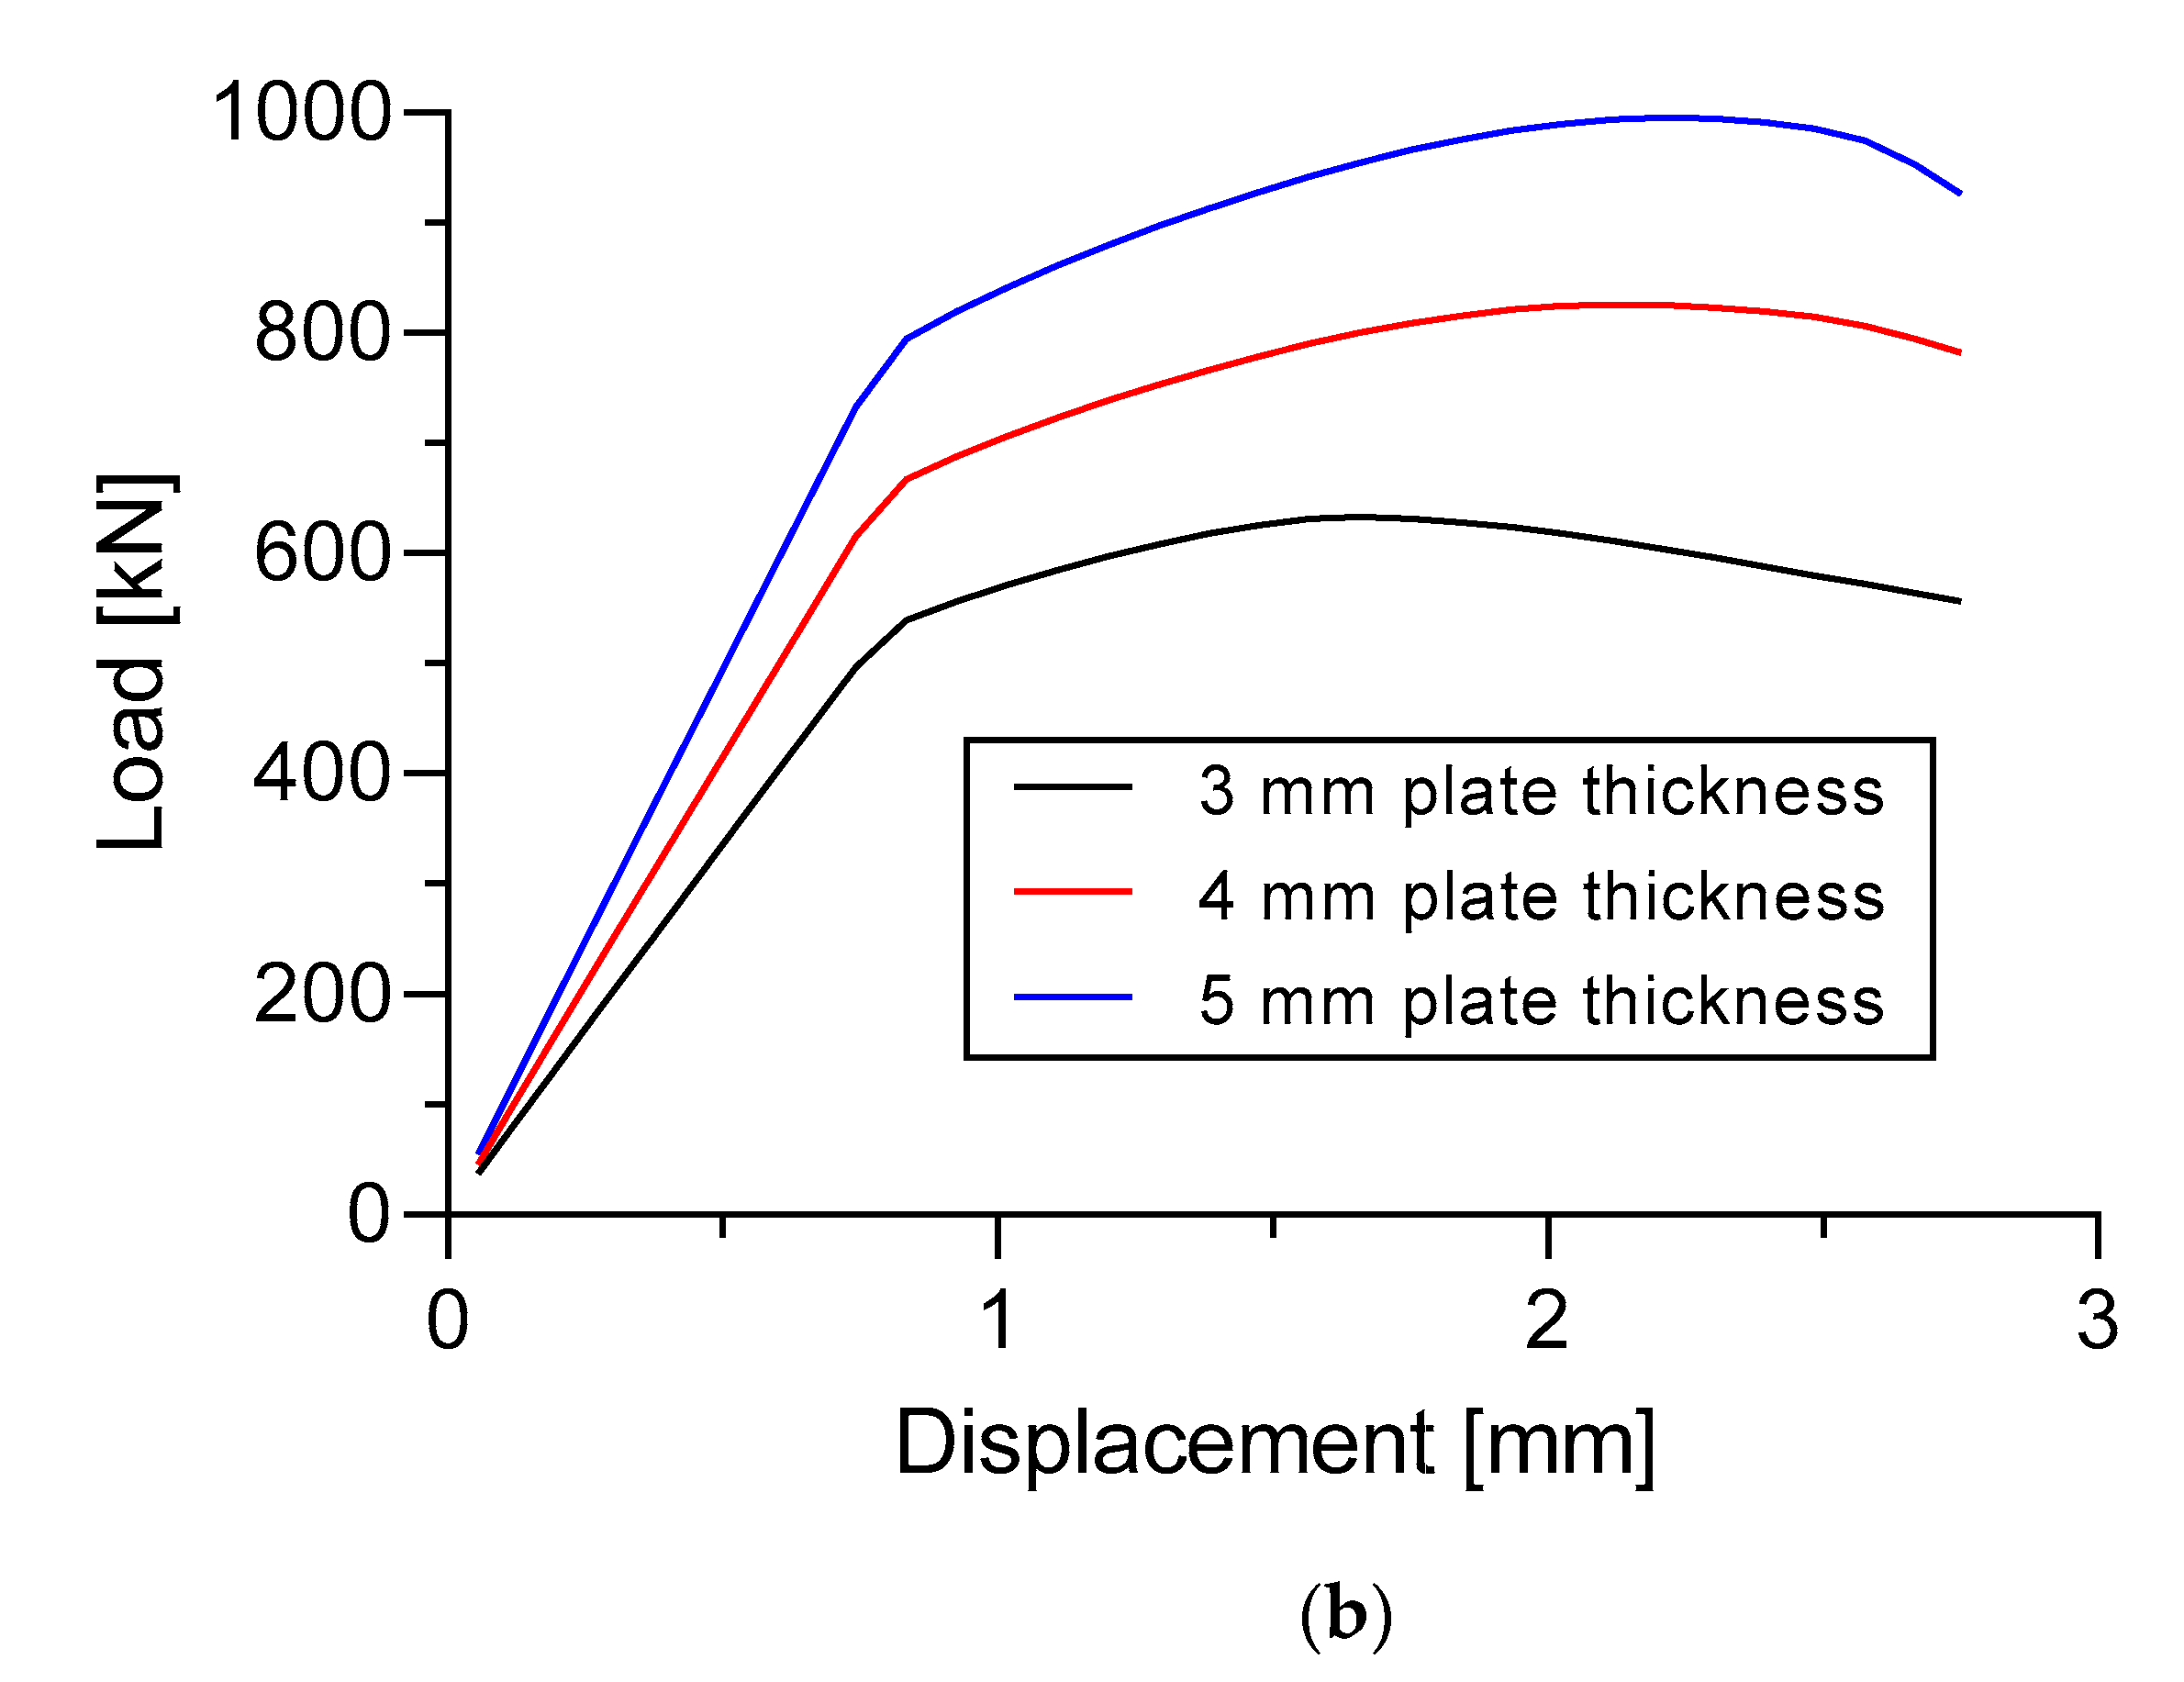
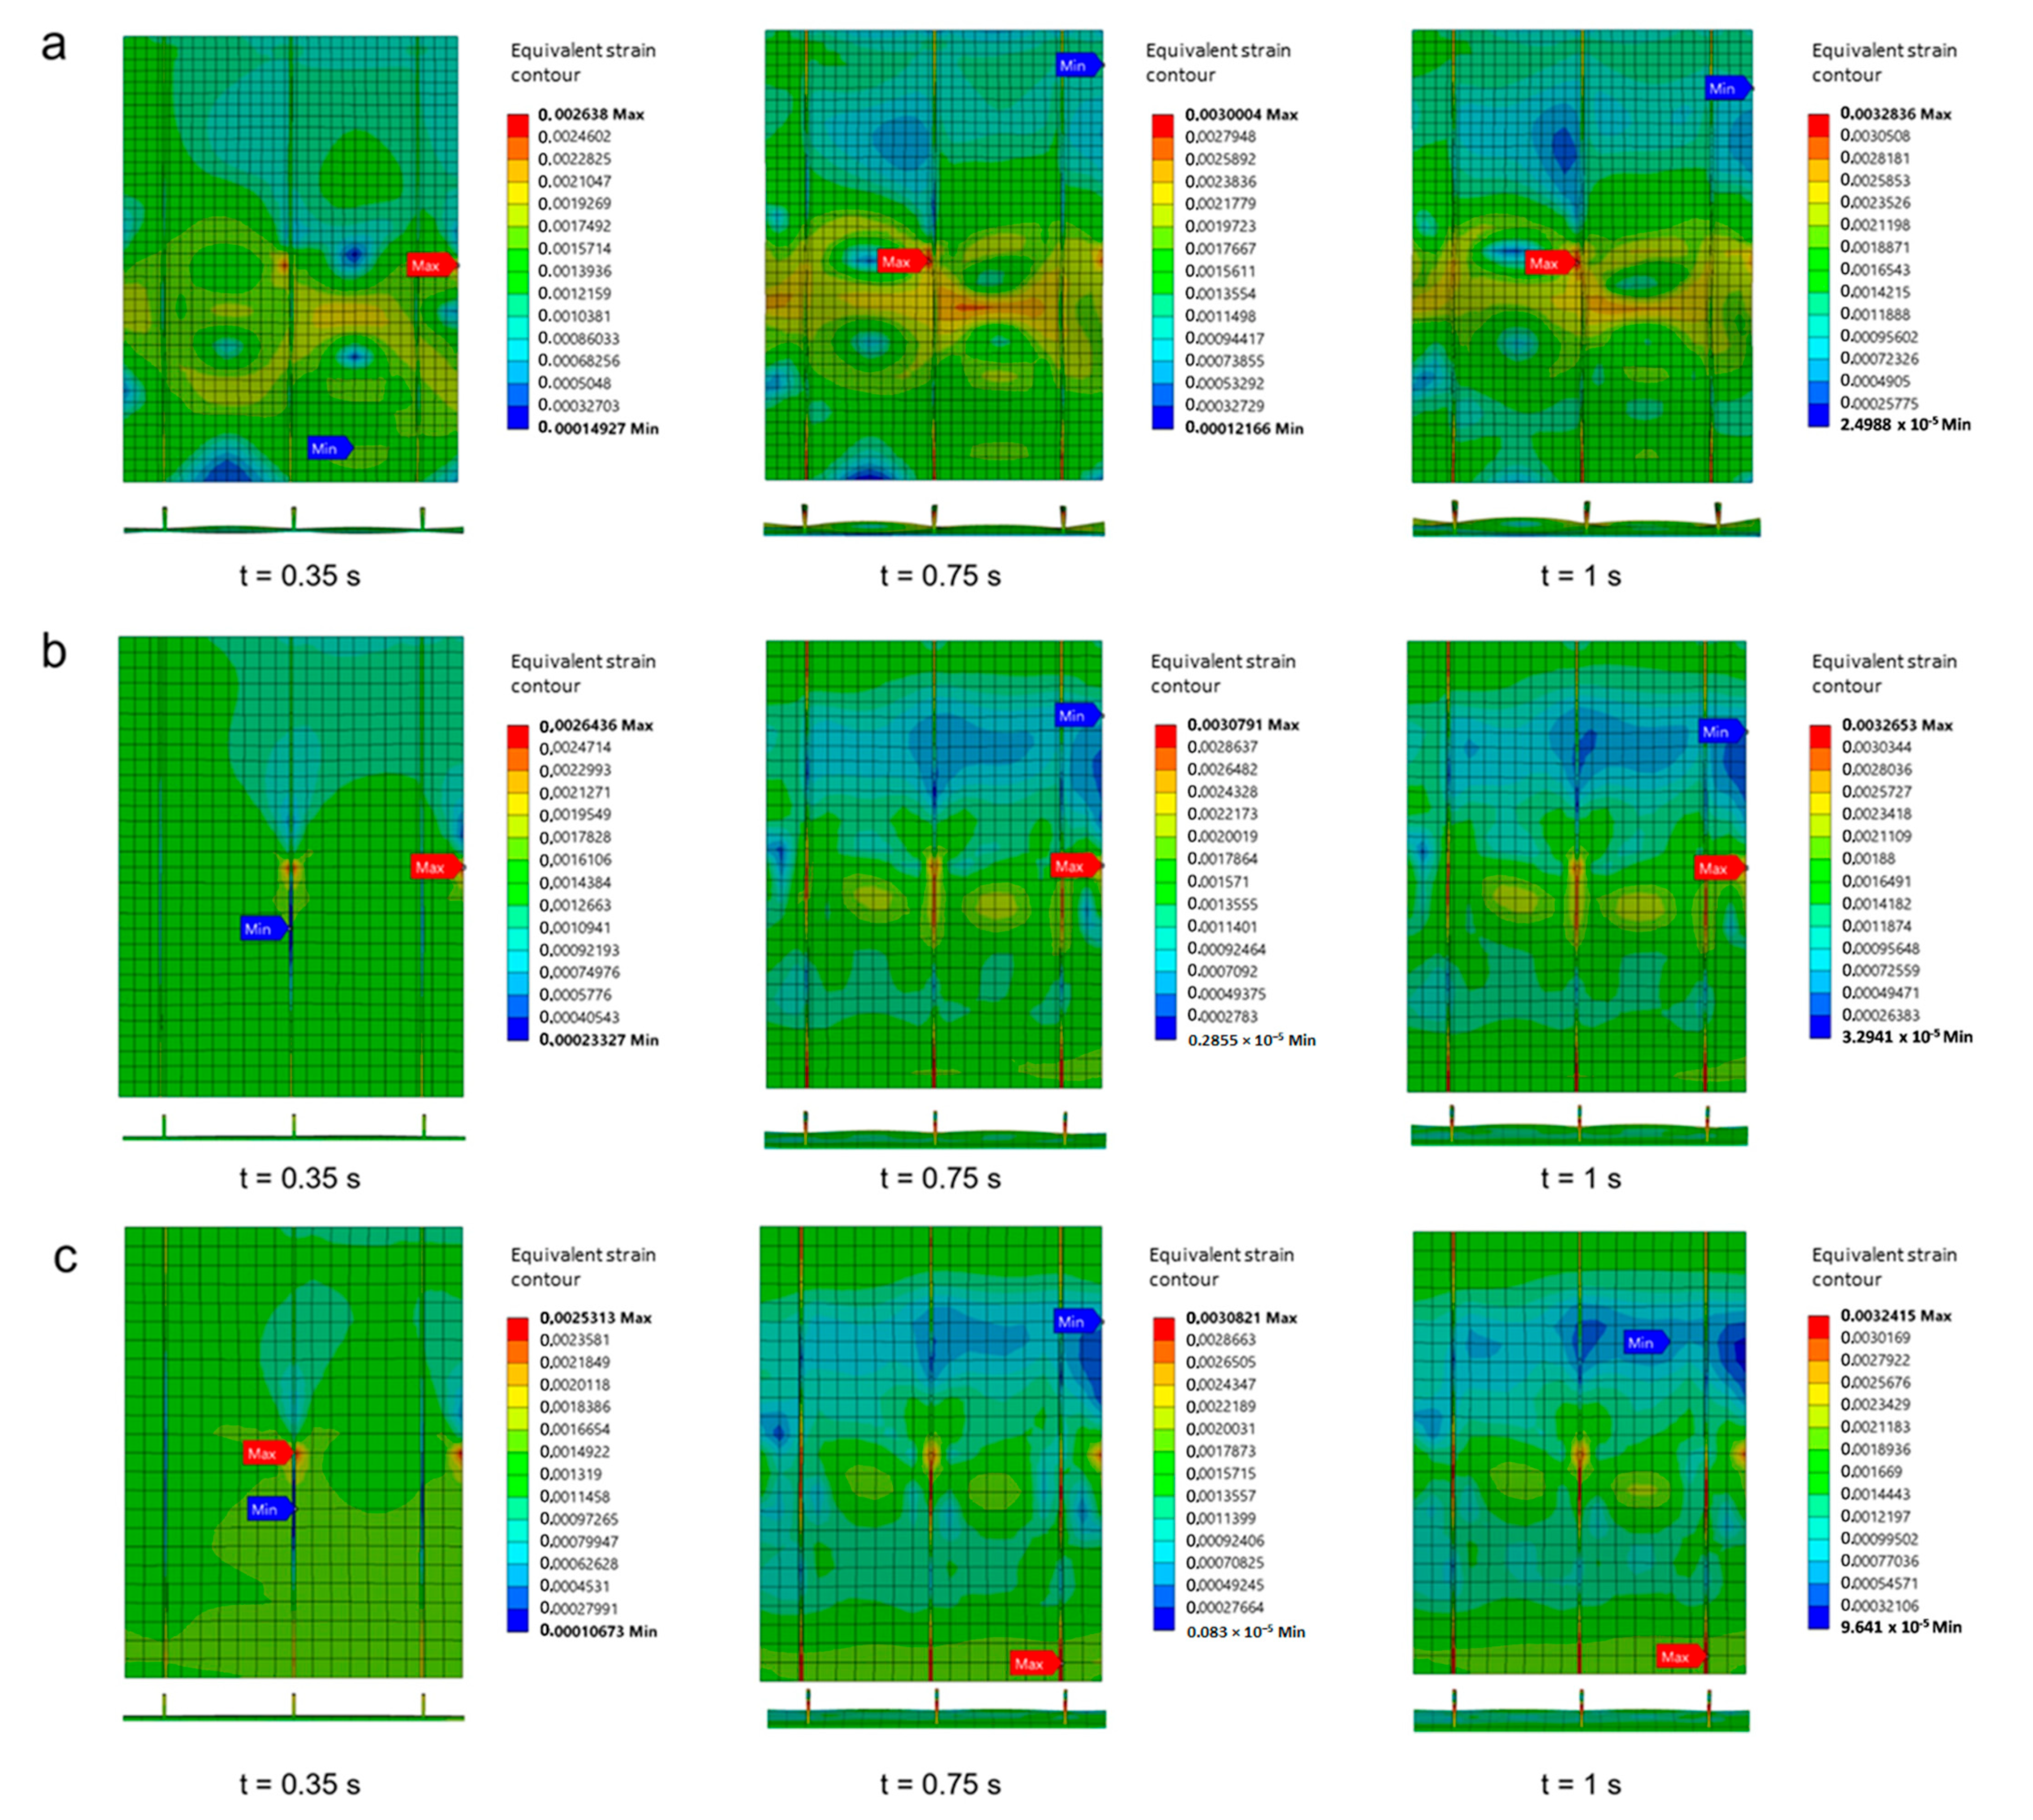
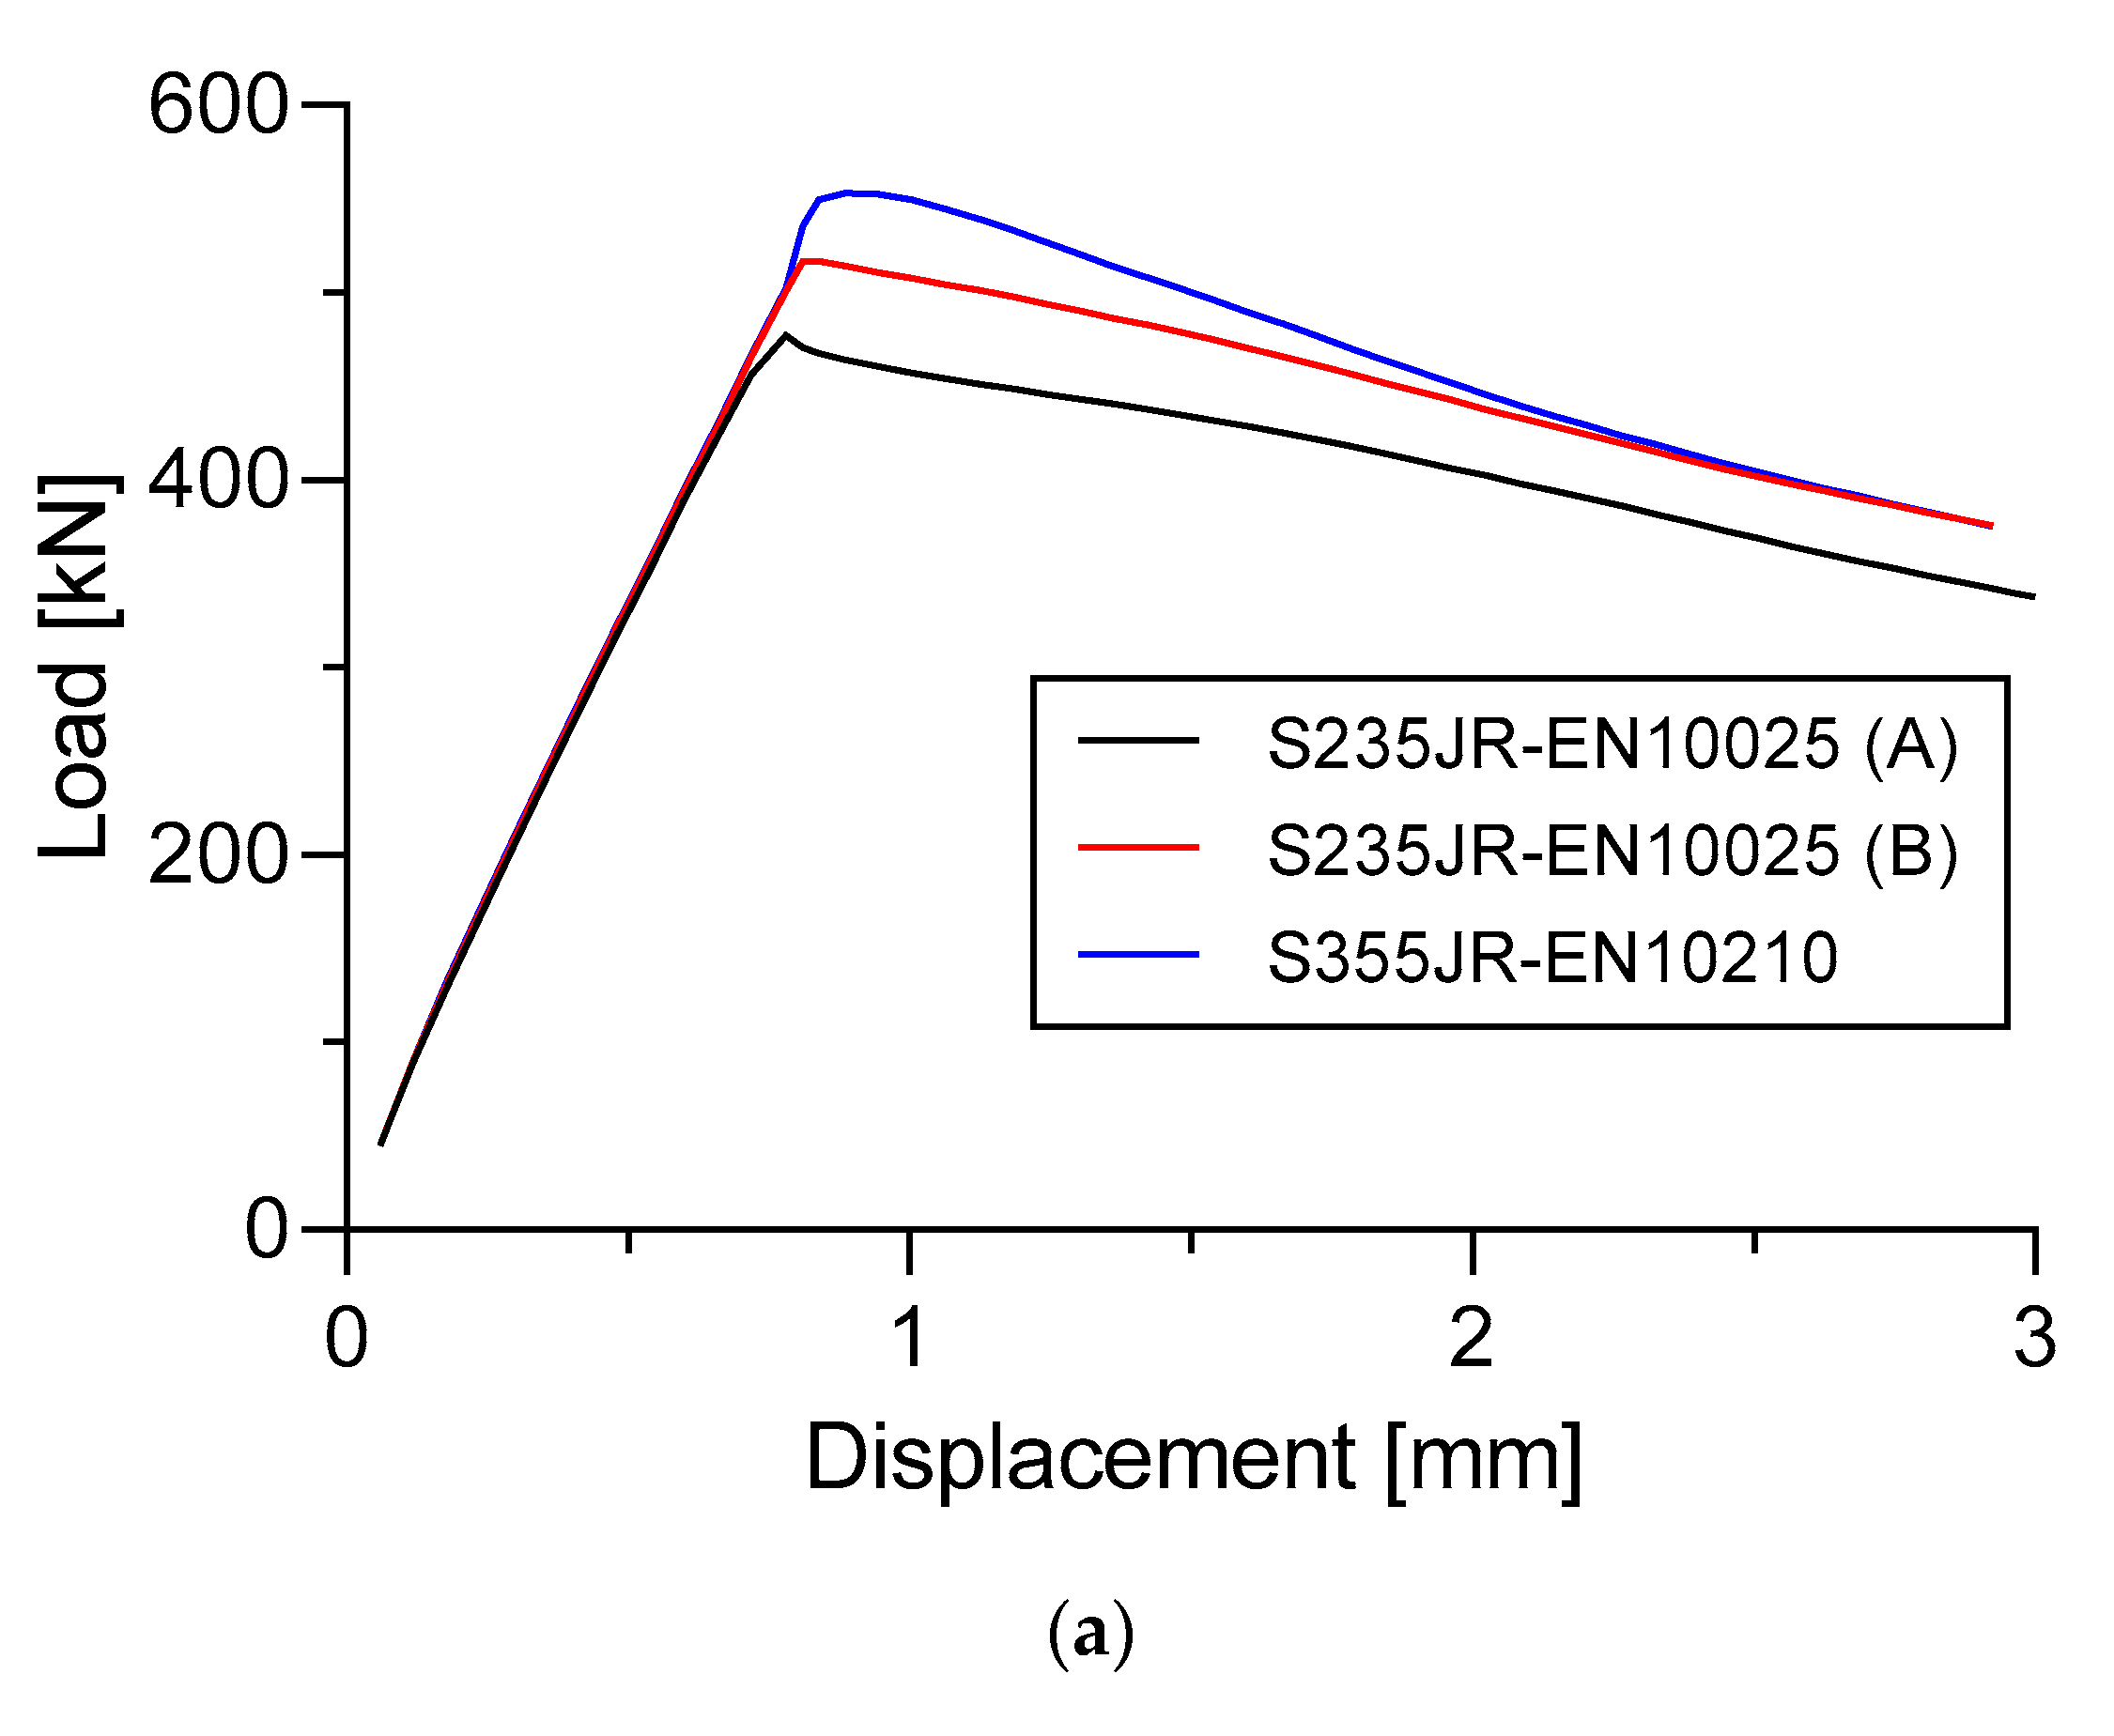
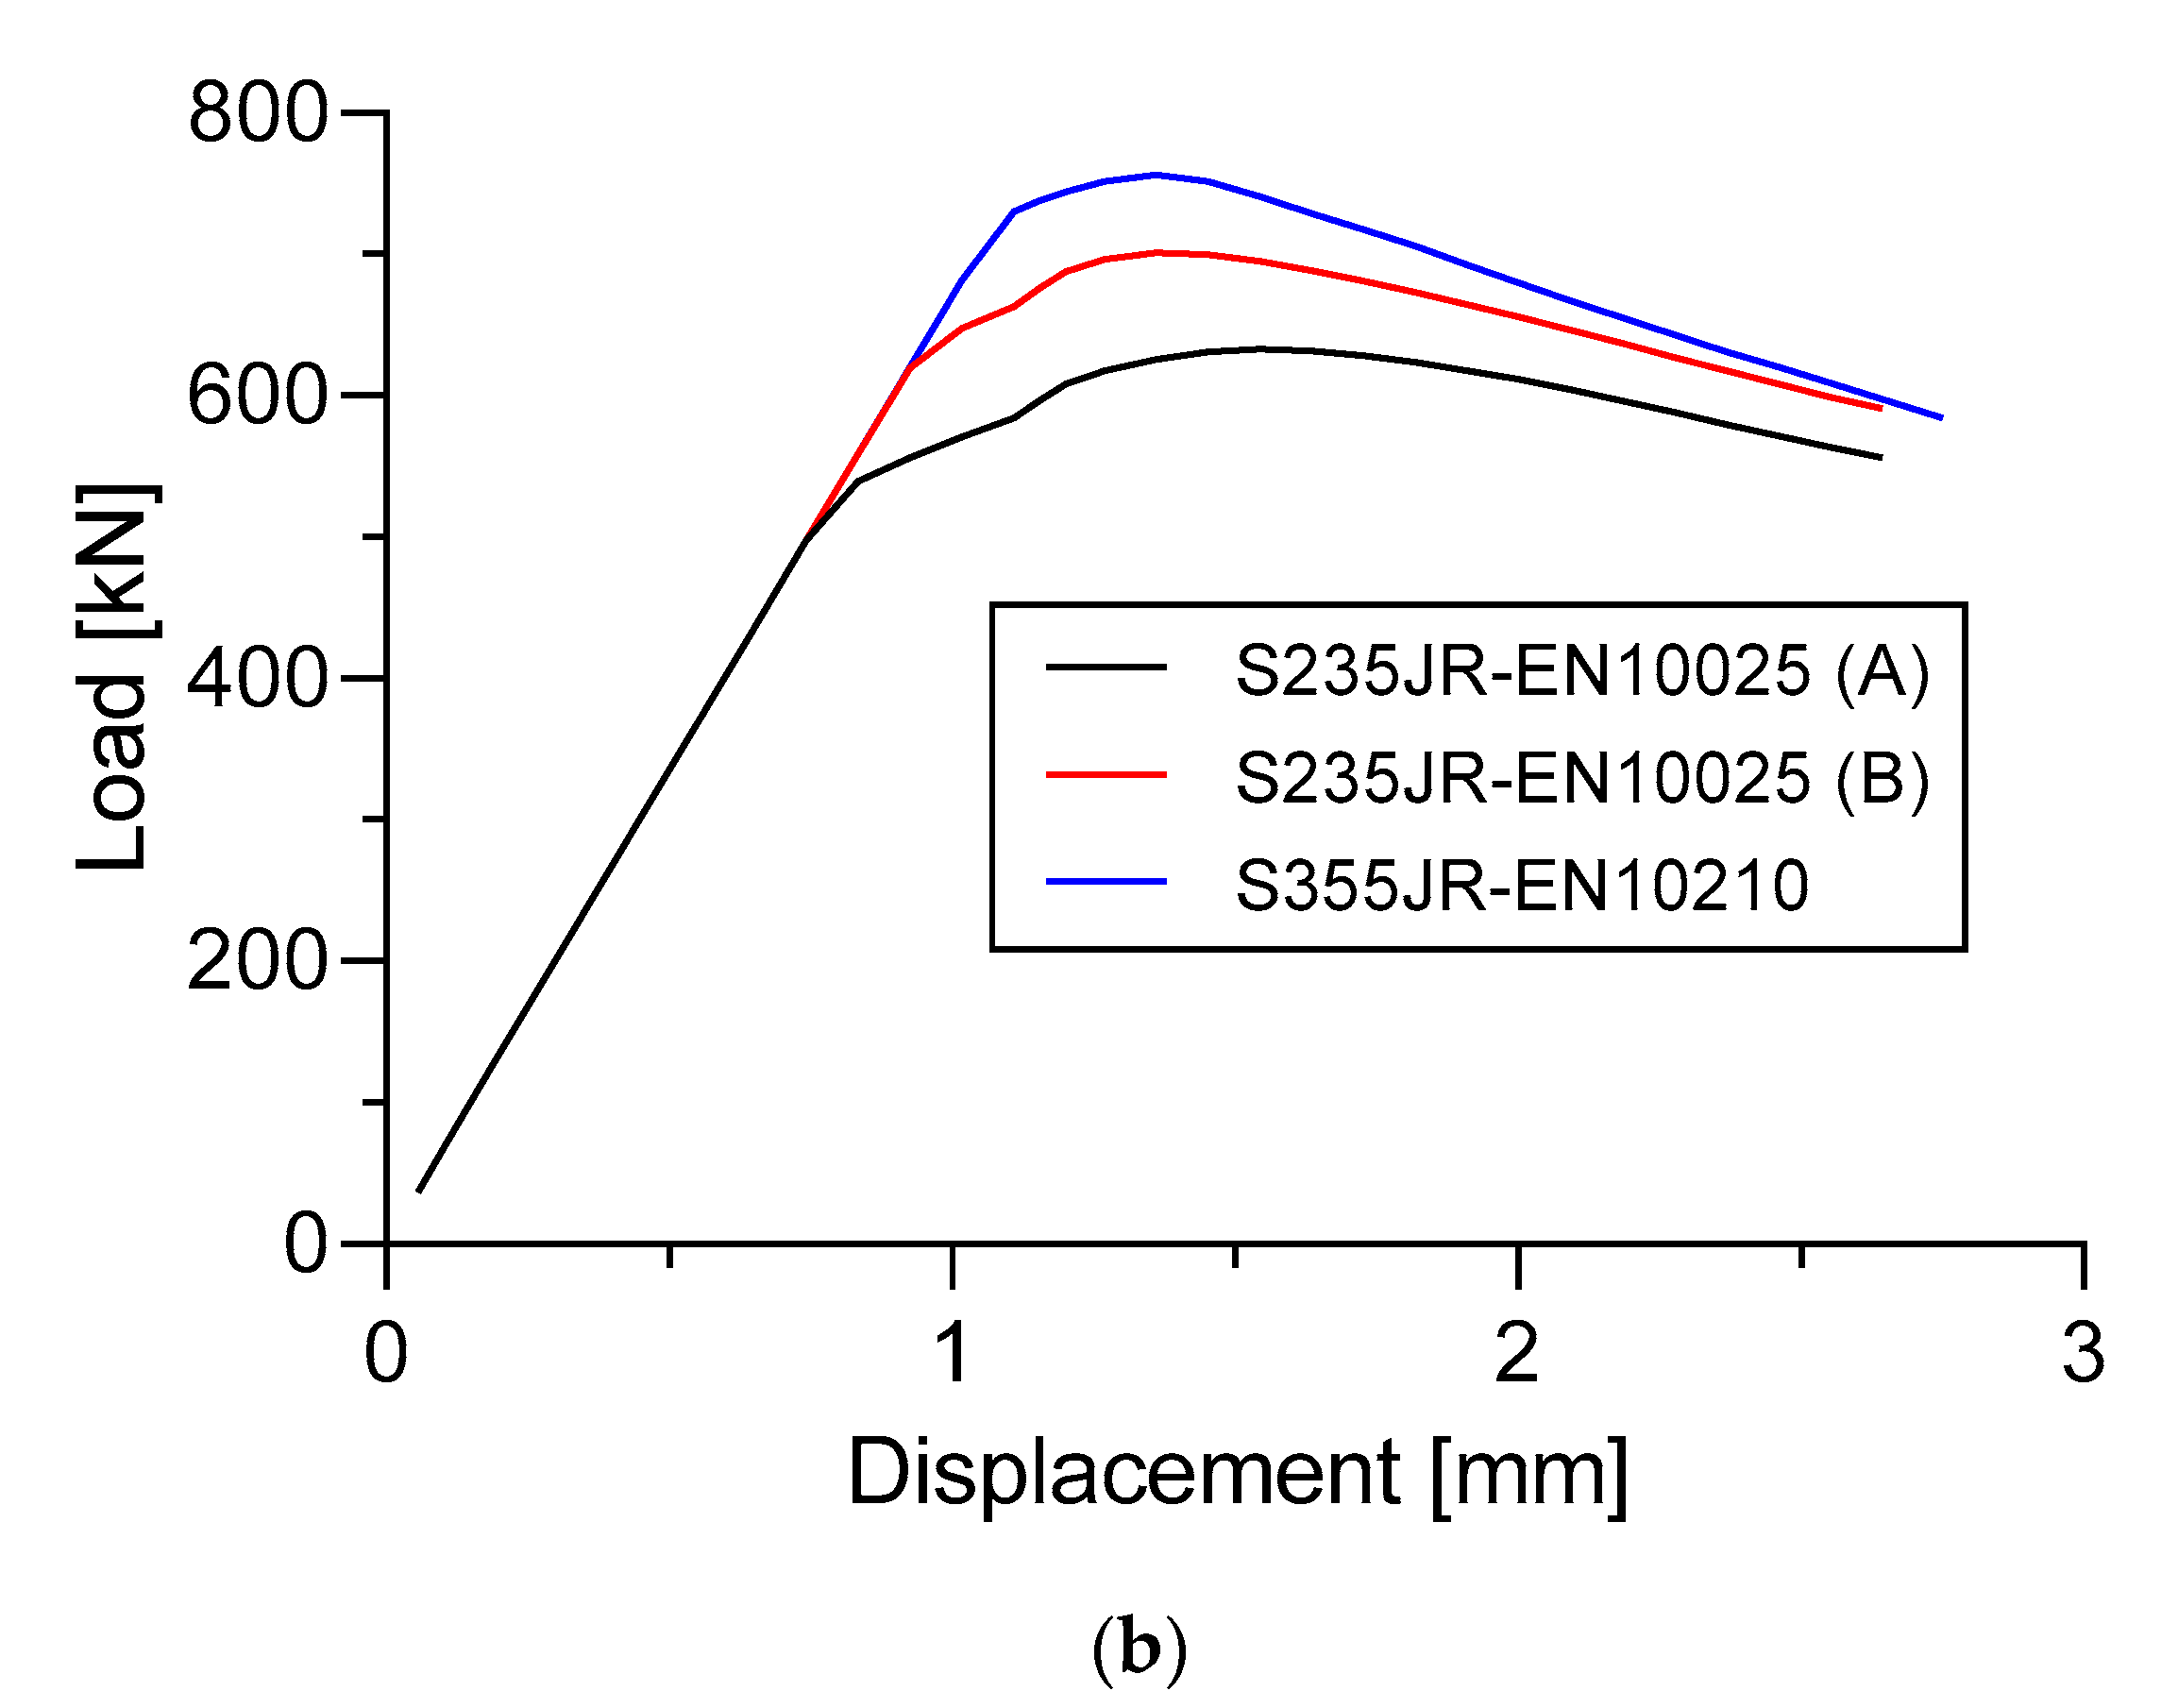
For the nonlinear buckling analysis, the findings of this study indicate that increase in the plate thickness and thickness of the longitudinal stringers attached to the specimens seem to increase the strength of the stiffened panel. As seen in Section 8.1, the plate thickness of 5 mm in Specimen A and Specimen B have higher ultimate buckling collapse load values compared to the plate thicknesses of only 3 mm and 4 mm. This is also supported by the presence of a fairly high strain in the center of the plate in Specimen A and Specimen B when a plate thickness of 3 mm is used. When compared with the 5 mm thickness of the plate, the strain is less pronounced in the center of the plate (Figure 20 and Figure 21). In Specimen A, the ultimate buckling collapse resulting from 5 mm plate thickness is 65.7% and 20.61% higher compared to 3 mm and 4 mm plate thickness. The values of this situation are 790.7 kN, which is compared with 477.2 kN and 655.6 kN, respectively. The same tendency is also found in Specimen B which gives the highest ultimate buckling load value when 5 mm of plate thickness is applied. An increase from 633.0 kN and 825.8 kN to 995.2 kN appear to be found when increasing the thickness of the plate from 3 mm and 4 mm to 5 mm, respectively. These had increases of 57.22% and 20.51%. In terms of the energy that is generated during the buckling process shows that, 5 mm plate thickness in Specimen A and Specimen B provides a more comprehensive total energy of 35.72% and 56.46% higher than the 3 mm thickness of the plate (Table 8). Prabowo et al. [53], Bae et al. [54], and Prabowo et al. [50] suggested that the total energy obtained from structural damage also can indicate the strength of a structure. Increased structural strength can be a significant advantage and they play a significant role in improving the stability of the structure for instance while under tensile load or impact load [55,56]. This finding can also be implemented into a new design such as the in savonius turbine technology [57].
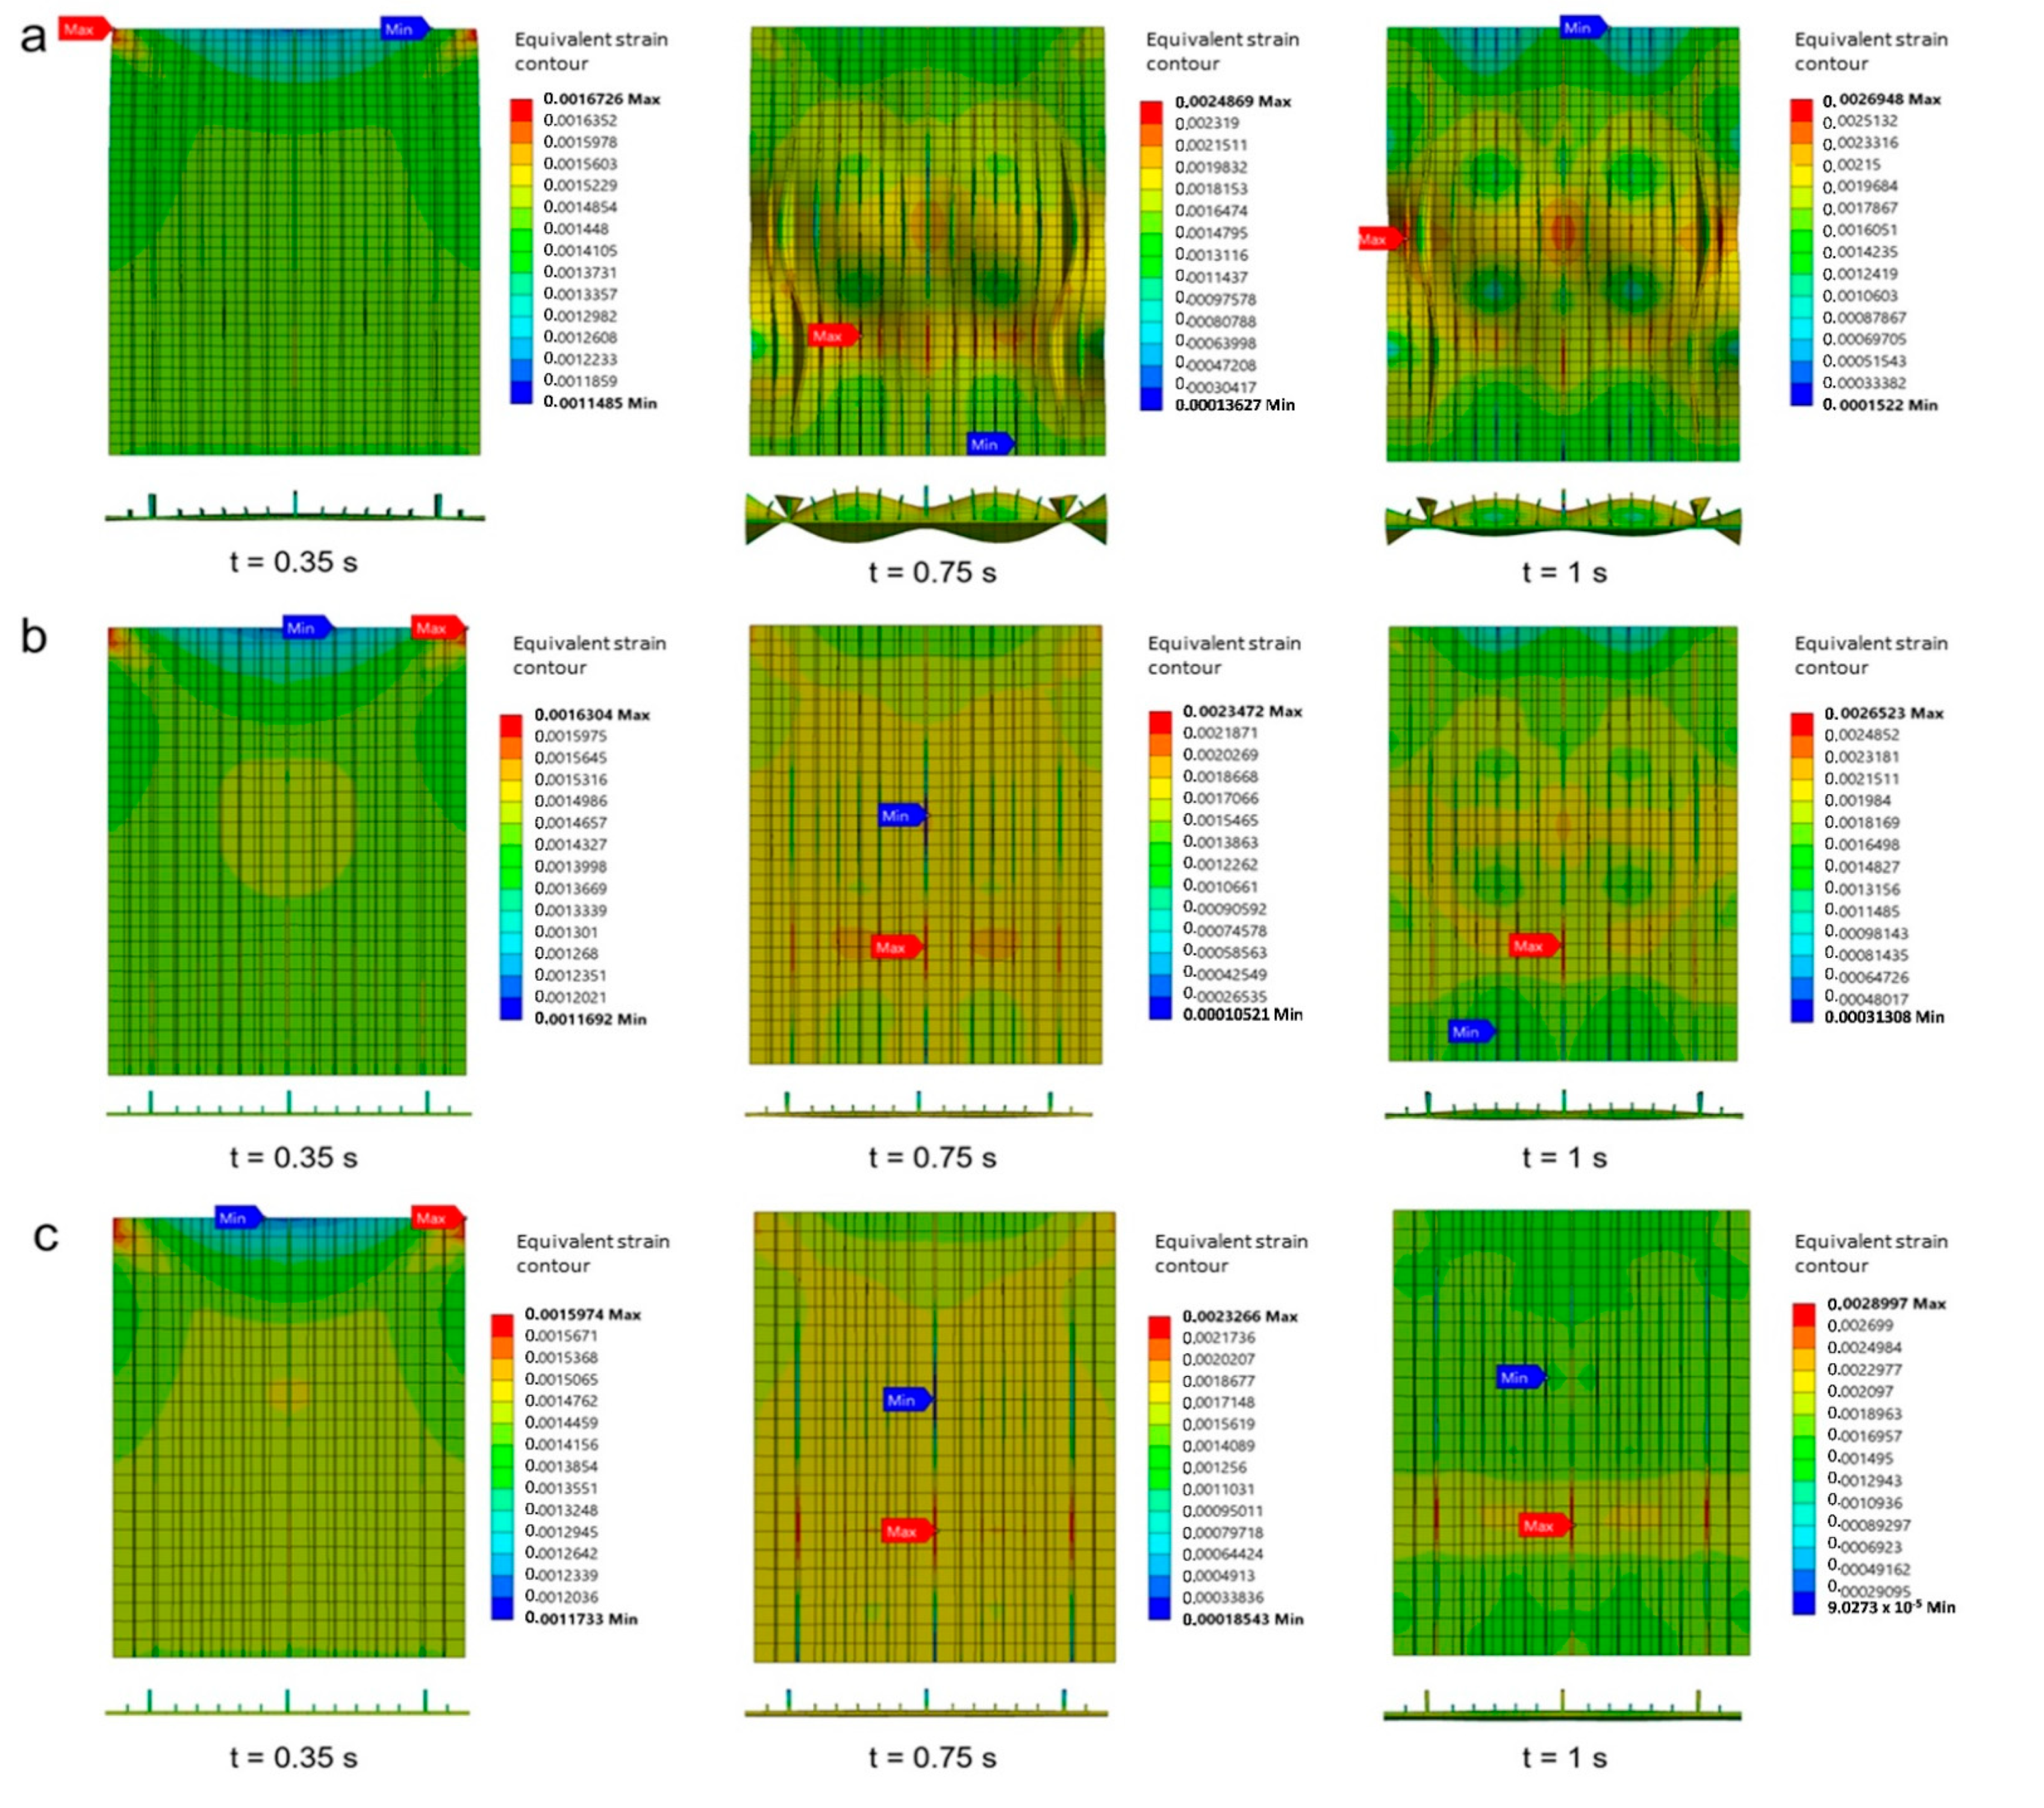
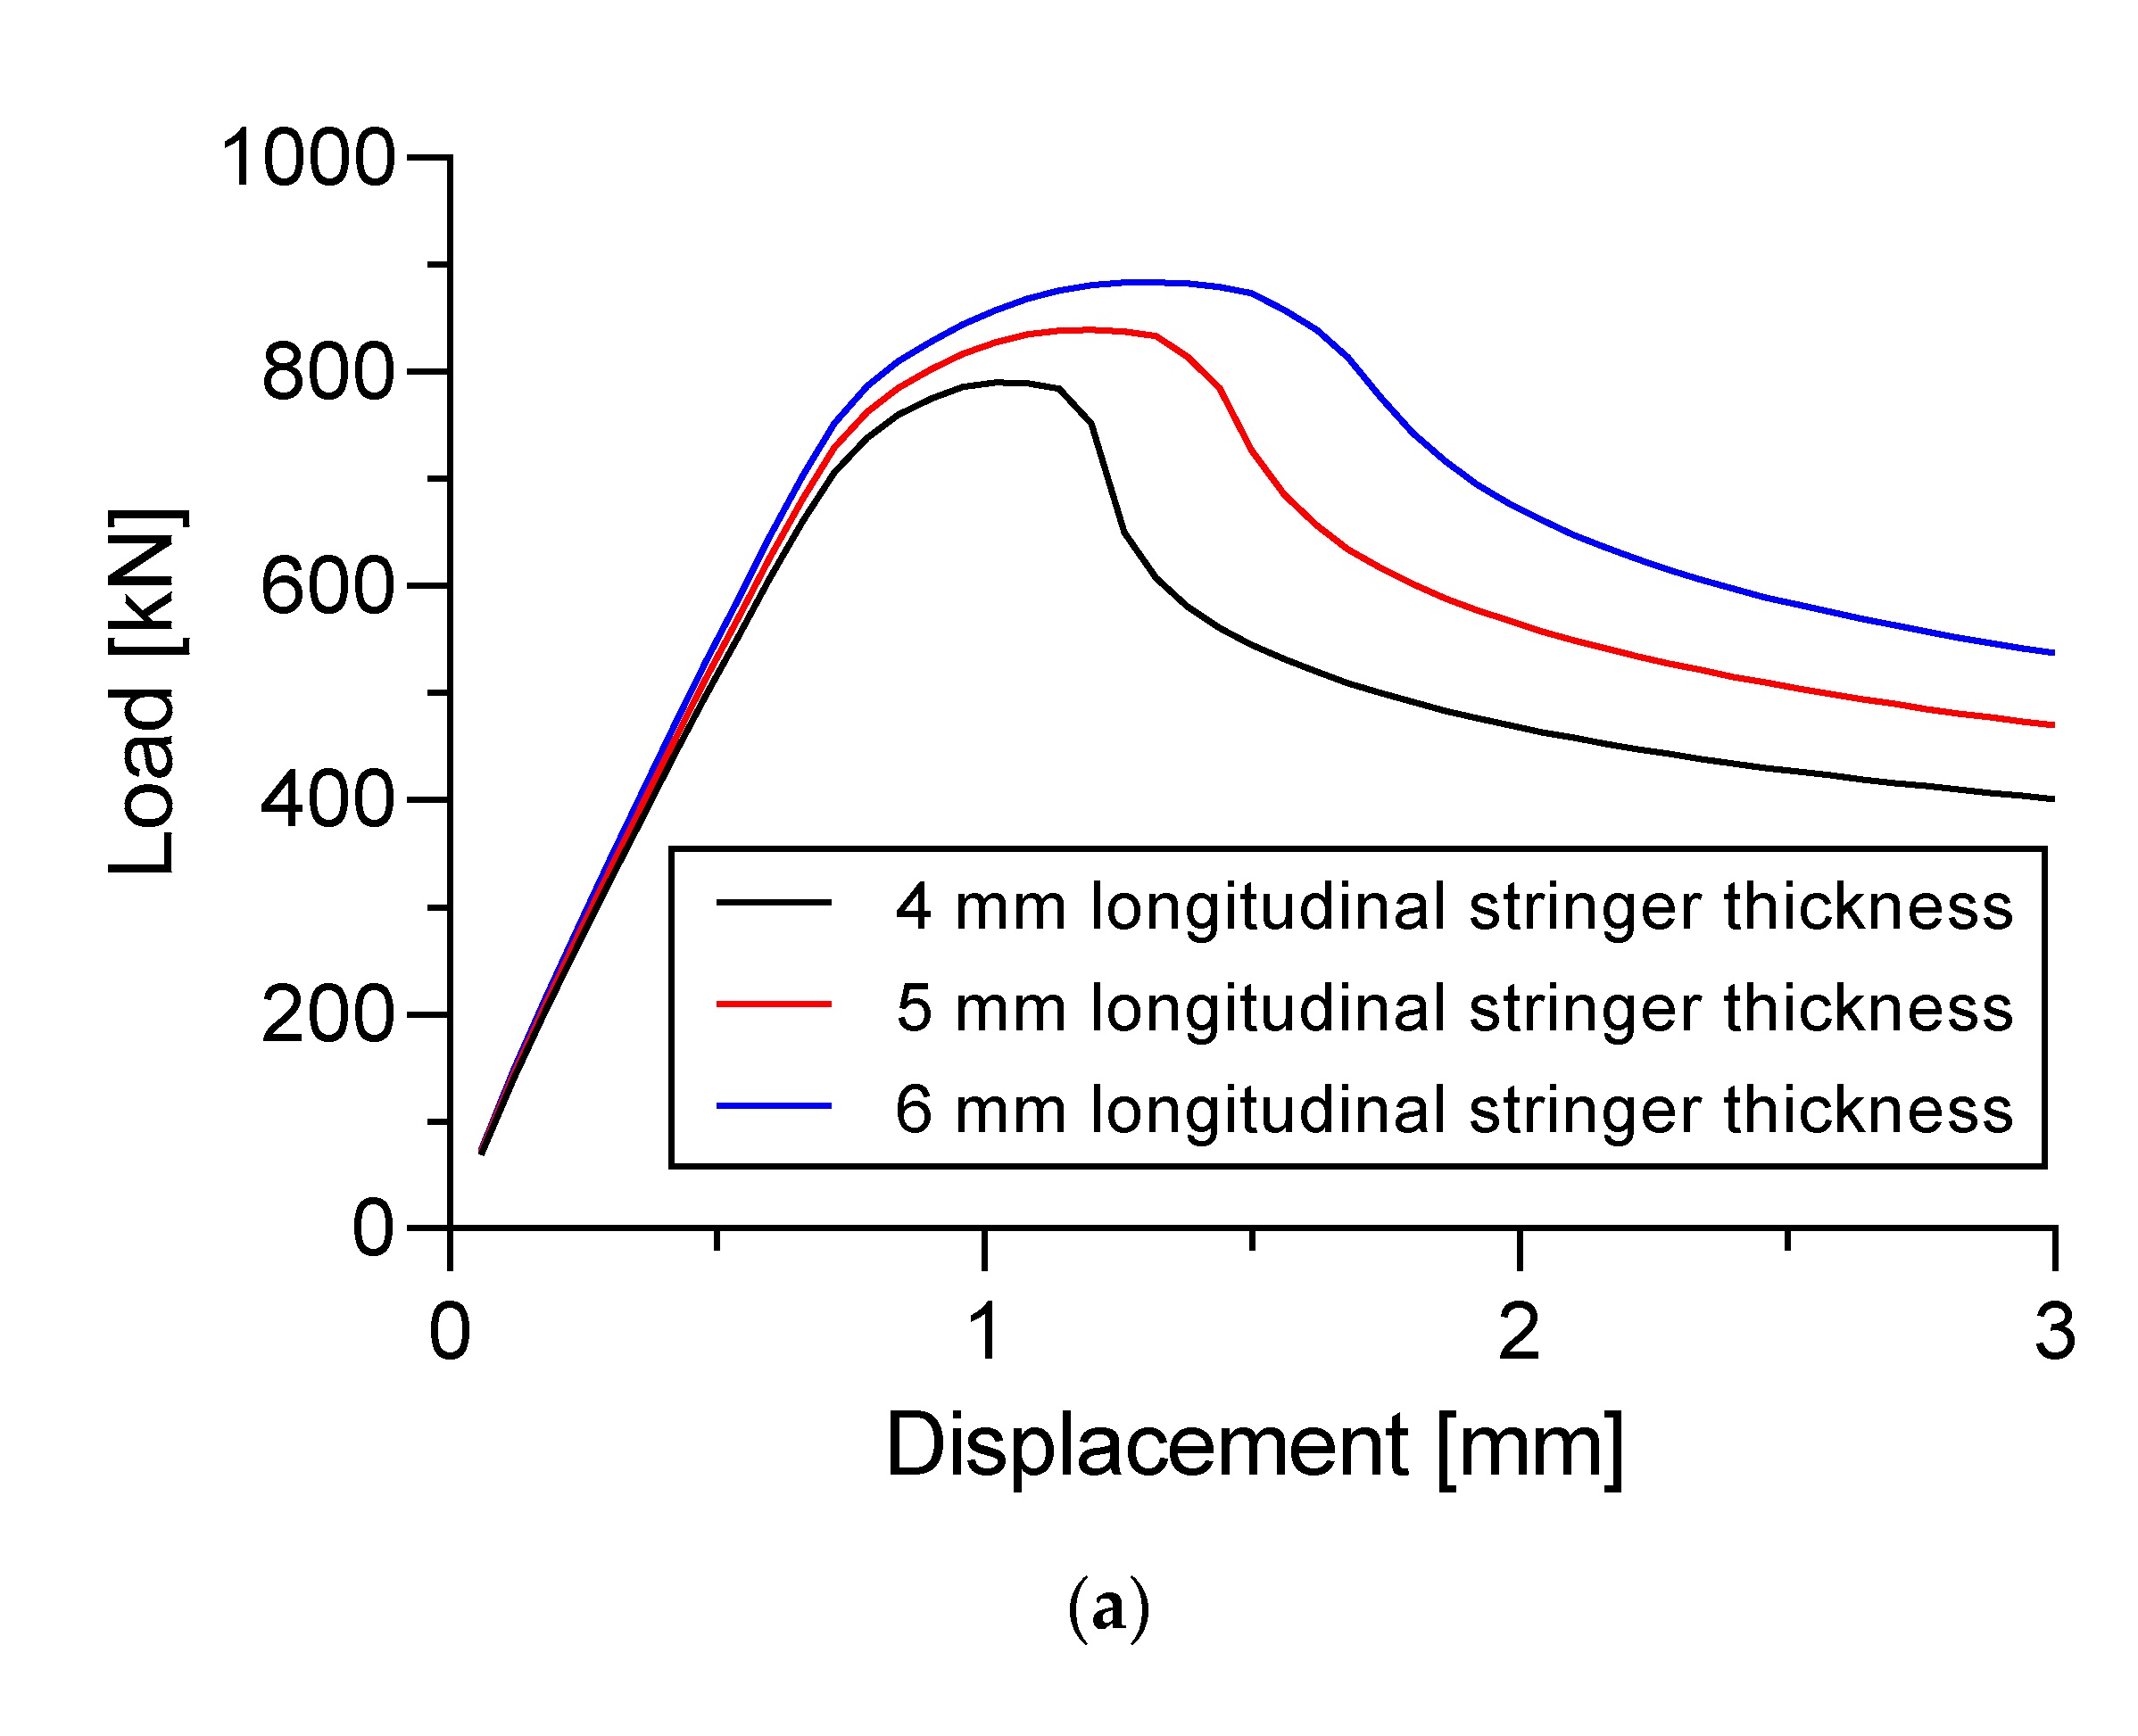
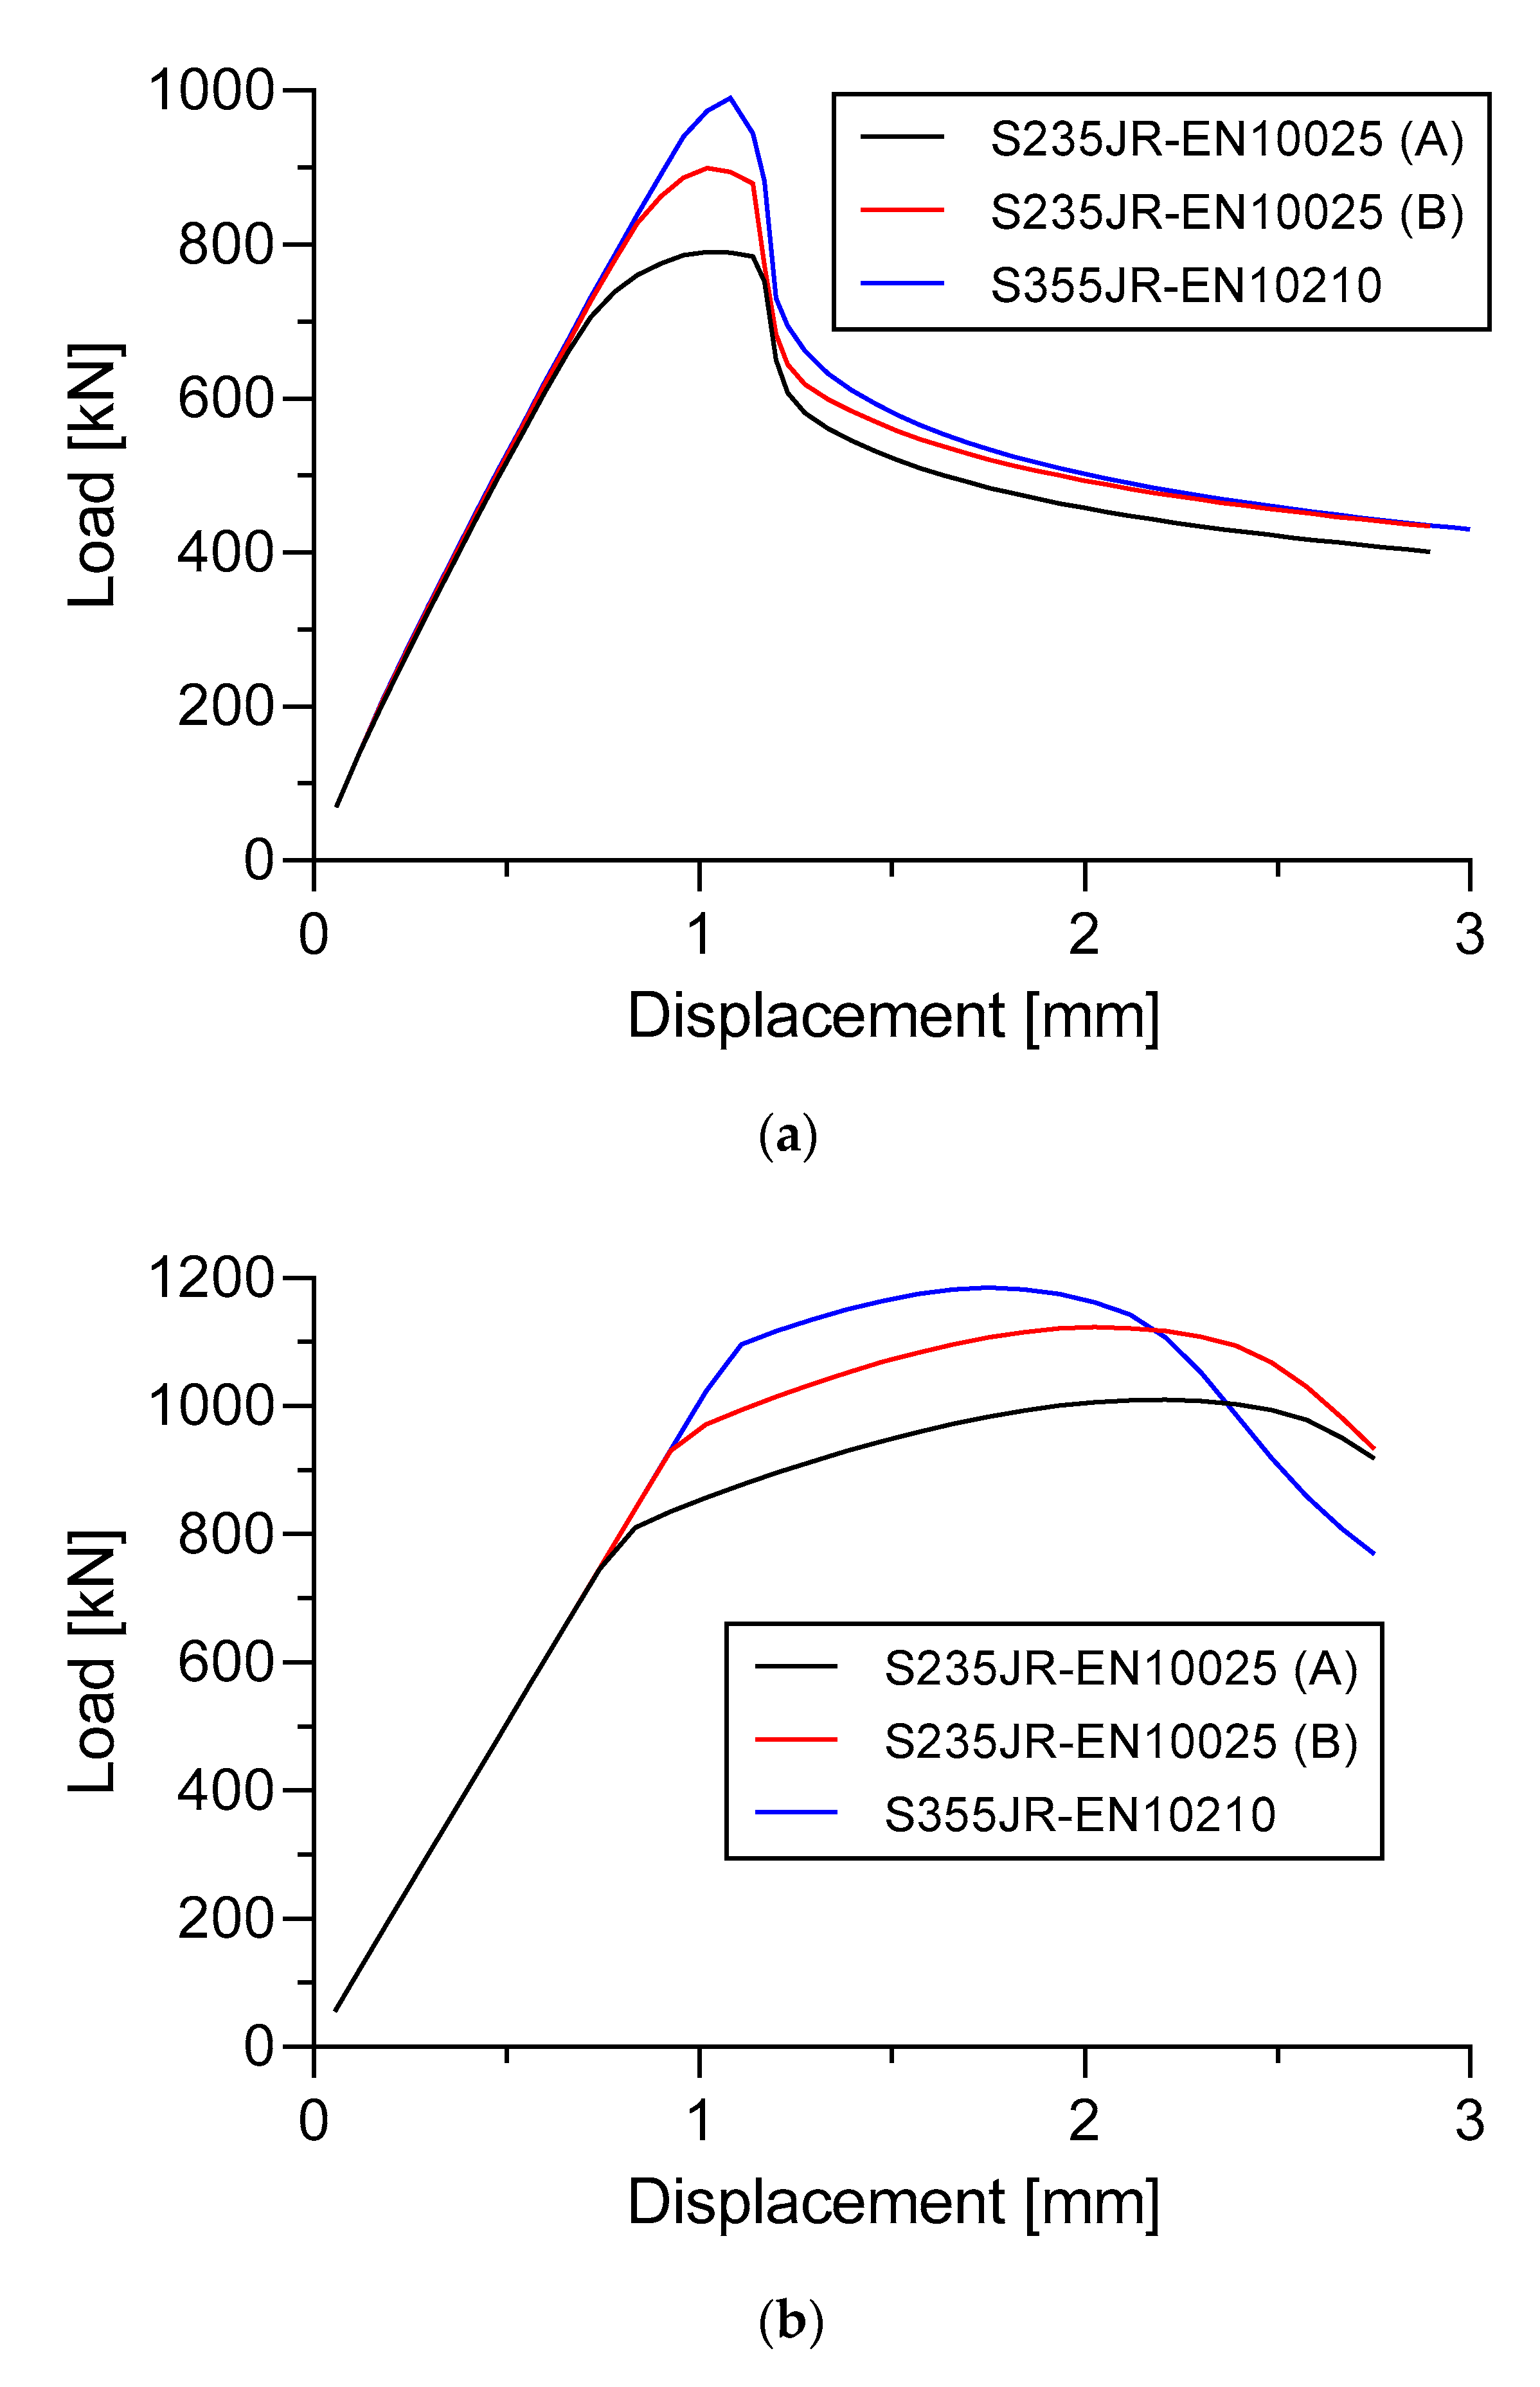
There is an increase in ultimate buckling collapse load if the thickness of the longitudinal stringers is increased, as was the case in Specimen A. The thickness of the longitudinal stringers in Specimen A moderately affected the strength of the stiffened panels (Section 8.2). This is also supported by the existence of a different strain distribution when the thickness of longitudinal stringers changes, for example, when the thickness is 6 mm which gives a quite small deformation compared to the thickness of 4 mm and 5 mm (
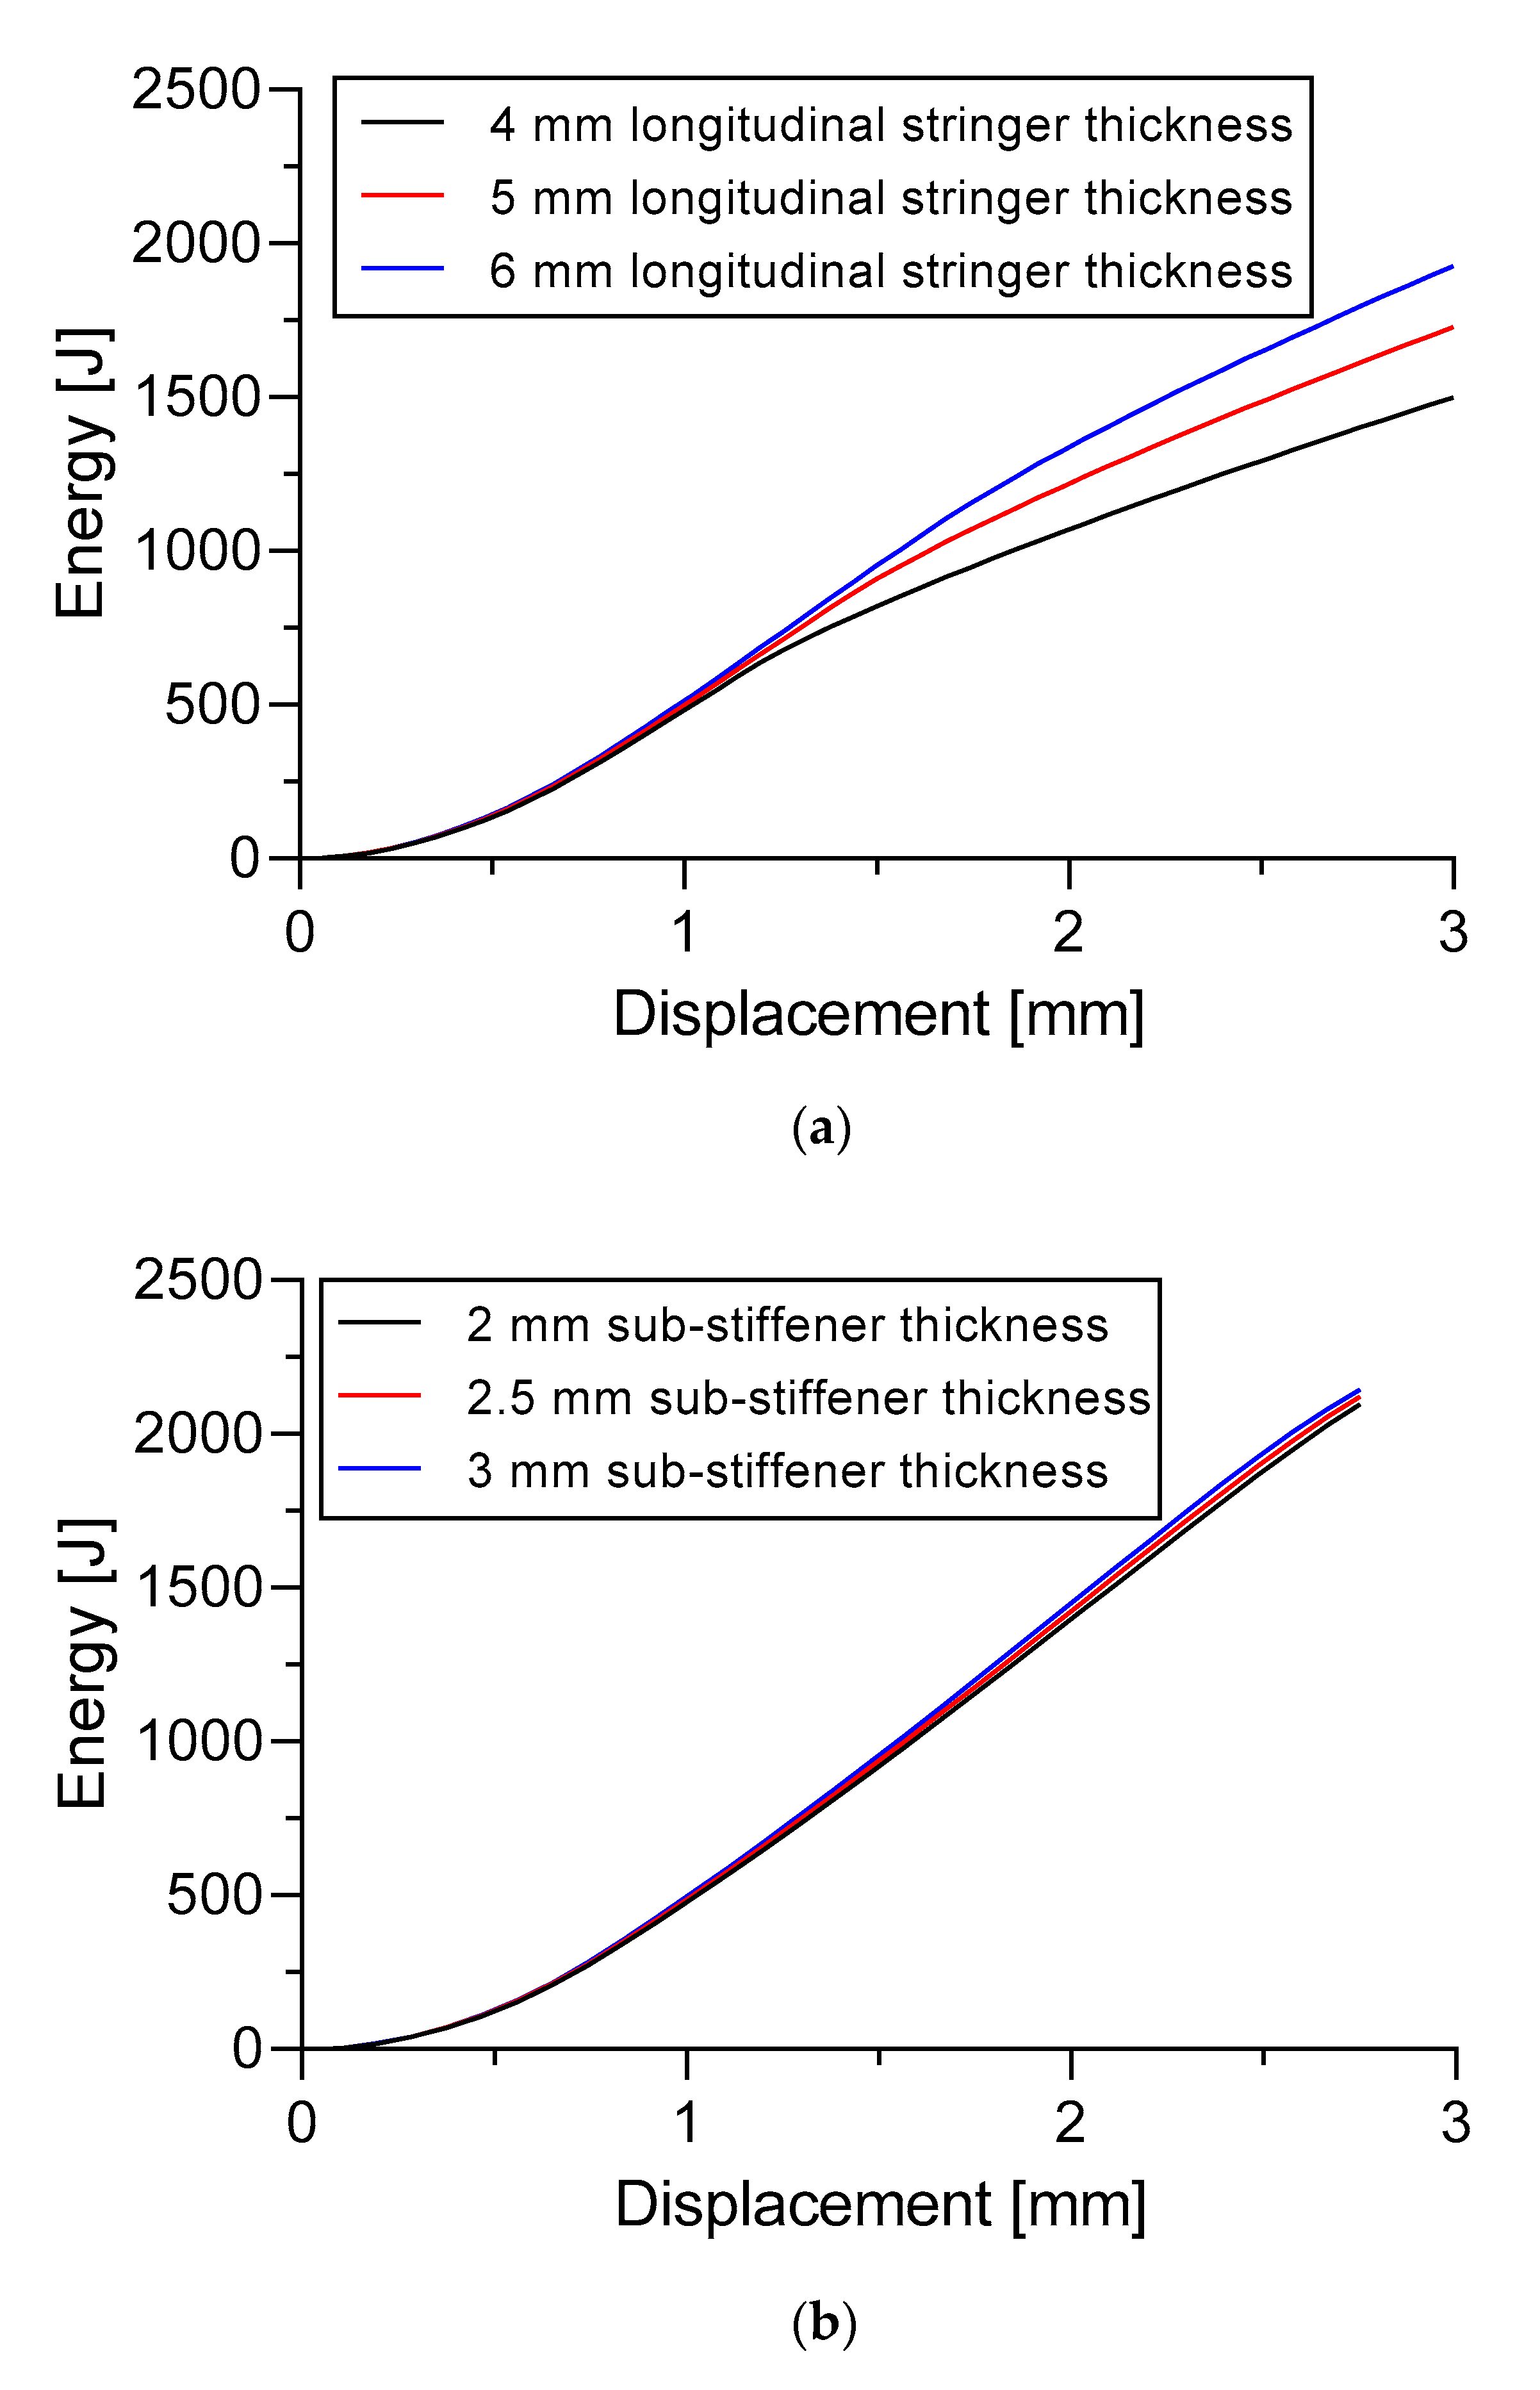
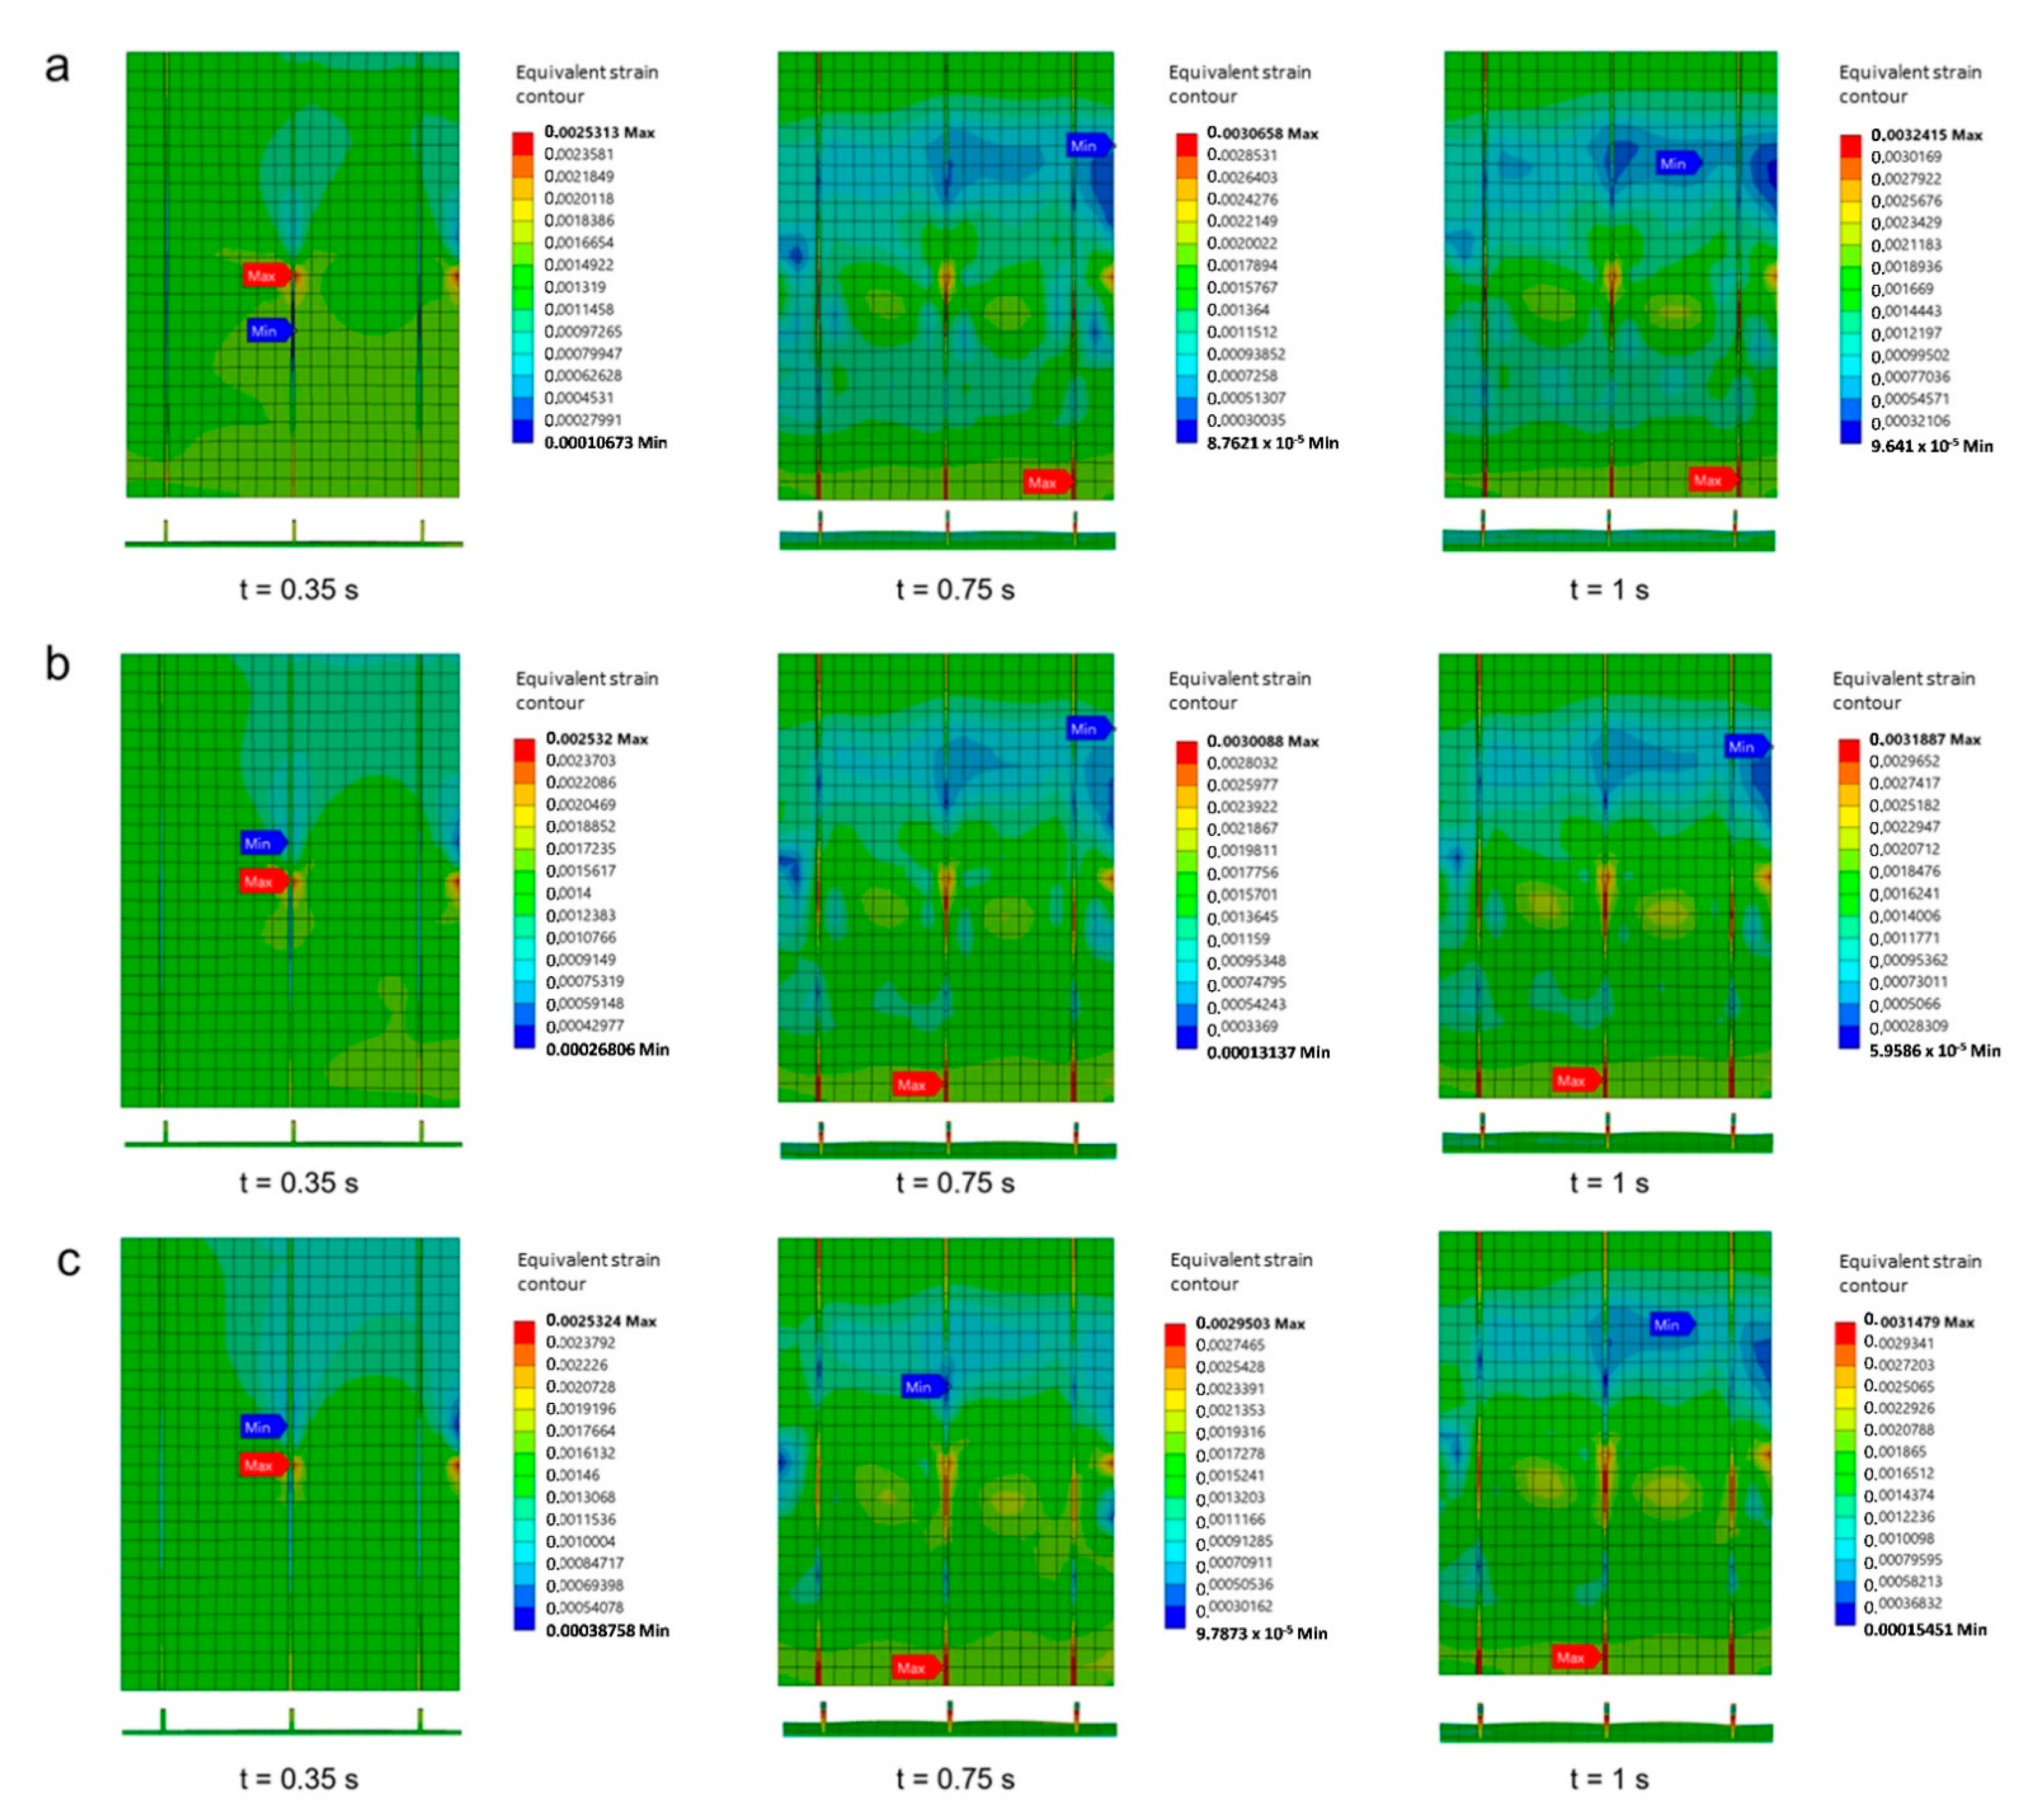
Figure 24). In the case of 6 mm thickness, the stiffened panel increased its strength by 6.18% and 11.8% compared to the thickness of 5 mm and 4 mm, respectively. The values obtained from these thicknesses are 884.0 kN, 839.6 kN, and 790.7 kN, respectively. These thicknesses also seem to moderately affect the total energy in Specimen A. Less total energy was produced when the 4 mm thickness was applied which was 1499.7 J. Slightly more energy was provided when the 5 mm and 6 mm thickness was applied which was 1727.7 J and 1927 J respectively.
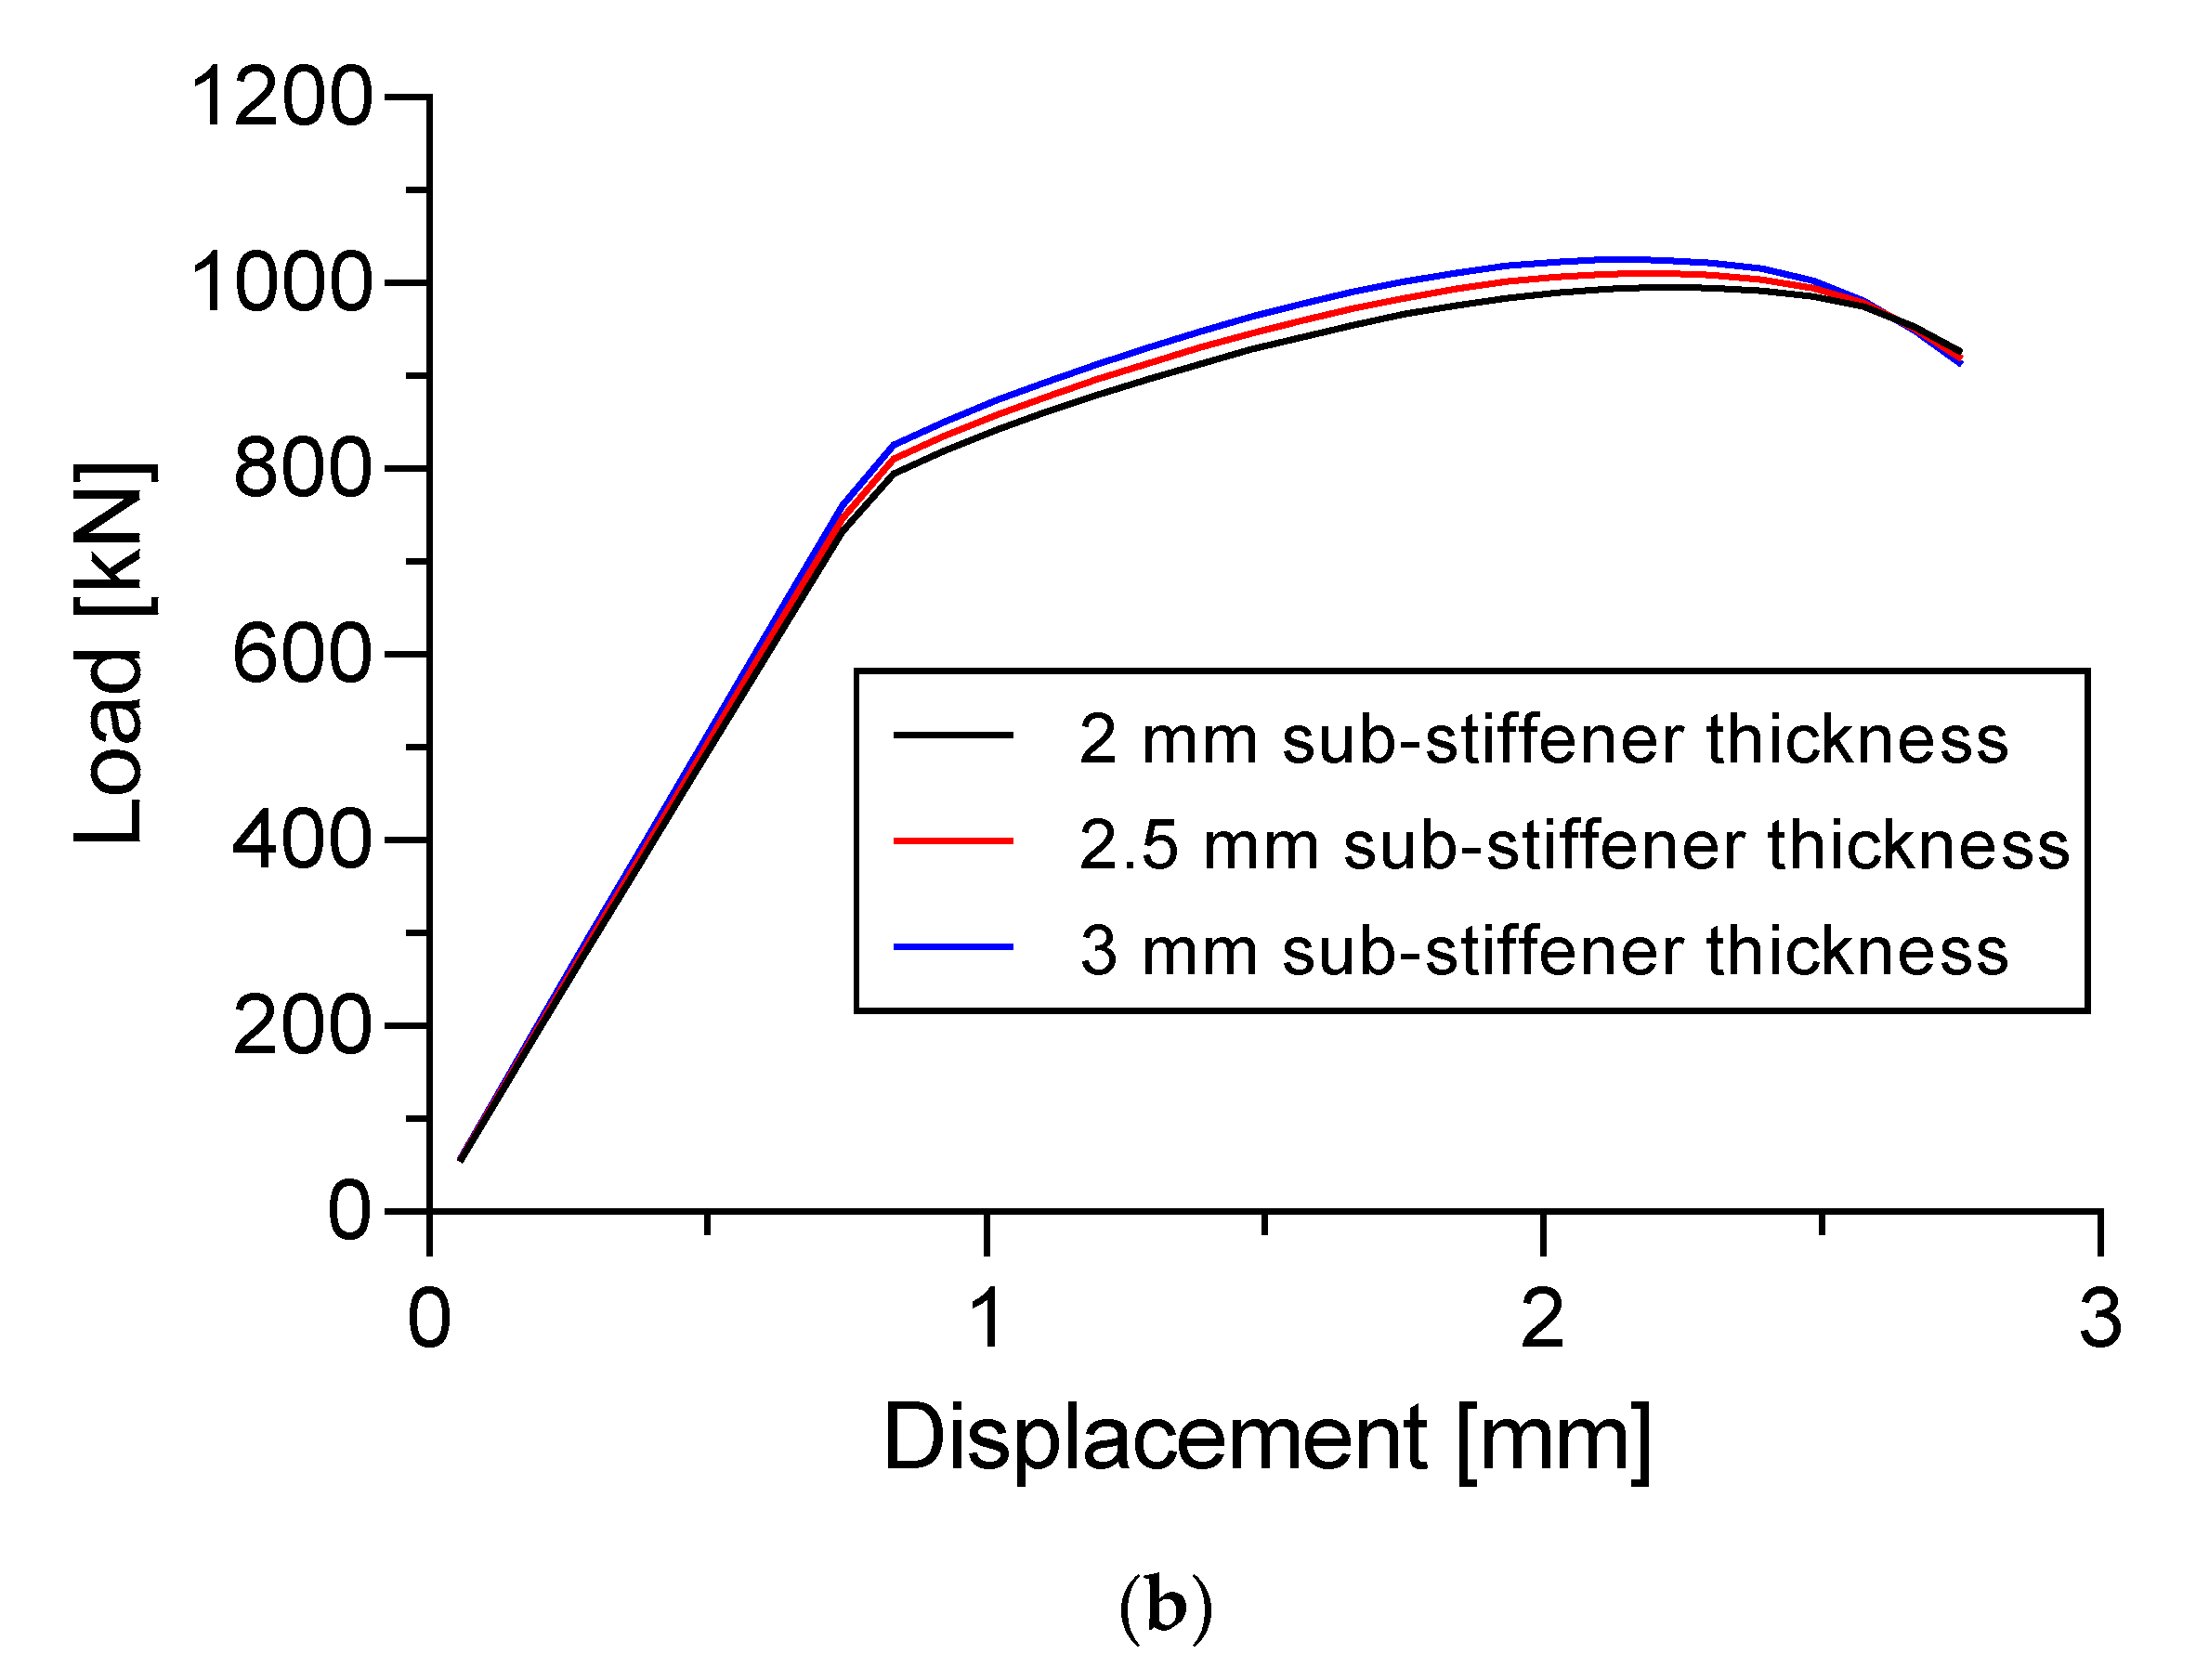
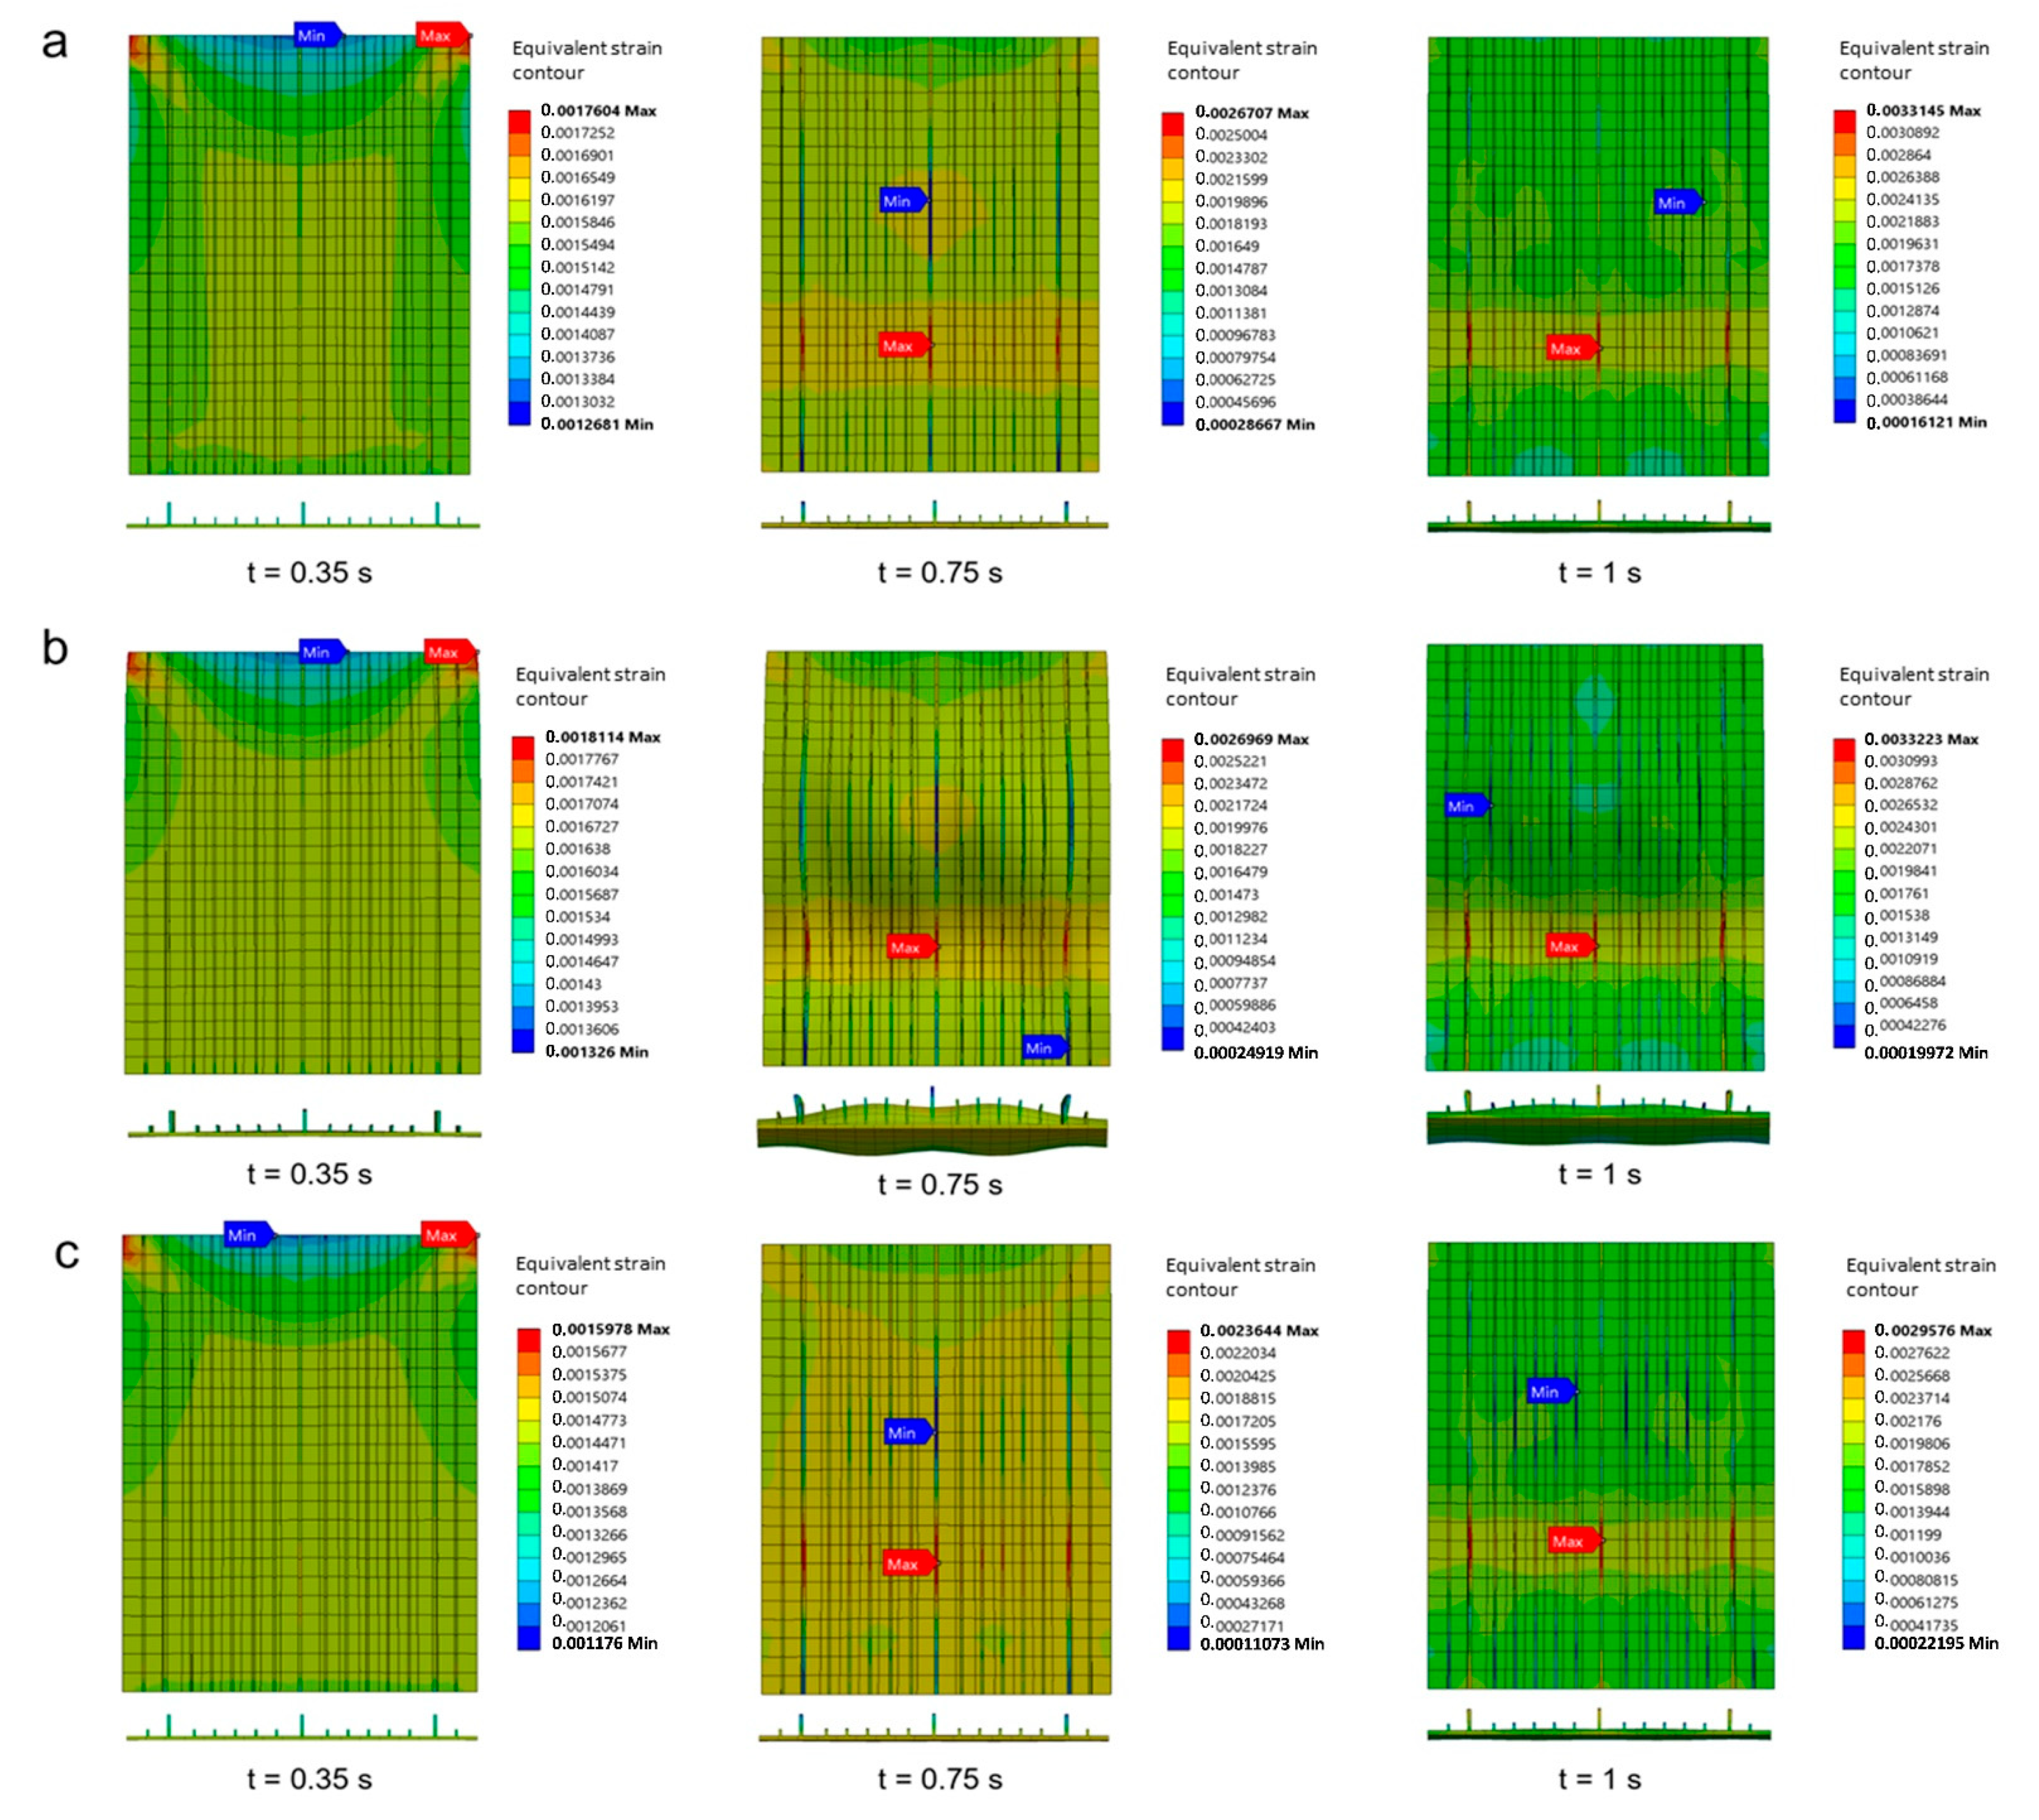
Quite surprisingly, the thickness of the sub-stiffeners in Specimen B does not really seem to affect the strength of the stiffened panel and the total energy generated during the buckling process. There was no strong evidence that the thickness of the sub-stiffeners in Specimen B increases the strength of the stiffened panel. This occurrence is also observed in the strain distribution section which has a fairly similar strain distribution for the three thicknesses of the proposed sub-stiffeners. There was negligible visible result when the 3 mm sub-stiffeners increased only 3% the strength of the stiffened panel compared with the thickness of the 2 mm sub-stiffeners. This percentage increase was obtained from the original value of 995.2 kN to 1025.1 kN. The same condition also occurs in the total energy generated during the buckling process (e.g., 3 mm thickness of the sub-stiffeners increased by only 2.25% compared with the 2 mm. Although, the total number of sub-stiffeners that were attached to the stiffened panel was 12. Further work is needed to reveal how the thickness of the sub-stiffeners influences the strength of the stiffened panels.
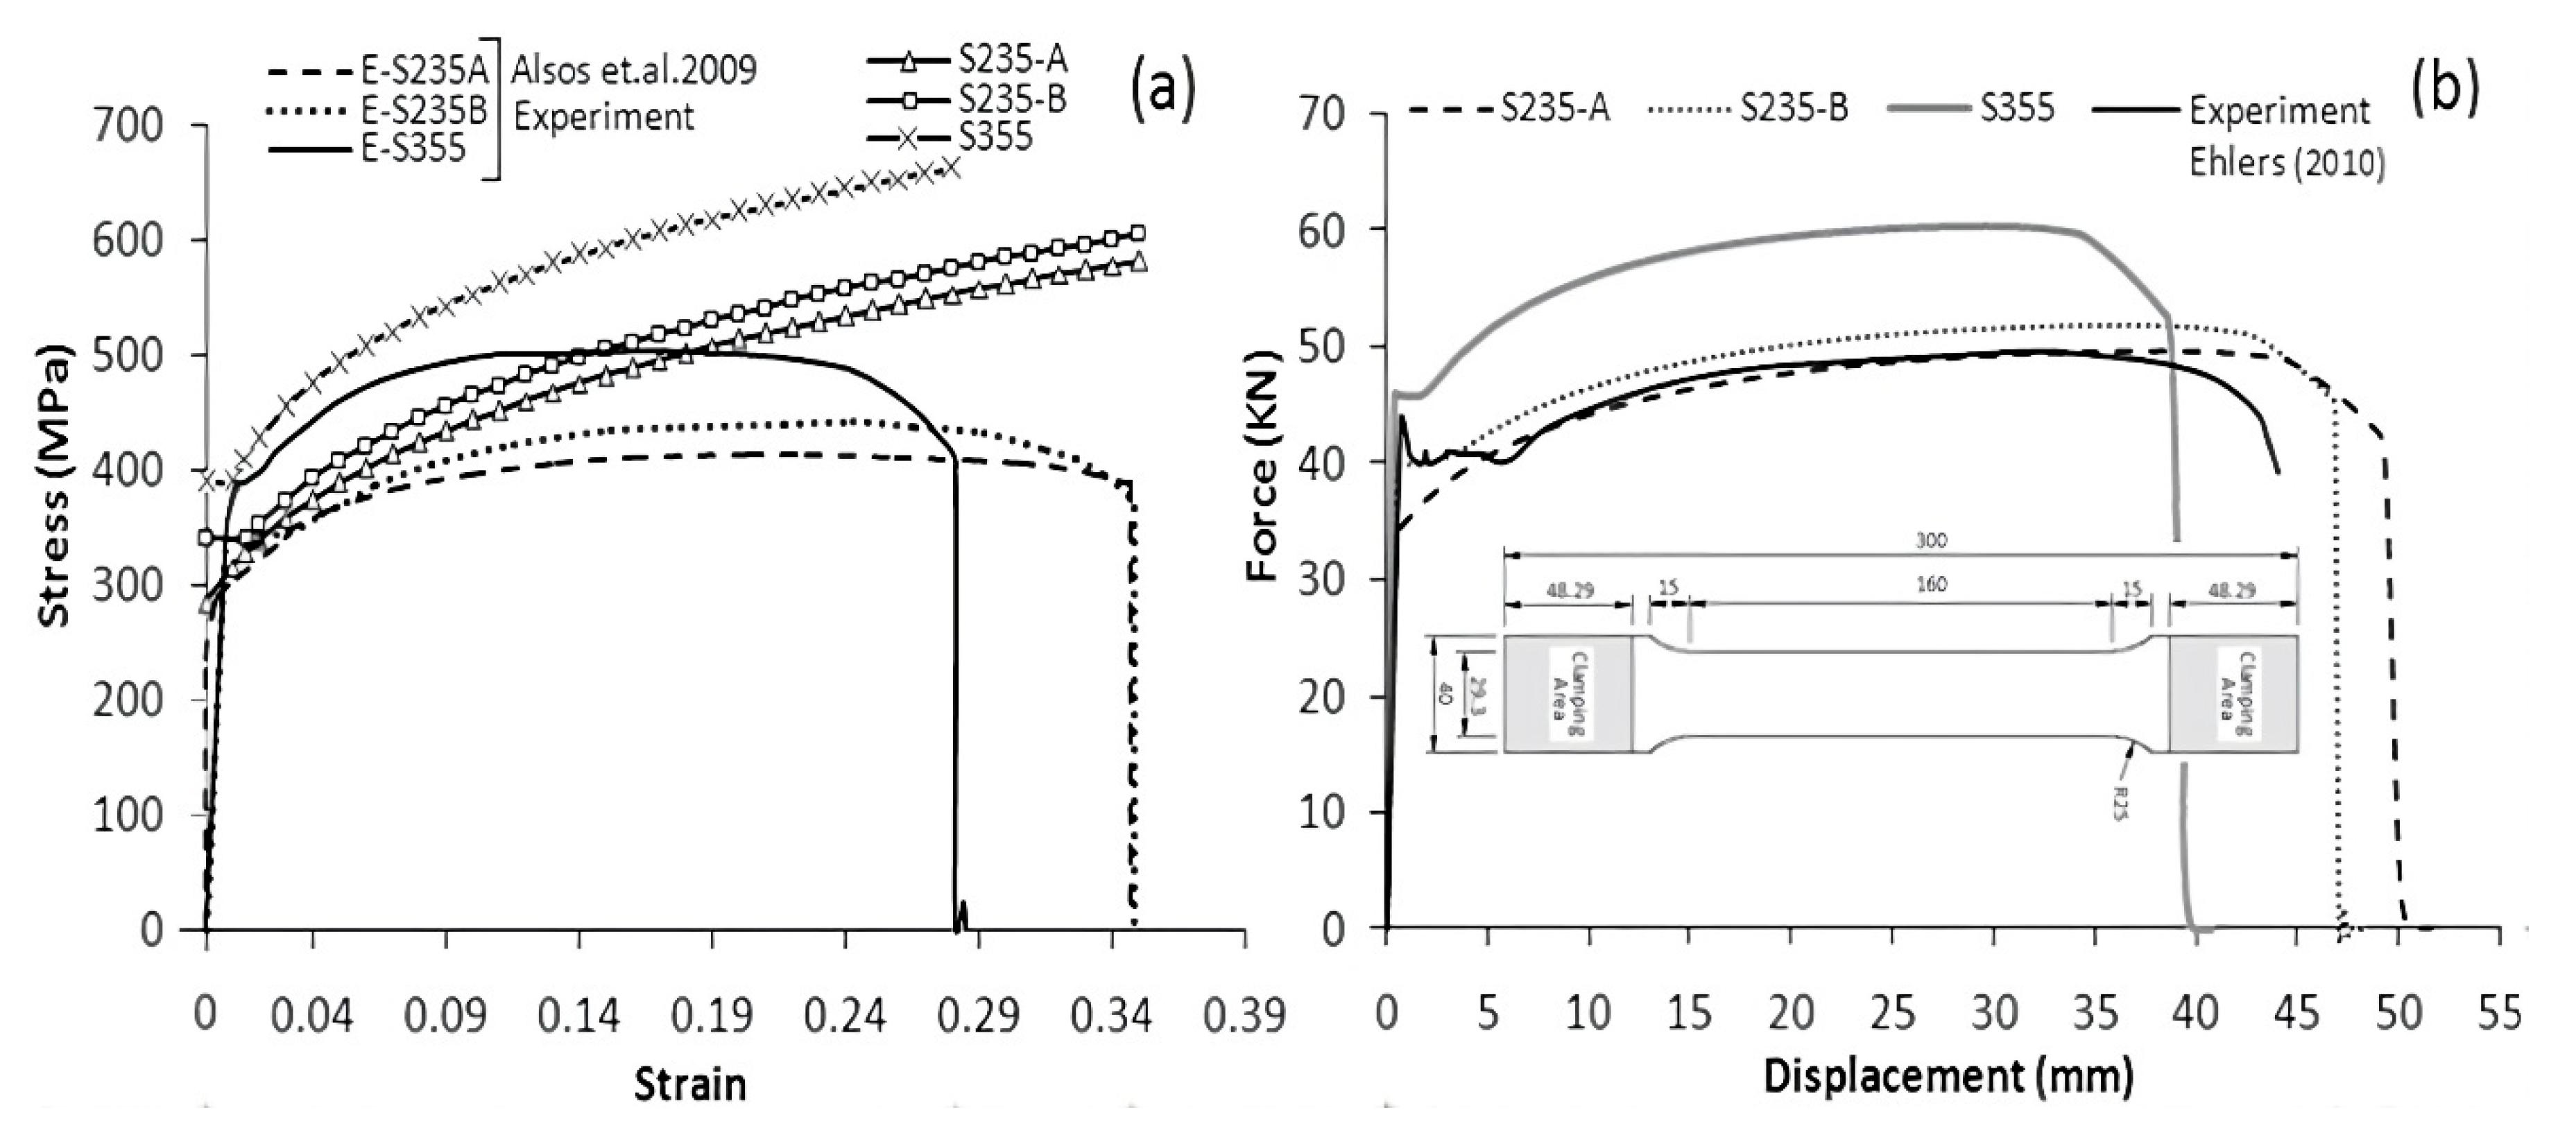
The materials that were used show that the S355JR-EN10210 material produces more comprehensive strength of the stiffened panel (Specimen A and Specimen B) followed by the S235JR-EN10025 (B) and S235JR-EN10025 (A) materials. This increase in strength can be affected by the properties of the material, such as yield stress, ultimate stress, Poisson’s ratio, and the exponent of this material (strain hardening) [35,36]. It is possible that the strength of the specimen can be influenced by the material that has been used [27]. A recently study also showed that fibers from the agave cantala plant can also be used to increase the strength of the material [58]. There is also some evidence that Rad and Panahandeh-Shahraki [35] found that the material properties of Poisson’s ratio give descent the critical load when its value increases. Furthermore, Ndubuaku et al., [36] found that the material properties of strain hardening affect ultimate compressive strength and strain on the plate. In this study, there are still many parameters of material properties that have been used such as yield stress, ultimate stress, and the exponent of this material (strain hardening). Where the only constant parameters are the material properties of density, Young’s modulus, and Poisson’s ratio. Therefore, to show how the S355JR-EN10210 material produces higher strength requires further research.

10. Conclusions

Buckling analysis on simply supported rectangular plates and stiffened panels using analytical and finite elements has been carried out. The following conclusions are drawn based on the results,
  • Aspect ratio of rectangular plate a/b = 3 has a higher critical buckling load value compared to a/b = 2 and 4. This particular phenomenon is due to the dimension of the width of the plate b (where the applied load works) as a/b = 3 is smaller compared with a/b = 2 and 4 even though the buckling coefficients k c are the same;
  • The method of the mesh size selection (i.e., the element length to thickness (ELT) ratio) can provide a fairly good critical buckling load value compared with the analytical data. In the buckling analysis of rectangular plates, the ELT ratio 7 gave an error value of 0.65% compared with the analytical result;
  • A change in the thickness of the plate significantly increased the strength and the generated energy during the buckling of the stiffened panels for both Specimen A and Specimen B;
  • For Specimen A, increase in the thickness of the longitudinal stringers moderately increased the strength of the stiffened panels;
  • For Specimen B, an increase in the thickness of the sub-stiffeners did not significantly increase the strength of the stiffened panels;
  • Material S355JR-EN10210 produced a higher ultimate panel collapse load compared to S235JR-EN10025 (A) and S235JR-EN10025 (B).
The difference in thickness of the sub-stiffeners that affects the ultimate buckling collapse load in Specimen B was not very clear in this paper. Therefore, for future research it can add a slightly large difference in the thickness of the sub-stiffeners that been used.

Author Contributions

Conceptualization, A.R.P. and R.R.; methodology, A.R.P., R.R., T.M.; software, R.R.; validation, A.R.P. and T.M.; formal analysis, R.R. and T.M.; investigation, A.R.P. and R.R.; resources, A.R.P.; data curation, R.R. and T.M.; writing—original draft preparation, A.R.P. and R.R.; writing—review and editing, A.R.P. and R.R.; visualization, R.R. and T.M.; supervision, A.R.P.; project administration, A.R.P.; funding acquisition, A.R.P. All authors have read and agreed to the published version of the manuscript.

Funding

This research received no external funding.

Institutional Review Board Statement

Not applicable.

Informed Consent Statement

Not applicable.

Data Availability Statement

The authors declare that the data supporting the findings of this study are available within the article.

Conflicts of Interest

The authors declare no conflict of interest.

References

  1. Yao, T.; Fujikubo, M. Buckling and Ultimate Strength of Ship and Ship-Like Floating Structures; Butterworth-Heinemann; Elsevier: Oxford, UK, 2016. [Google Scholar]
  2. Durban, D.; Zuckerman, Z. Elastoplastic buckling of rectangular plates in biaxial compression/tension. Int. J. Mech. Sci. 1999, 41, 751–765. [Google Scholar] [CrossRef]
  3. Elgaaly, M. Post-buckling behavior of thin steel plates using computational models. Adv. Eng. Softw. 2000, 31, 511–517. [Google Scholar] [CrossRef]
  4. Petry, D.; Fahlbusch, G. Dynamic buckling of thin isotropic plates subjected to in-plane impact. Thin Walled Struct. 2000, 38, 267–283. [Google Scholar] [CrossRef]
  5. Cheung, Y.K.; Au, F.T.K.; Zheng, D.Y. Finite strip method for the free vibration and buckling analysis of plates with abrupt changes in thickness and complex support conditions. Thin Walled Struct. 2000, 36, 89–110. [Google Scholar] [CrossRef]
  6. Shimizu, S. Tension buckling of plate having a hole. Thin Walled Struct. 2007, 45, 827–833. [Google Scholar] [CrossRef] [Green Version]
  7. Amani, M.; Edlund, B.L.O.; Alinia, M.M. Buckling and post buckling behavior of unstiffened slender curved plates under uniform shear. Thin Walled Struct. 2011, 49, 1017–1031. [Google Scholar] [CrossRef]
  8. Xing, Z.; Kucukler, M.; Gardner, L. Local buckling of stainless steel plates in fire. Thin Walled Struct. 2020, 148, 106570. [Google Scholar] [CrossRef]
  9. Danielson, D.A.; Wilmer, A. Buckling of stiffened plates with bulb flat flanges. Int. J. Solids. Struct. 2004, 41, 6407–6427. [Google Scholar] [CrossRef]
  10. Kwon, Y.B.; Park, H.S. Compression tests of longitudinally stiffened plates undergoing distortional buckling. J. Constr. Steel. Res. 2011, 67, 1212–1224. [Google Scholar] [CrossRef]
  11. Layachi, H.; Xu, Y.M. Performance and Stability Analysis of Sub-stiffening for Mechanical Buckling and Post Buckling: A Selective Study. MATEC Web. Conf. 2017, 95, 01004. [Google Scholar] [CrossRef] [Green Version]
  12. Kong, X.; Yang, Y.; Gan, J.; Yuan, T.; Ao, L.; Wu, W. Experimental and numerical investigation on the detailed buckling process of similar stiffened panels subjected to in-plane compressive load. Thin Walled Struct. 2020, 148, 106620. [Google Scholar] [CrossRef]
  13. Srivastava, A.K.L.; Datta, P.K.; Sheikh, A.H. Buckling and vibration of sti ened plates subjected to partial edge loading. Int. J. Mech. Sci. 2003, 45, 73–93. [Google Scholar] [CrossRef]
  14. Kumar, M.S.; Alagusundaramoorthy, P.; Sundaravadivelu, R. Ultimate Strength of Ship Plating under Axial Compression. Ocean Eng. 2006, 33, 1249–1259. [Google Scholar] [CrossRef]
  15. Seifi, R.; Khoda-yari, N. Experimental and numerical studies on buckling of cracked thin-plates under full and partial compression edge loading. Thin Walled Struct. 2011, 49, 1504–1516. [Google Scholar] [CrossRef]
  16. Sujiatanti, S.H.; Tanaka, S.; Shinkawa, S.; Setoyama, Y. Experimental and numerical studies for buckling and collapse behaviors of a cracked thin steel panel subjected to sequential tensile and compressive loading. Thin Walled Struct. 2020, 157, 107059. [Google Scholar] [CrossRef]
  17. Xu, M.C.; Song, Z.J.; Zhang, B.W.; Pan, J. Empirical formula for predicting ultimate strength of stiffened panel of ship structure under combined longitudinal compression and lateral loads. Ocean Eng. 2018, 162, 161–175. [Google Scholar] [CrossRef]
  18. Jung, G.; Huang, T.D.; Dong, P.; Dull, R.M.; Conrardy, C.C.; Porter, N.C. Numerical prediction of buckling in ship panel structures. J. Ship Prod. Des. 2007, 23, 171–179. [Google Scholar] [CrossRef]
  19. Zhang, S.; Khan, I. Buckling and ultimate capability of plates and stiffened panels in axial compression. Mar. Struct. 2009, 22, 791–808. [Google Scholar] [CrossRef]
  20. Stamatelos, D.G.; Labeas, G.N.; Tserpes, K.I. Analytical calculation of local buckling and post-buckling behavior of isotropic and orthotropic stiffened panels. Thin Walled Struct. 2011, 49, 422–430. [Google Scholar] [CrossRef]
  21. Rahbar-Ranji, A. Elastic buckling analysis of longitudinally stiffened plates with flat-bar stiffeners. Ocean Eng. 2012, 58, 48–59. [Google Scholar] [CrossRef]
  22. Wang, J.; Ma, N.; Murakawa, H. An efficient FE computation for predicting welding induced buckling in production of ship panel structure. Mar. Struct. 2015, 41, 20–52. [Google Scholar] [CrossRef]
  23. Reddy, J.N. Theory and Analysis of Elastic Plates and Shells, 2nd ed.; Taylor & Francis Group, LLC: Boca Raton, FL, USA, 2007. [Google Scholar]
  24. Wang, C.M.; Zhang, Y.P.; Pedroso, D.M. Hencky bar-net model for plate buckling. Eng. Struct. 2017, 150, 947–954. [Google Scholar] [CrossRef]
  25. Love, A.E.H. The small free vibrations and deformation of a thin elastic shell. Proc. R. Soc. Lond. 1888, 43, 352–353. [Google Scholar]
  26. Ridwan Putranto, T.; Laksono, F.B.; Prabowo, A.R. Fracture and Damage to the Material accounting for Transportation Crash and Accident. Procedia Struct. Integr. 2020, 27, 38–45. [Google Scholar] [CrossRef]
  27. Ridwan. Failure Assessment of Ship Hull Materials Under Tension Loading as Part of Impact Phenomena Using Finite Element Approach. Master Thesis, Universitas Sebelas Maret, Surakarta, Indonesia, 2021. [Google Scholar]
  28. Ridwan, R.; Prabowo, A.R.; Muhayat, N.; Putranto, T.; Sohn, J.M. Tensile analysis and assessment of carbon and alloy steels using fe approach as an idealization of material fractures under collision and grounding. Curved Layer Struct. 2020, 7, 188–198. [Google Scholar] [CrossRef]
  29. Prabowo, A.R.; Muttaqie, T.; Sohn, J.M.; Bae, D.M.; Setiyawan, A. On the failure behaviour to striking bow Penetration of impacted marine-steel structures. Curved Layer Struct. 2018, 5, 68–79. [Google Scholar] [CrossRef] [Green Version]
  30. Prabowo, A.R.; Sohn, J.M.; Bae, D.M.; Cho, J.H. Performance assessment on a variety of double side structure during collision interaction with other ship. Curved Layer Struct. 2017, 4, 255–271. [Google Scholar] [CrossRef]
  31. Prabowo, A.R.; Sohn, J.M. Nonlinear dynamic behaviors of outer shell and upper deck structures subjected to impact loading in maritime environment. Curved Layer Struct. 2019, 6, 146–160. [Google Scholar] [CrossRef] [Green Version]
  32. Prabowo, A.R.; Tuswan, T.; Ridwan, R. Advanced development of sensors’ roles in maritime-based industry and research: From field monitoring to high-risk phenomenon measurement. Appl. Sci. 2021, 11, 3954. [Google Scholar] [CrossRef]
  33. Rahai, A.R.; Alinia, M.M.; Kazemi, S. Buckling analysis of stepped plates using modified buckling mode shapes. Thin Walled Struct. 2008, 46, 484–493. [Google Scholar] [CrossRef]
  34. Moen, C.D.; Schafer, B.W. Elastic buckling of thin plates with holes in compression or bending. Thin Walled Struct. 2009, 47, 1597–1607. [Google Scholar] [CrossRef]
  35. Rad, A.A.; Panahandeh-Shahraki, D. Buckling of cracked functionally graded plates under tension. Thin Walled Struct. 2014, 84, 26–33. [Google Scholar]
  36. Ndubuaku, O.; Liu, X.; Martens, M.; Cheng, J.J.R.; Adeeb, S. The effect of material stress-strain characteristics on the ultimate stress and critical buckling strain of flat plates subjected to uniform axial compression. Constr. Build Mater. 2018, 182, 346–359. [Google Scholar] [CrossRef]
  37. Tenenbaum, J.; Eisenberger, M. Analytic solution for buckling of rectangular isotropic plates with internal point supports. Thin Walled Struct. 2021, 163, 107640. [Google Scholar] [CrossRef]
  38. Turner, M.J.; Clough, R.W.; Martin, H.C.; Topp, L.J. Stiffness and deflection analysis of complex structures. J. Aeronaut. Sci. 1956, 23, 805–823. [Google Scholar] [CrossRef]
  39. Wegmuller, A.W. Finite Element Analyses of Elastic-Plastic Plates and Eccentrically Stiffened Plates. Ph.D. Thesis, Lehigh University, Bethlehem, PA, USA, 1971. [Google Scholar]
  40. Mukhopadhyay, M.; Mukherjee, A. Finite element buckling analysis of stiffened plates. Comput. Struct. 1990, 34, 795–803. [Google Scholar] [CrossRef]
  41. Quinn, D.; Murphy, A.; McEwan, W.; Lemaitre, F. Stiffened panel stability behaviour and performance gains with plate prismatic sub-stiffening. Thin Walled Struct. 2009, 47, 1457–1468. [Google Scholar] [CrossRef] [Green Version]
  42. ANSYS. Academic Research Mechanical, Release 21.1, Help System, Coupled Field Analysis Guide; ANSYS Inc.: Canonsburg, PA, USA, 2021. [Google Scholar]
  43. Goldarag, F.E.; Babaei, A.; Jafarzadeh, H. An experimental and numerical investigation of clamping force variation in simple bolted and hybrid (bolted-bonded) double lap joints due to applied longitudinal loads. Eng. Fail. Anal. 2018, 91, 327–340. [Google Scholar] [CrossRef]
  44. Goldarag, F.E.; Barzegar, S.; Babaei, A. An experimental method for measuring the clamping force in double lap simple bolted and hybrid (bolted-bonded) joints. Trans. Famena. 2015, 39, 87–94. [Google Scholar]
  45. Abubakar, A.; Dow, R.S. Simulation of ship grounding damage using the finite element method. Int. J. Solids Struct. 2013, 50, 623–636. [Google Scholar] [CrossRef] [Green Version]
  46. Prabowo, A.R.; Bae, D.M.; Sohn, J.M.; Zakki, A.F.; Cao, B.; Cho, J.H. Effects of the rebounding of a striking ship on structural crashworthiness during ship-ship collision. Thin Walled Struct. 2017, 115, 225–239. [Google Scholar] [CrossRef]
  47. Alsos, H.S.; Amdahl, J. On the resistance to penetration of stiffened plates, Part I—Experiments. Int. J. Impact Eng. 2009, 36, 799–807. [Google Scholar] [CrossRef]
  48. Alsos, H.S.; Amdahl, J.; Hopperstad, O.S. On the resistance to penetration of stiffened plates, Part II: Numerical analysis. Int. J. Impact Eng. 2009, 36, 875–887. [Google Scholar] [CrossRef]
  49. Lloyd, G. Rules for Classification and Construction; DNV GL SE: Hamburg, Germany, 2009. [Google Scholar]
  50. Prabowo, A.R.; Cao, B.; Bae, D.M.; Bae, S.Y.; Zakki, A.F.; Sohn, J.M. Structural analysis of the double bottom structure during ship grounding by finite element approach. Lat. Am. J. Solids Struct. 2017, 14, 1106–1123. [Google Scholar] [CrossRef] [Green Version]
  51. AbuBakar, A.; Dow, R.S. The impact analysis characteristics of a ship’s bow during collisions. Eng. Fail. Anal. 2019, 100, 492–511. [Google Scholar] [CrossRef]
  52. Zucco, G.; Weaver, P.M. The role of symmetry in the post-buckling behaviour of structures. Proc. R. Soc. A 2020, 476, 20190609. [Google Scholar] [CrossRef]
  53. Prabowo, A.R.; Bae, D.M.; Sohn, J.M. Comparing structural casualties of the Ro-Ro vessel using straight and oblique collision incidents on the car deck. J. Mar. Sci. Eng. 2019, 7, 183. [Google Scholar] [CrossRef] [Green Version]
  54. Bae, D.M.; Prabowo, A.R.; Cao, B.; Sohn, J.M.; Zakki, A.F.; Wang, Q. Numerical simulation for the collision between side structure and level ice in event of side impact scenario. Lat. Am. J. Solids Struct. 2016, 13, 2991–3004. [Google Scholar] [CrossRef] [Green Version]
  55. Prabowo, A.R.; Ridwan, R.; Tuswan, T.; Sohn, J.M.; Surojo, E.; Imaduddin, F. Effect of the selected parameters in idealizing material failures under tensile loads: Benchmarks for damage analysis on thin-walled structures. Curved Layer Struct. 2022, 9, 258–285. [Google Scholar] [CrossRef]
  56. Prasetya, L.W.; Prabowo, A.R.; Ubaidillah, U.; Istanto, I.; Nordin, N.A.B. Design of crashworthy attenuator structures as a part of vehicle safety against impact: Application of waste aluminum can-based material. Theor. Appl. Mech. Lett. 2021, 11, 100235. [Google Scholar] [CrossRef]
  57. Prabowo, A.R.; Prabowoputra, D.M. Investigation on Savonius turbine technology as harvesting instrument of non-fossil energy: Technical development and potential implementation. Theor. Appl. Mech. Lett. 2020, 10, 262–269. [Google Scholar] [CrossRef]
  58. Sakuri, S.; Surojo, E.; Ariawan, D.; Prabowo, A.R. Investigation of Agave cantala-based composite fibers as prosthetic socket materials accounting for a variety of alkali and microcrystalline cellulose treatments. Theor. Appl. Mech. Lett. 2020, 10, 405–411. [Google Scholar] [CrossRef]
Figure 1. Simply supported thin rectangular plate subjected to an in-plane uniaxial load [1].
Designs 06 00046 g001
Figure 2. Buckling coefficient for rectangular plate versus the aspect ratio a/b [1].
Designs 06 00046 g002
Figure 3. Buckling coefficient of rectangular plates with various boundary conditions [1].
Designs 06 00046 g003
Figure 4. Test specimen geometry. (a) Specimen A and (b) Specimen B [41].
Designs 06 00046 g004
Figure 5. Typical finite element mesh on Specimen A. (a) FE model; (b) FE result with the deformation contour.
Designs 06 00046 g005
Figure 6. Comparison between experimental [41] and FE on Specimen A.
Designs 06 00046 g006
Figure 7. Typical finite element mesh on Specimen B. (a) FE model; (b) FE result with the deformation contour.
Designs 06 00046 g007
Figure 8. Result comparison between experimental data [41] and FE on Specimen B.
Designs 06 00046 g008
Figure 9. Load versus displacement curves based on comparison with laboratory experiment by Quinn et al. [41]. (a) Specimen A and (b) Specimen B.
Designs 06 00046 g009
Figure 10. Geometrical design of specimens with three different aspect ratio a/b and three different thickness h.
Designs 06 00046 g010
Figure 11. Geometrical design of specimens. (a) Specimen A and (b) Specimen B.
Designs 06 00046 g011
Figure 12. (a) The stress-strain curve. (b) The tensile test force-displacement curve [51].
Designs 06 00046 g012
Figure 13. Linear boundary condition of the simply supported rectangular plate.
Designs 06 00046 g013
Figure 14. Nonlinear boundary condition on Specimen A.
Designs 06 00046 g014
Figure 15. Nonlinear boundary condition on Specimen B.
Designs 06 00046 g015
Figure 16. First four mode shapes in the 2, 3, and 4 aspect ratio a/b and 3 mm thickness of the plate.
Designs 06 00046 g016
Figure 17. Effect of the a/b ratio obtained from the 3 mm thickness of the plate on the critical buckling load: (a) 3 mm plate thickness; (b) 4 mm plate thickness; (c) 5 mm plate thickness.
Designs 06 00046 g017
Figure 18. Effect of thickness change to the load versus displacement curve. (a) Specimen A; (b) Specimen B.
Designs 06 00046 g018aDesigns 06 00046 g018b
Figure 19. Effect of thickness change to energy versus displacement curve. (a) Specimen A; (b) Specimen B.
Designs 06 00046 g019
Figure 20. Equivalent strain contour in Specimen A: (a) 3 mm plate thickness; (b) 4 mm plate thickness; (c) 5 mm plate thickness.
Designs 06 00046 g020
Figure 21. Equivalent strain contour in Specimen B: (a) 3 mm plate thickness; (b) 4 mm plate thickness; (c) 5 mm plate thickness.
Designs 06 00046 g021
Figure 22. Effect of stiffeners thickness to the load versus displacement curve. (a) Specimen A; (b) Specimen B.
Designs 06 00046 g022aDesigns 06 00046 g022b
Figure 23. Effect of stiffeners thickness to the energy versus displacement curve. (a) Specimen A; (b) Specimen B.
Designs 06 00046 g023
Figure 24. Equivalent strain contour in Specimen A: (a) 4 mm longitudinal stringers thickness; (b) 5 mm longitudinal stringers thickness; (c) 6 mm longitudinal stringers thickness.
Designs 06 00046 g024
Figure 25. Equivalent strain contour in Specimen B. (a) 2 mm sub-stiffeners thickness; (b) 2.5 mm sub-stiffeners thickness; (c) 3 mm sub-stiffeners thickness.
Designs 06 00046 g025
Figure 26. Effect of materials change to the load versus displacement curve. (a) Specimen A; (b) Specimen B.
Designs 06 00046 g026aDesigns 06 00046 g026b
Figure 27. Effect of materials change to the load versus displacement curve. (a) Specimen A; (b) Specimen B.
Designs 06 00046 g027
Table 1. Milestone research on the buckling analysis of the plate and stiffened panels.
MilestoneAuthor(s)SubjectMethodologyImportant Remarks
2003Srivastava et al. [13]Buckling and vibration of stiffened plates subjected to partial edge loadingNumerical analysisThey found that with the higher aspect ratio of the stiffened plates, the buckling loads are not significantly affected by the position of the load. Furthermore, increasing the compressive load causes a decrease in natural frequencies.
2006Kumar et al. [14]Ultimate strength of ship plating under axial compressionExperimental test and numerical analysisThe strength of stiffened plates is decreased by 24 to 37% when a square cutout is present in the center of the plate. Compared to panels without a cutout, the strength of the panel is decreased by 23% for stiffener-initiated failure, and 31 to 46% for plate-initiated failures when a rectangular cutout is present in the middle of the plate, respectively.
2007Jung et al. [18]Buckling analysis in ship panel structuresNumerical analysis using Q-WELD™ ABAQUS softwareBuckling resistance of the stiffened panels can be effectively increased by transient thermal tensioning (TTT). Center-to-edge welding has decreased the buckling of panels compared with the edge-to-edge welding.
2009Zhang and Khan [19]Buckling and ultimate capability of plates and stiffened panels in axial compressionAnalytical and numerical analysis using ABAQUS softwareThe ultimate strength of the simply supported plates in axial compression can be determined using Faulkner’s formula with an immensely satisfactory prediction. In the case β < 2.5 , the dissimilarity results in Faulkner’s formula being not more than 1.5% compared with the finite element results.
2011Seifi and Khoda-yari [15]Buckling analysis of cracked, thin plates under full and partial compression edge loadingExperimental test and numerical analysis using ABAQUS softwareCracks in plates influence the critical buckling load. Increasing the crack length in the plate leads to a reduction in the critical buckling load. Furthermore, the critical buckling load is extremely decreased when the cracks are perpendicular to the loading compared with the other crack directions.
2011Stamatelos et al. [20]Buckling analysis of composite bladed stiffened plates with different aspect ratios and different numbers of stiffenersAnalytical and numerical analysis using ANSYSThe proposed analytical method for buckling and post-buckling analysis was based on the classical lamination plate theory and two-dimensional Ritz displacement functions for arbitrary edge supports. The results show that the prediction of the critical buckling load obtains satisfactory agreement with an error of not more than 8% compared with the finite element results.
2012Rahbar-Ranji [21]Buckling analysis of longitudinally stiffened plates with flat-bar stiffenersAnalytical and numerical analysis using ANSYSIt is noted that the Euler stress for tripping is not influenced by web buckling when the attached plate is neglected.
2015Wang et al. [22]Buckling analysis when producing the ship panel structureExperimental test and numerical analysis using JWRIAN (Joining and Welding Research Institute Analysis)An elastic finite element analysis to predict welding-induced buckling based on the inherent deformation method is proposed. The result of the welding angular distortion computed by the proposed FE method has a satisfactory agreement with the experimental result for the sequential welding of the fillet welded joint.
2018Xu et al. [17]Ultimate strength analysis of the stiffened panel of the ship structureExperiment, analytical, and numerical analysis using ANSYSThe load carrying capacity of the stiffened panel is immensely influenced by the plate slenderness and column slenderness. For the tripping buckling, flexural or torsional rigidity of stiffener is strongly considered.
2020Sujiatanti et al. [16]Buckling and collapse analysis of a cracked thin steel panelExperimental test and numerical analysis using LS-DYNAThe presence of the crack in plate appears to decrease the ultimate plate collapse load. The result shows that the cracked plate has a small value for the ultimate buckling load (e.g., 35 kN and 30 kN for 50 mm and 75 mm cracks, respectively, compared with an intact plate which is 45 kN).
Table 2. Milestone research on the plate buckling.
MilestoneAuthor(s)SubjectMethodologyImportant Remarks
2008Rahai et al. [33]Buckling analysis of stepped platesAnalytical and numerical analysis using ANSYSA novel, approximate procedure using an energy method based on modified buckling mode shapes for buckling analysis using simply supported rectangular steps has been introduced in this study. As noted, this novel, approximate method can be applied to all plates for which the shape mode is identified.
2009Moen and Schafer [34]Elastic buckling of thin plates with holesNumerical analysis using ABAQUSThe presence of holes in the plate can create unique buckling modes. Depending on the size and geometry of the hole, the critical elastic buckling stress on the plate can either decrease or increase.
2014Rad and Panahandeh-Shahraki [35]Buckling analysis of cracked functionally graded platesNumerical analysis (Finite element)This study suggests that as the Poisson ratio increases in both uni-axial and bi-axial loads, the critical load decreases.
2018Ndubuaku et al. [36]The material stress-strain characteristics on the ultimate stress and critical buckling of flat platesNumerical analysis using ABAQUSThis study indicates that the ultimate compressive strength and strain on the plate are affected by the strain hardening. The phenomenon of this effect is seen more clearly when the plate thickness is thicker.
2021Tenenbaum and Eisenberger [37]Analytic solution for the buckling of rectangular isotropic plates with internal point supportsAnalyticalThe boundary conditions and the loading type (uni-axial or bi-axial) are seen to considerably affect the buckling load factor λ.
Table 3. Material properties of 2024-T3 aluminum alloy [43,44].
PropertyValue
Density2780 kg/m3
Young’s modulus73.4 GPa
Yield stress315 MPa
Tensile strength550 MPa
Poisson’s ratio0.33
Exponent0.406
Failure strain0.18
Table 4. Comparative mass of the specimens.
Mass [kg]Mass Difference [kg]Mass Percentage Difference [%]
Quinn et al., [41]Specimen A1.959--
Specimen B1.968--
Current studySpecimen A1.974+0.015+0.77
Specimen B1.993+0.025+1.27
Table 5. Ultimate panel collapse loads and load difference percentage.
Mesh Size [mm]Ultimate Panel Collapse Load [kN]Load Difference Percentage [%]
Specimen ASpecimen BSpecimen ASpecimen B
Experimental data [41]-216.6255.0--
Current study5223.8257.5+3.33+0.99
7.5219.8259.9+1.48+1.93
10217.4257.1+0.38+0.84
12.5219.2260.2+1.20+2.03
15218.7262.3+0.96+2.87
17.5220.5262.1+1.80+2.76
20222.7238.7+2.83−6.38
22.5224.2239.2+3.50−6.20
25225.5237.3+4.09−6.96
27.5225.3237.8+4.02−6.74
Table 6. The material properties of steel based on [47,48] which were obtained experimentally.
Material TypeMaterial GradeK
(MPa)
Exponent, n
(-)
εf
(-)
Yield Stress
(MPa)
Ultimate Stress (MPa)
AS235JR-EN100257400.240.35285416
BS235JR-EN100257600.2250.35340442
CS355JR-EN102108300.180.28390495
Table 7. Critical buckling load of the rectangular plate depend on the plate thickness h.
Plate ThicknessCritical Buckling Load [N/m]
Analytical (a/b ratio)Finite element result (a/b ratio)
234234
-567567567
320,49881,99420,49820,49420,49620,50082,07282,11182,16420,49420,49620,500
448,589194,35548,58948,60148,61248,626194,700194,880195,10048,60148,61248,626
594,900379,60094,90094,95894,99795,031380,690381,180382,07094,95894,99895,031
Table 8. Effect of the plate thickness to ultimate panel collapse loads.
ELT RatioUltimate Panel Collapse Load (kN)Energy (kJ)
Plate Thickness (Specimen A)Plate Thickness (Specimen B)Plate Thickness (Specimen A)Plate Thickness (Specimen B)
3 mm4 mm5 mm3 mm4 mm5 mm3 mm4 mm5 mm3 mm4 mm5 mm
5477.2655.6790.7633.0825.8995.21.11.31.51.31.72.1
6461.4653.2795.2629.9824.3999.61.11.31.51.31.82.1
7463.3652.3793.6633.1825.31003.01.11.31.61.41.82.1
Table 9. Effect of the thickness of stiffeners to ultimate panel collapse loads.
ELT RatioUltimate Panel Collapse Load [kN]Energy [kJ]
Thickness of the Longitudinal Stringers (Specimen A)Thickness of the Sub-Stiffeners (Specimen B)Thickness of the Longitudinal Stringers (Specimen A)Thickness of the Sub-Stiffeners (Specimen B)
4 mm5 mm6 mm2 mm2.5 mm3 mm4 mm5 mm6 mm2 mm2.5 mm3 mm
5790.7839.6884.0995.21010.01025.11.51.71.92.12.12.1
6795.2844.8889.0999.61015.31030.71.51.82.02.12.12.1
7793.6843.0887.41003.01018.31034.31.61.82.02.12.12.2
Table 10. Effect of the materials and plate thickness to ultimate panel collapse loads.
MaterialELT RatioUltimate Panel Collapse Load [kN]Energy [kJ]
Plate Thickness (Specimen A)Plate Thickness (Specimen B)Plate Thickness (Specimen A)Plate Thickness (Specimen B)
3 mm4 mm5 mm3 mm4 mm5 mm3 mm4 mm5 mm3 mm4 mm5 mm
S235JR-EN10025 (A)5477.2655.6790.7633.0825.8995.21.11.31.51.31.72.1
6461.4653.2795.2629.9824.3999.61.11.31.51.31.82.1
7463.3652.3793.6633.1825.31003.01.11.31.61.41.82.1
S235JR-EN10025 (B)5516.9743.3899.3700.9913.01105.81.21.41.61.41.92.3
6512.1737.1900.7698.3912.51113.81.21.41.71.41.92.3
7514.2736.9898.9701.4914.41117.71.21.41.71.51.92.3
S355JR-EN102105553.1816.6990.7756.3965.21165.41.21.41.61.52.02.2
6549.9797.6976.6754.5965.91179.61.31.41.71.52.02.4
7554.9796.9976.7753.3968.61194.61.31.51.71.51.92.3
Table 11. Effect of the materials and thickness of stiffeners to ultimate panel collapse loads.
MaterialELT RatioUltimate Panel Collapse Load [kN]Energy [kJ]
Thickness of the Longitudinal Stringers (Specimen A)Thickness of the Sub-Stiffeners (Specimen B)Thickness of the Longitudinal Stringers (Specimen A)Thickness of the Sub-Stiffeners (Specimen B)
4 mm5 mm6 mm2 mm2.5 mm3 mm4 mm5 mm6 mm2 mm2.5 mm3 mm
S235JR-EN10025 (A)5790.7839.6884.0995.21010.01025.11.51.71.92.12.12.1
6795.2844.8889.0999.61015.31030.71.51.82.02.12.12.1
7793.6843.0887.41003.01018.31034.31.61.82.02.12.12.2
S235JR-EN10025 (B)5899.3950.2997.51105.81123.01025.11.61.92.12.32.32.1
6900.7952.81000.51113.81131.01147.91.71.92.12.32.32.3
7898.9950.8998.71117.71135.81153.51.71.92.12.32.32.3
S355JR-EN102105990.71041.01086.71165.41185.11204.31.61.92.12.22.22.2
6976.61036.91084.81179.61197.91217.21.71.92.22.42.32.4
7976.71032.81081.81194.61213.01231.11.71.92.22.32.42.5
Publisher’s Note: MDPI stays neutral with regard to jurisdictional claims in published maps and institutional affiliations.

