
Assessment of the Offensive Play in Elite Water Polo Using the Team Sport Assessment Procedure (TSAP) over an Entire Competitive Season

Abstract
:1. Introduction
2. Materials and Methods
2.1. Experimental Design
2.2. Subjects
2.3. Data Collection
2.4. Statistical Analysis
3. Results
4. Discussion
5. Conclusions
Author Contributions
Funding
Institutional Review Board Statement
Informed Consent Statement
Data Availability Statement
Acknowledgments
Conflicts of Interest
References
- Perazzetti, A.; Dopsaj, M.; Sansone, P.; Mandorino, M.; Tessitore, A. Effects of Playing Position and Contextual Factors on Internal Match Loads, Post-Match Recovery and Well-Being Responses of Elite Male Water Polo Players. J. Funct. Morphol. Kinesiol. 2023, 8, 12. [Google Scholar] [CrossRef] [PubMed]
- Hraste, M.; Bebić, M.; Rudić, R. Where is today’s water polo heading? An analysis of the stages of development of the game of water polo. NAŠE MORE Znan. Časopis More Pomor. 2013, 60, S17–S22. [Google Scholar]
- Hughes, M. Notational analysis. In Science and Soccer; Routledge: Abingdon, UK, 2003; pp. 253–272. [Google Scholar]
- Smith, H.K. Applied physiology of water polo. Sports Med. 1998, 26, 317–334. [Google Scholar] [CrossRef] [PubMed]
- Kondrič, M.; Uljević, O.; Gabrilo, G.; Kontić, D.; Sekulić, D. General anthropometric and specific physical fitness profile of high-level junior water polo players. J. Hum. Kinet. 2012, 32, 157. [Google Scholar] [CrossRef]
- Dimitric, G.; Kontic, D.; Versic, S.; Scepanovic, T.; Zenic, N. Validity of the Swimming Capacities and Anthropometric Indices in Predicting the Long-Term Success of Male Water Polo Players: A Position. Int. J. Environ. Res. Public Health 2022, 19, 4463. [Google Scholar] [CrossRef]
- Lupo, C.; Capranica, L.; Tessitore, A. The validity of the session-RPE method for quantifying training load in water polo. Int. J. Sports Physiol. Perform. 2014, 9, 656–660. [Google Scholar] [CrossRef]
- Lupo, C.; Tessitore, A.; Minganti, C.; King, B.; Cortis, C.; Capranica, L. Notational analysis of American women’s collegiate water polo matches. J. Strength Cond. Res. 2011, 25, 753–757. [Google Scholar] [CrossRef] [PubMed]
- Ordóñez, E.G.; González, C.T.; Pérez, M.D. Offensive performance indicators in a regular season of Water-Polo. Int. J. Perform. Anal. Sport 2015, 15, 1114–1123. [Google Scholar] [CrossRef]
- García-Marín, P.; Iturriaga, F.M.A. Water polo: Technical and tactical shot indicators between winners and losers according to the final score of the game. Int. J. Perform. Anal. Sport 2017, 17, 334–349. [Google Scholar] [CrossRef]
- Ordóñez, E.G.; González, C.T. Relationship between effectiveness and match outcome in the Spanish Water Polo League. Retos 2021, 41, 798–803. [Google Scholar] [CrossRef]
- Ordóñez, E.G.; González, C.T. Key performance indicators of all-star player and winning teams in elite water polo at the 2020 Olympic Games. Int. J. Perform. Anal. Sport 2022, 22, 317–331. [Google Scholar] [CrossRef]
- Lupo, C.; Tessitore, A.; Minganti, C.; Capranica, L. Notational analysis of elite and sub-elite water polo matches. J. Strength Cond. Res. 2010, 24, 223–229. [Google Scholar] [CrossRef]
- Pérez, M.D.C.I.; Ordóñez, E.G.; González, C.T. Keys to success in high level water polo teams. Int. J. Perform. Anal. Sport 2016, 16, 995–1006. [Google Scholar] [CrossRef]
- Lupo, C.; Condello, G.; Tessitore, A. Notational analysis of elite men’s water polo related to specific margins of victory. J. Sports Sci. Med. 2012, 11, 516. [Google Scholar] [PubMed]
- Lupo, C.; Condello, G.; Capranica, L.; Tessitore, A. Women’s water polo World Championships: Technical and tactical aspects of winning and losing teams in close and unbalanced games. J. Strength Cond. Res. 2014, 28, 210–222. [Google Scholar] [CrossRef] [PubMed]
- Gómez, M.A.; Pollard, R.; Luis-Pascual, J.C. Comparison of the home advantage in nine different professional team sports in Spain. Percept. Mot. Ski. 2011, 113, 150–156. [Google Scholar] [CrossRef] [PubMed]
- Ruano, M.Á.; Serna, A.D.; Lupo, C.; Sampaio, J.E. Effects of game location, quality of opposition, and starting quarter score in the outcome of elite water polo quarters. J. Strength Cond. Res. 2016, 30, 1014–1020. [Google Scholar] [CrossRef]
- Hraste, M.; Dizdar, D.; Trninić, V. Experts opinion about system of the performance evaluation criteria weighted per positons in the water polo game. Coll. Antropol. 2008, 32, 851–861. [Google Scholar]
- Dong, L.; Berryman, N.; Romeas, T. Questioning the validity and reliability of using a video-based test to assess decision making among female and male water polo players. Int. J. Sports Sci. Coach. 2023. [Google Scholar] [CrossRef]
- Platanou, T.; Varamenti, E. Impact of ball possession time and number of passes on the efficiency of scoring in men’s water polo. Hum. Mov. 2023, 24, 18–24. [Google Scholar] [CrossRef]
- Casanova, F.; Pereira, R.; Canossa, S.; Padilha, M.; Bagatin, R.; Teoldo, I.; González-Víllora, S.; Fernandes, R.J.; Tavares, F. Representativeness of offensive scenarios to evaluate perceptual-cognitive skills of water polo players. Cent. Eur. J. Sport Sci. Med. 2020, 29, 11–19. [Google Scholar] [CrossRef]
- Grehaigne, J.F.; Godbout, P.; Bouthier, D. Performance assessment in team sports. J. Teach. Phys. Educ. 1997, 16, 500–516. [Google Scholar] [CrossRef]
- Gréhaigne, J.F.; Godbout, P. Formative assessment in team sports in a tactical approach context. J. Phys. Educ. Recreat. Danc. 1998, 69, 46–51. [Google Scholar] [CrossRef]
- Richard, J.F.; Godbout, P.; Gréhaigne, J.F. The establishment of team-sport performance norms for grade 5 to 8 students. Avante-Ontario 1998, 4, 1–19. [Google Scholar]
- Richard, J.-F.; Godbout, P.; Grèhaigne, J.F. Students’ Precision and Interobserver Reliability of Performance Assessment in Team Sports. Res. Q. Exerc. Sport 2000, 71, 85–91. [Google Scholar] [CrossRef] [PubMed]
- McCormick, B.T.; Hannon, J.C.; Newton, M.; Shultz, B.; Miller, N.; Young, W. Comparison of physical activity in small-sided basketball games versus full-sided games. Int. J. Sports Sci. Coach. 2012, 7, 689–697. [Google Scholar] [CrossRef]
- González-Víllora, S.; Serra-Olivares, J.; Pastor-Vicedo, J.C.; Da Costa, I.T. Review of the tactical evaluation tools for youth players, assessing the tactics in team sports: Football. SpringerPlus 2015, 4, 1–17. [Google Scholar] [CrossRef] [PubMed]
- Barquero-Ruiz, C.; Arias-Estero, J.L.; Kirk, D. Assessment for tactical learning in games: A systematic review. Eur. Phys. Educ. Rev. 2020, 26, 827–847. [Google Scholar] [CrossRef]
- Rechenchosky, L.; Menegassi, V.M.; Jaime, M.D.O.; Borges, P.H.; Sarmento, H.; Mancha-Triguero, D.; Serra-Olivares, J.; Rinaldi, W. Scoping review of tests to assess tactical knowledge and tactical performance of young soccer players. J. Sports Sci. 2021, 39, 2051–2067. [Google Scholar] [CrossRef]
- Blomqvist, M.; Vänttinen, T.; Luhtanen, P. Assessment of secondary school students’ decision-making and game-play ability in soccer. Phys. Educ. Sport Pedagog. 2005, 10, 107–119. [Google Scholar] [CrossRef]
- Ortega-Toro, E.; García-Angulo, A.; Giménez-Egido, J.M.; García-Angulo, F.J.; Palao, J.M. Design, validation, and reliability of an observation instrument for technical and tactical actions of the offense phase in soccer. Front. Psychol. 2019, 10, 22. [Google Scholar] [CrossRef] [PubMed]
- Junior, J.A.; Aquino, R.; Machado, J.C. Tactical performance in soccer: The importance of choosing and properly applying tactical assessment tools. Braz. J. Mot. Behav. 2020, 14, 171–179. [Google Scholar] [CrossRef]
- Nadeau, L.; Godbout, P.; Richard, J.F. Assessment of ice hockey performance in real-game conditions. Eur. J. Sport Sci. 2008, 8, 379–388. [Google Scholar] [CrossRef]
- Kolstad, A.T.; Nadeau, L.; Eliason, P.H.; Goulet, C.; Hagel, B.E.; Emery, C.A. Does disallowing body checking impact offensive performance in non-elite under-15 and under-18 youth ice hockey leagues? A video-analysis study. Int. J. Sports Sci. Coach. 2022. [Google Scholar] [CrossRef]
- Clemente, F.M.; González-Víllora, S.; Delextrat, A.; Martins, F.M.L.; Vicedo, J.C.P. Effects of the sports level, format of the game and task condition on heart rate responses, technical and tactical performance of youth basketball players. J. Hum. Kinet. 2017, 58, 141. [Google Scholar] [CrossRef] [PubMed]
- Souabni, M.; Hammouda, O.; Souabni, M.; Romdhani, M.; Souissi, W.; Ammar, A.; Driss, T. Nap improved game-related technical performance and physiological response during small-sided basketball game in professional players. Biol. Sport 2023, 40, 389–397. [Google Scholar] [CrossRef] [PubMed]
- Godbout, P.; Gréhaigne, J.F. Regulation of tactical learning in team sports—The case of the tactical-decision learning model. Phys. Educ. Sport Pedagog. 2022, 27, 215–230. [Google Scholar] [CrossRef]
- Llobet-Martí, B.; López-Ros, V.; Barrera-Gómez, J.; Comino-Ruiz, J. Assessing novices’ game performance in rugby union: The Rugby attack assessment instrument (RAAI). J. Teach. Phys. Educ. 2016, 35, 181–186. [Google Scholar] [CrossRef]
- Perazzetti, A.; Dopsaj, M.; Tessitore, A. Technical and tactical evaluation of ball possession in international youth water polo matches using the Team Sport Assessment Procedure (TSAP) instrument. Montenegrin J. Sports Sci. Med. 2023, 12. ahead of print. [Google Scholar] [CrossRef]
- Dopsaj, M.; Aleksandrović, M. Basic anthropomorphological characteristics of elite senior Serbian water polo players according to field position. Int. J. Fit. 2009, 5, 47–57. [Google Scholar]
- Olejnik, S.F.; Algina, J. Parametric ANCOVA and the rank transform ANCOVA when the data are conditionally non-normal and heteroscedastic. J. Educ. Stat. 1984, 9, 129–149. [Google Scholar] [CrossRef]
- Perazzetti, A.; Tessitore, A. Use of Team Sport Assessment Procedure (TSAP) in Water Polo: Analysis of Youth International Teams. In Book of Proceedings 20th International Scientific Conference: Contemporary Challenges in Sport, Physical Exercising and Active Lifestyle; University of Belgrade: Belgrade, Serbia, 2021; p. 32. [Google Scholar]
- Kempton, T.; Sullivan, C.; Bilsborough, J.C.; Cordy, J.; Coutts, A.J. Match-to-match variation in physical activity and technical skill measures in professional Australian Football. J. Sci. Med. Sport 2015, 18, 109–113. [Google Scholar] [CrossRef]
- Liu, H.; Gómez, M.A.; Gonçalves, B.; Sampaio, J. Technical performance and match-to-match variation in elite football teams. J. Sports Sci. 2016, 34, 509–518. [Google Scholar] [CrossRef]
- Medić, A.; Dželalija, B.; Kožul, K.; Pem Novosel, I.; Dijanić, T. Comparison of game-related statistics in men’s international championships between winning and losing teams according to margin of victory. Coll. Antropol. 2014, 38, 901–907. [Google Scholar]
- Platanou, T. Physiological demands of water polo goalkeeping. J. Sci. Med. Sport 2009, 12, 244–250. [Google Scholar] [CrossRef] [PubMed]
- Shamardin, V.N.; Khorkavyy, B.V. Organizational structure of technical and tactical training of skilled goalkeepers in football. Pedagog. Psihol. Med. Biol. 2015, 19, 75–79. [Google Scholar] [CrossRef]
- Altavilla, G. Analysis and comparison of the goalkeeper’s role in past and modern soccer: A pilot study. J. Phys. Educ. Sport 2023, 23, 564–568. [Google Scholar] [CrossRef]
- Melchiorri, G.; Viero, V.; Tancredi, V.; Del Bianco, R.; Bonifazi, M. Actual playing time of water polo players in relation to the field position. J. Hum. Kinet. 2020, 73, 241–249. [Google Scholar] [CrossRef]
- Botonis, P.G.; Toubekis, A.G.; Platanou, T.I. Physiological and tactical on-court demands of water polo. J. Strength Cond. Res. 2019, 33, 3188–3199. [Google Scholar] [CrossRef]
- Özkol, M.Z.; Turunç, S.; Dopsaj, M. Water polo shots notational analysis according to player positions. Int. J. Perform. Anal. Sport 2013, 13, 734–749. [Google Scholar] [CrossRef]
- Lupo, C.; Minganti, C.; Cortis, C.; Perroni, F.; Capranica, L.; Tessitore, A. Effects of competition level on the centre forward role of men’s water polo. J. Sports Sci. 2012, 30, 889–897. [Google Scholar] [CrossRef]
- Lupo, C.; Tessitore, A.; Cortis, C.; Perroni, F.; D’Artibale, E.; Capranica, L. Elite water polo: A technical and tactical analysis of the centre forward role. In Book of Abstracts 12th Annual Congress of the European College of Sport Science; University of Jyväskylä: Jyväskylä, Finland, 2007; p. 468. [Google Scholar]
- Perazzetti, A.; Dopsaj, M.; Nedeljković, A.; Mazić, S.; Tessitore, A. Survey on coaching philosophies and training methodologies of water polo head coaches from three different European national schools. Kinesiology 2023, 55, 49–61. [Google Scholar] [CrossRef]


| GAINING POSSESSION OF THE BALL | |
| Receiving the ball (RB) | A player receives the ball from a teammate without losing control of it. |
| Conquering the ball (CB) | A player is considered to have conquered a ball if he or she intercepts it, steals it from an opponent or recaptures it after an unsuccessful shot on goal or after a near-loss to the other team. |
| DISPOSING OF THE BALL | |
| Playing a neutral ball (NB) | A routine pass to a teammate or any pass which does not truly put the opponent team in jeopardy is considered a neutral ball. |
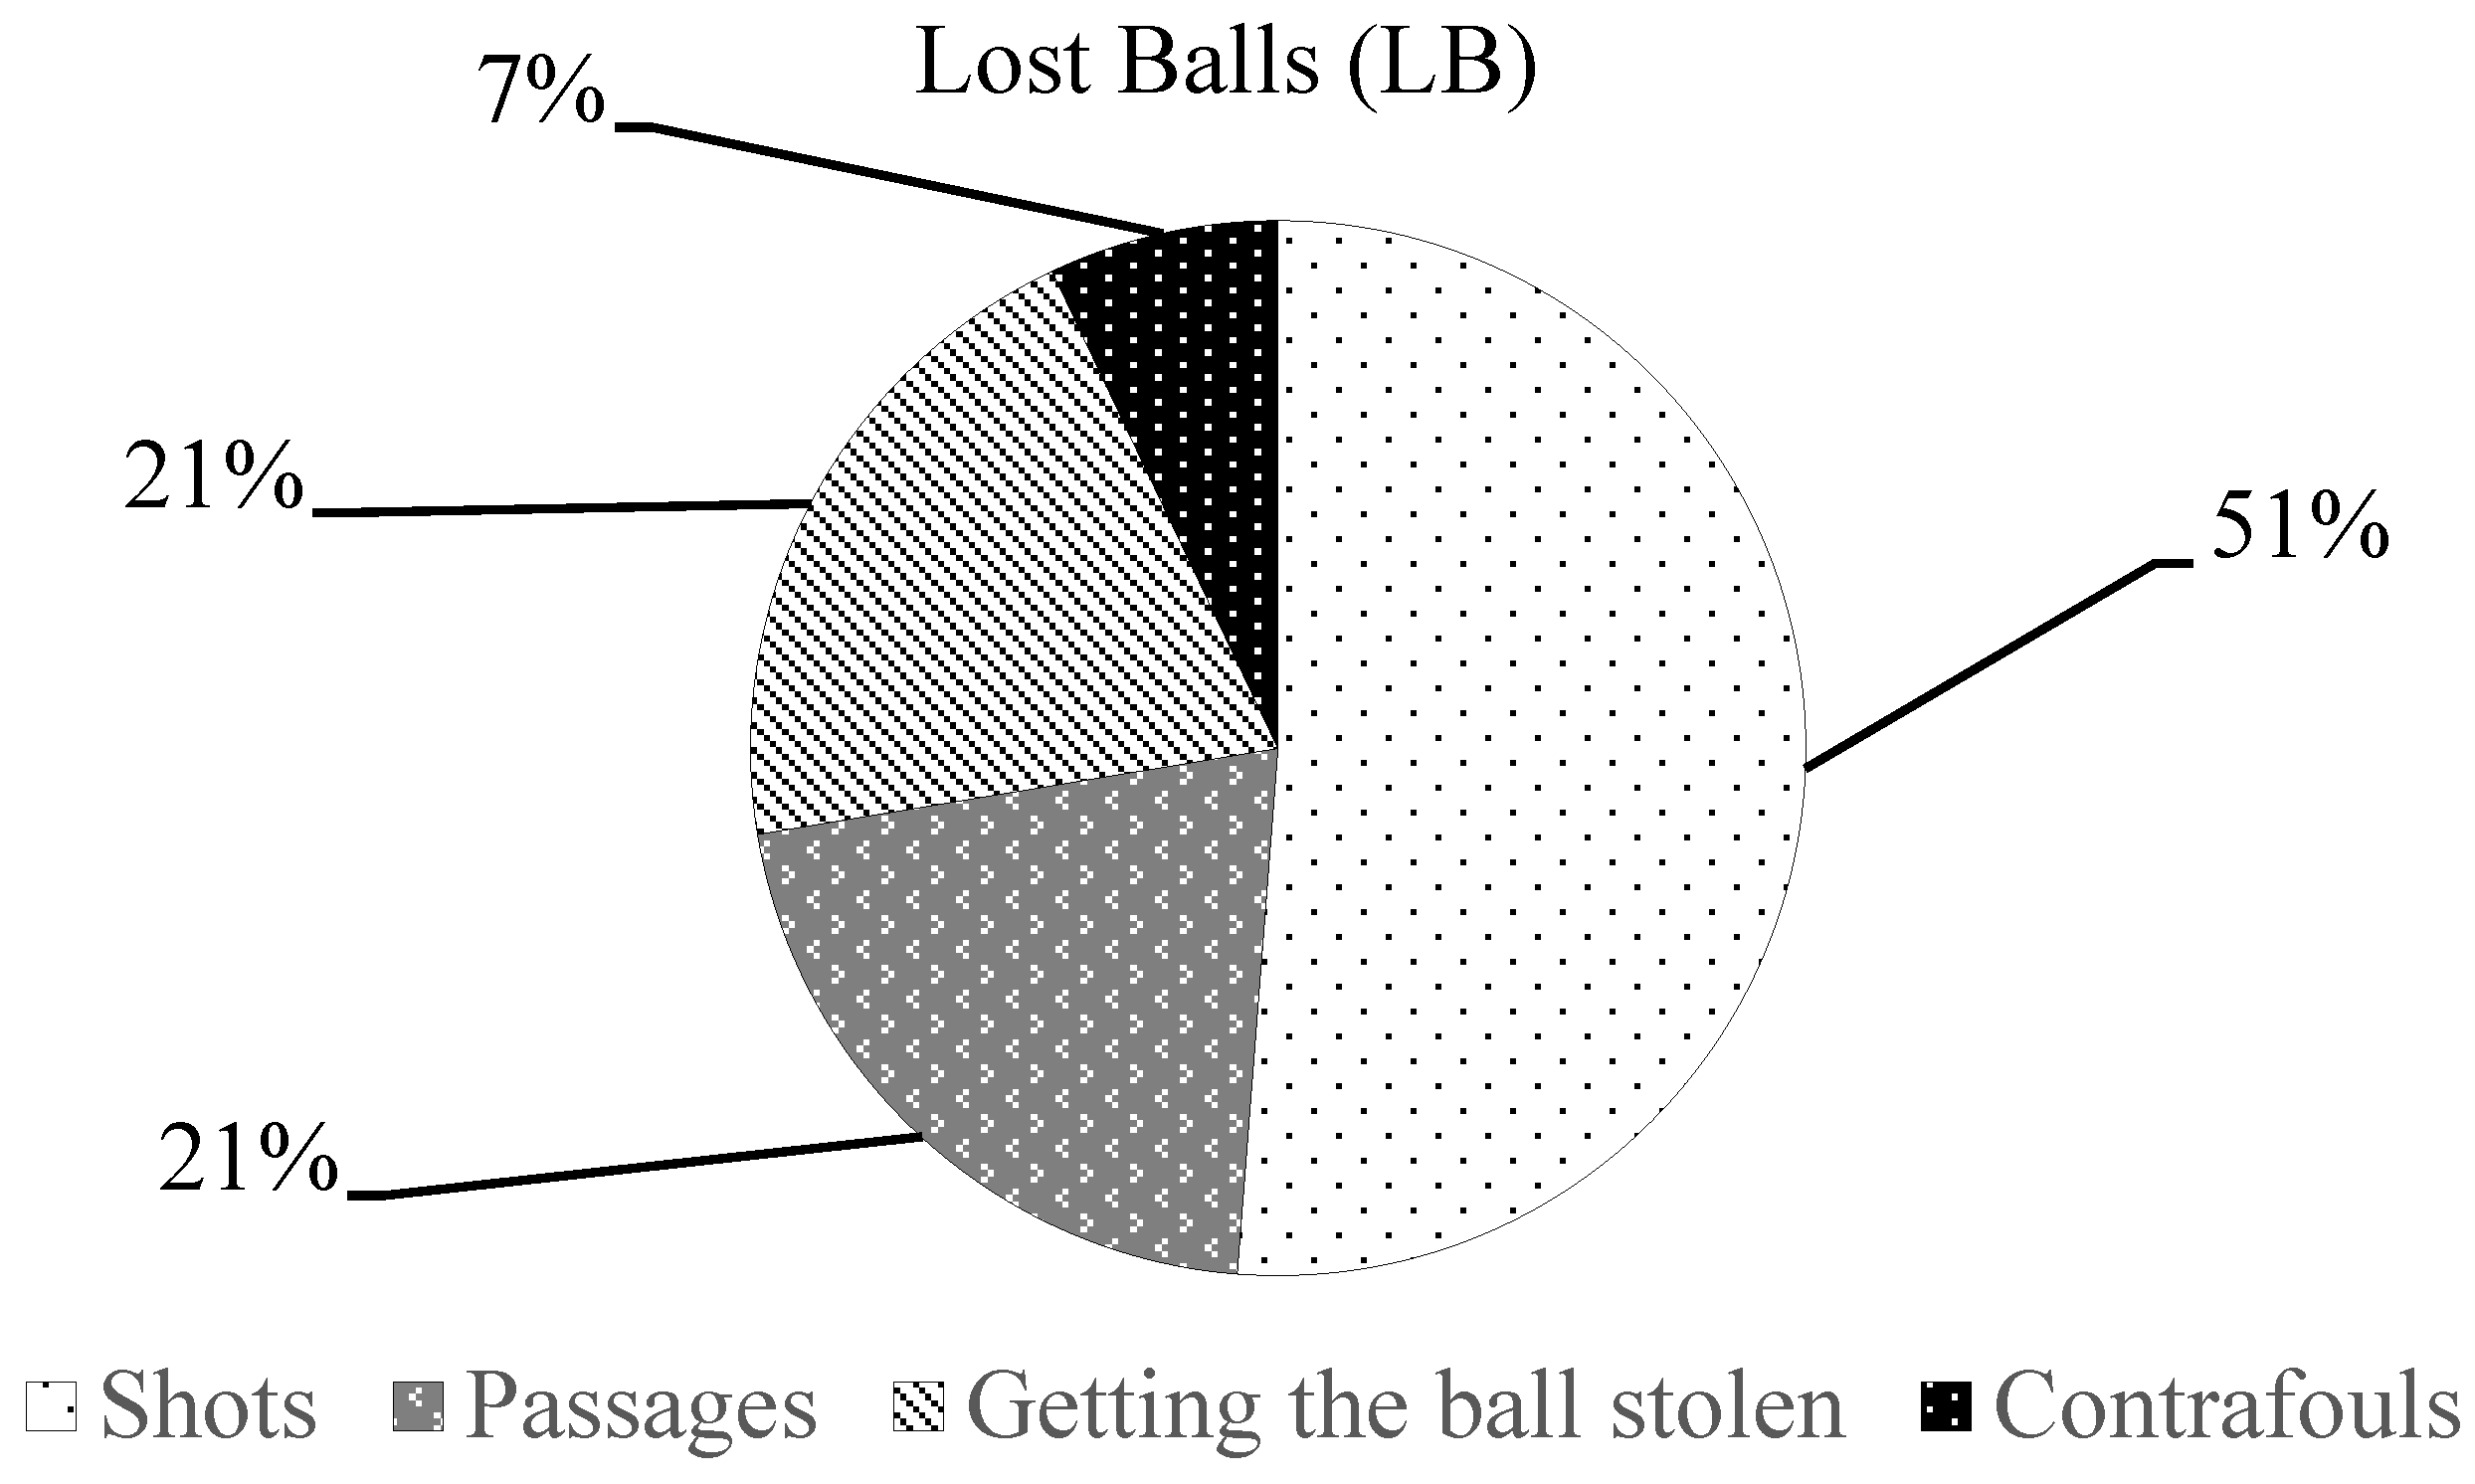
| Losing the ball (LB) | A player is considered as having lost the ball when he or she loses it to the other team without having scored a goal (i.e., shot: a missing shot; passage: a passage intercepted by an opponent or a failed passage; lost ball: a ball stolen by an opponent; contrafoul: a foul committed while holding the ball). |
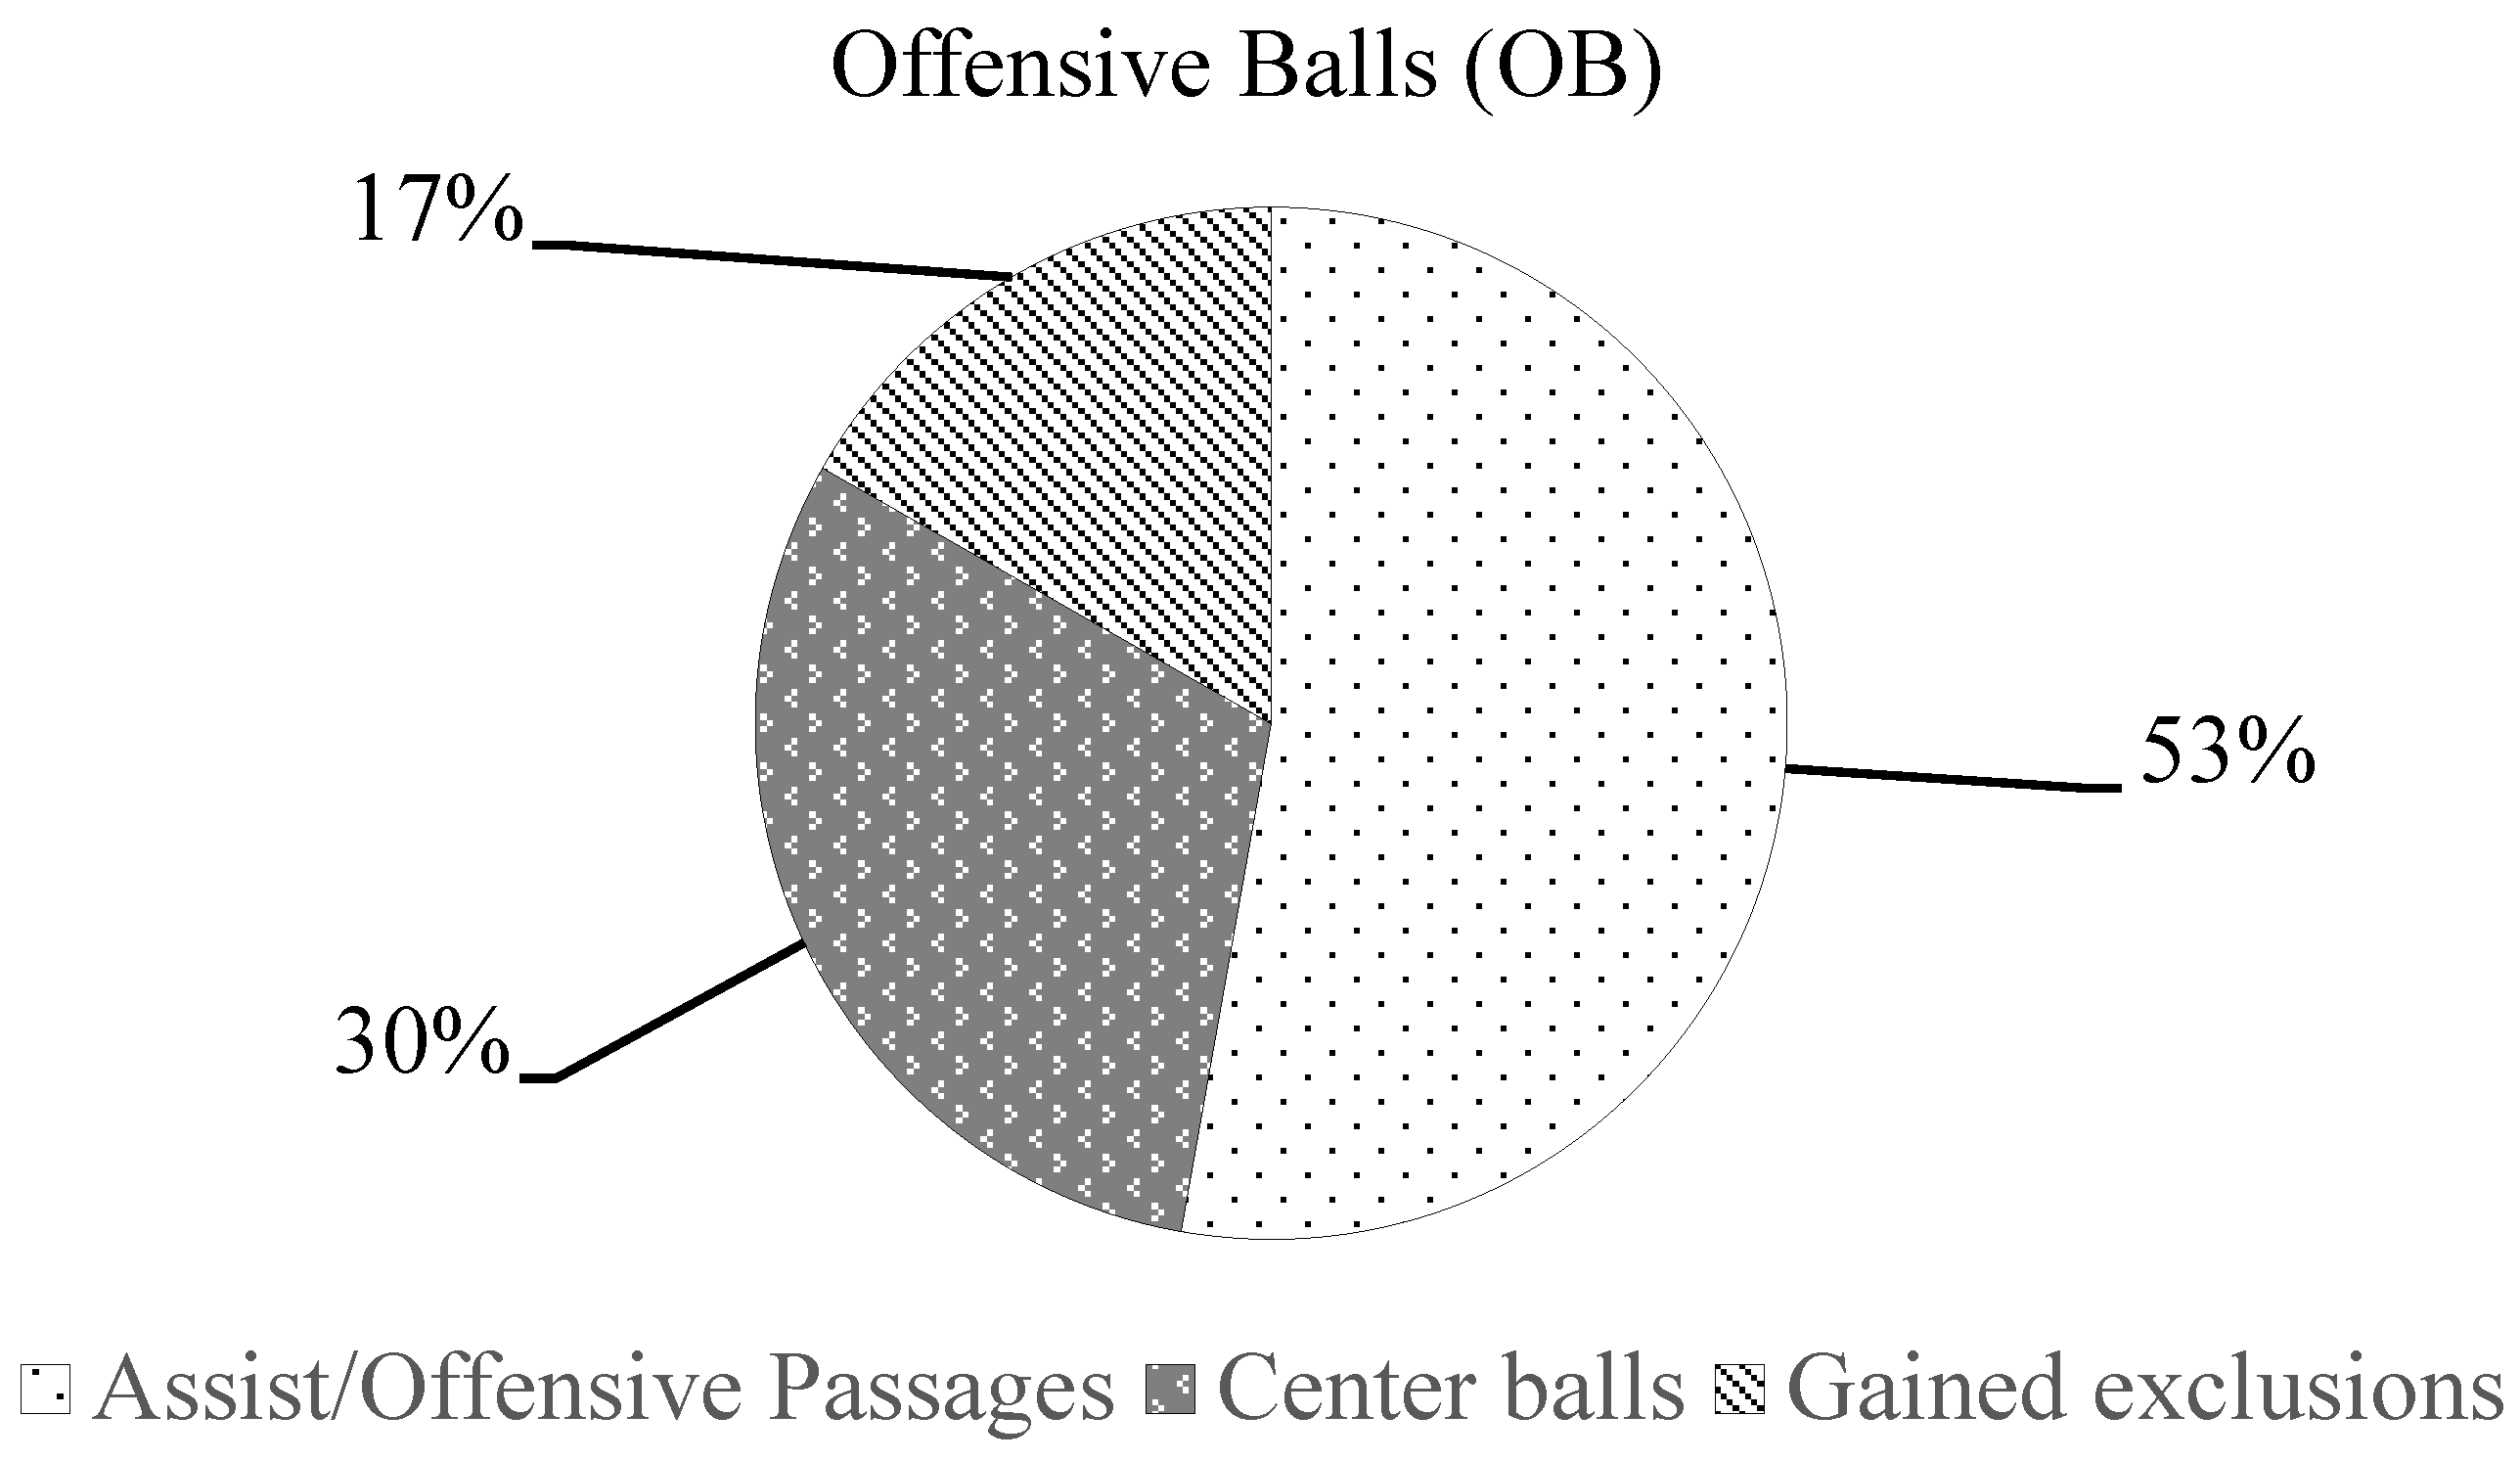
| Playing an offensive ball (OB) | An offensive ball is a pass to a teammate which puts pressure on the other team and, most often, leads to a shot toward the goal (i.e., assist/offensive passage: a passage executed before a shot; center Ball: a passage toward the center forward) or a gained exclusion (i.e., while holding the ball, gaining a power play situation through an exclusion foul committed by an opponent). |
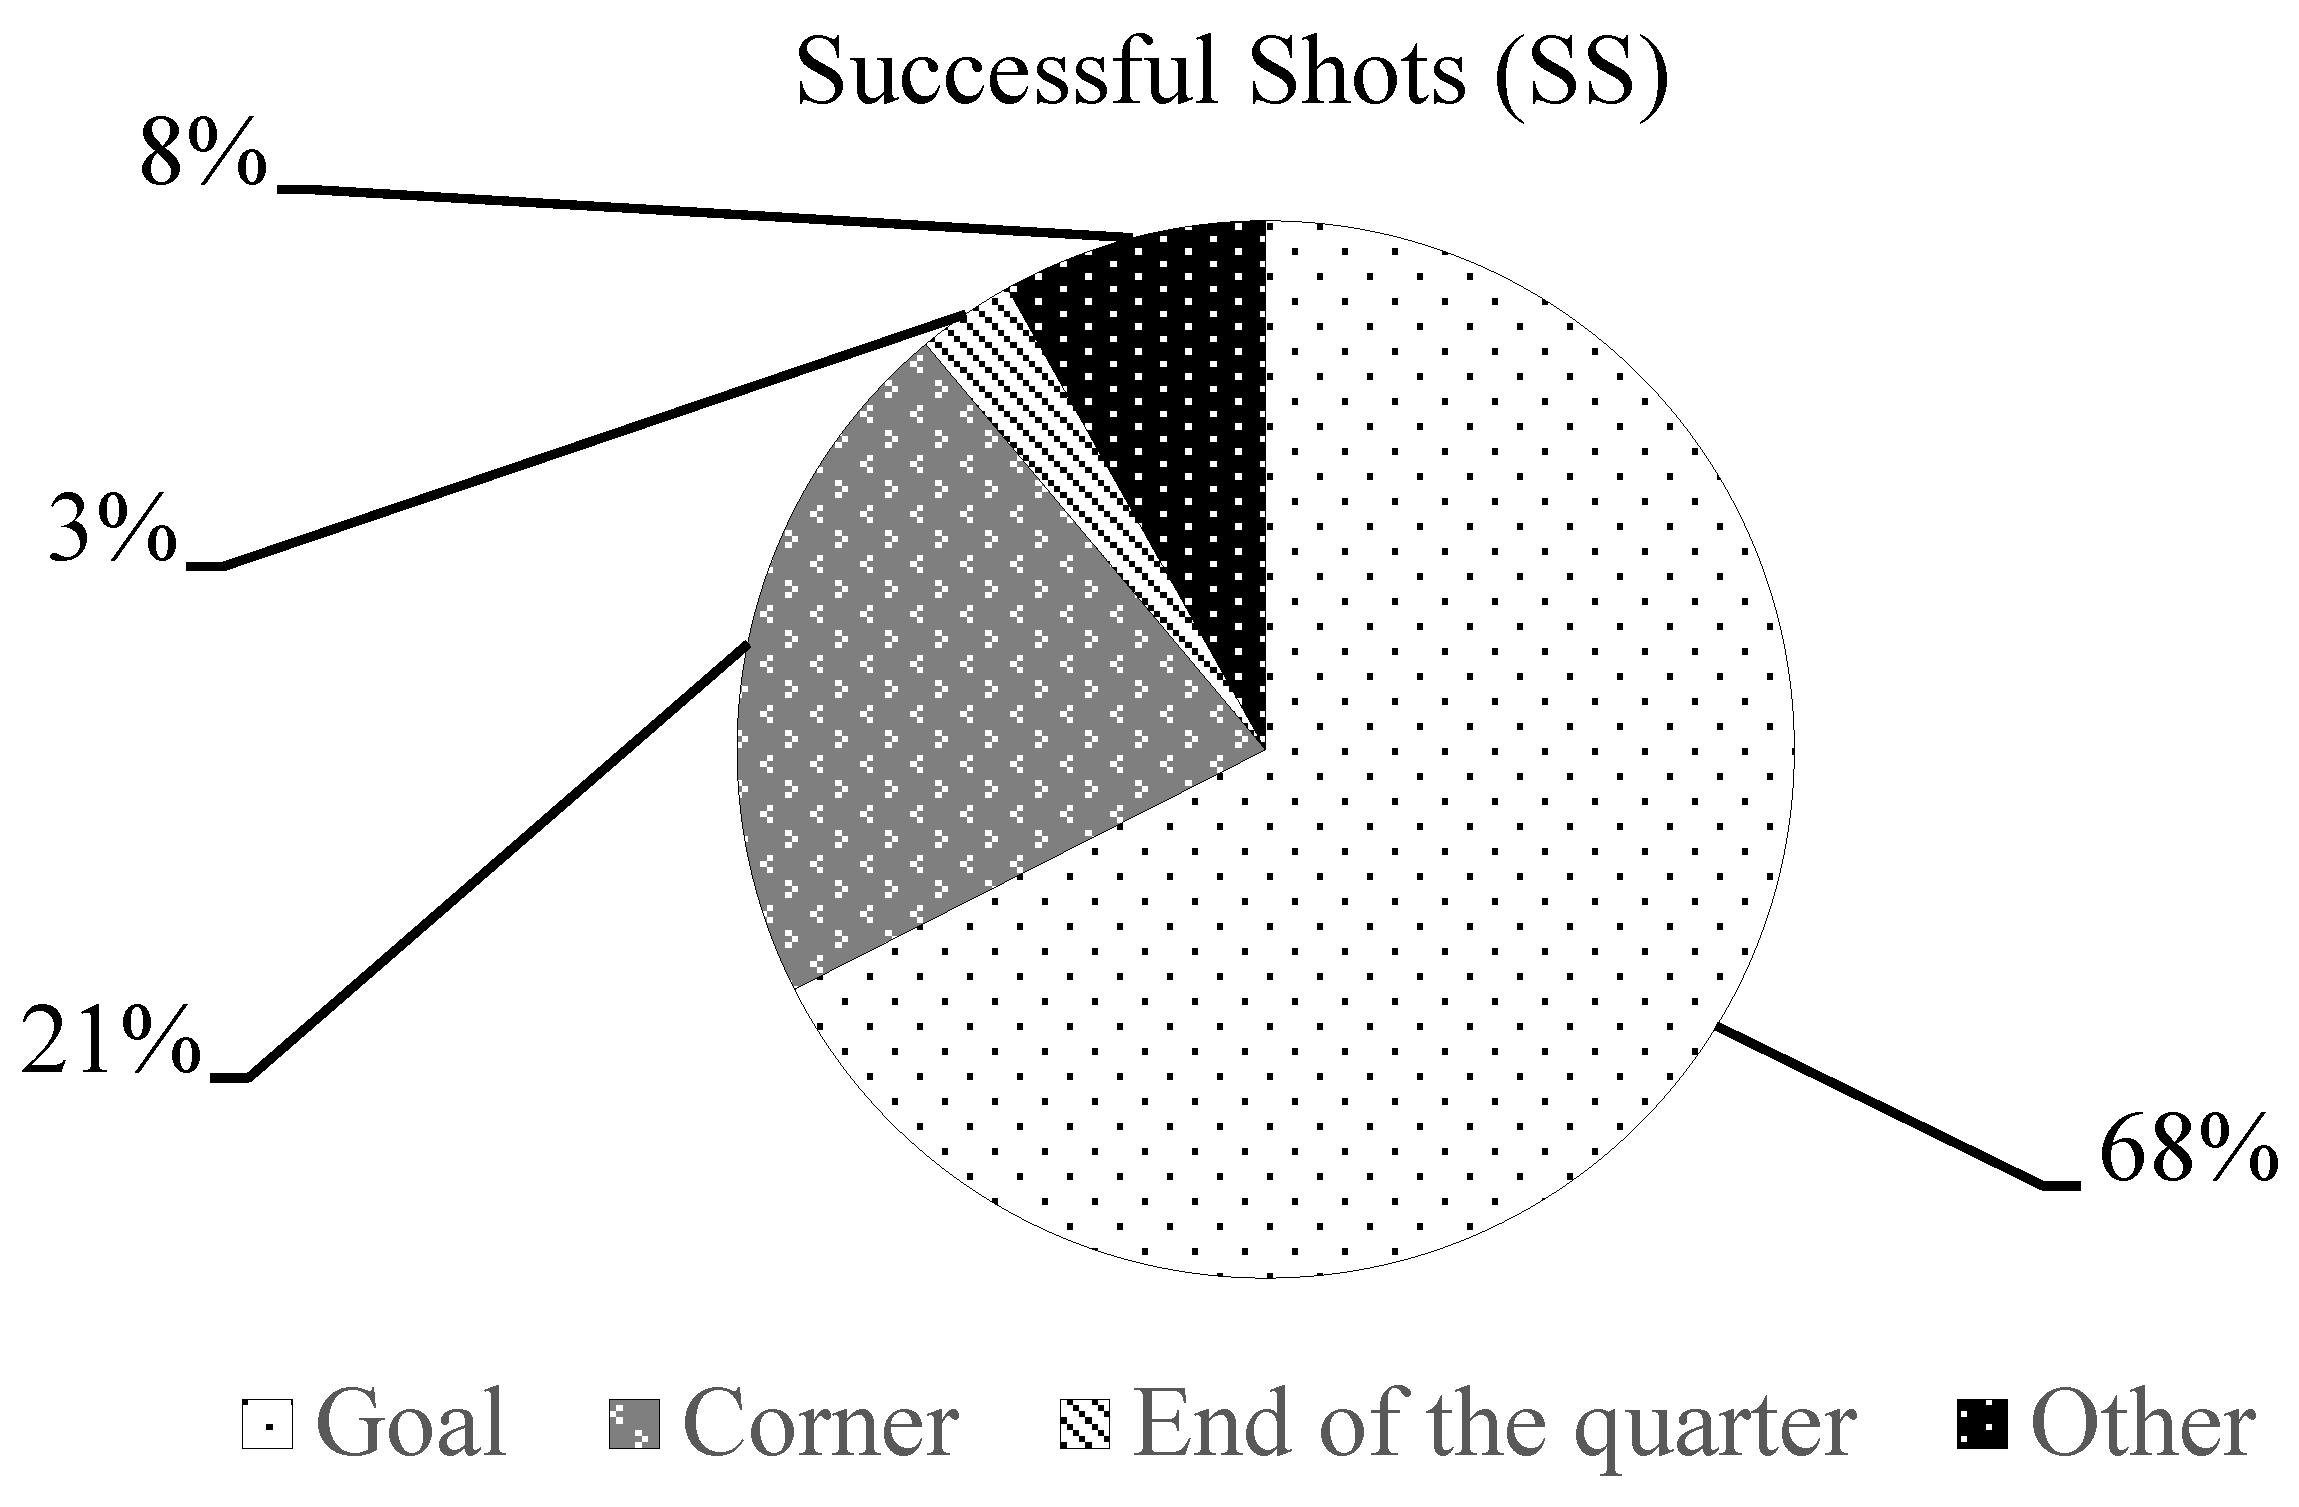
| Executing a successful shot (SS) | A shot is considered successful when it scores, or the possession of the ball is retained by one’s team (Goal and Shots) |
| PERFORMANCE INDICATORS | |
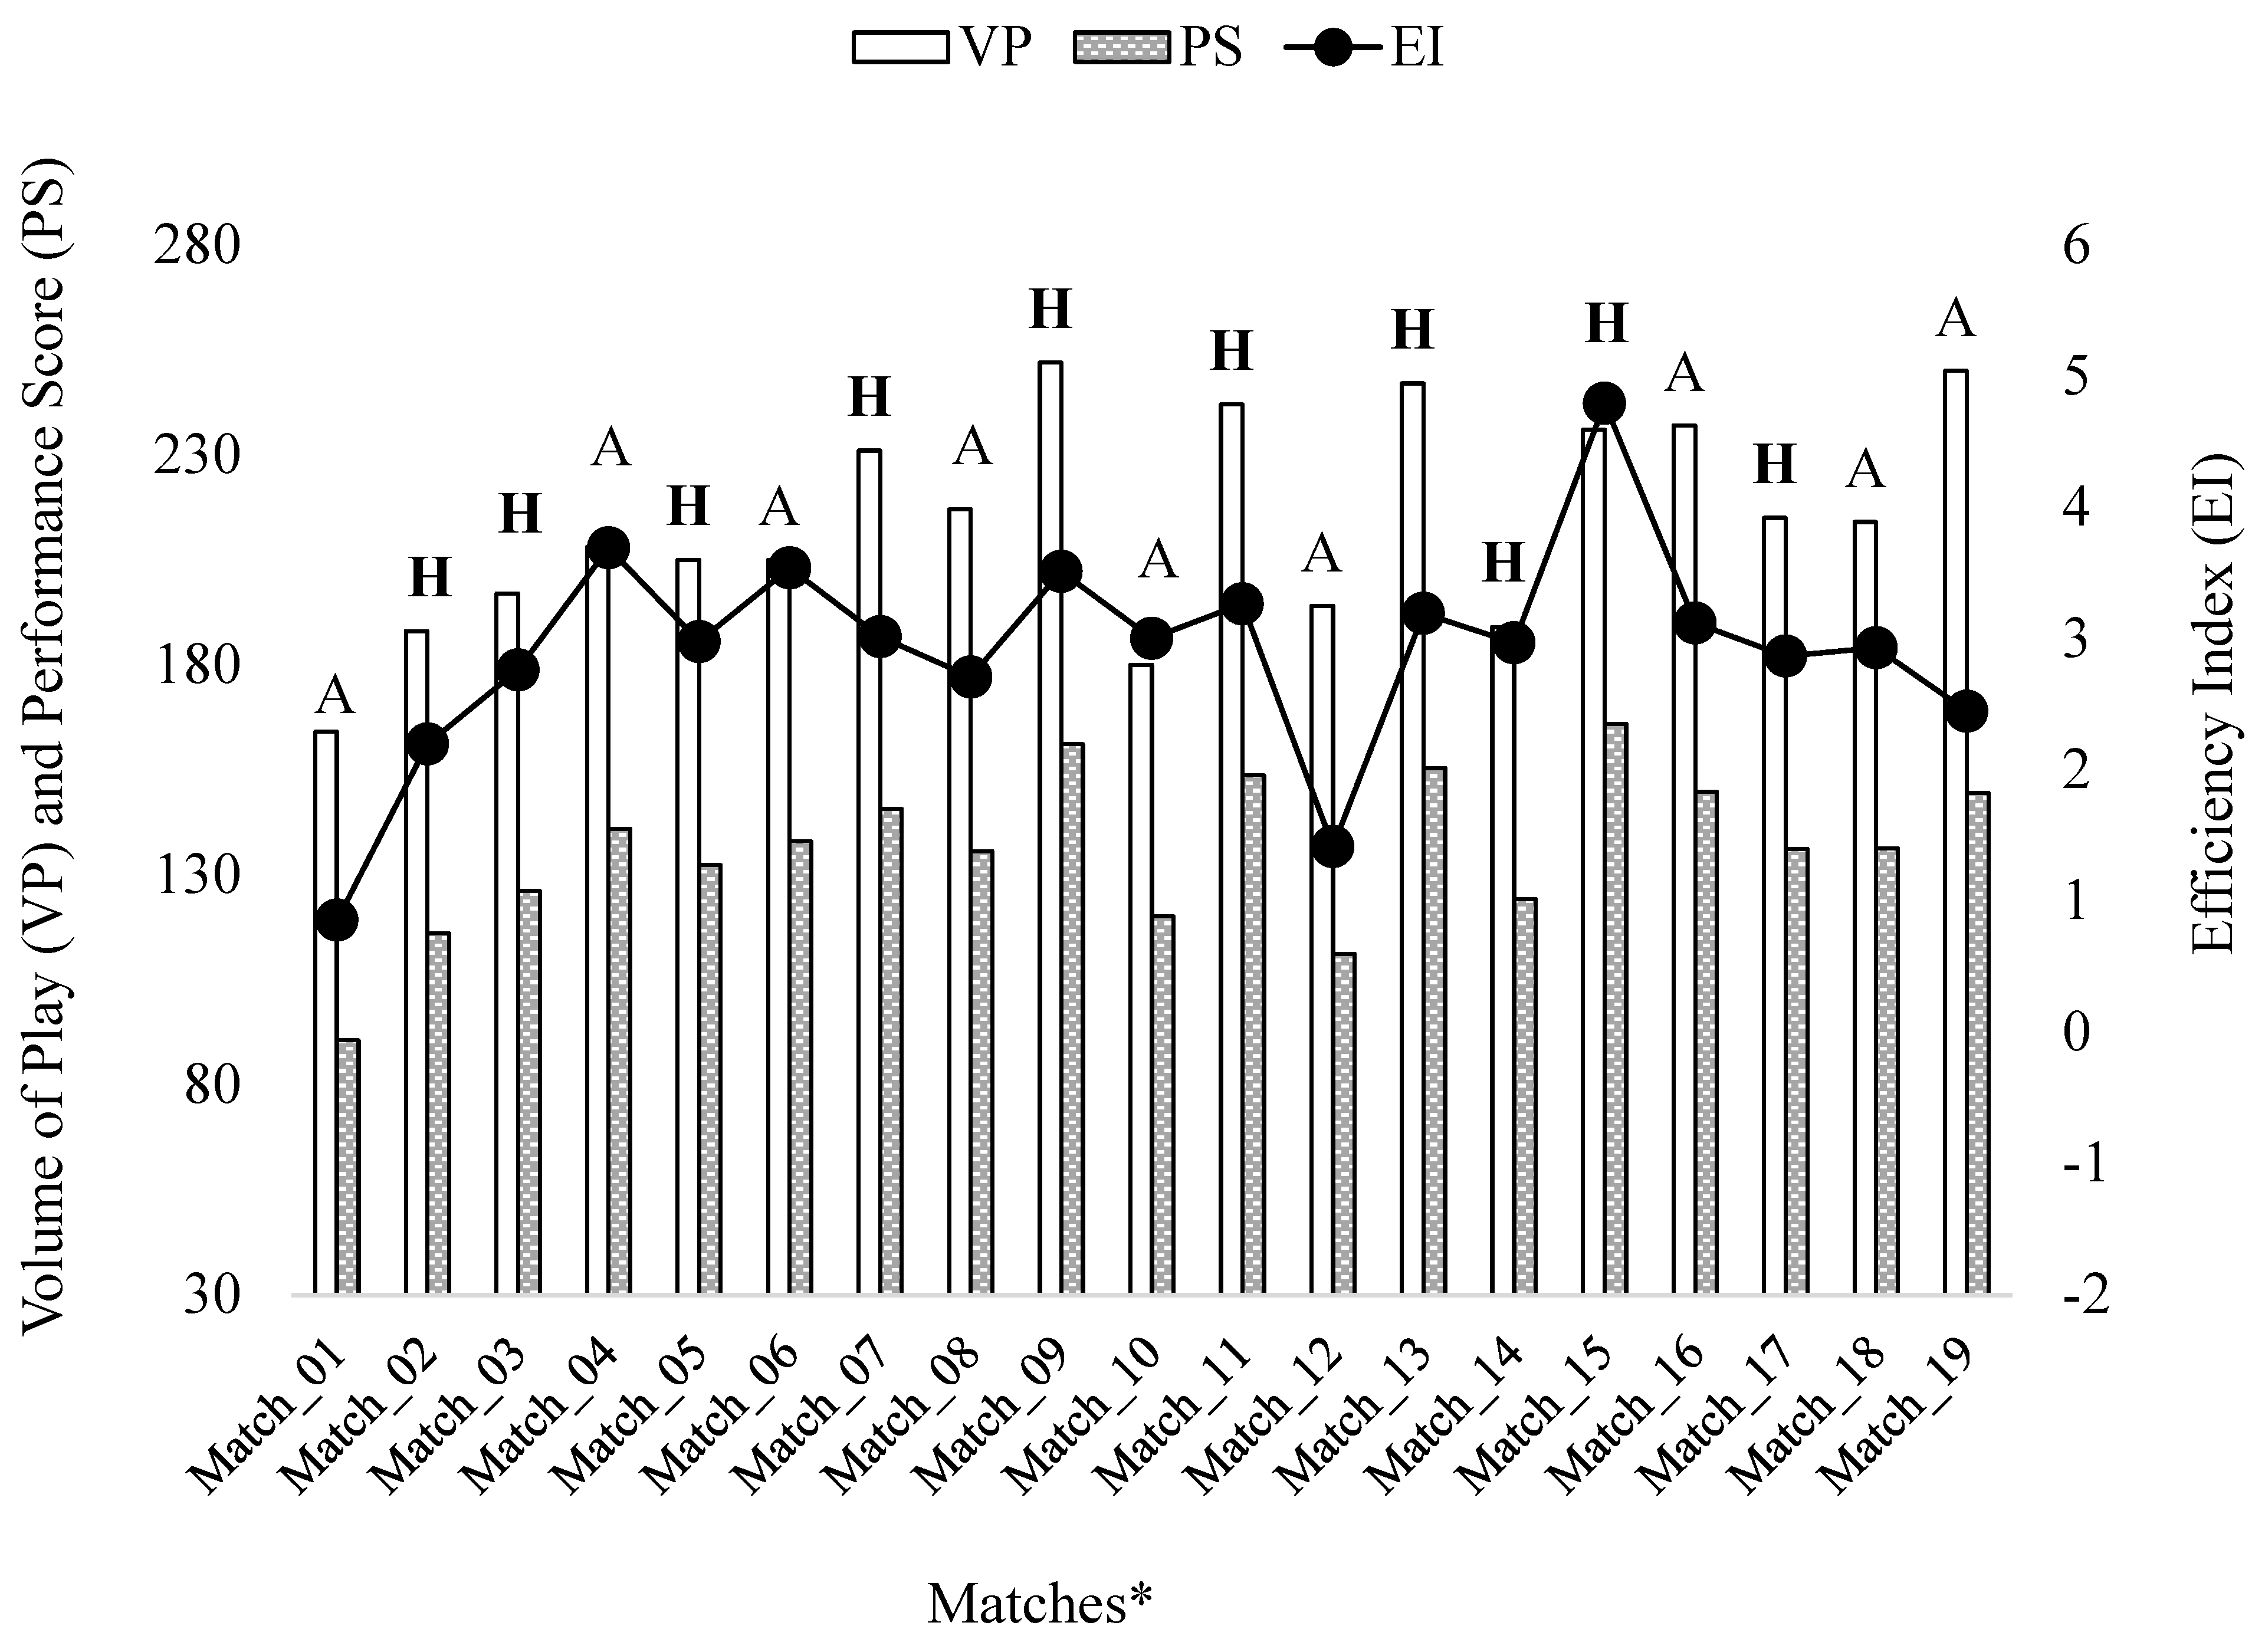
| Volume of play (VP) | The volume of play represents the number of times the player has gained possession of the ball, as calculated using the formula: VP: RB + CB |
| Efficiency index (EI) | The efficiency index indicates the players’ efficiency in ball possession according to their disposing of the ball, as calculated using the formula: EI: (OB + SS)/(10 + LB) |
| Performance score (PS) | The performance score indicates the players’ ratio between the number of times players gain the possession of the ball and their efficiency in disposing of it, as calculated using the formula: PS: (VP/2) + (EI*10) |
| MIN | MAX | MEAN | SD | %CV | |
|---|---|---|---|---|---|
| RB | 160 | 247 | 207.1 | 26.3 | 12.7 |
| CB | 4 | 16 | 7.2 | 3.2 | 44.7 |
| VP | 164 | 252 | 214.3 | 25.6 | 11.9 |
| NB | 115 | 188 | 149.1 | 21.0 | 14.1 |
| LB | 19 | 36 | 27.4 | 4.4 | 16.2 |
| OB | 8 | 38 | 25.4 | 7.3 | 28.8 |
| SS | 5 | 20 | 12.3 | 3.4 | 27.9 |
| EI | 0.9 | 4.8 | 2.9 | 0.8 | 28.6 |
| PS | 90.5 | 165.9 | 136.2 | 18.7 | 13.7 |
| Unstandardized Coefficients | Standardized Coefficients | t | Sig. | ||
|---|---|---|---|---|---|
| B | Std. Error | Beta | |||
| (constant) | 23.63 | 5.23 | 4.520 | 0.00 | |
| season phase | 1.90 | 2.05 | 0.07 | 0.924 | 0.36 |
| match location | −0.51 | 1.74 | −0.02 | −0.294 | 0.77 |
| final score difference | 0.03 | 1.92 | 0.00 | 0.015 | 0.99 |
| playing position | −5.08 | 0.97 | −0.33 | −5.258 | 0.00 |
| Unstandardized Coefficients | Standardized Coefficients | t | Sig. | ||
|---|---|---|---|---|---|
| B | Std. Error | Beta | |||
| (constant) | 15.81 | 3.44 | 4.597 | 0.00 | |
| season phase | 1.12 | 1.35 | 0.06 | 0.825 | 0.41 |
| match location | −0.54 | 1.15 | −0.03 | −0.473 | 0.64 |
| final score difference | −0.55 | 1.26 | −0.03 | −0.434 | 0.67 |
| playing position | −2.90 | 0.64 | −0.29 | −4.559 | 0.00 |
| Competition Phase | Match Location | Final Score Difference | ||||
|---|---|---|---|---|---|---|
| Regular Season (13 Matches) | Play-Out (6 Matches) | Home (10 Matches) | Away (9 Matches) | Balanced (10 Matches) | Unbalanced (9 Matches) | |
| RB | 203 ± 28 | 215 ± 24 | 212 ± 27 | 202 ± 27 | 204 ± 22 | 210 ± 31 |
| CB | 7 ± 2 | 9 ± 5 | 9 ± 4 | 6 ± 1 | 8 ± 3 | 6 ± 3 |
| VP | 210 ± 27 | 224 ± 22 | 220 ± 24 | 208 ± 27 | 212 ± 22 | 216 ± 30 |
| NB | 145 ± 22 | 157 ± 18 | 154 ± 20 | 144 ± 22 | 145 ± 18 | 154 ± 24 |
| LB | 28 ± 4 | 26 ± 6 | 26 ± 4 | 30 ± 4 | 26 ± 4 | 29 ± 4 |
| OB | 25 ± 8 | 27 ± 7 | 27 ± 6 | 24 ± 9 | 29 ± 5 | 22 ± 8 |
| SS | 12 ± 3 | 13 ± 4 | 14 ± 3 | 10 ± 3 | 13 ± 3 | 11 ± 4 |
| EI | 2.8 ± 0.8 | 3.2 ± 0.8 | 3.2 ± 0.7 | 2.6 ± 0.9 | 3.2 ± 0.6 | 2.6 ± 0.9 |
| PS | 132.8 ± 19.9 | 143.6 ± 14.6 | 141.6 ± 17 | 130.2 ± 19.5 | 138.4 ± 14.6 | 133.8 ± 23.1 |
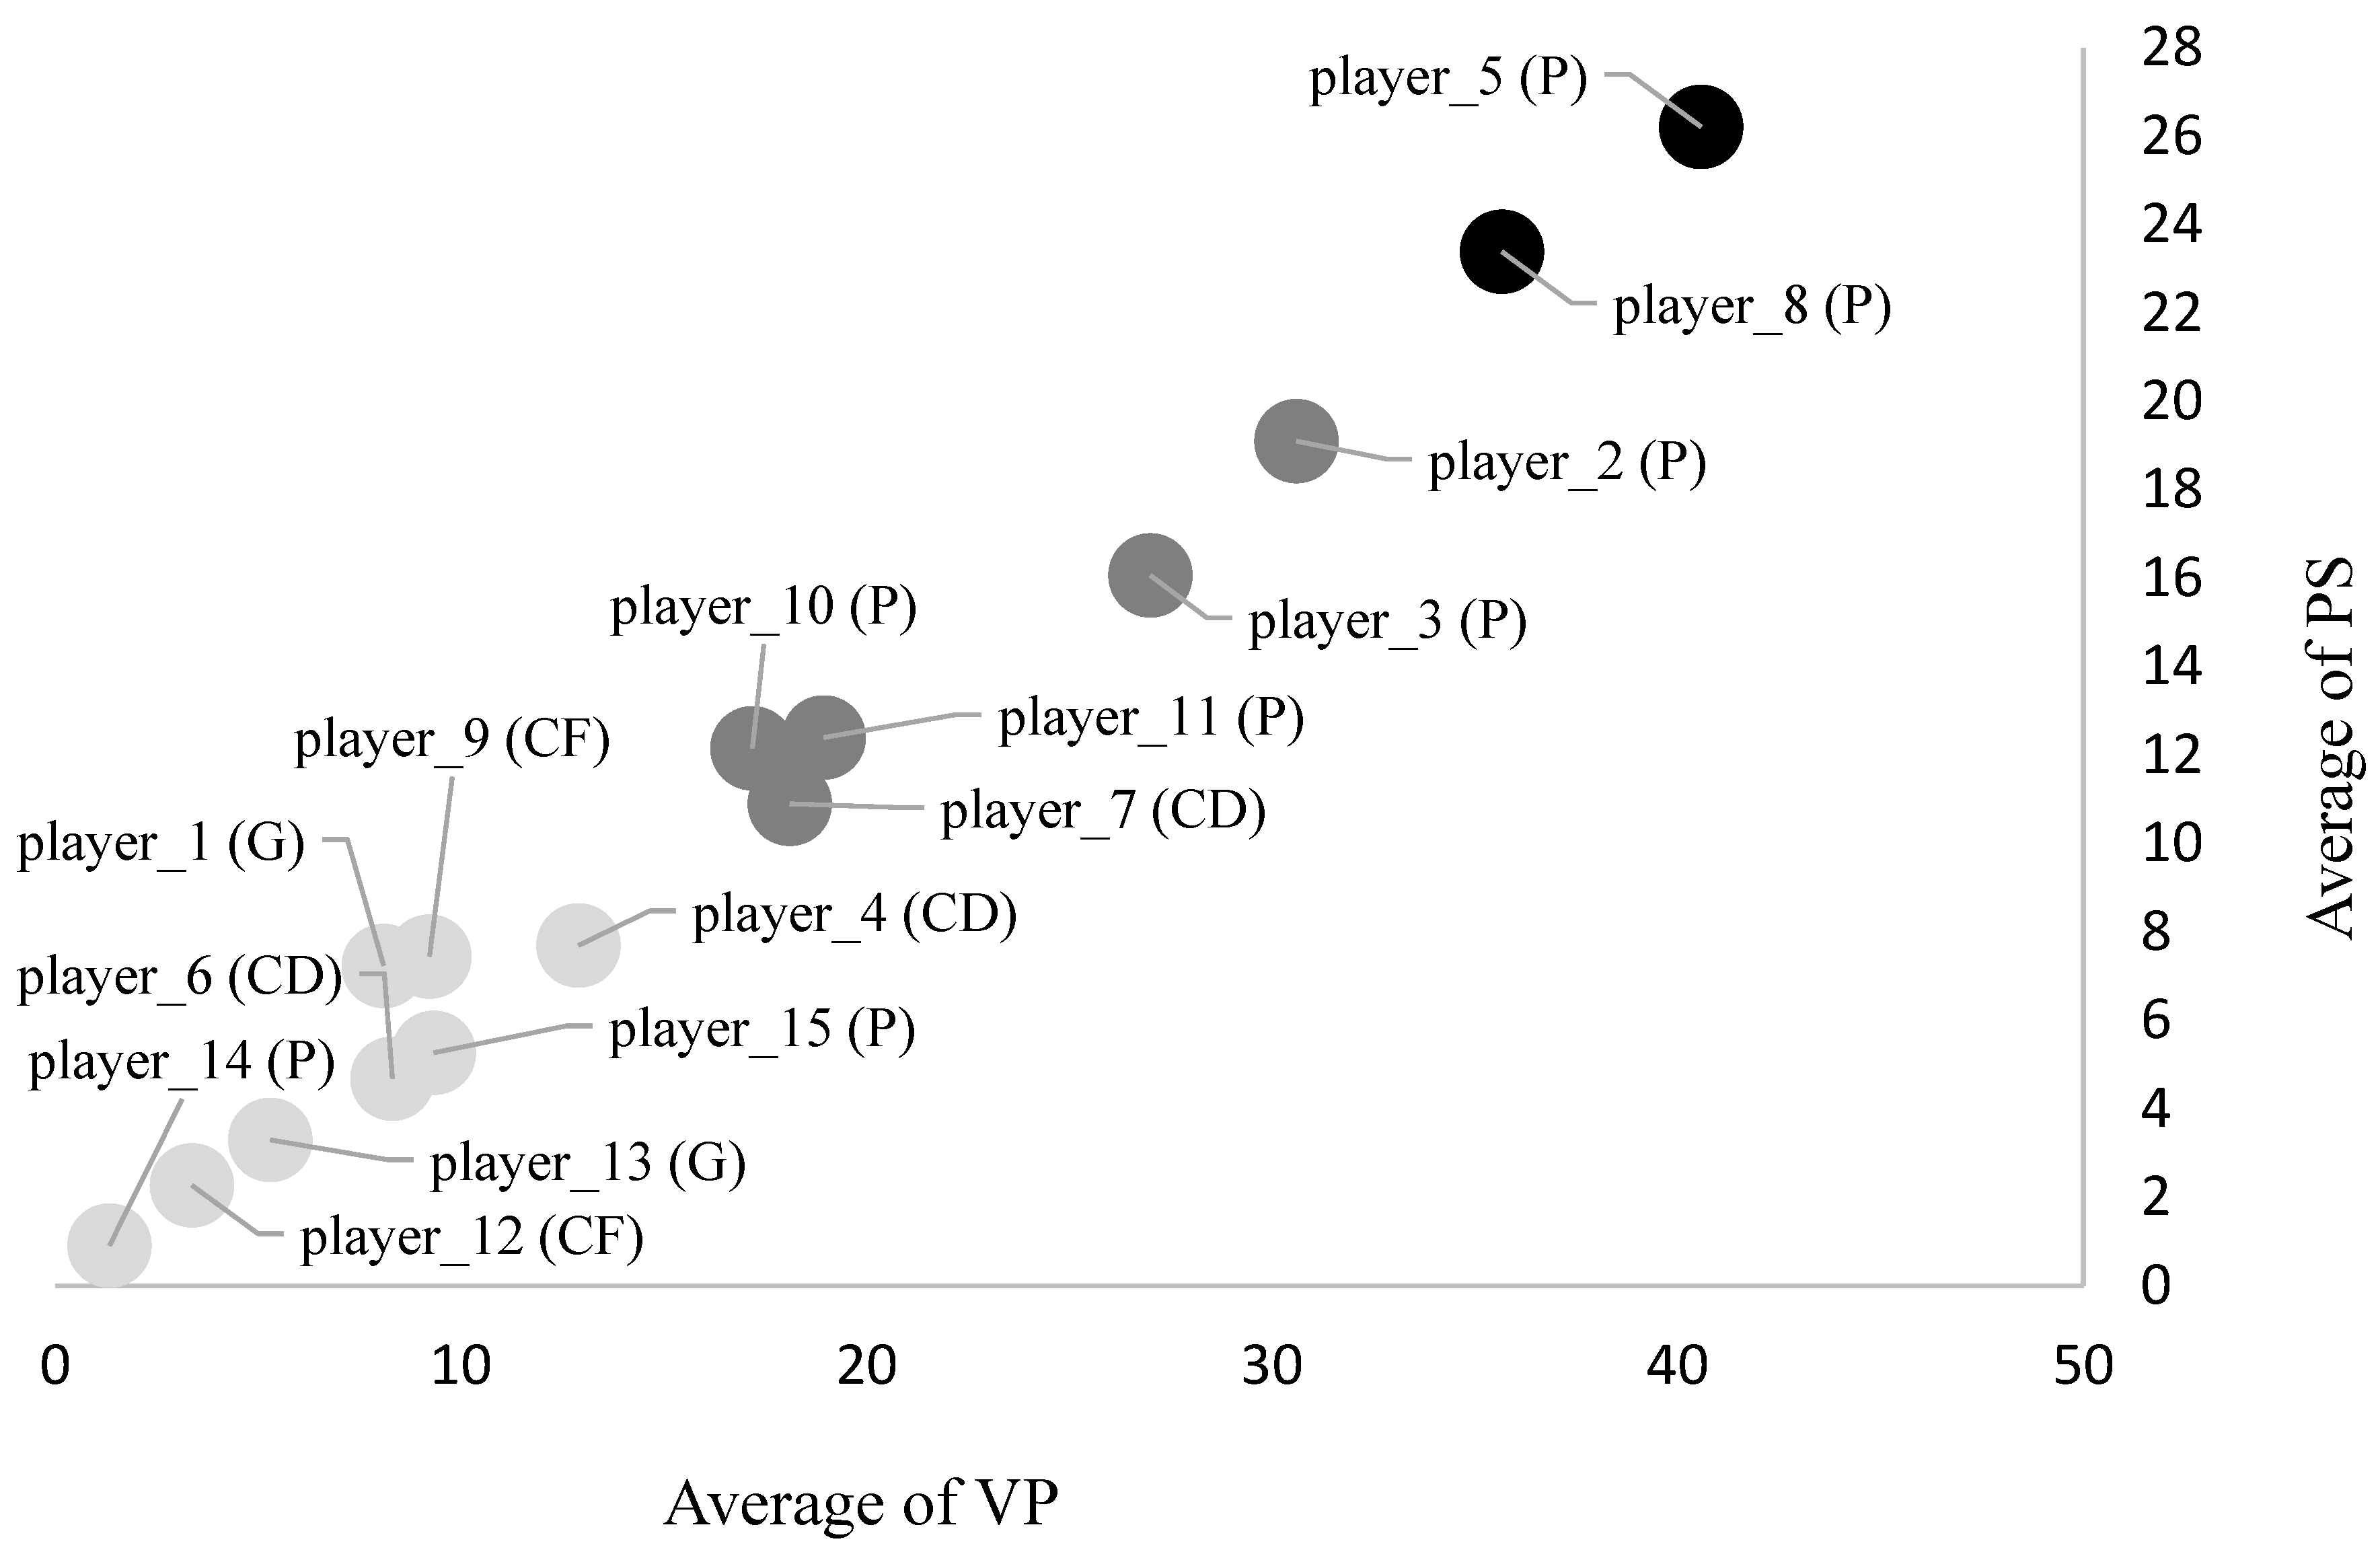
| Player | PP | N_Matches | Playing Time (Min) | TSAP Indexes | |||
|---|---|---|---|---|---|---|---|
| Total | Total | Average Per Match | VP | EI | PS | ||
| player_1 | G | 17 | 783 | 46.1 ± 10.1 | 8.1 ± 4.4 | 0.04 ± 0.09 | 7.2 ± 2.5 |
| player_2 | P | 18 | 645 | 35.8 ± 7.9 | 30.6 ± 9.8 | 0.39 ± 0.24 | 19.1 ± 6.6 |
| player_3 | P | 6 | 197 | 32.8 ± 8.2 | 27 ± 14.4 | 0.25 ± 0.24 | 16.1 ± 9.1 |
| player_4 | CD | 17 | 398 | 23.4 ± 8.5 | 12.9 ± 7.4 | 0.13 ± 0.15 | 7.7 ± 4.9 |
| player_5 | P | 19 | 788 | 41.5 ± 7.9 | 40.6 ± 12.2 | 0.59 ± 0.29 | 26.2 ± 8.1 |
| player_6 | CD | 19 | 299 | 15.7 ± 6.2 | 8.3 ± 5.5 | 0.05 ± 0.06 | 4.7 ± 2.9 |
| player_7 | CD | 19 | 561 | 29.6 ± 7.6 | 18.1 ± 8.2 | 0.19 ± 0.11 | 10.9 ± 4.6 |
| player_8 | P | 18 | 783 | 43.5 ± 6.9 | 35.7 ± 4.3 | 0.55 ± 0.27 | 23.4 ± 3.8 |
| player_9 | CF | 18 | 605 | 33.6 ± 5.9 | 9.2 ± 2.1 | 0.28 ± 0.15 | 7.4 ± 2.2 |
| player_10 | P | 16 | 578 | 36.1 ± 8.6 | 17.2 ± 8.6 | 0.36 ± 0.23 | 12.2 ± 6.1 |
| player_11 | P | 19 | 649 | 34.2 ± 8.2 | 18.9 ± 6.5 | 0.29 ± 0.14 | 12.4 ± 3.9 |
| player_12 | CF | 18 | 304 | 16.9 ± 8.4 | 3.4 ± 2.1 | 0.06 ± 0.09 | 2.3 ± 1.6 |
| player_13 | G | 9 | 224 | 24.9 ± 17.2 | 5.3 ± 5.4 | 0.02 ± 0.04 | 3.3 ± 3.1 |
| player_14 | P | 12 | 70 | 5.8 ± 4.7 | 1.3 ± 1.3 | 0.02 ± 0.04 | 0.9 ± 1 |
| player_15 | P | 3 | 73 | 24.3 ± 6.4 | 9.3 ± 1.15 | 0.06 ± 0.05 | 5.3 ± 0.6 |
Disclaimer/Publisher’s Note: The statements, opinions and data contained in all publications are solely those of the individual author(s) and contributor(s) and not of MDPI and/or the editor(s). MDPI and/or the editor(s) disclaim responsibility for any injury to people or property resulting from any ideas, methods, instructions or products referred to in the content. |
© 2023 by the authors. Licensee MDPI, Basel, Switzerland. This article is an open access article distributed under the terms and conditions of the Creative Commons Attribution (CC BY) license (https://creativecommons.org/licenses/by/4.0/).
Share and Cite
Perazzetti, A.; Dopsaj, M.; Mandorino, M.; Tessitore, A. Assessment of the Offensive Play in Elite Water Polo Using the Team Sport Assessment Procedure (TSAP) over an Entire Competitive Season. J. Funct. Morphol. Kinesiol. 2023, 8, 130. https://doi.org/10.3390/jfmk8030130
Perazzetti A, Dopsaj M, Mandorino M, Tessitore A. Assessment of the Offensive Play in Elite Water Polo Using the Team Sport Assessment Procedure (TSAP) over an Entire Competitive Season. Journal of Functional Morphology and Kinesiology. 2023; 8(3):130. https://doi.org/10.3390/jfmk8030130
Chicago/Turabian StylePerazzetti, Andrea, Milivoj Dopsaj, Mauro Mandorino, and Antonio Tessitore. 2023. "Assessment of the Offensive Play in Elite Water Polo Using the Team Sport Assessment Procedure (TSAP) over an Entire Competitive Season" Journal of Functional Morphology and Kinesiology 8, no. 3: 130. https://doi.org/10.3390/jfmk8030130