Article

Modelling of Climate Change’s Impact on Prunus armeniaca L.’s Flowering Time

1
Nikitsky Botanical Gardens-National Scientific Center of Russian Academy of Sciences, 298648 Yalta, Russia
2
Humanitarian Pedagogical Academy, V.I. Vernadsky Crimean Federal University, 295007 Simferopol, Russia
3
Faculty of Information Technology and Big Data Analysis, Financial University under the Government of the Russian Federation, 125167 Moscow, Russia
*
Author to whom correspondence should be addressed.
Inventions 2023, 8(3), 65; https://doi.org/10.3390/inventions8030065
Submission received: 30 March 2023 / Revised: 25 April 2023 / Accepted: 26 April 2023 / Published: 28 April 2023

Abstract

:
This study presents the results of the development of numerical models for predicting the timing of apricot flowering, including using experimental data on the emergence of plants from a state of deep dormancy. The best results of approximation of the process of accumulation of the necessary cooling in the autumn–winter period were obtained using the sigmoidal function. Models that take into account the combined effect of temperature and photoperiod on the processes of spring development showed a high accuracy of the process of accumulation of thermal units. Based on the results of testing, two models were selected with an accuracy of 3.0 days for the start of flowering and the absence of a systematic bias, which can be considered a good quality assessment These models describe well the interannual variability of apricot flowering dates and can be used to predict these dates. The discrepancy is no more than 2–4 days in 87–89% of cases. Estimates of the timing of flowering and the end of deep dormancy are very important for increasing the profitability of fruit production in the South of Russia without incurring additional costs, by minimizing the risks associated with irrational crop placement and the selection of varieties without taking into account the specifics of climate change. When constructing a system of protective measures and dates of treatments, it is also necessary to take into account the calendar dates of the shift in the development of plants.

1. Introduction

At present, crop yields remain highly dependent (50–80%) on adverse climatic, soil and terrain factors, especially in the context of climate change [1,2,3,4,5,6]. Additionally, if errors in the placement of annual crops have a negative impact on their short-term yield (one year of decline or loss of yield) for perennial crops, these negative effects can be prolonged and manifest over many years. Optimization of the land use in the south of Russia when implementing the results of work taking into account future climate changes will increase the profitability of fruit production without additional costs by taking these risks into account.
Due to the increasing warming rate, air temperatures in recent years have been significantly higher than mid-year values, which has led to a disruption in the differentiation of the flowering buds of fruit crops, and hence a decrease in yields [1,6,7,8]. Thus, in recent years, the frequency and intensity of this occurrence has increased, and intensive development of diseases and pests has reduced crop yield by up to 50–100% [1,4,9,10,11]. Despite available publications [12,13], the influence of climate change on the processes of ontogeny of fruit crops in the territory of the South of Russia in the 21st century has been poorly studied. Effective proactive measures and long-term action plans are now needed, based on scientific predictions of climate change. Early adaptation measures will increase the resilience of national economies to climate change, prevent unnecessary losses and manage the benefits of favorable climate change.
Apricot is one of the most common crops in the world. Its plantations occupy 560 thousand hectares in 68 countries of the world. The annual gross fruit harvest amounts to about 4.34 million tons. However, this amount does not meet current demand. Production is concentrated in Europe and Asia. Since 1991, the area of apricot plantations in the world has almost doubled from 320,279 to 559,376 ha. In Russia, cultivation is widespread in the south of the country, in areas such as Krasnodar and Stavropol Krai, Rostov Oblast, Crimea and the North Caucasus. There are apricot plantations in the Volgograd and Voronezh regions, as well as in the Khabarovsk and Primorsky regions in the Far East. The average annual gross yield is 50–55 thousand tons [6,14,15].
However, this culture has a very short period of winter rest, and the speed of its spring development of generative kidneys is the quickest among the skeletal fruit breeds. In some southern areas in which the fruit grows in January-February, heat waves are frequently observed, contributing to the plant’s emergence from a state of deep rest and the beginning of vegetation, resulting in its frost- and winter-resistance. Even with slight subsequent coldness, flowering buds and apricot flowers die in the winter–spring, which is often the main limiting factor in industrial cultivation [16,17,18,19]. In this regard, the dynamics of the development of the flower kidney Prunus armeniaca L. in the cold period of the year from the beginning of autumn to flowering has long been a subject of interest to biologists, physiologists and other professionals. The interest in this period of plant life is understandable, as during it, processes such as the formation of reproductive organs take place; this is the basis of the future harvest. At the same time, changes in the frost resistance of plants and the rate of their development can be determined.
According to the obtained data of previous studies (1985–2017) on the adaptation of apricot varieties to the conditions of cultivation on the southern shore of the Crimea, during the flowering of trees, there are significant temperature drops. Over 33 years of study, adverse climatic conditions for apricot flowering were observed for 12 years (or 36% of this time). In these years, the average air temperature during the flowering period did not exceed 8 °C. Minimum temperatures ranged from −1.5 to −5.2 °C, and the maximum temperatures from 11.5 to 19.2 °C, which led to worse conditions for fertilization, flower death, and as a result, a reduction of apricot plant yield by 1.5–2 times [20].
Among the environmental factors influencing the spring development of plants (swelling and spraying of buds, leaf unfolding, flowering) the main role belongs to temperature, both in the period of organic (endogenous) calm, and in the period of forced, exogenous factors. Many studies have confirmed this [2,6,21,22,23]. Photoperiodic monitoring and its interaction with temperature [24] also have a significant influence on the growing time of some genotypes, which may account for about 30% of plant species [25].
The rising temperatures of the winter months in the context of climate change may have a significant impact on the adaptability of apricots to local conditions in the areas of their production [16,19]. Thus, climate adaptation is an integral part of the planting of apricot gardens. Current climate change requires anticipation of possible risks and early action to prevent unnecessary losses and take advantage of the benefits of climate change.
The assessment of the impact of future climatic conditions on the rest and flowering phases of culture plays a significant role in addressing this issue. Phenological models are used mathematically to model the growth and development of cultivated plant species. Phenological models are an important tool for planning fruit crop cultivation and predicting the effects of climate change on their functioning [16,26,27,28]. Although there are many scientific papers devoted to the study of the dormant period of fruit crops and the influence of environmental conditions on it in the cold season, there are still no universal models that can accurately predict the exit from a resting state of a wide range of plant species [29,30].
The aim of the present work is to find and select the most effective model to predict the timing of apricot bloom and to assess the impact of climate warming on the spring development of culture in the conditions of the southern coast of the Crimea.

2. Materials and Methods

2.1. Phenological, Meteorological Data and Research Site of Prunus armeniaca L.

Prunus armeniaca L., which is one of the main stone fruits of Russia [14], was chosen as the object of the study. We selected 15 promising apricot cultivars, characterized by different flowering dates (early blooming, medium blooming and late blooming), and 3 trees of each cultivar for study. The fruit plot was founded in 1991. Own-rooted apricot seedlings were used as a rootstock. Phenological observations were made once every 2 days during the blossoming period of 28 years, from 1995 to 2022 (the observations were made by co-authors throughout the study period). Based on the data for 15 varieties, the average date of flowering for the crop, which was used in calculations in the construction of models, was calculated annually. Phenological observations were carried out using a single methodology [31] at a permanent site with permanent facilities, and the accumulated database respected the principle of a single difference: the changing climatic regime of the terrain. The date of the onset of the development phase was considered the day of its onset in at least 50% of plants.
The experimental plots are located in the northern part of the Black Sea region on the territory of the Southern Coast of the Crimea (UBK) in the area of the Nikitsky Botanical Garden (44°31′ S, 34°15′ W).
The climate of the southern coast of Crimea is of the subtropical Mediterranean type, with hot dry summers, the predominance of autumn–winter rainfall and mild wet winters with frequent thaws. The average annual air temperature is 12.6 °C. Throughout the year, the average monthly air temperature is above 0 °C, the coldest month is February and the warmest is August (Figure 1). Annual rainfall averages 592 mm. Due to the annual abundance of precipitation in the autumn–winter time, moisture on the UBK is considered optimal in this period. Based on this, a study was conducted on the influence of temperature and the photoperiod as evidently the most important factors on the plant in the cold period of the year. The influence of humidification was ruled out at this stage of the study, as in regions with high temperatures, temperature rather than precipitation is the determining factor of the spring phenology of woody plants [21].
This work uses data from meteorological observations of agrometeorological station Nikitsky Garden, located in the immediate vicinity of observation sites (less than 200 m). Meteorological data included time series of average daily air temperatures from 1994 to 2022. The duration of the photoperiod was calculated as a function of the breadth and day of the year [32].

2.2. Study of the Morphogenesis of Flowering Kidneys

Flower buds were sampled weekly during the winter, from November to February, during the study period. To determine the stage of pollen development, anthers were isolated from buds using a dissecting needle and were lightly crushed between a slide and a coverslip in Lugol* solution. *Potassium iodide (2 g) was dissolved by heating in 5 mL of distilled water, then 1 g of metallic iodine and distilled water (up to 300 mL) was added. The solution was stored in a dark glass vial. The obtained preparations were observed under a ZEISS Axio Scope.A1. (manufacturer: Zeiss), according to the methodical recommendations of Herrera [5]. The end of sporogenic tissue formation, that is, the beginning of meiosis, was taken as the beginning of culture vegetation and the plant’s emergence from deep dormancy. The end of deep dormancy was determined annually for each variety and recalculated for the culture as a whole, in a manner similar to the calculations of phenological observations.

2.3. Phenolic Model

To simulate the date of the start of apricot blooming, several different types of phenological models describing the regulation of the environment (temperature and photoperiod) of winter–spring kidney development in perennial species were chosen (Table 1).
In the simulations, the general assumption was that the kidney release date (t1) would occur when the accumulation of daily cooling rates (Rc) reached the critical sum of cooling units C* (Equation (1)):
S c t = t 0 t 1 R c ( T t ) C *
where  S c t  is the cooling state; t0 is the cooling state; t1 is the end date of deep dormancy (the beginning of forced dormancy and the forcing process); Tt is the average daily air temperature, °C; C* is the number of cooling units required for the plant to leave deep dormancy, DU (development units).
In the construction of the two-phase sequential models, it was assumed that the process of forcing (external exposure) at time t1 would not start until the daily number of cooling units reached C*. Single-phase external exposure models GDD, GDDdoy, VCdoy, SIGGdoy and SIGFOTOdoy (Table 1) assumed that at t1, the low temperature requirement was fulfilled or the plant did not need yarovization [33].
After t1 until the date of flowering (t2), the daily forcing rates (Rf) are accumulated until a critical value of F* is reached (Equation (2)):
S f t = t 1 t 2 R f ( T t )   F *
where  S f t  is the forcing state; t1 and t2 are the dates of temperature forcing and pheno-event onset, respectively; Tt is the average daily air temperature, °C; F* is the required sum of thermal units for pheno-event onset, °C or DU (depending on function type).
For simulation of the apricot release date from deep rest, the experimental data of the morphogenesis of flowering kidneys in the autumn–winter period of 12 years (from 2010 to 2022) were used. Two temperature functions (Table 1) describing the accumulation of cooling units during deep rest, which are most widely used in phenological research, have been tested: (model m1) [34] and triangular [35]. In the triangular function (model m2) for apricot culture, we determined the thresholds (minimum (Tmin), maximum (Tmax)) and optimal (Topt) average daily temperatures for the accumulation of cooling units. In the sigmoidal model m1, coefficients a, b, c are the empirical parameters of the function. The calculation of the accumulated refrigeration units started from the fixed date t0, i.e., from 1 November. The choice of the initial date for calculating the amount of accumulation of cooling units is because the steady transition of air through 10 °C downward in the autumn, which determines the limits of the active phase of vegetation of plants, is observed on the UBC in the first decade of November.
Models GDD and GDDdoy [33] describe the linear response of plants to temperatures above their baseline (Tb). The VCdoy [36] is a modified continuation of the GDD model, with an additional connection between the extended photoperiod and the increased temperature response defined by the expo expo constant (EXPO). In the other two models, SIGdoy [37] and SIGFOTOdoy [38], the response of phenological processes to temperature effects was described by a sigmoidal function, with the empirical parameters of the function bf and cf. The period of heat accumulation in the GDD model began from a fixed date (31 January), and in GDDdoy, SIGdoy and SIGFOTOdoy, from a parameterized day.
To determine the parameters of the phenological models, data for 20 years of observations (calibration) were used, and for verification (validation), the remaining 8 years’ data were used.
The best single-phase and sequential two-phase models selected from the comparative assessment were tested for their ability to adequately describe the variability of the response of individual apricot varieties to temperature in the winter–spring period, including the use of independent apricot blossom observations and the weather data of the agrometeorological station of Nikitsky Garden (Urozhayny, 1955–1957; Shalah 1961–1962, 1981–1982; Shalard, 1994–2005; Priusadebnyj, 2006–2010; Autok, 2006–2010; Salut, 2011–2013; Crimean Amur, 2014–2022).
The parameters of the phenological models were selected using an evolutionary optimization method, using the Microsoft Excel add-in “Finding a Solution” (SolveXL) [39]. The target optimization function is a minimum standard error (RMSE), minimizing the difference between the forecast and observation dates. The target optimization function is the minimum standard error (RMSE) between prediction and observation. The optimization procedure was repeated at least 30 times to ensure that the global optimum was achieved. The iteration of the optimization procedure was considered successful if the standard error (RMSE) of the newly selected model was less than the RMSE value of the previous version.

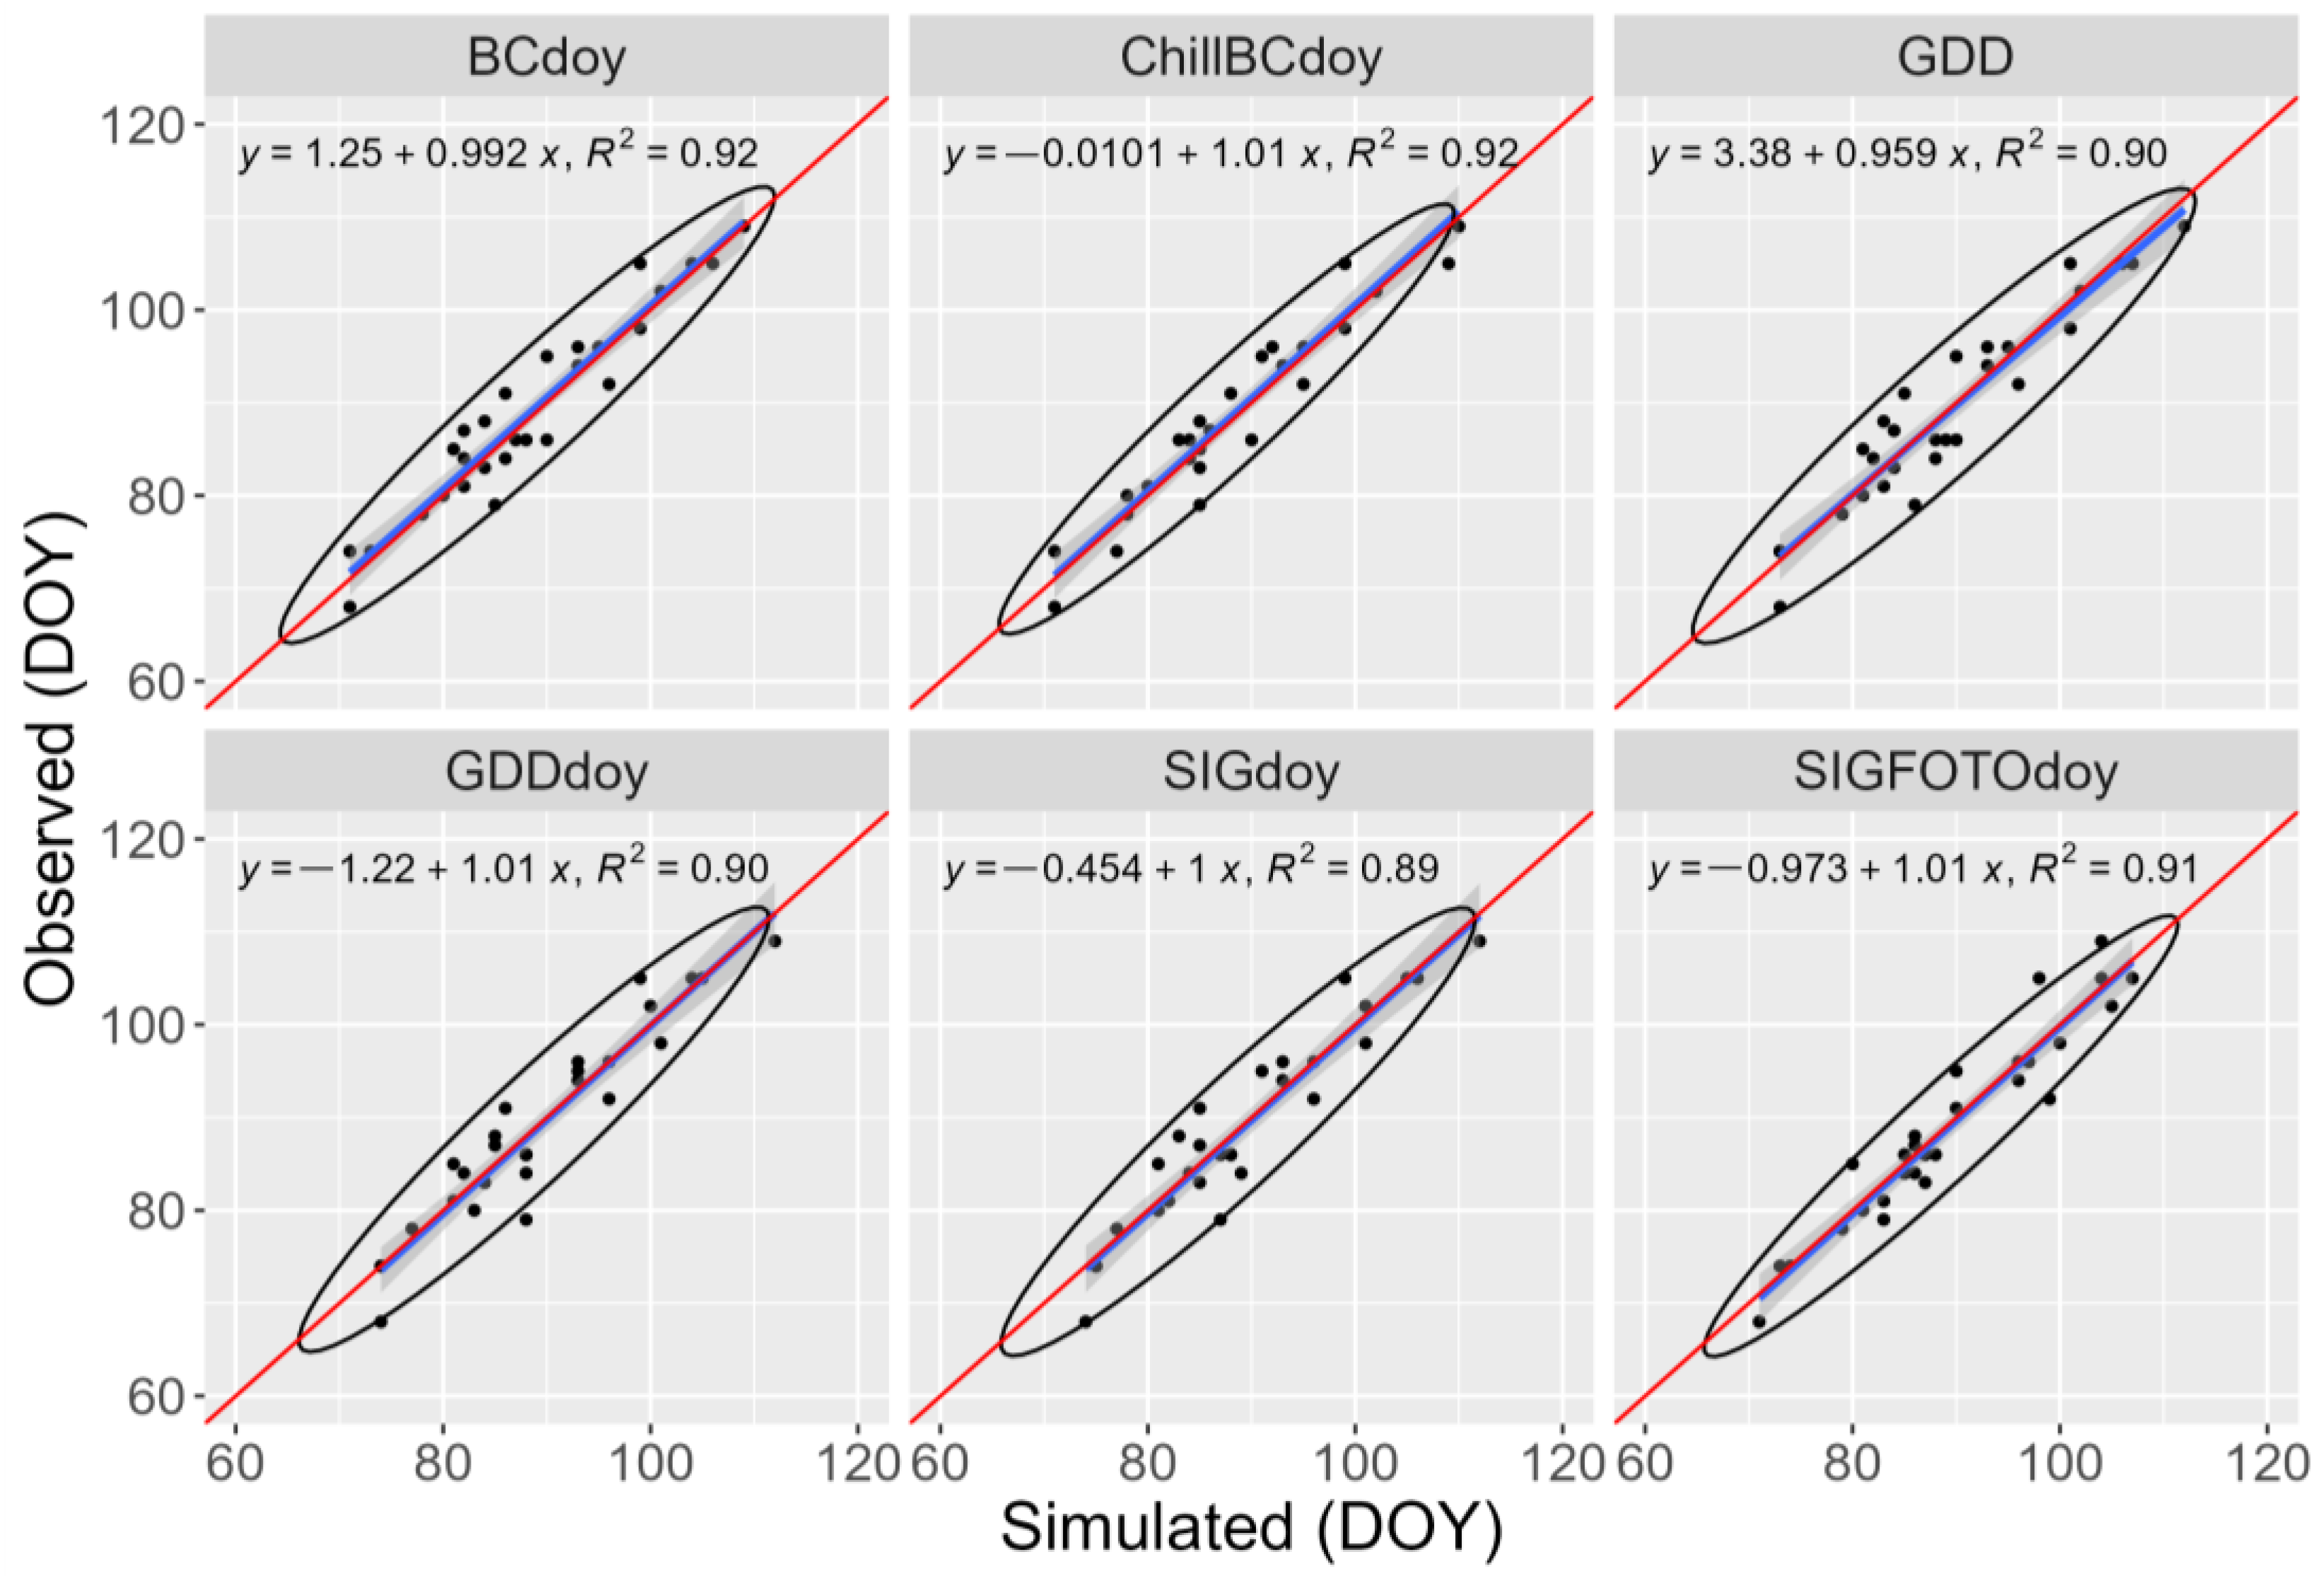
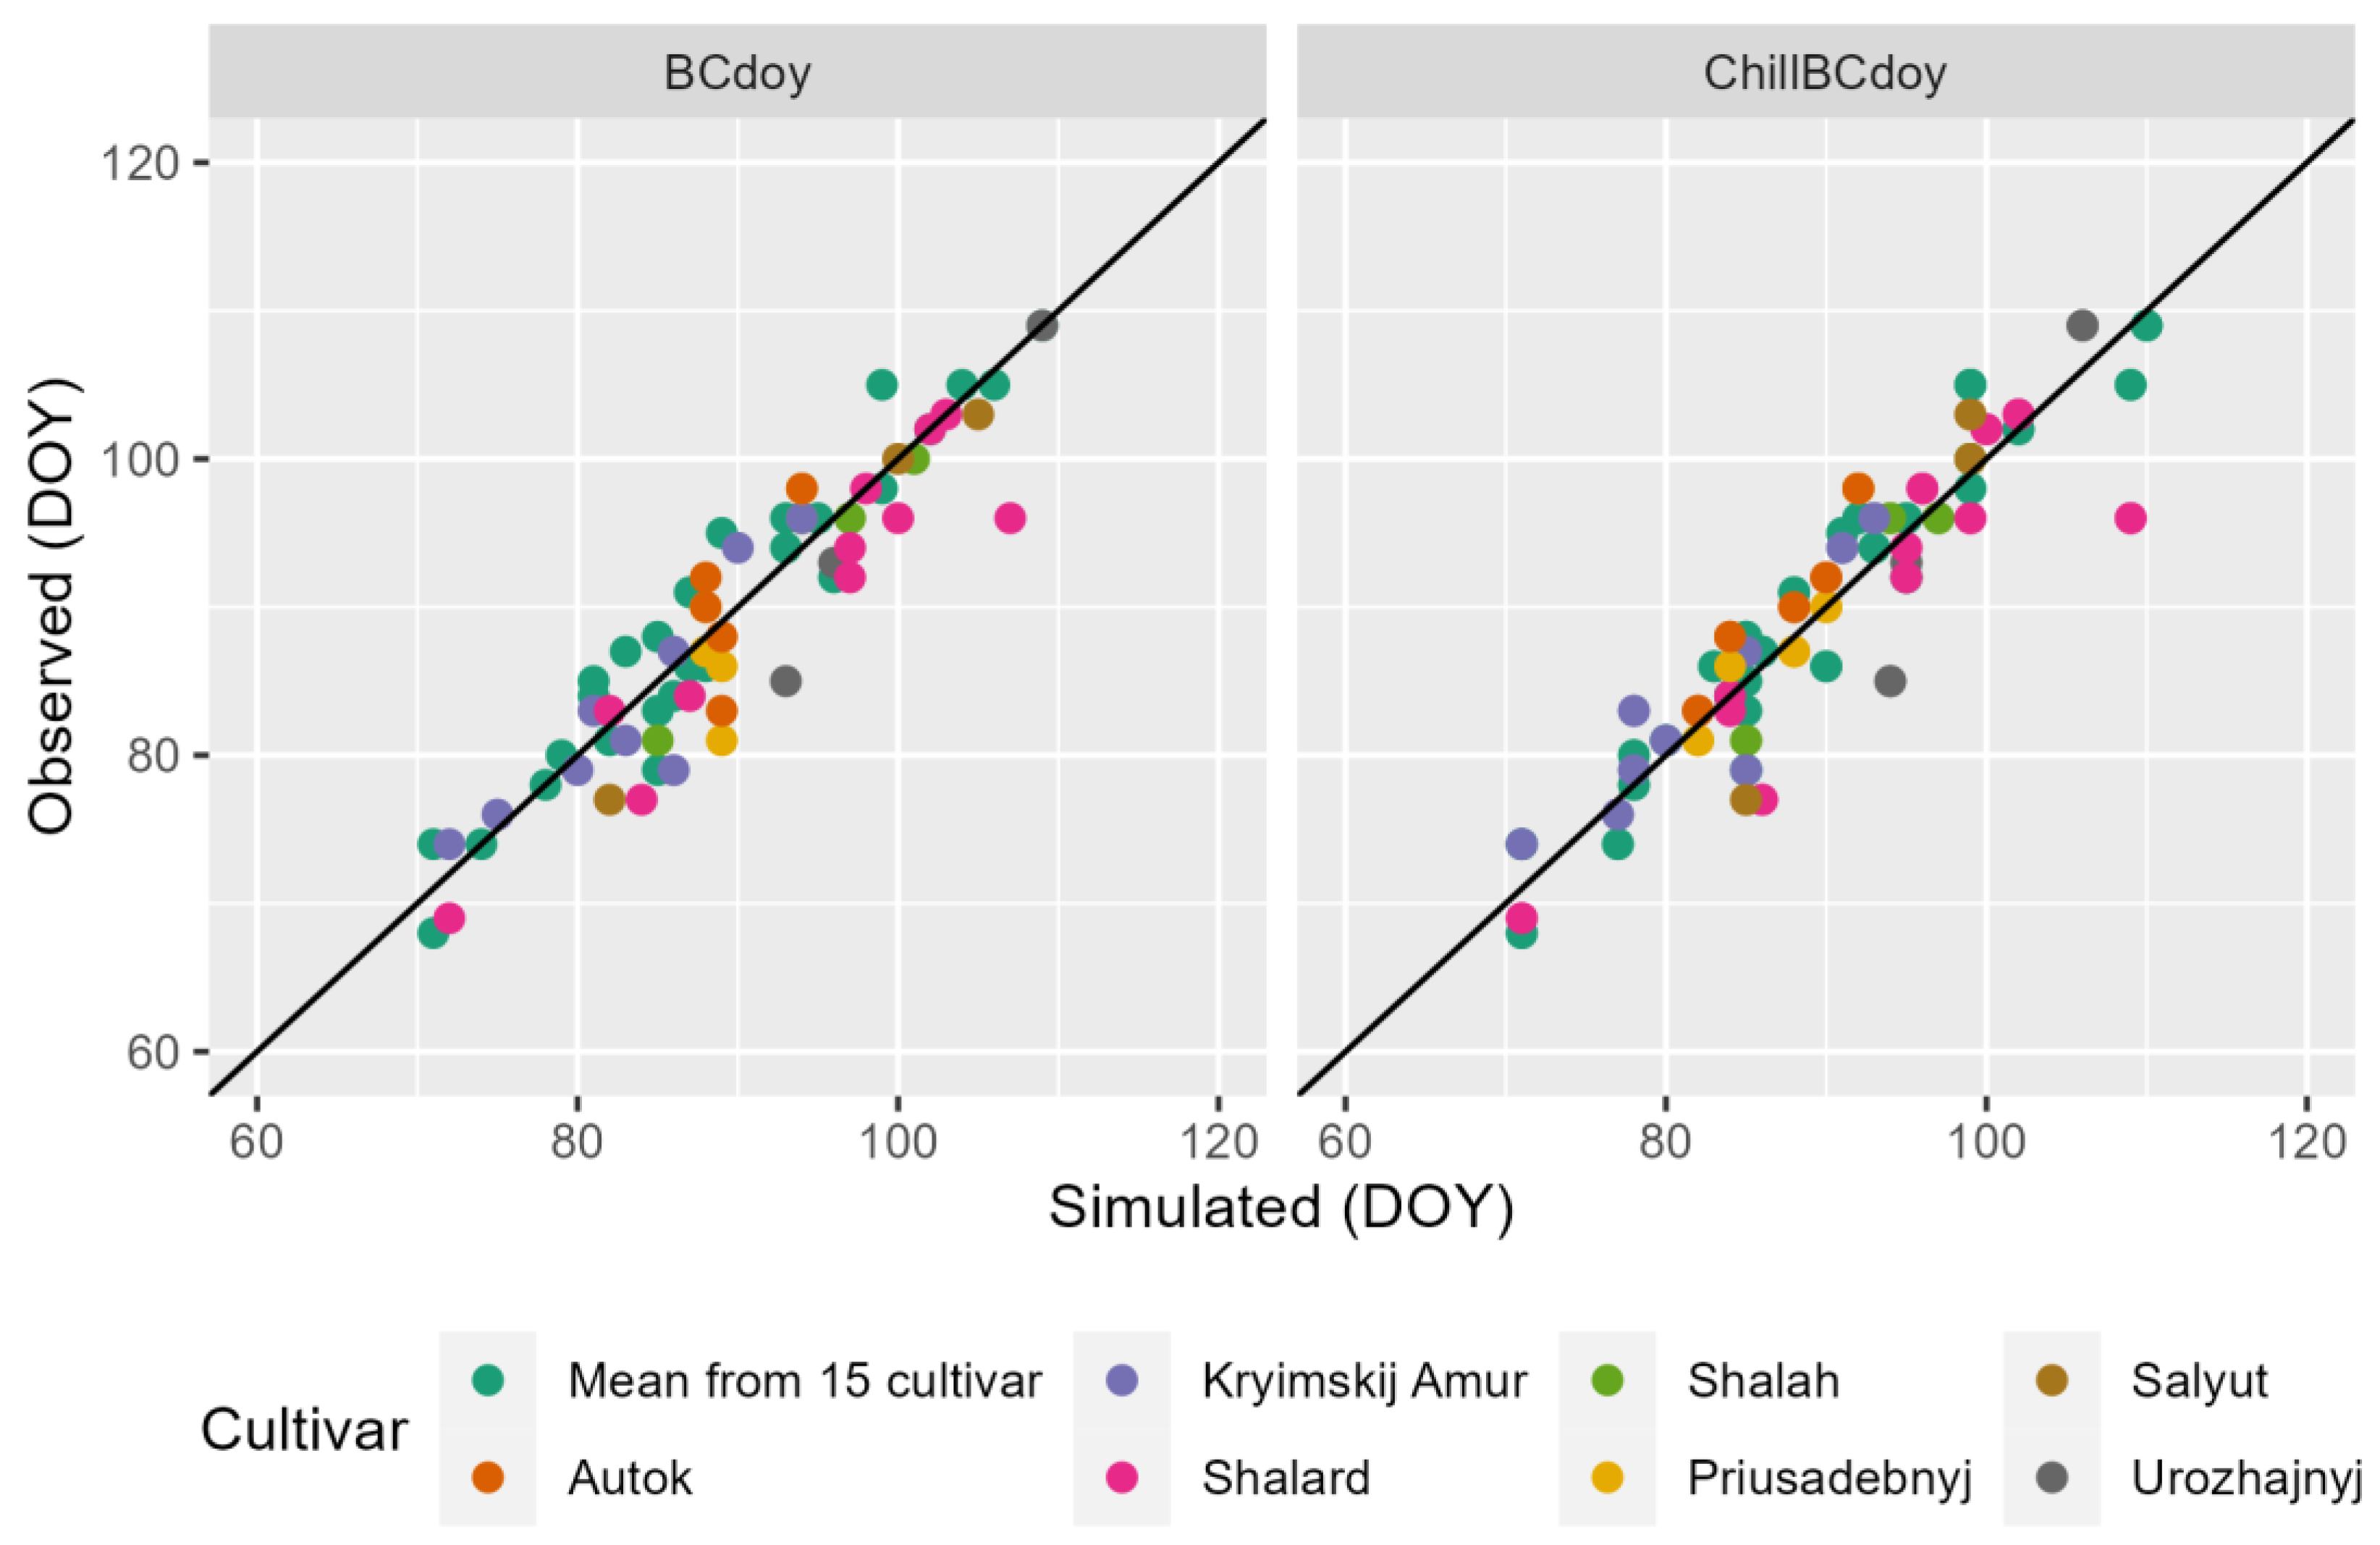
2.4. Model Evaluation

Comparative estimation of the approximation accuracy of the models was performed on the basis of four performance indicators: determination coefficient (R2), root of the standard error (root mean square error, RMSE, day), the corrected information criterion, Acaike (AICc), and offset (bias, θ, day).
R 2 = 1 i = 1 n ( o b s i p r e i ) 2 i = 1 n ( o b s i o b s i ¯ ) 2   ,
R M S E = i = 1 n ( o b s i p r e i ) 2 n   ,
A I C c = n · l n ( i = 1 n ( o b s i p r e i ) 2 n ) + 2 · k + ( 2 · k · ( k + 1 ) n k 1 )   ,
θ = i = 1 n ( o b s i p r e i ) n   ,
where  o b s i  is the observed,  o b s i ¯  is the observed mean,  p r e i  is the predicted phenophase date (in days of the year); n is the number of observation years; and k is the number of model parameters [39,40].

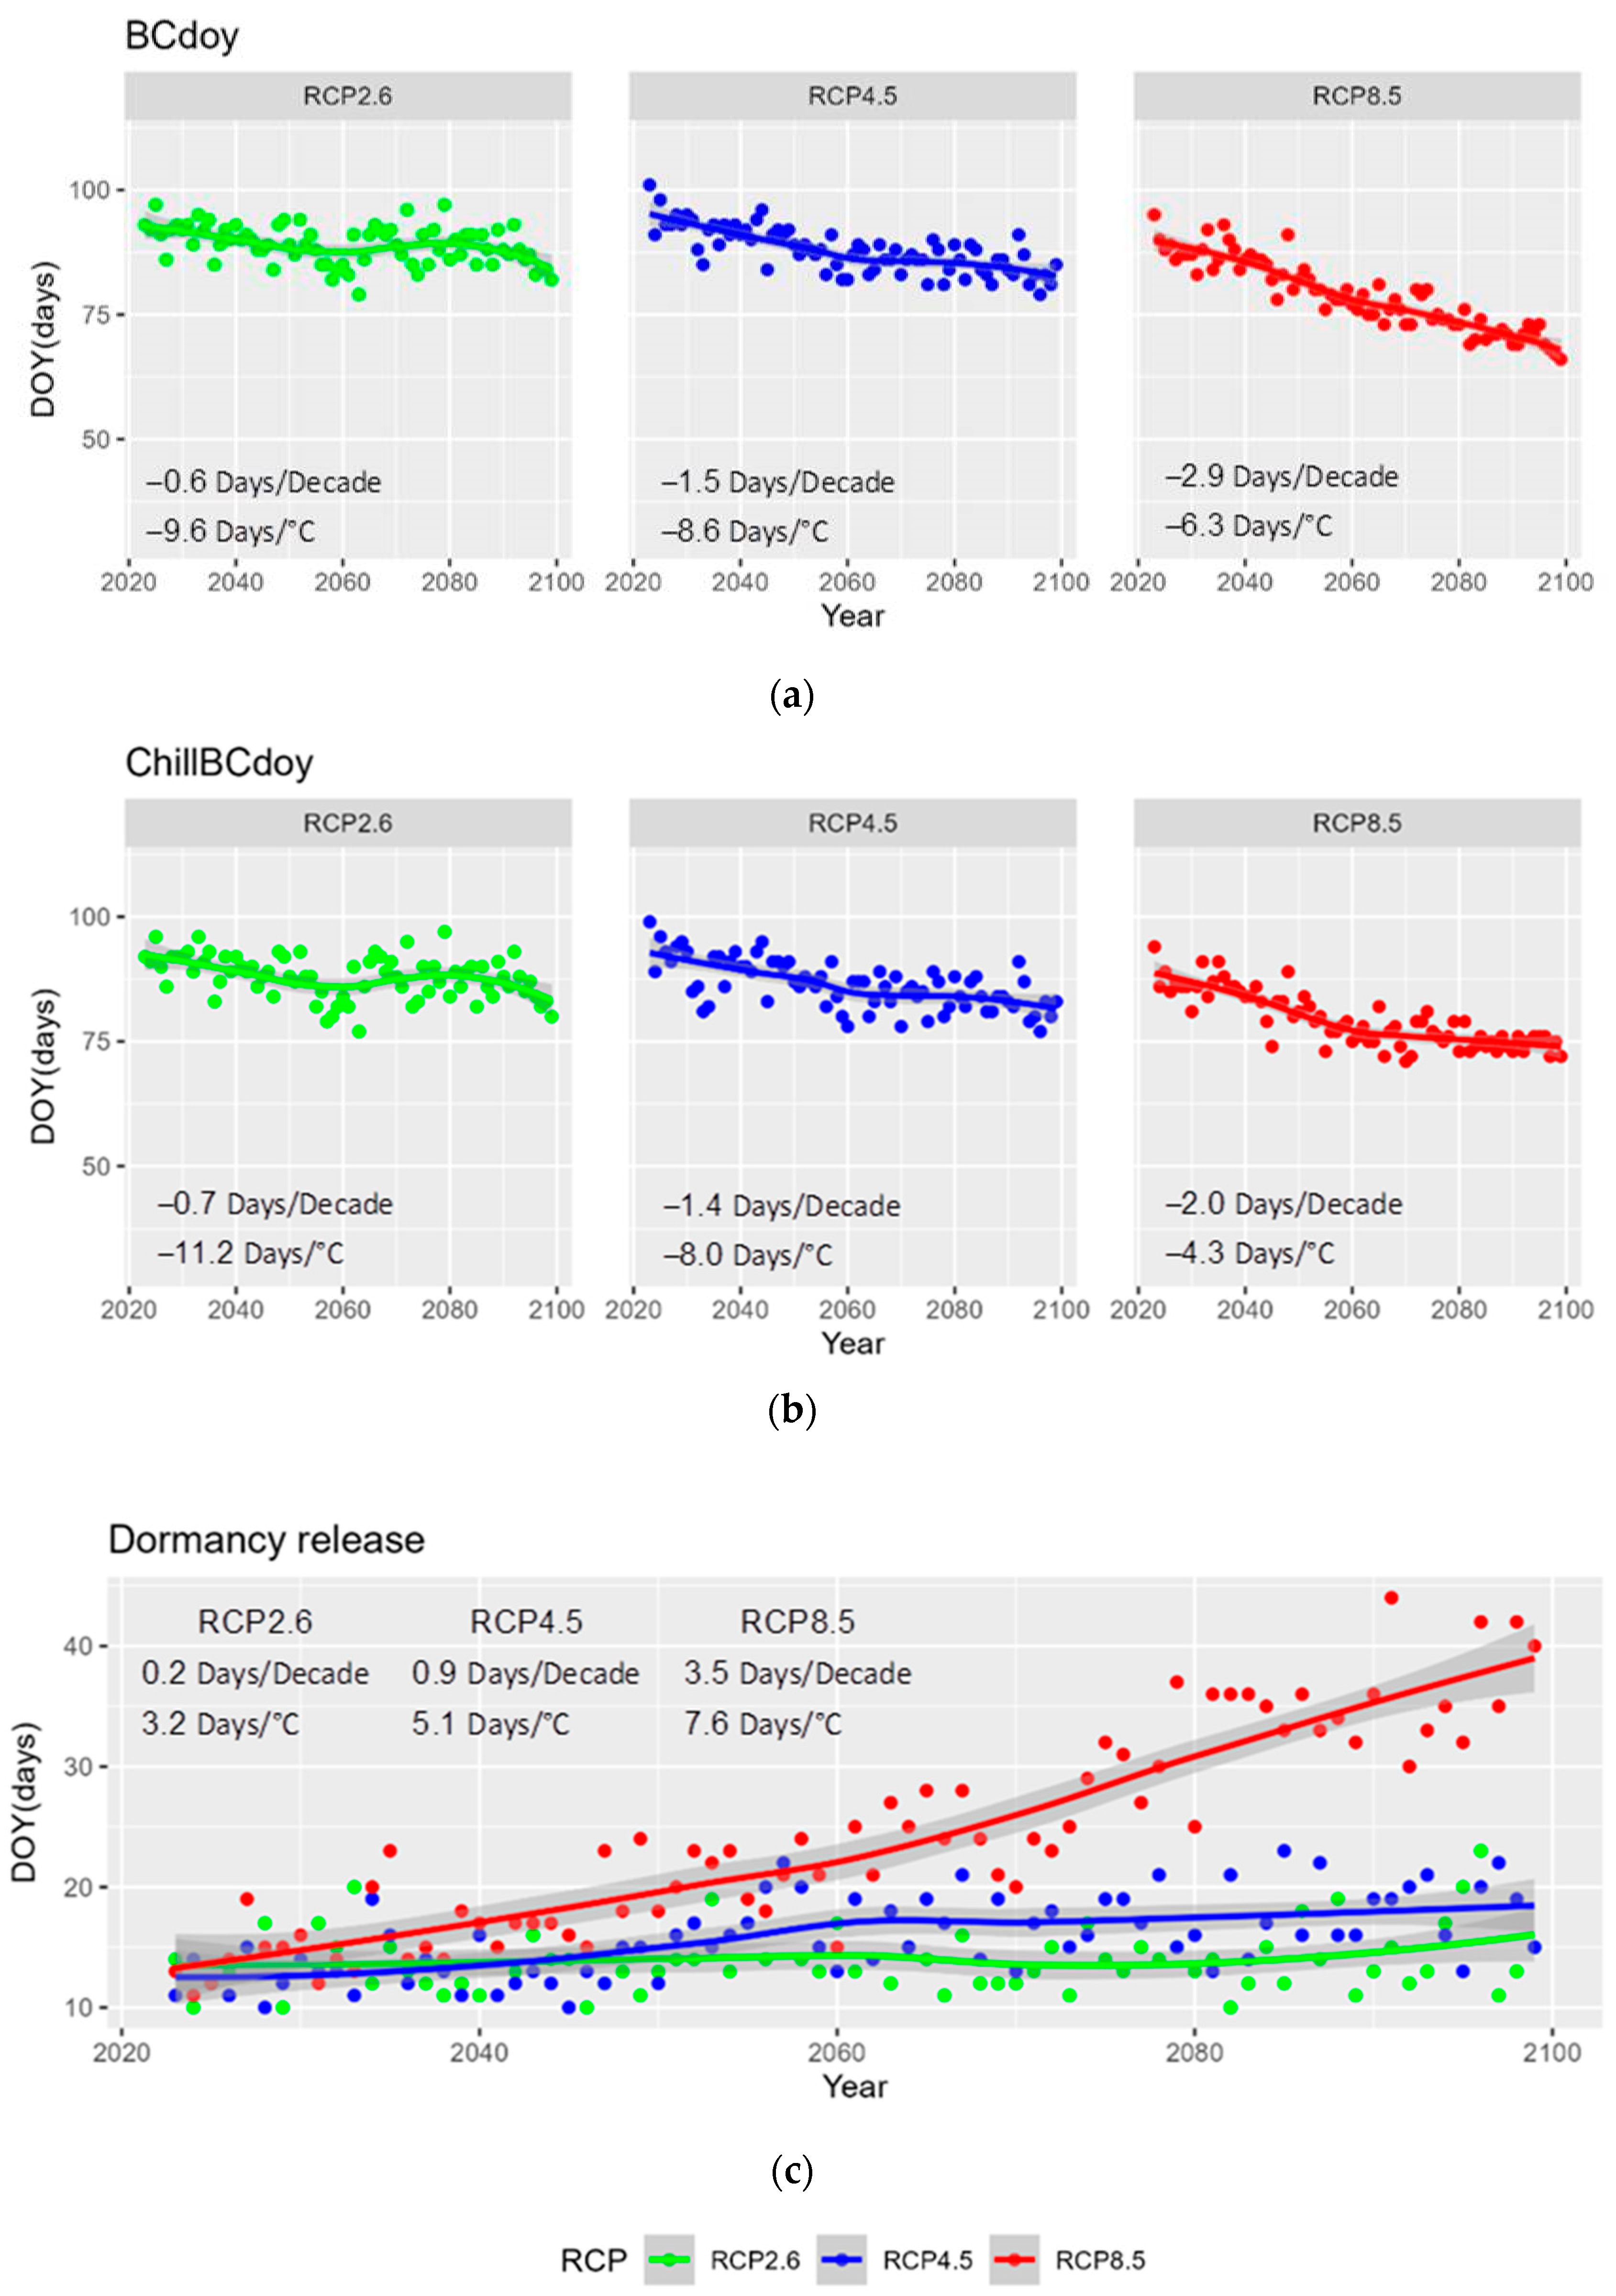
Assessment of Shifts in Spring Phenology Using Climate Scenarios

The impact of climate warming on the shifts of spring apricot phenology on the southern shore of the Crimea was estimated by predicting the timing of the end of deep rest and the beginning of flowering for 2023–2099. The input data for the simulation were the daily average air temperatures calculated for climate scenarios RCP2.6, RCP4.5 and RCP8.5 [41] by an ensemble of five climate models that produced trends in average annual and seasonal air temperatures for the Crimean territory [39]. According to these data, for the period 2023–2099 on the southern shore of the Crimea, depending on the scenario, warming of 0.5 °C (RCP2.6), 1.4 °C (RCP4.5) and 3.7 °C (RCP8.5) is expected.
According to climatic scenarios, projections of annual variations in the dates of the end of deep rest and the beginning of apricot blooming were constructed. The warming effect is quantified using linear regression.

2.5. Statistical Analysis

The selection of phenological model parameters and correlation and regression analyses of the relationship between the flowering times and temperatures of the spring months were carried out with the help of MS Excel 2010, which includes standard methods of mathematical statistics for analysis of rows of observations. The analysis and visualization of the simulation results were performed using the statistical software R version 4.2.2 (https://ww.r-project.org/) (accessed on 15 February 2023) [42].

3. Results and Discussion

According to a number of authors [5,43], the beginning of vegetation is taken the exit of the plant from a state of deep rest, which corresponds to the end of the formation of sporogenic tissue, or the beginning of meiosis. Some researchers consider the onset of vegetation to be from the phase of kidney swelling (flake movement). In our view, this is not entirely true, as this phase of development comes much later than the cooling period. Experimental studies have found that the phase of kidney swelling corresponds to the breakdown of the tetrad into single-celled pollen grains, which gives an error in the calculation of the onset of apricot vegetation (exit from deep rest) of 12–20 days. According to the results of Julian et al. [43] and Hillmann [44], after organic rest, the flower buds do not display external morphological changes.
A number of researchers have pointed to the need to take into account the temperature from the moment of stable change of the average daily temperature of 4.5–5 °C to the upward direction at which the active development of plants begins [1,45]. In our opinion, in the conditions of the unstable southern winter, this reporting point will also give an error when modeling the timing of the flowering of apricot culture, characterized by a very short period of winter rest and high rates of spring development of generative kidneys. During the winter–spring period, there are significant variations in air temperature in the UBK. Thus, in 2010, a steady transition through 5 °C was noted on 8 February, and the end of the formation of sporogenic tissue on 26 January; in 2012, a steady transition through 5 °C was recorded on 18 March, and the end of the formation of sporogenic tissue on 1 February. This discrepancy was confirmed by research conducted by a scientist of the Nikitsky Botanical Garden, S.I. Yelmanov, in the middle of the 20th century.
In view of the above, for the studied fruit culture, the beginning of vegetation we have accepted as its exit from the deep rest, which corresponds to the phase of organogenesis, that is, the end of the formation of sporogenic tissue and the beginning of meiosis. S. Herrera et al. [5] studied the influence of temperature on the winter–spring development of flowering apricot buds in their work. The influence of temperature on peach growing dates in warm, humid and temperate climates is noted in the work of Atagul O., Calle A., Demirel G., etc. According to the data received, the onset of vegetation varied depending on the conditions of the year from 2 January to 21 February [8]. A wide range of oscillations from 22 December to 9 March also characterized the date of the release of apricot varieties from deep dormancy at the local level in areas of the Mediterranean basin (Italy, France and Spain) [46].
Analysis of the data showed that for 2010–2022, the earliest start date for vegetation was in 2012 (8 January), and the latest date was 2022 (8 February). Since 2018, a later date for the start of crop growing has been noted (on average 2–4 days from the mid-year date).
In order to determine an effective model for predicting the resting date of apricot that is capable of adequately describing the variability in the culture’s response to temperature during the rest period, the temperature thresholds and sum of cooling units necessary for the passage of the archesporium phase in the development of pollen were identified.
In the conditions of the southern coast of Crimea, the beginning of kidney differentiation coincides with a gradual, steady decrease in air temperature. By the beginning of October or November, all the organs of the flower have been formed, and in the anthers, archesporus tissue (Figure 2a) begins to form. The development of male archaeporia occurs at low positive temperatures. The end of deep calm in plants coincided with the onset of reduction division in the pollen (meiosis) (Figure 2b). The varieties of apricot examined by us dsiplayed a reduction division in late January–early February. This is consistent with the literature, according to which meiosis in most European varieties takes place in the second and third decade of January, and in plants of the Central Asian group in late February to the first decade of March. Meiosis ended in the formation of a microspore tetrada (Figure 2c). Soon, the microspore formed its own shell and the tetrad decayed. The microspore was delayed at the single-cell stage for 8 to 17 days. After the tetrad decayed, the process of differentiating mitosis occurred in the generative kidneys, and it was observed for 5–12 days prior to the flower’s discovery. After mitosis, two nuclei were formed: vegetative and generative. Clear nuclei are particularly visible when processing preparations of acetocamine* (Figure 2d) (*45 mL of acetic acid and 2–4 g of carmine are added to a 55 mL distilled water flask. The flask is covered with a funnel, and for 20–30 min, the mixture is boiled on a slow fire. It is allowed to cool and then filtered into a jar with a frosted cork. To accelerate coloration, 1–2 drops of acetic iron are sometimes added to the solution). Within a few days, a thin layer of cytoplasm covered with a barely visible sheath separated the nuclei.
In our studies, microspores began to develop (after the breakup of the tetrad) from 2–3 February. Two-cell pollen grains were formed on 2–3 March. Starch was synthesized in pollen grains 3–11 days before apricot blossoming, which was detected by the darkening of the plasma color of the vegetative cell when interacting with iodine-containing dyes (Figure 2e).
Many works provide data on the influence of external conditions on the duration of the period of organic dormancy (the formation of archesporial tissue). A number of scientists, such as L.I. Sergeev, V.V. Petrov, Yu.L. Guzhev, A.P. Dragavtsev, G.V. Trusevich [1] and others, believe that the passage of organic dormancy is possible at temperatures from 0° to 10 °C. U. Chandler and M. Kimball, for apricot, peach and plum, identify a range from 0° to 9 °C, T.P. Petrovskaya from “a few degrees below zero” to 5 °C, O.A. Zabranskaya from 0° to 5 °C, D.S. Brown (for apricot and peach) from 4.4 to 7.2 °C, A.M. Sholokhov and V.I. Vazhov from 0° to 10 °C (optimum 2–6 °C), and V.K. Smykov from 3° to 10 °C. Bielenberg and Gasic consider the optimum temperature for peach to be in the range of −1.15 to 8.68 °C [47]. According to Richardson, temperatures in the range of 1.5–12.4 °C are optimal for cold accumulation [45]. The Weinberger model suggests that only temperatures below 7.2 °C (45 °F) are suitable [48]. Mesterházy I., Raffai P., Szalay L., Bozó L. and Ladányi M. believe that the optimal temperature of the cooling period should not be determined for the crop as a whole, but individually for each variety [19,49,50].
When determining the effect of temperature on the passage of the period of organic dormancy, extreme ranges of activity were identified. To solve this problem for each year from autumn 2009 to 2022, for the archesporium phase, consecutive summation of average daily temperatures in the ranges of 0–1 °C, 0–2 °C … 0–15 °C was carried out. It is known that in most varieties of apricot and other fruit crops, a temperature of 15–16 °C is the upper temperature threshold at which the flower bud stops its development [51].
With a prolonged increase in temperature during this period, the flower bud is weakened and may even die. This is explained by the fact that at low positive temperatures, during the formation of archesporial tissue, starch synthesis and accumulation occurs. Such a temperature not only stimulates the enzyme system responsible for starch synthesis, but also reduces plant respiration to a minimum. This reduces the consumption of carbohydrates and ensures their accumulation. At temperatures of 15–20 °C in the period November–December, a small accumulated supply of starch is spent on intensive respiration caused by increased temperature. Therefore, having used up carbohydrate reserves, the kidneys die from carbohydrate starvation. According to [52], the respiration rate of plum shoots during dormancy at temperatures up to 10 °C is 22–31 μL CO2 per 1 g of dry matter per hour, and at a temperature of 15–20 °C is 274–529 μL CO2 per 1 g of dry matter per hour. A delay in the development of buds of fruit crops and even their death, with insufficient cooling in winter, was noted in the work of F. Razavi, J. Hajilou, S. J. Tabatabaei, and M. R. Dadpour [16]; however, this work does not disclose the reasons leading to these results.
The sums of the active temperatures thus obtained were then calculated in different ranges from the average. The smallest deviation determined the optimal temperature range that the culture needs.
In calculating the sum of temperatures for the period of development of archesporium, the average daily temperatures were taken into account not from the moment of stable autumn transition through a certain upper limit, but from the first appearance in this phase. Average daily temperatures outside the optimal range were not taken into account as temperatures outside the optimal range became an inhibiting factor [16,51].
According to our calculations, during the period of autumn–winter bud development (in the archesporium phase), temperatures from 0° to 9 °C are active. In this range, the sums of temperatures are the most constant (for the studied period). Deviations from the average range from 0.7 to 11% depending on the year of the study. Combining average daily temperatures in the range from 0° to 9 °C by intervals and correlating their sums with the total number of days of the dormant period, it was found that the highest relationship in this period is observed with temperatures in the range of 3–9 °C. These data confirm that the temperature inside the flower bud must be 2–3 °C higher than the air temperature for its development. Therefore, according to our research, a temperature of 3 °C can be taken as the value of the lower temperature threshold for the development of apricot fruit buds under natural conditions during the period of deep dormancy. After the end of organic dormancy, plants acquire the ability to grow, but under the influence of negative or low positive temperatures, they can remain in a state of forced dormancy. The lengthening of the dormant period and changes in the timing of flowering at temperatures unfavorable for the development of the plant were noted by a number of scientists for peach cultivars [53], apricot [16,19,30] and other crops [4,54].
Using 12 years of experimental data on apricot kidney output from organic rest, the parameters of sigmoidal (m1) and triangular (m2) functions were optimized to describe the process of accumulation of necessary cooling in the autumn–winter period. The sigmoidal cooling unit accumulation function is a bell-shaped curve (Figure 3a), with which we found the global optimum parameter values of model m1: a = 0.1394, b = 1.5034, c = 11.2765, C* = 68.1.
The parameters of the m1 quality assessment are as follows: RMSE = 4.69 days. The AICc criterion = 47.08, R2 = 0.65, offset = −0.17 days. The results show that the cooling rate is close to one at an average temperature of 3 to 8.5 °C. This means that the highest rest state output rate is within this temperature range.
Three temperatures of the cooling period were optimized in the triangular function (model m2): the lower temperature threshold Tmin = 0.9 °C, the upper threshold Tmax = 9.7 °C, and the optimum temperature Topt = 8.9 °C (Figure 3a), C* = 36.6. According to the m2 model, the highest cooling rate is observed in the temperature range from 7.6 to 9 °C. The model m2 approximation accuracy indicators are as follows: RMSE = 7.53 days, AICc criterion = 49.77, R2 = 0.49, bias = 0.42 days.
The evaluation of the modeling results showed that according to all quality criteria, the sigmoidal model m1 provides a more accurate forecast of the dates of the end of the organic dormancy of the apricot than the triangular model m2.
A comparison of predicted and actual end dates of organic rest based on linear regression analysis revealed the presence of a significant bias when using the model m2 (Figure 3b). The tangent of the inclination angle of the linear regression model m2 is less than one (0.551), and the shear is 12.3 days. This fact indicates that when calculated with the model m2, the end of the deep rest at the early beginning of spring plant development will be predicted with lag, and at a late stage will be ahead of the real date of the phenophase. This may contribute to increasing uncertainty in the long-term assessment of the impacts of possible climate change.
Based on the model quality assessment results, a model m1 describing sigmoidal temperature-dependent phenological dynamics was chosen to predict apricot kidney release date. This model was included in further development as part of the two-phase ChillBCdoy serial model.
Analysis of the data from the long-term phenological monitoring of apricot bloom on the UBC showed that the earliest cultural flowering since 1995 was observed in 2009 (9 March) and 2016, 2020 (14 March), and the latest, from 15–19 April, was observed in 1997, 2003, and 2011. The sum of air temperatures above 0 °C, from 31 January to the onset of the bloom phase, ranged from 253.9 °C to 365.2 °C.
Correlation and regression analysis revealed a close inverse relationship ( r = 0.94 ;   p < 0.0001 ) between the onset of the phenophase “onset of flowering” and the air temperatures in February-March (Figure 4). A negative correlation between winter–spring temperatures and flowering dates was also observed for peach cultivars (including ten in Korea and five in North America [55]), almond [4,56,57,58], cherry [59], apricot [60], and olive [61]. The presence of a close relationship indicates the significance of the influence of higher air temperatures in February-March on the acceleration of development and earlier flowering of trees. The results of the analysis showed that under the conditions of the South Coast, when air temperature increases by 1 °C in February–March, apricot flowering starts 6–7 days earlier. Thus, the average temperature for these months in 2002, 2016 and 2020 was found to be 7 °C and higher, resulting in the early flowering of apricot trees on 9 and 14 March. Temperatures around 3 °C and below shift flowering to the second week of April (Figure 4).
The influence of spring air temperature on the acceleration or deceleration of plant vegetation has been confirmed by numerous studies [8,30,39,53]. According to foreign scientists, a decrease of 0.5 °C relative to the mean annual temperature causes a delay of 2 to 4 days at the beginning of full flowering.
According to the results of our studies, the average date of the beginning of vegetation of apricot trees (end of deep dormancy) corresponds to 27 January (±7 days), and the beginning of flowering to the 29 March (±10 days).
To select the most effective prognostic model providing an adequate forecast of the apricot flowering start date on the South Coast, the parameters of both single-phase and two-phase models of heat units’ accumulation, additionally taking into account the accumulation of cooling units necessary for completion of the dormancy period, were optimized based on the data of long-term observations (Table 2).
The efficiency curves of thermal units calculated from phenological models (Table 2) are shown in Figure 5.
An analysis of the temperature response curves showed the identity of the rates of accumulation of thermal units in calculations using the GDD and GDDdoy models. Despite the differences in the types of functions, the results obtained, both in describing the linear response and the sigmoidal response of phenological processes to the effect of temperature, indicate an increase in the efficiency of thermal units under the combined effect of temperature and photoperiod on the plant (Figure 5).
Evaluation of the quality of models based on four basic criteria showed that all models satisfactorily describe the development of apricot flower buds. The values of the systematic bias do not exceed 0.9 days, and the value of the coefficient of determination is in the range of 0.78–0.92 (Table 2). Among the models we tested, interannual variability in apricot flowering onset dates is best described by models that take into account the combined effects of temperature and photoperiod on bud development (BCdoy, SIGFOTOdoy, and ChillBCdoy). The simple thermal models of GDD and GDDdoy show similar performance (R2 = 0.91, RMSE = 3.2, AICc = 48.47–48.78). For most quality indicators, the BCdoy and ChillBCdoy models give the most accurate forecast of flowering dates (RMSE = 3.0, R2 = 0.92), and the BCdoy model is the most effective (AICc = 46.61).
To assess the adequacy of the models, an analysis of the residuals was carried out for the normality of the distribution and the constancy of the variance (i.e., the absence of heteroscedasticity). The residuals were checked for normality using the Shapiro–Wilk W-test. The Breusch–Pagan test was used to test the heteroscedasticity of the residuals of the models (Table 3).
Based on the results of the testing, it can be concluded that the analyzed samples of model residuals obey the normal distribution law (p > 0.05). The results obtained also indicate the absence of heteroscedasticity in the residues (homoscedasticity is observed). A significant p-value allows us to accept the null hypothesis about the constancy of the variance.
In order to identify a possible shift in the predicted flowering dates according to phenological models towards a systematic lead or lag, an assessment of the degree of linear correspondence between the predicted and measured values was made using the regression analysis method (Figure 6). Theoretically, the predicted value (y) and the measured value (x) should have a 1:1 linear relationship.
Graphical analysis of the models showed that the slope of the linear regression of all models is close to unity, and the shift parameters are close to zero and do not exceed 3.38 (GDD model). At the same time, the BCdoy and ChillBCdoy models showed the best fit.
Model calculations confirmed the earliest and latest recorded dates of crop flowering (2002, 2016, 2020 and 1997, 2003, 2011–2012, respectively). The dates of flowering are quite accurately modeled for apricot plants; the discrepancy is no more than 2–4 days in 87–89% of cases. In 2010, 2011 and 2021, the beginning of flowering was noted 5–6 days later than predicted by the BCdoy model (according to the ChillBCdoy model, in 2011 and 2012), and in 2015 was observed 6 days earlier than the date predicted by both models. Similar results were obtained by a group of scientists when modeling the flowering time of three apricot varieties in Hungary from 1994 to 2020. The discrepancy at the beginning of flowering was less than 2.5 days [19]. The result of model testing showed that they accurately describe the interannual variability in the flowering dates of the studied fruit crops and can be used to predict these dates.
The selected models were subjected to additional verification using data from independent observations of apricot flowering for individual varieties in different time periods, including earlier observations that were not used in the models’ development (Figure 7).
The results of the verification allow us to conclude that both the single-phase BCdoy model and the sequential two-phase ChillBCdoy model can be used to predict the flowering of individual apricot varieties of different ripening periods in the conditions of the Southern Coast of Crimea, as well as to calculate projections of phenodates for the beginning of vegetation and flowering under expected climatic changes.
According to previous studies, on the southern coast of Crimea, the trend of increasing average daily air temperatures in the winter–spring period will continue (depending on the climatic scenario, RCP from 0.9 to 4.4 °C), which should lead to a shift in the timing of flowering of apricot plants to earlier dates [39].
Increasing trends in the sums of active and effective temperatures during the growing season are currently being observed throughout Europe [62,63]. According to a climate change analysis in the Republic of Serbia, the average annual temperature has increased by about 0.6 °C per decade since the 1980s [56], and will continue to do so, leading to an earlier end to the dormant period and, accordingly, flowering [1]. According to Cherif et al. [64], mean annual temperatures in the Mediterranean basin are already 1.5 °C above pre-industrial levels.
Calculations of the timing of the beginning of apricot flowering in 2023–2100 in all modeling scenarios that take into account the consequences of climate warming showed similarity in the results obtained by the two models up to 2050 (differences did not exceed 0–1 days), as well as until 2100, according to the RCP2.6 and RCP4.5 scenarios (differences did not exceed 0–2 days). Significant differences in the models’ forecasts of phenological development in the second half of the 21st century, both in speed regimes and in the trend of the flowering date shifting, when using the BCdoy and ChillBCdoy models, appeared in the case of the implementation of the RCP8.5 scenario, which assumes an increase in average annual temperatures by 3.7 °C by 2100 (Figure 8a,b). According to calculations by the ChillBCdoy model, covering periods of organic and forced dormancy, the significant increase in temperature expected during the implementation of RCP8.5 in the winter months may cause a shift in the end of the deep dormancy period to a later date, due to a lack of cooling units (Figure 8c). It can be assumed that at later dates of the end of organic dormancy, the influence of the extended photoperiod on the acceleration of the processes of spring development of plants increases significantly. Recent studies have identified the photoperiod as a critical factor in regulating spring phenology, delaying early leaf development and accelerating late leaf development caused by temperature fluctuations [65].
The rate of shift to earlier flowering dates varied within 0.6–0.7 days per decade for RCP2.6, 1.4–1.5 days per decade for RCP4.5, and from 2.0 to 2.9 days per decade for RCP8.5. The predicted earlier flowering for a 1 °C warmer climate ranged from 9.6–11.2 days for RCP2.6, 8.0–8.6 days for RCP4.5, and 4.3–6.3 days for RCP8.5.
For scenarios RCP2.6 and RCP4.5, an insignificant delay (by 0.2–0.9 days per decade) was predicted for the end of the period of deep dormancy. However, with the implementation of RCP8.5, which implies a significant increase in temperature, the rate of delay in the beginning of vegetation increased by almost four times, and reached 3.5 days per decade. With a warming of 1 °C, a later exit of the flower buds from a state of deep dormancy is expected; for the RCP2.6 scenario, this was by 3.2 days, for RCP4.5, by 5.1 days and for RCP8.5, by 7.6 days.
Such a reaction to climate warming can be explained by the ecophysiological features of the processes of organic dormancy in apricots. Despite a very short period of deep dormancy, the process of accumulation of the required amount of cooling, as shown by our studies, occurs actively only in a small temperature range from 3 to 9 °C. As the temperature rises above 11 °C, dormancy proceeds slowly, and completely stops at temperatures of 15 °C and above [51]. Thus, the simulation results show that in the RCP8.5 scenario, in the South Coast, in the future, an increasing part of autumn and winter will be too warm to promote the active passage of the organic dormancy of apricot flower buds, thereby delaying their emergence from deep dormancy. Similar modeling results for the RCP 4.5 scenario were obtained by Benmoussa et al. [66]. According to the data of Rodriguez et al. [67], by 2055, a decrease in the accumulation of cold units by 18–26% is predicted, which may lead to changes in the timing of plant vegetation. A later exit from deep dormancy may be considered a positive consequence of climate warming that reduces the risk of crop damage due to a decrease in frost and winter hardiness.
According to the trends observed, for the scenarios RCP2.6 and RCP4.5 in the middle of the 21st century, the culture will bloom, on average, 4–5 days earlier (23–25 March), and by the end of the century, 7–9 days earlier (18–21 March). Based on the analysis of two climate scenarios, it can be seen that the expected temperature changes will not have a strong impact on the average dates of flowering in the apricot crop. Consistent results of forecasts for both models show that until the middle of the 21st century, if the first two climate scenarios are implemented, the increase in autumn–winter temperatures will not exceed the critical threshold for deep dormancy. However, in some years, the flowering shift from the long-term average data may reach up to 18–22 days.
The average annual small deviations in the timing of apricot flowering with the expected increase in temperatures on the South Coast according to the RCP2.6 and RCP4.5 scenarios, by 0.5 °C and 1.4 °C, respectively [39] can be explained by a very short dormant period. With an increase in average daily temperatures in the autumn–winter period, according to these scenarios, the end of the period of formation of archesporial tissue in flower buds falls in the second week of January, and the culture acquires the ability to grow. Therefore, an increase in air temperature does not lead to a significant shift in the timing of flowering.
When analyzing the RCP8.5 climate scenario, in the middle of the 21st century, a shift in the timing of apricot flowering by 7 days (21 March) was noted, and by the end of the century, this shift was by 14 days (14 March) (according to the ChillBCdoy model, which takes into account the passage of a period of deep dormancy); a 20-day shift (8 March) was observed according to the simple BCdoy model. Obviously, this is due to the fact that according to the RCP8.5 climate scenario, due to a significant increase in temperature in the autumn months, the plant will enter dormancy not in late October–early November, but in the first or second week of December, which can lead to the later formation of archesporial tissue, and as a result, flowering. According to Fernandez et al. [6], in accordance with RCP8.5, similar changes may be present in the Mediterranean region, whose climate is close to that of the study region. Thus, by 2085, we anticipate a significant change in the range of crops grown. This expectation is justified by the fact that highly and even moderately cold-loving species or cultivars will not be able to develop normally and produce crops in new climatic conditions, which will lead to the abandonment of their cultivation.
The results of the calculations showed that different phenological responses to the predicted temperature rise during the 21st century appeared for different climatic scenarios. Apricots, especially varieties with low cold requirements, will be better adapted to the expected climate change and may be the best solution when grown in areas with warm winters.
This is especially important in view of the increase in the number of new producers (farmers, peasant farmers and personal auxiliary farms) and the demand for new planting projects, in which the use of the results of this work will ensure the optimal placement of multi-year stands, which will bring significant profits.

4. Conclusions

The present study has focused on the definition and parameterization of six models, based on phenological processes, to predict the date of flowering of the fruit crop apricot, at the species level, taking into account the date of kidney withdrawal from deep rest.
Based on a comparative assessment of the accuracy of the models’ description of the stages of development of apricot depending on the temperature of the winter–spring period, the two best models were chosen: a single-phase model, describing only the period of temperature forcing, and a sequential two-phase model, describing the processes of cooling and thermal forcing, suggesting that the ontogenic development occurs only after the completion of the deep rest phase. These models were used to estimate the influence of expected temperature increases under scenarios RCP2.6, RCP4.5 and RCP8.5 on the timing of flowering of apricots in the conditions of the Southern coast of the Crimea.
Estimates of the timing of flowering and the end of deep dormancy are very important for increasing the profitability of fruit production in the South of Russia without additional costs; this can be achieved by minimizing the risks associated with irrational crop placement and selection of varieties without taking into account the specifics of climate change. When constructing a system of protective measures and dates of treatments, it is also necessary to take into account the calendar dates of the shift in the development of plants. The data can be used in planning breeding work (conducting hybridization and studying the self-fertility of plants) and other technological operations.
Based on the climatic scenarios RCP2.6, RCP4.5, and RCP8.5, an assessment of the impact of climate warming on the passage of apricot vegetation periods was made. In the middle of the century, a slight shift in the dates of the beginning of flowering relative to the long-term average data should be expected.
The simulation results show that when the RCP8.5 scenario is implemented, in the South Coast in the second half of the 21st century, due to an intensive increase in autumn–winter temperatures, a decrease in the rate of accumulation of cooling units and a delay in the release of apricot flower buds from a state of deep dormancy are expected. A later exit from deep dormancy can be considered a positive consequence of climate warming that reduces the risk of crop damage in the winter–spring period.

Author Contributions

Conceptualization, S.K. (Svetlana Korsakova) and V.K.; methodology, S.K. (Svetlana Korsakova) and V.K.; software, K.M. and S.K. (Svetlana Korsakova); validation, V.K., N.K. and V.G.; writing—review and editing, S.K. (Sergey Khokhlov), A.K. and K.M.; project administration, A.K. and Y.P. All authors have read and agreed to the published version of the manuscript.

Funding

This research received no external funding.

Institutional Review Board Statement

Not applicable.

Informed Consent Statement

Not applicable.

Data Availability Statement

Not applicable.

Acknowledgments

The authors are grateful to Pavel Korsakov (Federal State Budgetary Institution “Crimean Department for Hydrometeorology and Environmental Monitoring”, Head of the Agrometeorological Station Nikitsky Sad) for providing phenological data.

Conflicts of Interest

The authors declare no conflict of interest.

References

  1. Vujadinović Mandić, M.; Vuković Vimić, A.; Ranković-Vasić, Z.; Đurović, D.; Ćosić, M.; Sotonica, D.; Nikolić, D.; Đurđević, V. Observed Changes in Climate Conditions and Weather-Related Risks in Fruit and Grape Production in Serbia. Atmosphere 2022, 13, 948. [Google Scholar] [CrossRef]
  2. Parmesan, C.; Hanley, M.E. Plants and climate change: Complexities and surprises. Ann. Bot. 2015, 116, 849–864. [Google Scholar] [CrossRef] [PubMed]
  3. DaMatta, F.M.; Grandis, A.; Arenque, B.C.; Buckeridge, M.S. Impacts of climate changes on crop physiology and food quality. Food Res. Int. 2010, 43, 1814–1823. [Google Scholar] [CrossRef]
  4. Omidifard, Z.; Gharaghani, A. Chilling and heat requirements and bloom frost tolerance of Prunus scoparia (Spach) C. K. Schneid and P. elaeagnifolia Spach. Trees 2022, 36, 1559–1572. [Google Scholar] [CrossRef]
  5. Herrera, S.; Lora, J.; Fadón, E.; Hedhly, A.; Alonso, J.M.; Hormaza, J.I.; Rodrigo, J. Male Meiosis as a Biomarker for Endoto Ecodormancy Transition in Apricot. Front. Plant. Sci. 2022, 13, 842333. [Google Scholar] [CrossRef] [PubMed]
  6. Fernandez, E.; Mojahid, H.; Fadón, E.; Rodrigo, J.; Ruiz, D.; Egea, J.A.; Ben Mimoun, M.; Kodad, O.; El Yaacoubi, A.; Ghrab, M.; et al. Climate change impacts on winter chill in Mediterranean temperate fruit orchards. Reg. Environ. Change 2023, 23, 7. [Google Scholar] [CrossRef]
  7. Korsakova, S.; Korsakov, P. Features development of olive trees during the growing season in the Southern coast of the Crimea. BIO Web Conf. 2021, 38, 00060. [Google Scholar] [CrossRef]
  8. Atagul, O.; Calle, A.; Demirel, G.; Lawton, J.M.; Bridges, W.C.; Gasic, K. Estimating Heat Requirement for Flowering in Peach Germplasm. Agronomy 2022, 12, 1002. [Google Scholar] [CrossRef]
  9. Korzin, V.; Gorina, V.; Saplev, N. The effect of weather conditions in southern Russia on the frost resistance of apricot generative buds. Hortic. Sci. 2021, 48, 158–165. [Google Scholar] [CrossRef]
  10. Gorina, V.; Korzin, V.; Mesyats, N. Apricot breeding for late flowering in Nikita Botanical Gardens. Acta Hortic. 2020, 1282, 25–30. [Google Scholar] [CrossRef]
  11. Gorina, V.; Korzin, V.; Mesyats, N.; Pilkevich, R. Drought tolerance in apricot cultivars and breeding forms under the conditions of the southern coast of Crimea. Acta Hortic. 2021, 1324, 413–420. [Google Scholar] [CrossRef]
  12. Dragavtseva, I.; Kuznetsova, A.P.; Mozhar, N.V.; Klyukina, A.V. Influence of temperature stresses of winter-spring period the fruiting of fruit crops (apricot, pear) in the Krasnodar territory under changing climate conditions. Sci. Work. North. Cauc. Fed. Sci. Cent. Hortic. Vitic. Wine-Mak. 2019, 23, 109–116. (in Russian). [Google Scholar] [CrossRef]
  13. Dragavceva, I.A.; Kuzneczova, A.P.; Klyukina, A.V.; Kovalenko, S.P. The reaction of apricot tree for stressful situation of winter period taking into account the climate change. Fruit. Grow. Vitic. South. Russ. 2020, 65, 141–150. (in Russian). [Google Scholar] [CrossRef]
  14. Korzin, V.V. Analysis of the development and contemporary state of apricot culture in the world and Russian Federation. Hortic. Vitic. 2019, 6, 35–41. (in Russian). [Google Scholar] [CrossRef]
  15. FAOSTAT. Food and Agriculture Data. 2022. Available online: https://www.fao.org/faostat/en/#data/QCL/visualize (accessed on 4 February 2022).
  16. Razavi, F.; Hajilou, J.; Tabatabaei, S.J.; Dadpour, M.R. Comparison of chilling and heat requirement in some peach and apricot cultivars. Res. Plant Biol. 2011, 1, 40–47. Available online: https://www.updatepublishing.com/journal/index.php/ripb/article/view/2571 (accessed on 25 January 2023).
  17. Liu, W.; Liu, N.; Zhang, Y.; Yu, X.; Sun, M.; Xu, M.; Zhang, Q.; Liu, S. Apricot cultivar evolution and breeding program in China. Acta Hortic. 2012, 966, 223–228. [Google Scholar] [CrossRef]
  18. Gorina, V.M.; Korzin, V.V. Long-term Investigations Results of Low Temperatures Influence on Apricot Generative Buds. Acta Hortic. 2016, 1139, 363–368. [Google Scholar] [CrossRef]
  19. Mesterházy, I.; Raffai, P.; Szalay, L.; Bozó, L.; Ladányi, M. Estimation of Blooming Start with the Adaptation of the Unified Model for Three Apricot Cultivars (Prunus armeniaca L.) Based on Long-Term Observations in Hungary (1994–2020). Diversity 2022, 14, 560. [Google Scholar] [CrossRef]
  20. Korzin, V.V. Influence of weather conditions on flowering and productivity of different apricot (Armeniaca vulgaris Lam.) varieties under conditions on the south coast of the Crimea. Tavricheskij Vestn. Agrar. Nauk. 2018, 3, 65–71. (in Russian). Available online: https://tvan.niishk.site/data/documents/7_3.pdf (accessed on 25 January 2023).
  21. Cleland, E.E.; Chuine, I.; Menzel, A.; Mooney, H.A.; Schwartz, M.D. Shifting plant phenology in response to global change. Trends Ecol. Evol. 2007, 22, 357–365. [Google Scholar] [CrossRef]
  22. Korsakova, S.P. Fenologicheskaya reakciya Quercus pubescens Willd. na klimaticheskie izmeneniya v usloviyax suxix subtropikov. Tr. Karadag. Nauchnoj Stn. Im. T.I. Vyazemskogo Prir. Zapov. RAN 2018, 2, 30–46. (in Russian). [Google Scholar] [CrossRef]
  23. Baumgarten, F.; Zohner, C.M.; Gessler, A.; Vitasse, Y. Chilled to be forced: The 376 best dose to wake up buds from winter dormancy. New. Phytol. 2021, 230, 1366–1377. [Google Scholar] [CrossRef] [PubMed]
  24. Zohner, C.; Benito, B.; Svenning, J.-C.; Renner, S.S. Day length unlikely to constrain climate-driven shifts in leaf-out times of northern woody plants. Nat. Clim. Change 2016, 6, 1120–1123. [Google Scholar] [CrossRef]
  25. Gauzere, J.; Lucas, C.; Ronce, O.; Davi, H.; Chuine, I. Sensitivity analysis of tree phenology models reveals increasing sensitivity of their predictions to winter chilling temperature and photoperiod with warming climate. Ecol. Model. 2019, 411, 108805. [Google Scholar] [CrossRef]
  26. Fila, G.; Di Lena, B.; Gardiman, M.; Storchi, P.; Tomasi, D.; Silvestroni, O.; Pitacco, A. Calibration and validation of grapevine budburst models using growth-room experiments as data source. Agric. For. Meteorol. 2012, 160, 69–79. [Google Scholar] [CrossRef]
  27. Hlaszny, E. A Szolo (Vitis vinifera L.) Korai Fenológiai Válaszadásának Modellezése a Kunsági Borvidéken Növényfelvételezések, Idojárási Megfigyelések és Regionális Klímamodell Alapján. Ph.D. Thesis, Corvinus University of Budapest, Budapest, Hungary, 2012; 163p. (in Hungarian). Available online: http://phd.lib.uni-corvinus.hu/669/3/Hlaszny_Edit_thu.pdf (accessed on 25 January 2023).
  28. Williams, D.W.; Andris, H.L.; Beede, R.H.; Luvisi, D.A.; Norton, M.V.K.; Williams, L.E. Validation of a Model for the Growth and Development of the Thompson Seedless Grapevine. II. Phenology. Am. J. Enol. Vitic. 1985, 36, 283–289. [Google Scholar] [CrossRef]
  29. Cesaraccio, C.; Spano, D.; Snuder, R.L.; Duce, P. Chilling and forcing model to predict bud-burst of crop and forest species. Agric. For. Meteorol. 2004, 126, 1–13. [Google Scholar] [CrossRef]
  30. Drogoudi, P.; Cantín, C.M.; Brandi, F.; Butcaru, A.; Cos-Terrer, J.; Cutuli, M.; Foschi, S.; Galindo, A.; García-Brunton, J.; Luedeling, E.; et al. Impact of Chill and Heat Exposures under Diverse Climatic Conditions on Peach and Nectarine Flowering Phenology. Plants 2023, 12, 584. [Google Scholar] [CrossRef]
  31. Samigulina, N.S. Practical Work Breeding and Cultivating Fruit and Berry Crops; MichGAU: Michurinsk, Russia, 2006; 197p, Available online: http://window.edu.ru/resource/493/64493/files/0242.pdf (accessed on 25 January 2023).
  32. Forsythe, W.C.; Rykiel, E.J., Jr.; Stahl, R.S.; Wu, H.-I.; Schoolfield, R.M. A model comparison for daylength as a function of latitude and day of year. Ecol. Model. 1995, 80, 87–95. [Google Scholar] [CrossRef]
  33. Chuine, I.; de Cortazar-Atauri, I.G.; Kramer, K.; Hänninen, H. Plant development models. In Phenology: An Integrative Environmental Science; Schwartz, M.D., Ed.; Springer: Dordrecht, The Netherlands, 2003; pp. 217–235. [Google Scholar] [CrossRef]
  34. Chuine, I. A unified model for budburst of trees. J. Theor. Biol. 2000, 207, 337–347. [Google Scholar] [CrossRef]
  35. Hänninen, H. Modelling bud dormancy release in trees from cool and temperate regions. Acta For. Fenn. 1990, 213, 1–47. [Google Scholar] [CrossRef]
  36. Blümel, K.; Chmielewski, F.-M. Shortcomings of classical phenological forcing models and a way to overcome them. Agric. For. Meteorol. 2012, 164, 10–19. [Google Scholar] [CrossRef]
  37. Migliavacca, M.; Sonnentag, O.; Keenan, T.F.; Cescatti, A.; O′Keefe, J.; Richardson, A.D. On the uncertainty of phenological responses to climate change, and implications for a terrestrial biosphere model. Biogeosciences 2012, 9, 2063–2083. [Google Scholar] [CrossRef]
  38. Korsakova, S.P.; Plugatar, Y.V.; Sharmagiy, A.K. Predictive simulation of spring development of Cydalima perspectalis Walker in the south of Russia. IOP Conf. Ser. Earth Environ. Sci. 2022, 949, 012004. [Google Scholar] [CrossRef]
  39. Korsakova, S.P. The evaluation of future climate change in the Southern coast of the Crimea. Ekosistemy 2018, 15, 151–165. Available online: http://ekosystems.cfuv.ru/wp-content/uploads/2018/12/018korsakova.pdf (accessed on 25 January 2023). (in Russian).
  40. Gauzere, J.; Delzon, S.; Davi, H.; Bonhomme, M.; de Cortazar-Atauri, I.G.; Chuine, I. Integrating interactive effects of chilling and photoperiod in phenological process-based models. A case study with two European tree species: Fagus sylvatica and Quercus petraea. Agric. For. Meteorol. 2017, 244–245, 9–20. [Google Scholar] [CrossRef]
  41. The Federal State Budgetary Institution “Voeikov Main Geophysical Observatory” (FGBI “MGO”). Chapter «Climate Change in Russia in 21 Century (Modeli CMIP 5)». Available online: http://voeikovmgo.ru/index.php/izmenenie-klimata-v-rossii-v-xxi-veke (accessed on 15 February 2023). (in Russian).
  42. The R Project for Statistical Computing. Available online: http://www.r-project.org/ (accessed on 15 February 2023).
  43. Julian, C.; Herrero, M.; Rodrigo, J. Anther meiosis time is related to winter cold temperatures in apricot (Prunus armeniaca L.). Environ. Exp. Bot. 2014, 100, 20–25. [Google Scholar] [CrossRef]
  44. Hillmann, L.; Elsysy, M.; Goeckeritz, C.; Hollender, C.; Rothwell, N.; Blanke, M.; Einhorn, T. Preanthesis changes in freeze resistance, relative water content, and ovary growth preempt bud phenology and signify dormancy release of sour cherry floral buds. Planta 2021, 254, 74. [Google Scholar] [CrossRef]
  45. Richardson, E.A.; Seeley, S.D.; Walker, D.R. A model for estimating the completion of rest for “Redhaven” and “Elberta” peach trees. Hortic. Sci. 1974, 9, 331–332. [Google Scholar] [CrossRef]
  46. Andreini, L.; Cortázar-Atauri, I.G.; Chuine, I.; Viti, R.; Bartolini, S.; Ruiz, D.; Campoy, J.A.; Legave, J.M.; Audergon, J.-M.; Bertuzzi, P. Understanding dormancy release in apricot flower buds (Prunus armeniaca L.) using several process-based phenological models. Agric. For. Meteorol. 2014, 184, 210–219. [Google Scholar] [CrossRef]
  47. Bielenberg, D.G.; Gasic, K. Peach [Prunus persica (L.) Batsch] cultivars differ in apparent base temperature and growing degree hour requirement for floral bud break. Front. Plant Sci. 2022, 13, 801606. [Google Scholar] [CrossRef] [PubMed]
  48. Weinberger, J.H. Chilling requirements of peach varieties. Proc. Am. Soc. Horticul. Sci. 1950, 56, 122–128. Available online: https://www.scirp.org/reference/ReferencesPapers.aspx?ReferenceID=433046 (accessed on 15 February 2023).
  49. Cantin, C.M.; Wang, X.W.; Almira, M.; Arús, P.; Eduardo, I. Inheritance and QTL analysis of chilling and heat requirements for flowering in an interspecific almond × peach (Texas × Earlygold) F2 population. Euphytica 2020, 216, 51. [Google Scholar] [CrossRef]
  50. Fadón, E.; Herrera, S.; Guerrero, B.I.; Guerra, M.E.; Rodrigo, J. Chilling and Heat Requirements of Temperate Stone Fruit Trees (Prunus sp.). Agronomy 2020, 10, 409. [Google Scholar] [CrossRef]
  51. Hackett, W.P.; Hartmann, H.T. The Influence of Temperature on Floral Initiation in the Olive. Physiol. Plant. 1967, 20, 430–436. [Google Scholar] [CrossRef]
  52. Stadnik, S.A.; Falkova, T.V.; Yablonskij, E.A.; Chernyak, V.V. Influence of temperature on bioelectrical activity and physiological processes in plant in winter. Tr. GNBS 1974, 64, 99–105. (in Russian). [Google Scholar]
  53. Sawamura, Y.; Suesada, Y.; Sugiura, T.; Yaegaki, H. Chilling Requirements and Blooming Dates of Leading Peach Cultivars and a Promising Early Maturing Peach Selection, Momo Tsukuba 127. Hortic. J. 2017, 86, 426–436. [Google Scholar] [CrossRef]
  54. Legave, J.M.; Christen, D.; Giovannini, D.; Oger, R. Global warming in Europe and its impact on floral bud phenology in fruit species. Acta Hortic. 2009, 838, 21–26. [Google Scholar] [CrossRef]
  55. Kwon, J.; Nam, E.; Yun, S.; Kim, S.; Song, S.; Lee, J.; Hwang, K. Chilling and heat requirement of peach cultivars and changes in chilling accumulation spectrums based on 100-year records in Republic of Korea. Agric. For. Meteorol. 2020, 288–289, 108009. [Google Scholar] [CrossRef]
  56. Vuković, A.J.; Vujadinović, M.P.; Rendulić, S.M.; Đurđević, V.S.; Ruml, M.M.; Babić, V.P.; Popović, D.P. Global warming Impact on Climate Change in Serbia. Therm. Sci. 2018, 22, 2267–2280. [Google Scholar] [CrossRef]
  57. Alonso, J.M.; Ansón, J.M.; Espiau, M.T. R. Socias i Company. Determination of endodormancy break in almond flower buds by a correlation model using the average temperature of different day intervals and its application to the estimation of chill and heat requirements and blooming date. J. Am. Soc. Hortic. Sci. 2005, 130, 308–318. [Google Scholar] [CrossRef]
  58. Benmoussa, H.; Ghrab, M.; Ben Mimoun, M.; Luedeling, E. Chilling and heat requirements for local and foreign almond (Prunus dulcis Mill.) cultivars in a warm Mediterranean location based on 30 years of phenology records. Agric. For. Meteorol. 2017, 239, 34–46. [Google Scholar] [CrossRef]
  59. Fadón, E.; Rodrigo, J.; Luedeling, E. Cultivar-specific responses of sweet cherry flowering to rising temperatures during dormancy. Agric. For. Meteorol. 2021, 307, 108486. [Google Scholar] [CrossRef]
  60. Kitamura, Y.; Habu, T.; Yamane, H.; Nishiyama, S.; Kajita, K.; Sobue, T.; Kawai, T.; Numaguchi, K.; Nakazaki, T.; Kitajima, A.; et al. Identification of QTLs controlling chilling and heat requirements for dormancy release and bud break in Japanese apricot (Prunus mume). Tree Genet. Genomes 2018, 14, 33. [Google Scholar] [CrossRef]
  61. Abou-Saaid, O.; El Yaacoubi, A.; Moukhli, A.; El Bakkali, A.; Oulbi, S.; Delalande, M.; Farrera, I.; Kelner, J.-J.; Lochon-Menseau, S.; El Modafar, C.; et al. Statistical Approach to Assess Chill and Heat Requirements of Olive Tree Based on Flowering Date and Temperatures Data: Towards Selection of Adapted Cultivars to Global Warming. Agronomy 2022, 12, 2975. [Google Scholar] [CrossRef]
  62. Wypych, A.; Ustrnul, Z.; Sulikowska, A.; Chmielewski, F.-M.; Bochenek, B. Spatial and temporal variability of the frost-free season in Central Europe and its circulation background. Int. J. Climatol. 2017, 37, 3340–3352. [Google Scholar] [CrossRef]
  63. Chervenkov, H.; Slavov, K. Assessment of agrometeorological indices over Southeast Europe in the context of climate change (1961–2018). Idojaras 2021, 125, 255–269. [Google Scholar] [CrossRef]
  64. Cherif, S.; Doblas-Miranda, E.; Lionello, P.; Borrego, C.; Giorgi, F.; Iglesias, A.; Jebari, S.; Mahmoudi, E.; Moriondo, M.; Pringault, O.; et al. Drivers of change. In Climate and Environmental Change in the Mediterranean Basin—Current Situation and Risks for the Future. First Mediterranean Assessment Report; Cramer, W., Guiot, J., Marini, K., Eds.; Union for the Mediterranean, Plan Bleu, UMEP/MAP: Marseille, France, 2020; pp. 59–180. [Google Scholar] [CrossRef]
  65. Meng, L.; Zhou, Y.; Gu, L.; Richardson, A.D.; Peñuelas, J.; Fu, Y.; Wang, Y.; Asrar, G.R.; De Boeck, H.J.; Mao, J.; et al. Photoperiod decelerates the advance of spring phenology of six deciduous tree species under climate warming. Glob. Change Biol. 2021, 27, 2914–2927. [Google Scholar] [CrossRef]
  66. Benmoussa, H.; Luedeling, E.; Ghrab, M.; Ben Mimoun, M. Severe winter chill decline impacts Tunisian fruit and nut orchards. Clim. Change 2020, 162, 1249–1267. [Google Scholar] [CrossRef]
  67. Rodrнguez, A.; Pйrez-Lypez, D.; Sбnchez, E.; Centeno, A.; Gymara, I.; Dosio, A.; Ruiz-Ramos, M. Chilling accumulation in fruit trees in Spain under climate change. Nat. Hazards Earth Syst. Sci. 2019, 19, 1087–1103. [Google Scholar] [CrossRef]
Figure 1. Average monthly air temperatures on the southern coast of the Crimea for 1994–2022 (according to the agrometeorological station Nikitsky Garden).
Inventions 08 00065 g001
Figure 2. Stages of development of pollen grain. (a)—the development of archesporal tissue; (b)—the reduction division in the pollen (meiosis), the end of deep rest; (c)—the formation of microspore tetrada (the development of single-cell pollen); (d)—the development of two-cell pollen; (e)—starch synthesis.
Inventions 08 00065 g002
Figure 3. Temperature sensitivity of Prunus armeniaca during the necessary cooling period during the organic resting of the kidneys. (a)—units of cooling temperature activity during organic rest, obtained by sigmoidal (model m1) and triangular (model m2) functions based on experiments; (b)—comparison of observed and predicted end dates of kidney organic rest models.
Inventions 08 00065 g003
Figure 4. Relationship between apricot flowering phenophase and spring air temperature on the South Coast from 1995 to 2022 (R2—coefficient of determination,  p < 0.0001 ).
Inventions 08 00065 g004
Figure 5. Temperature sensitivity of Prunus armeniaca during forced dormancy and spring development of flower buds: efficiency of thermal units by linear (a) and sigmoidal models (b).
Inventions 08 00065 g005
Figure 6. Comparison of observed and model-predicted flowering start dates for Prunus armeniaca.
Inventions 08 00065 g006
Figure 7. Scatterplots of observed and predicted flowering dates of a dataset for calibration (average of 15 cultivars) and independent verification (individual cultivars) using single-phase (BCdoy) and two-phase (ChillBCdoy) models.
Inventions 08 00065 g007
Figure 8. Predicted terms of spring phenology (flowering by BCdoy (a) and by ChillBCdoy (b) models and end of deep dormancy by m1 model (c)) of Prunus armeniaca for 2023–2100, according to climate scenarios RCP2.6, RCP4.5 and RCP8.5 on the Southern Coast of Crimea.
Inventions 08 00065 g008
Table 1. Equations of models used to predict the end of deep rest dates and the beginning of flowering of apricots.
ModelFormulaParameters to Be Defined
m1   S c t = t 0 t 1 1 1 + e a ( T t c ) 2 + b ( T t c )   ,   where   S c t 1 = C * a, b, c,     C * ;
  t 0 = 1   November
m2   S c t = t 0 t 1 { 0 ,   T t T m i n   o r   T t T m a x   T t T m i n T o p t T m i n ,   T m i n < T t T o p t T t T m a x T o p t T m a x ,   T o p t < T t < T m a x     ,   where   S c t 1 = C * T m i n ,   T o p t ,    
T m a x , C*;
t 0 = 1   November
GDD   S f t = t 1 t 2 { 0 ,                 T t < T b   T t T b ,     T t T b     , where   S f t 2 = F * T b ,   F * ;
t 1 = 31   January
GDDdoy   S f t = t 1 t 2 { 0 ,                 T t < T b   T t T b ,     T t T b     , where   S f t 2 = F *   T b ,   F * ,   t 1
BCdoy   S f t = t 1 t 2 { 0 ,                                 T t < T b ( T t T b ) · ( D L 10 ) E X P O T t T b   ,   w h e r e   S f t 2 = F *   T b ,   E X P O ,   F * ,   t 1
SIGdoy   S f t = t 1 t 2 1 1 + e b f ( T t c f )   ,   where   S f t 2 = F *   b f ,   c f ,   F * ,   t 1
SIGFOTOdoy   S f t = t 1 t 2 [ 1 1 + e b f ( T t c f ) * ( D L 10 ) E X P O ] ,   where   S f t 2 = F *   b f ,   c f ,   E X P O ,   F * ,   t 1
ChillBC doy
(m1 + BCdoy)
S c t = t 0 t 1 1 1 + e a ( T t c ) 2 + b ( T t c )   ,   where   S c t 1 = C *  
S f t = t 1 t 2 { 0 ,                                   T t < T b   ( T t T b ) * ( D L 10 ) E X P O T t T b ,   where   S f t 2 = F *  
a, b, c, C*;
t 0 = 1   November
T b ,   E X P O ,   F * ,   t 1
Table 2. Optimized model parameter and quality indicator values based on calibration and validation of the apricot bloom dataset.
Phenological Model
GDDGDDdoyBCdoySIGFOTOdoySIGdoyChillBCdoy
Parameters
t1 = 31.Jant1 = 04.Febt1 = 27.Jant1 = 15.Jant1 = 02.Febt0 = 01.Nov
Tb = 0.0Tb = 0.3Tb = 1.2bf = −0.3685bf =−0.4291a =0.1394
F* = 308.6F* = 277.1EXPO =1.578cf =8.9921cf =5.8505b =1.5034
F* = 310.7EXPO =1.7541F* = 25.5c =11.2765
F* = 21.1 C* = 68.1
Tb = 2.6
EXPO =2.8603
F* = 261.1
Calibration data
n = 20n = 20n = 20n = 20n = 20n = 20
R2 = 0.91R2 = 0.91R2 = 0.92R2 = 0.91R2 = 0.90R2 = 0.92
RMSE = 3.2RMSE = 3.2RMSE = 3.0RMSE = 3.3RMSE = 3.3RMSE = 3.0
AICc = 48.78AICc = 48.47AICc = 46.61AICc = 51.64AICc = 50.74AICc = 52.24
θ = −0.5θ = −0.1θ = 0.5θ = −0.4θ = 0.3θ = −0.4
Validation data
n = 8n = 8n = 8n = 8n = 8n = 8
R2 = 0.78R2 = 0.79R2 = 0.83R2 = 0.82R2 = 0.78R2 = 0.83
RMSE = 3.9RMSE = 3.8RMSE = 3.4RMSE = 3.5RMSE = 3.7RMSE = 3.4
θ = 0.4θ = −0.8θ = 0.9θ = −0.6θ = 0.1θ = −0.6
Table 3. The results of checking the model residuals for normal distribution (Shapiro–Wilk test) and heteroscedasticity (Breusch–Pagan test).
ModelShapiro–Wilk TestBreusch–Pagan Test
Wp-ValueBPp-Value
GDD0.971460.62010.87500.3496
GDDdoy0.975620.73590.02260.8804
BCdoy0.970950.60630.13880.7094
SIGdoy0.971690.62661.87820.1763
SIGFOTOdoy0.940230.11200.22120.6382
ChillBCdoy0.975370.72891.18890.2756
Disclaimer/Publisher’s Note: The statements, opinions and data contained in all publications are solely those of the individual author(s) and contributor(s) and not of MDPI and/or the editor(s). MDPI and/or the editor(s) disclaim responsibility for any injury to people or property resulting from any ideas, methods, instructions or products referred to in the content.

