
Experimental Assessment of a Novel Dual Opening Dewar for Use on a Liquid Air Energy Storage System Installed on Remote, Islanded, Renewable Microgrids

Abstract
:1. Introduction
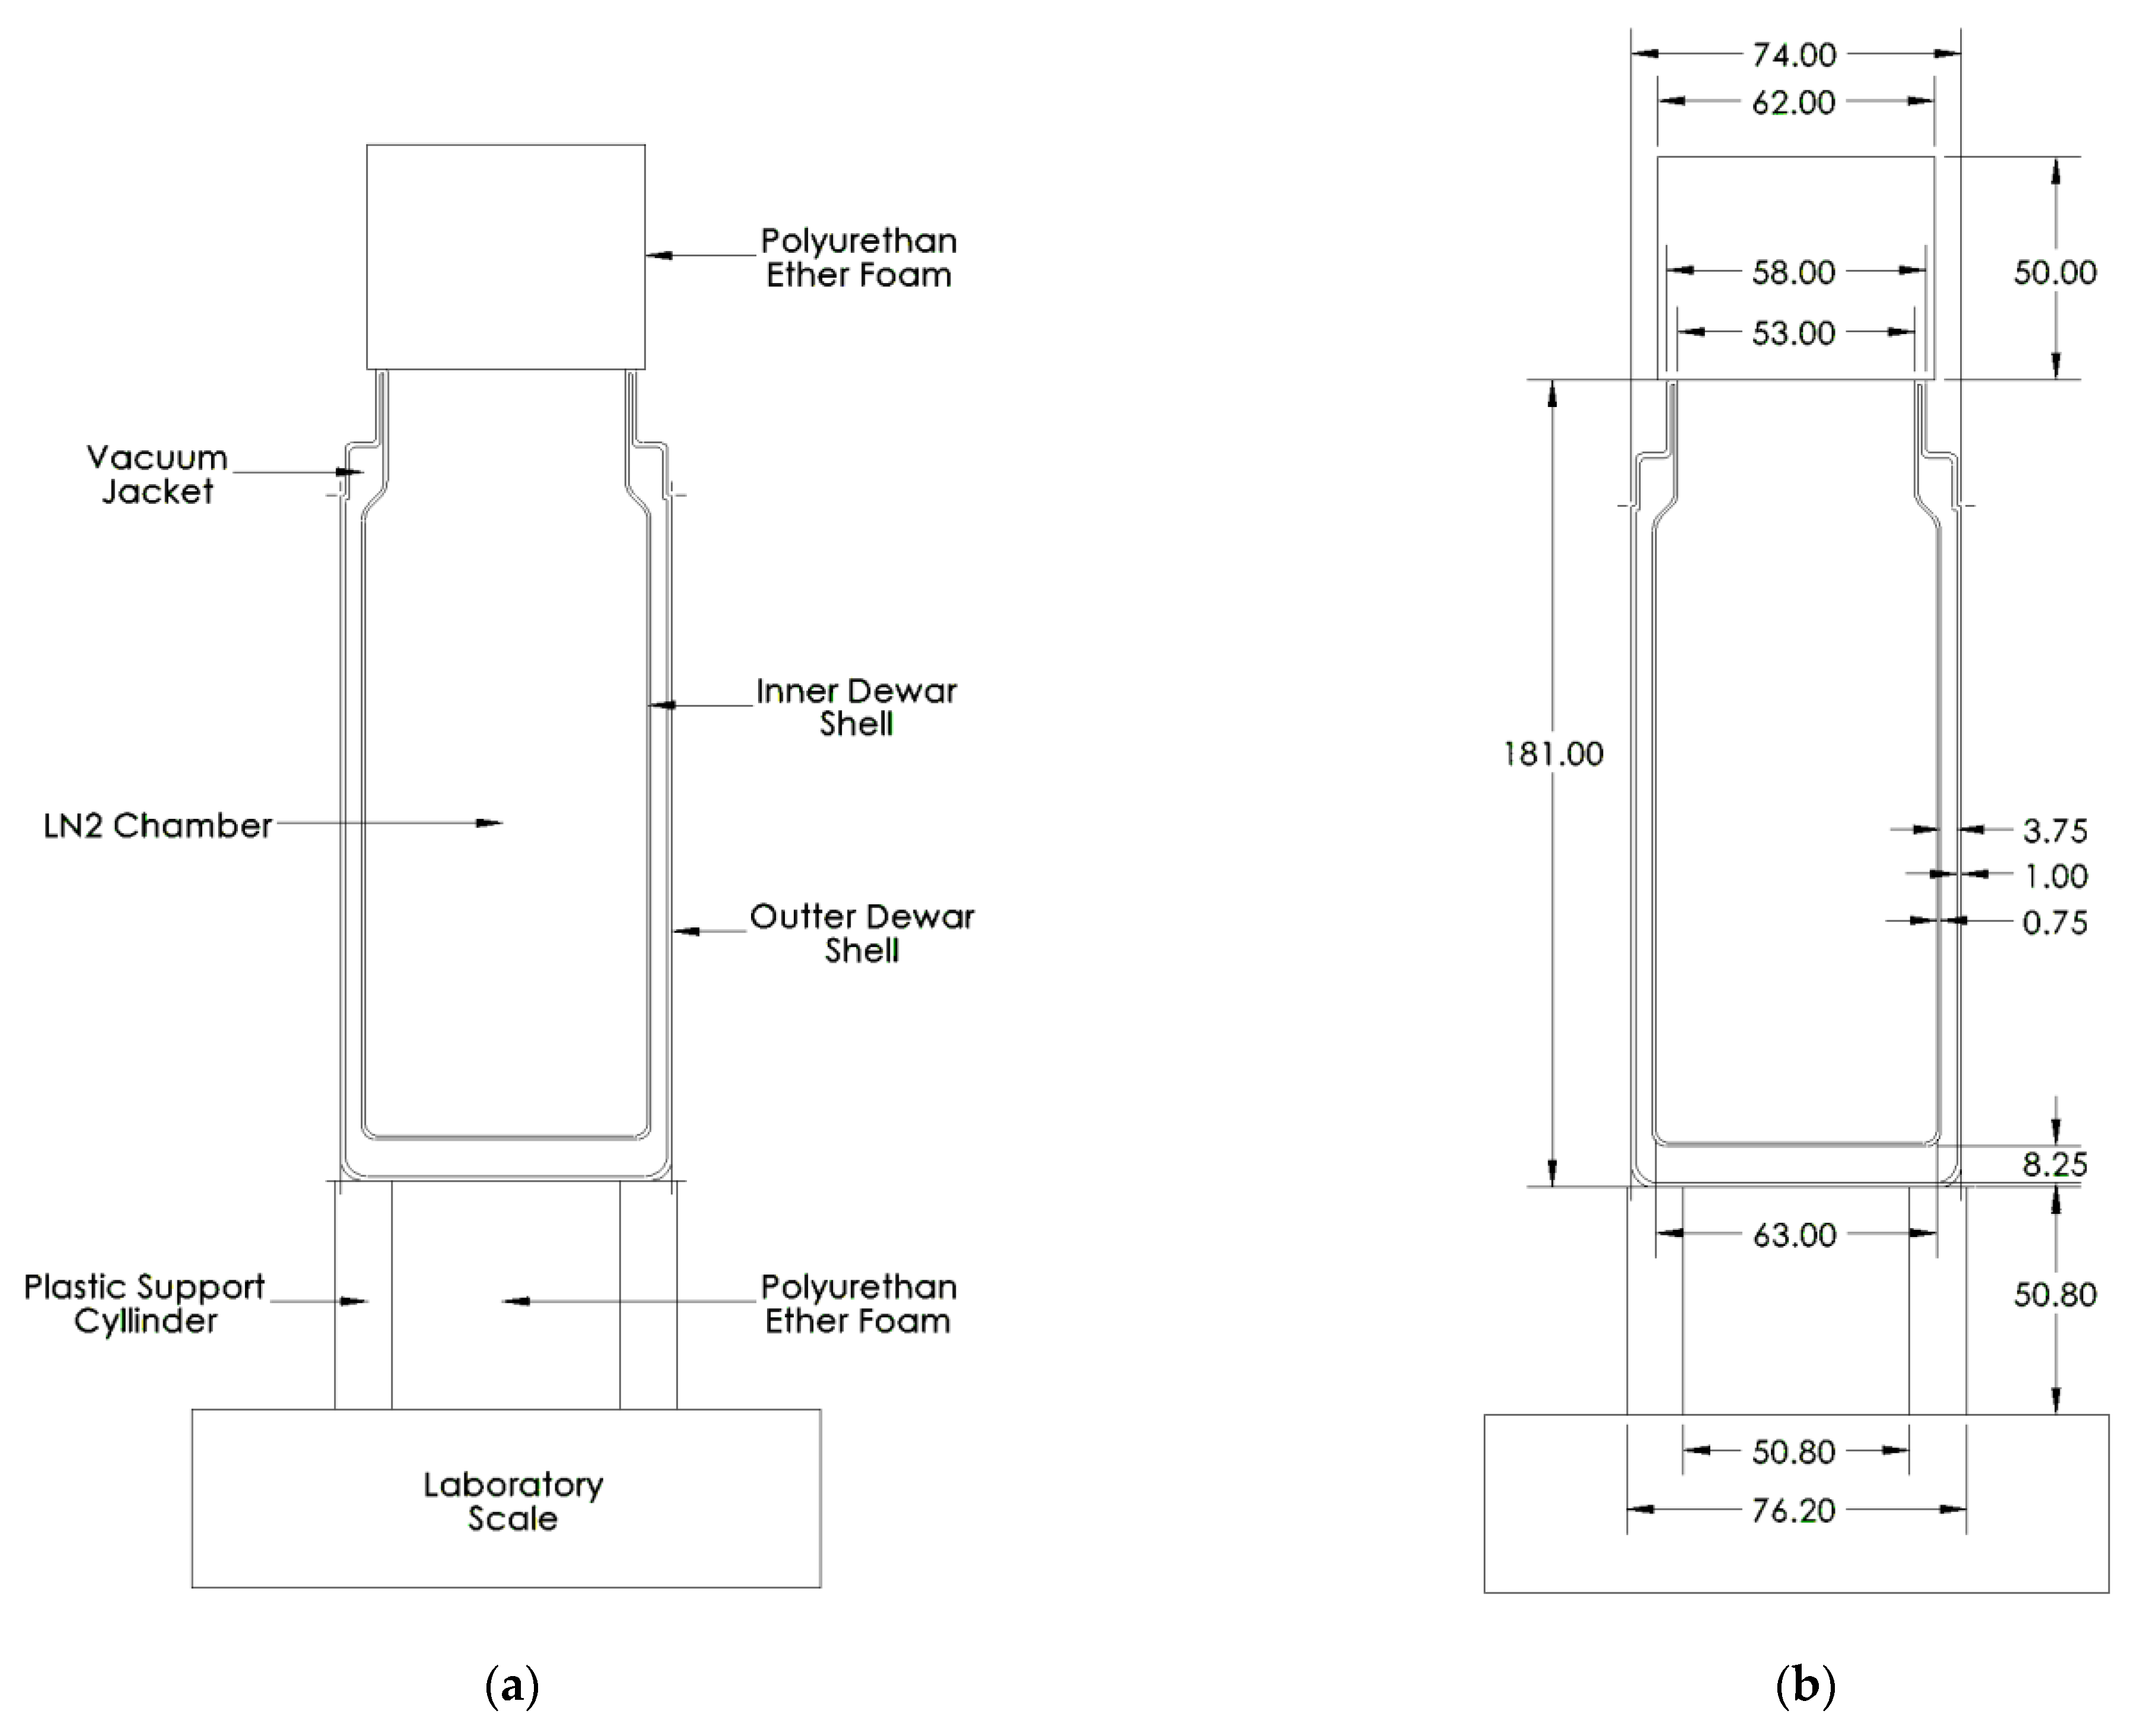
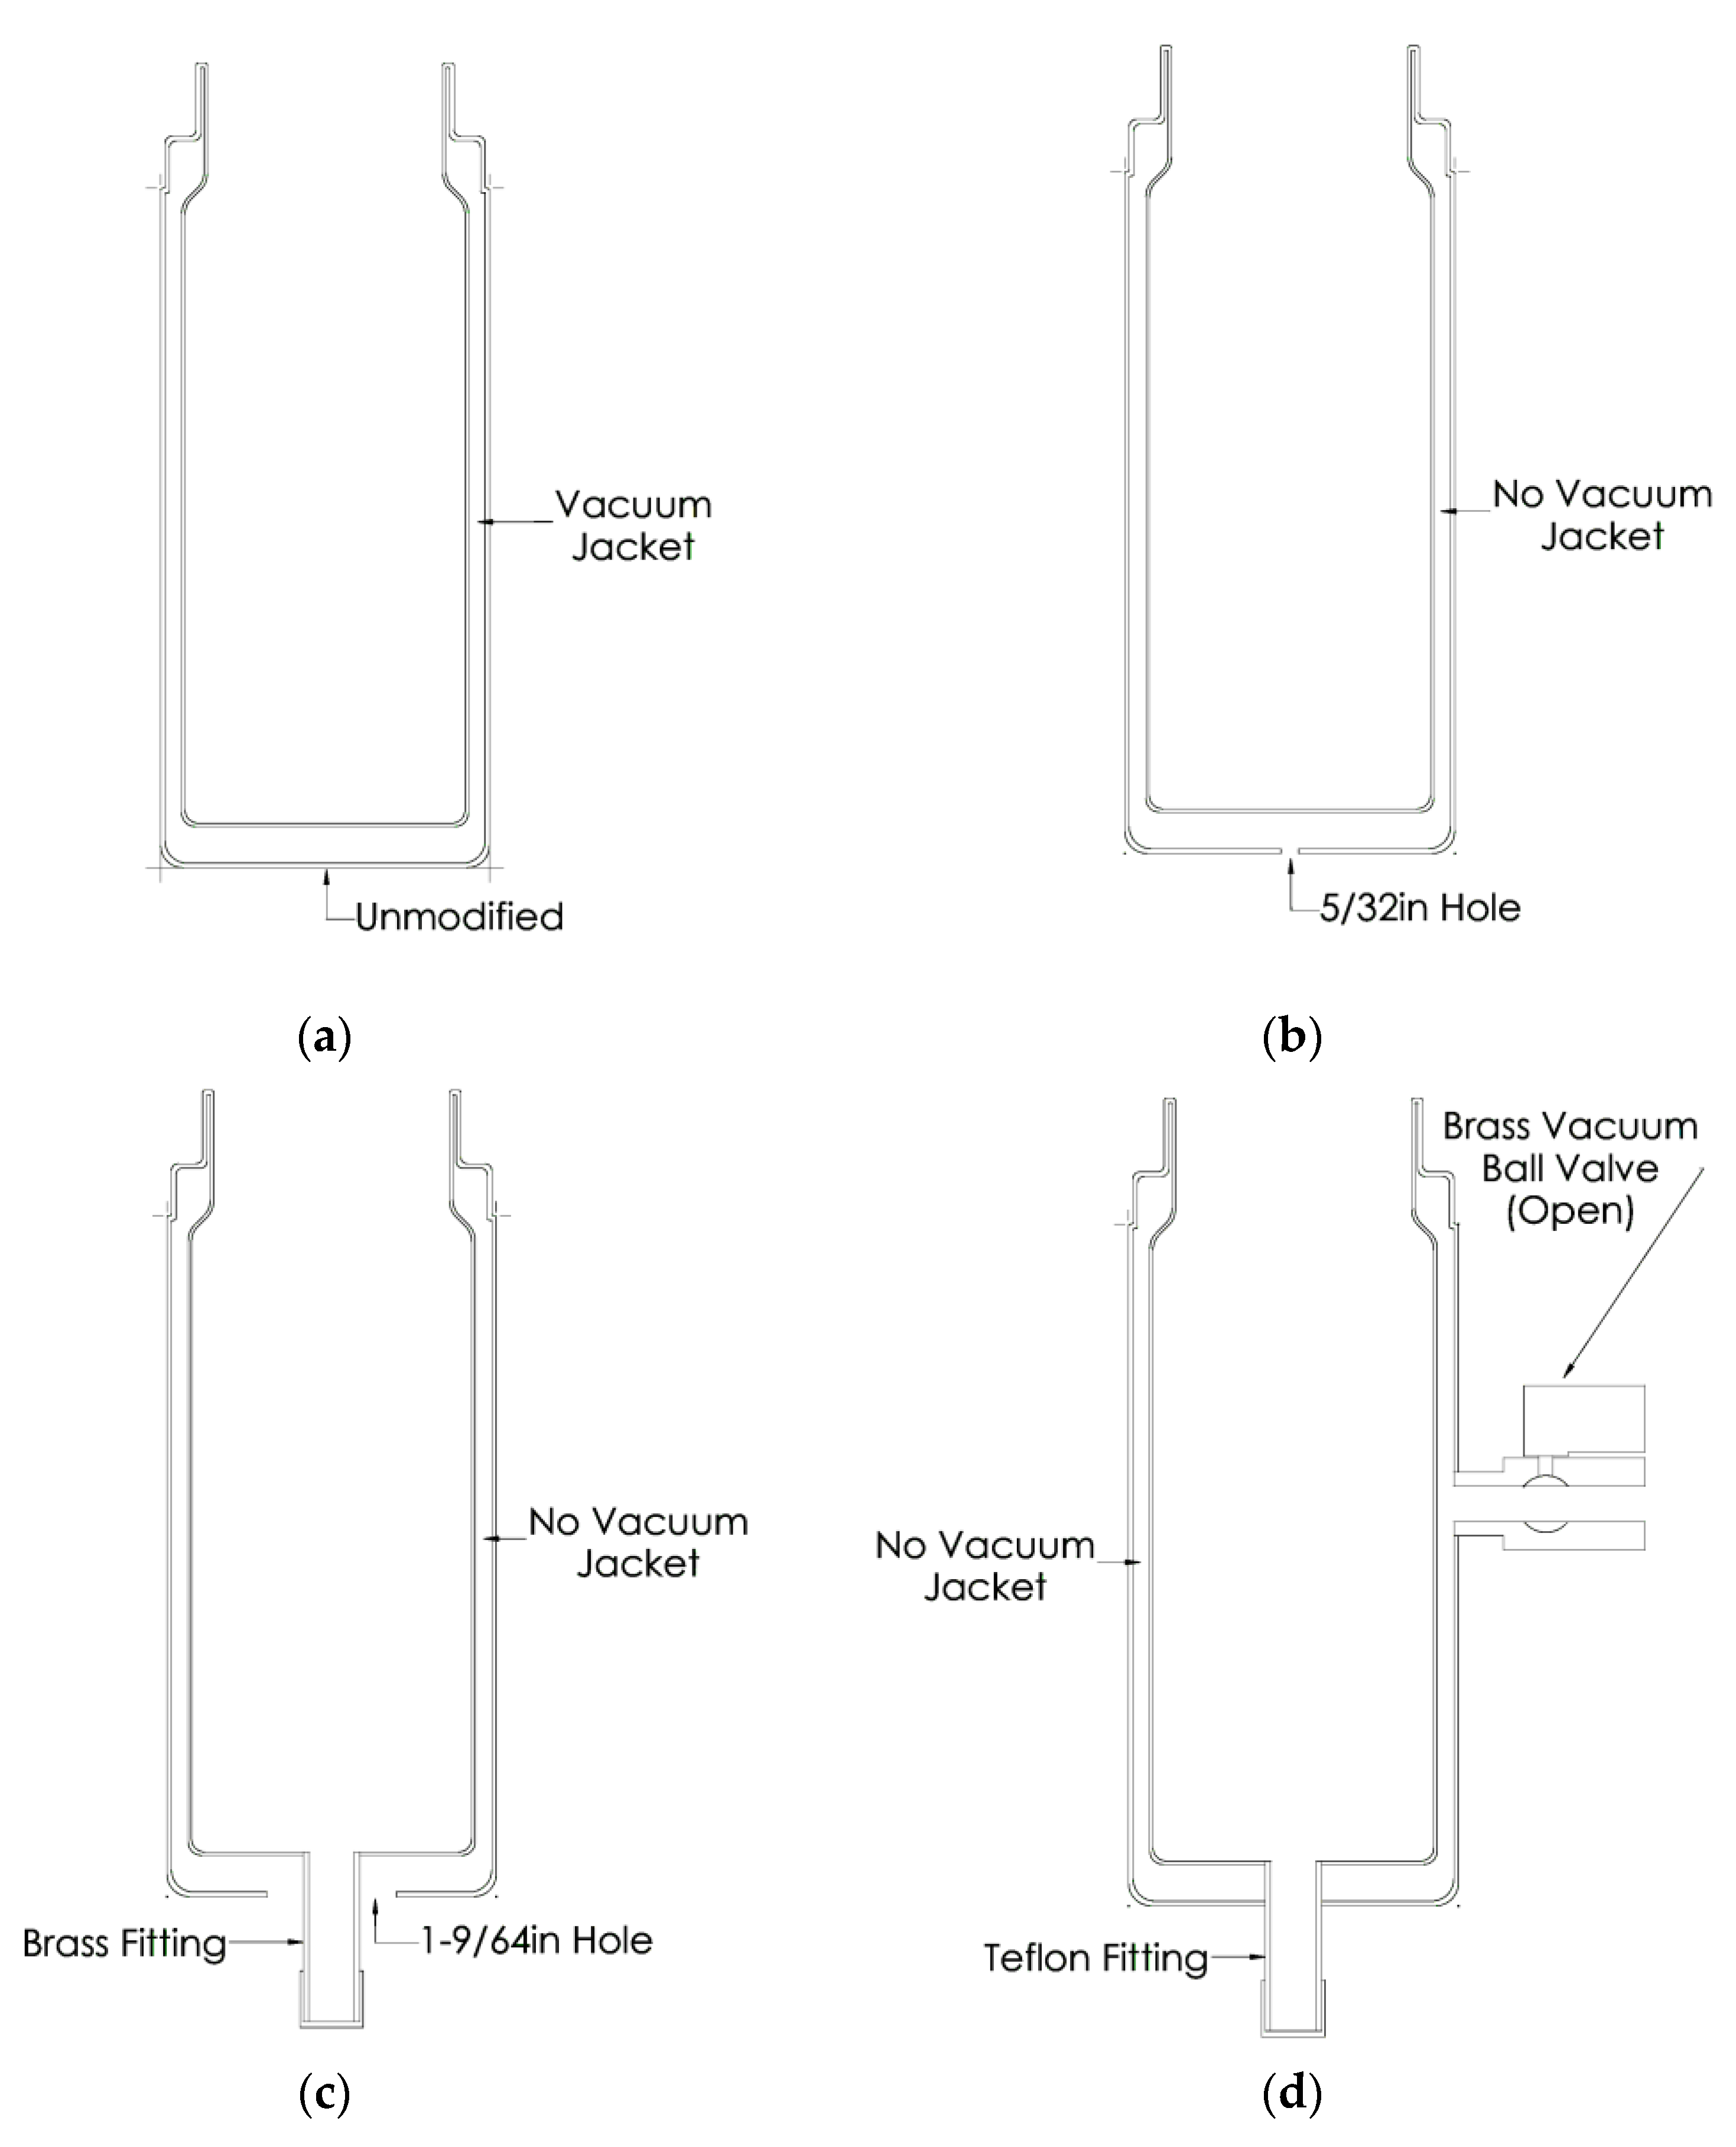
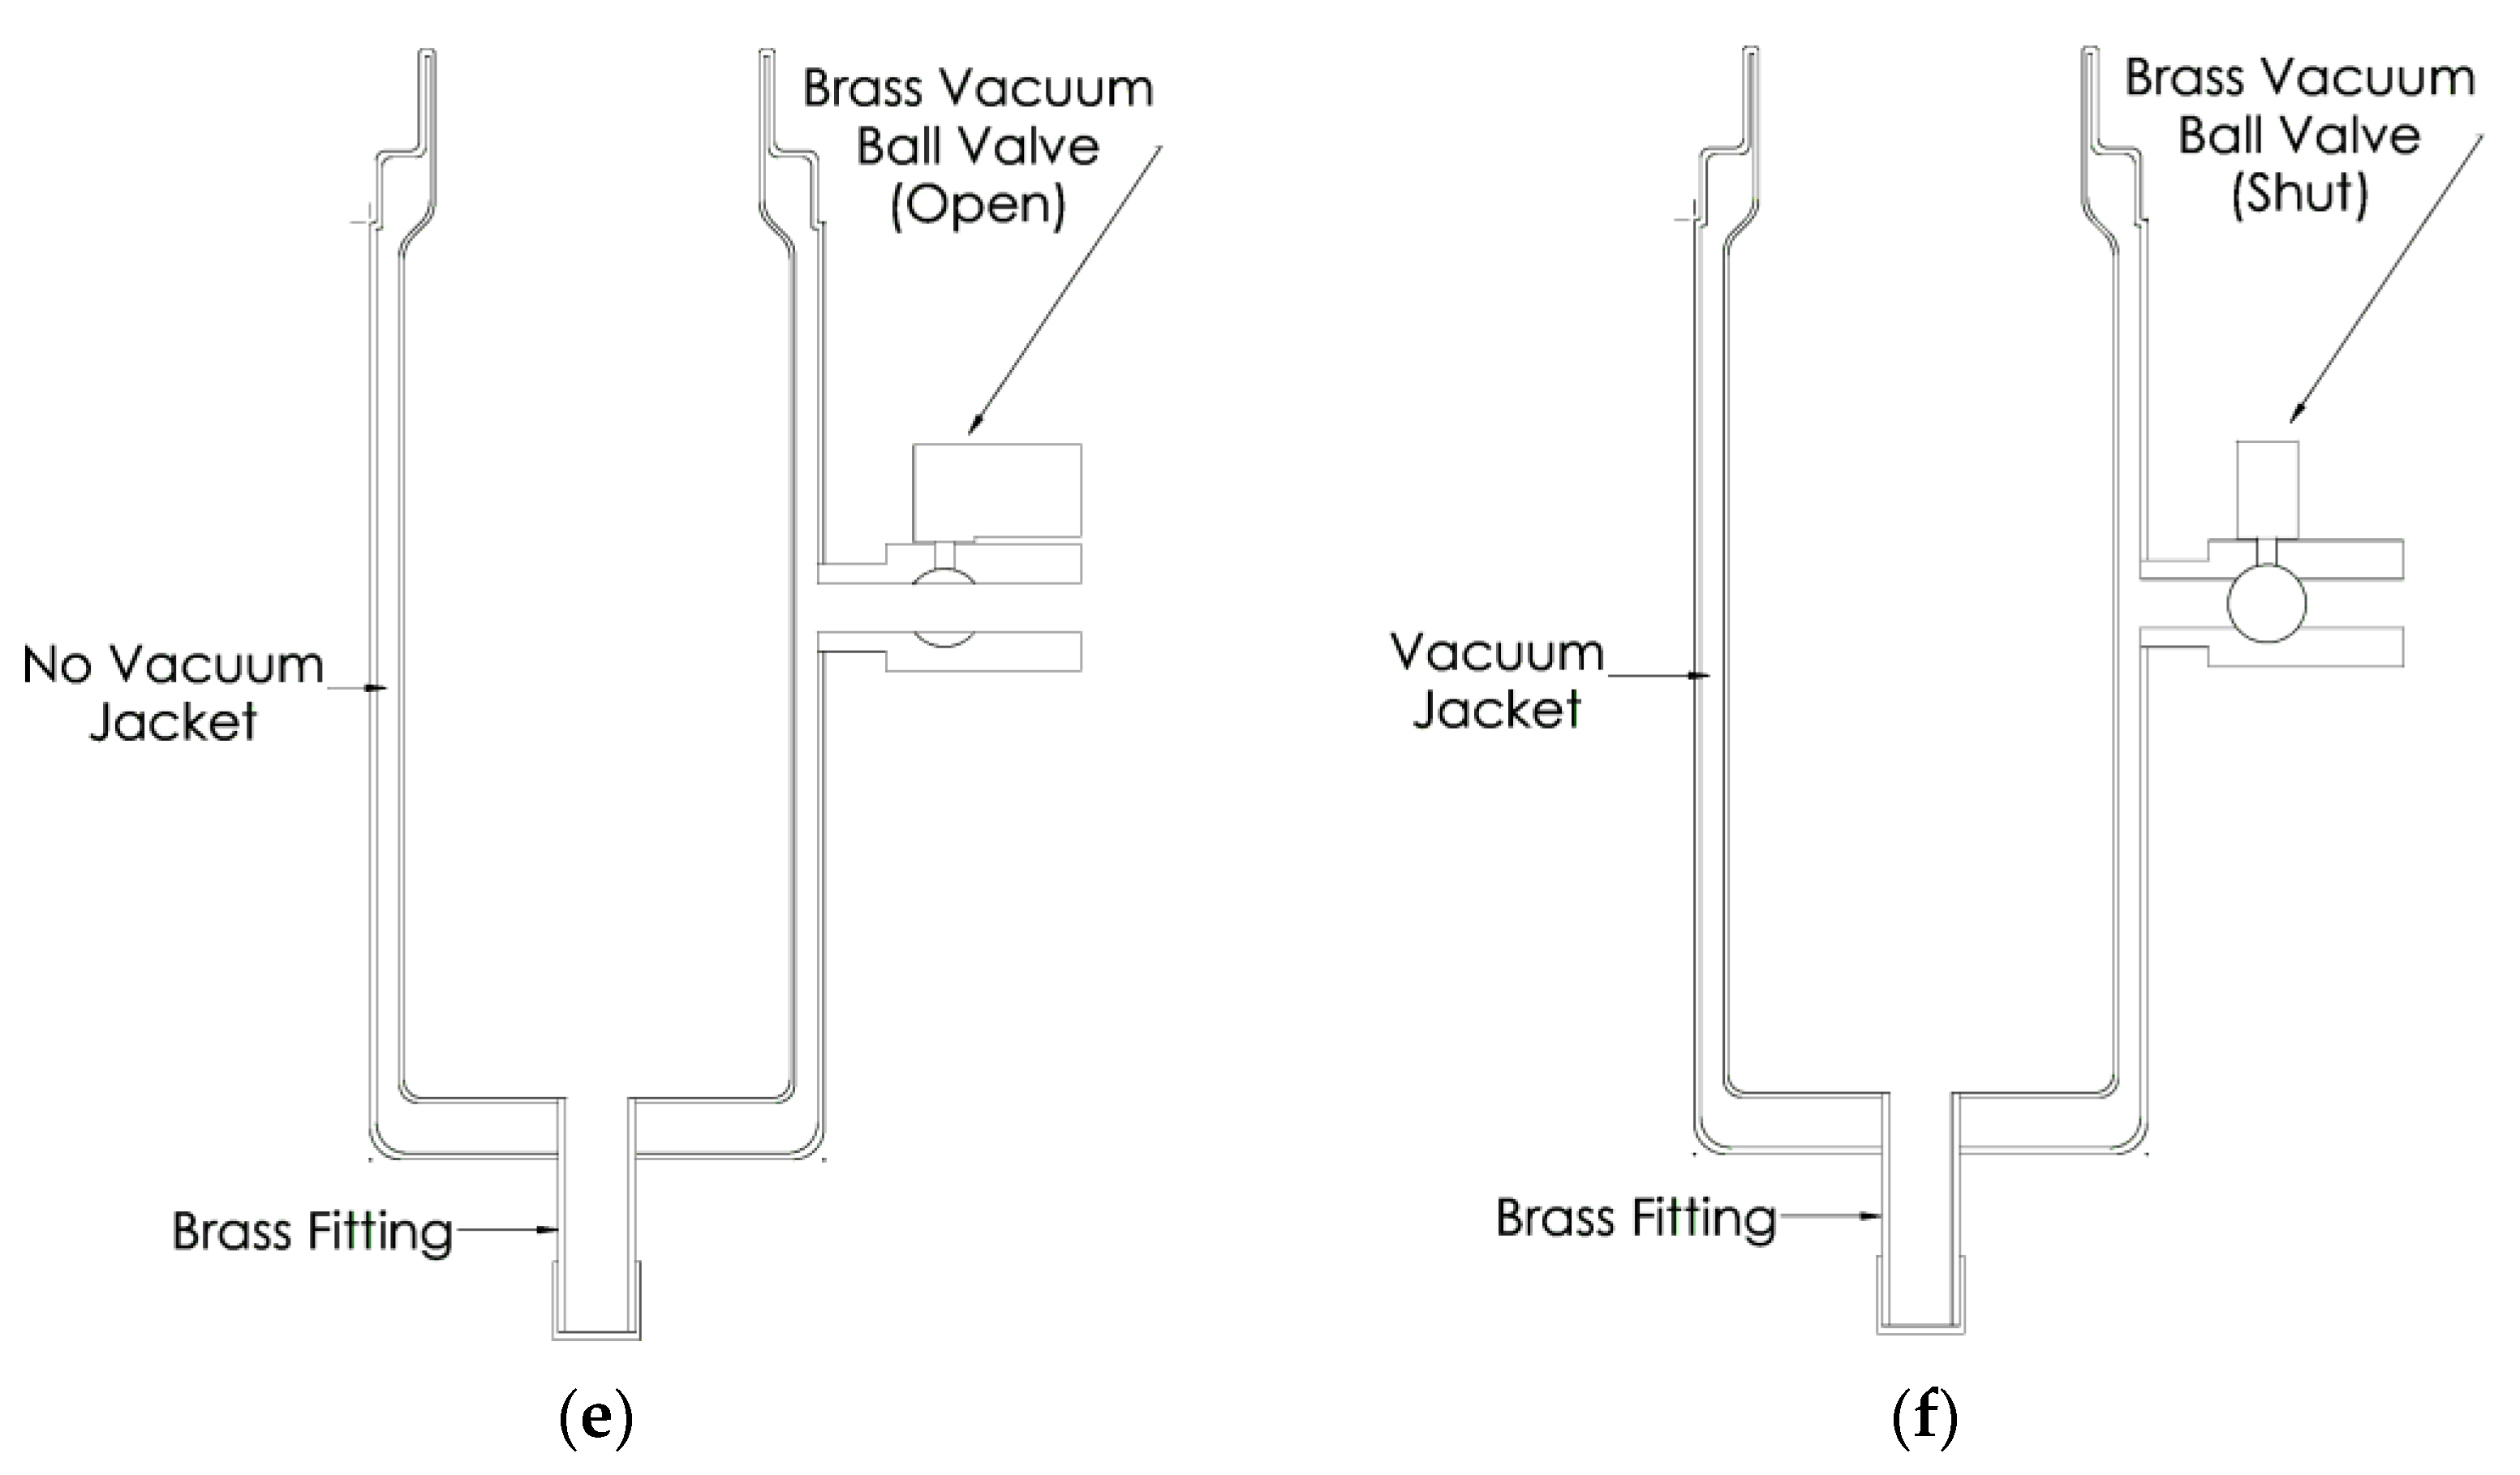
2. Materials and Methods
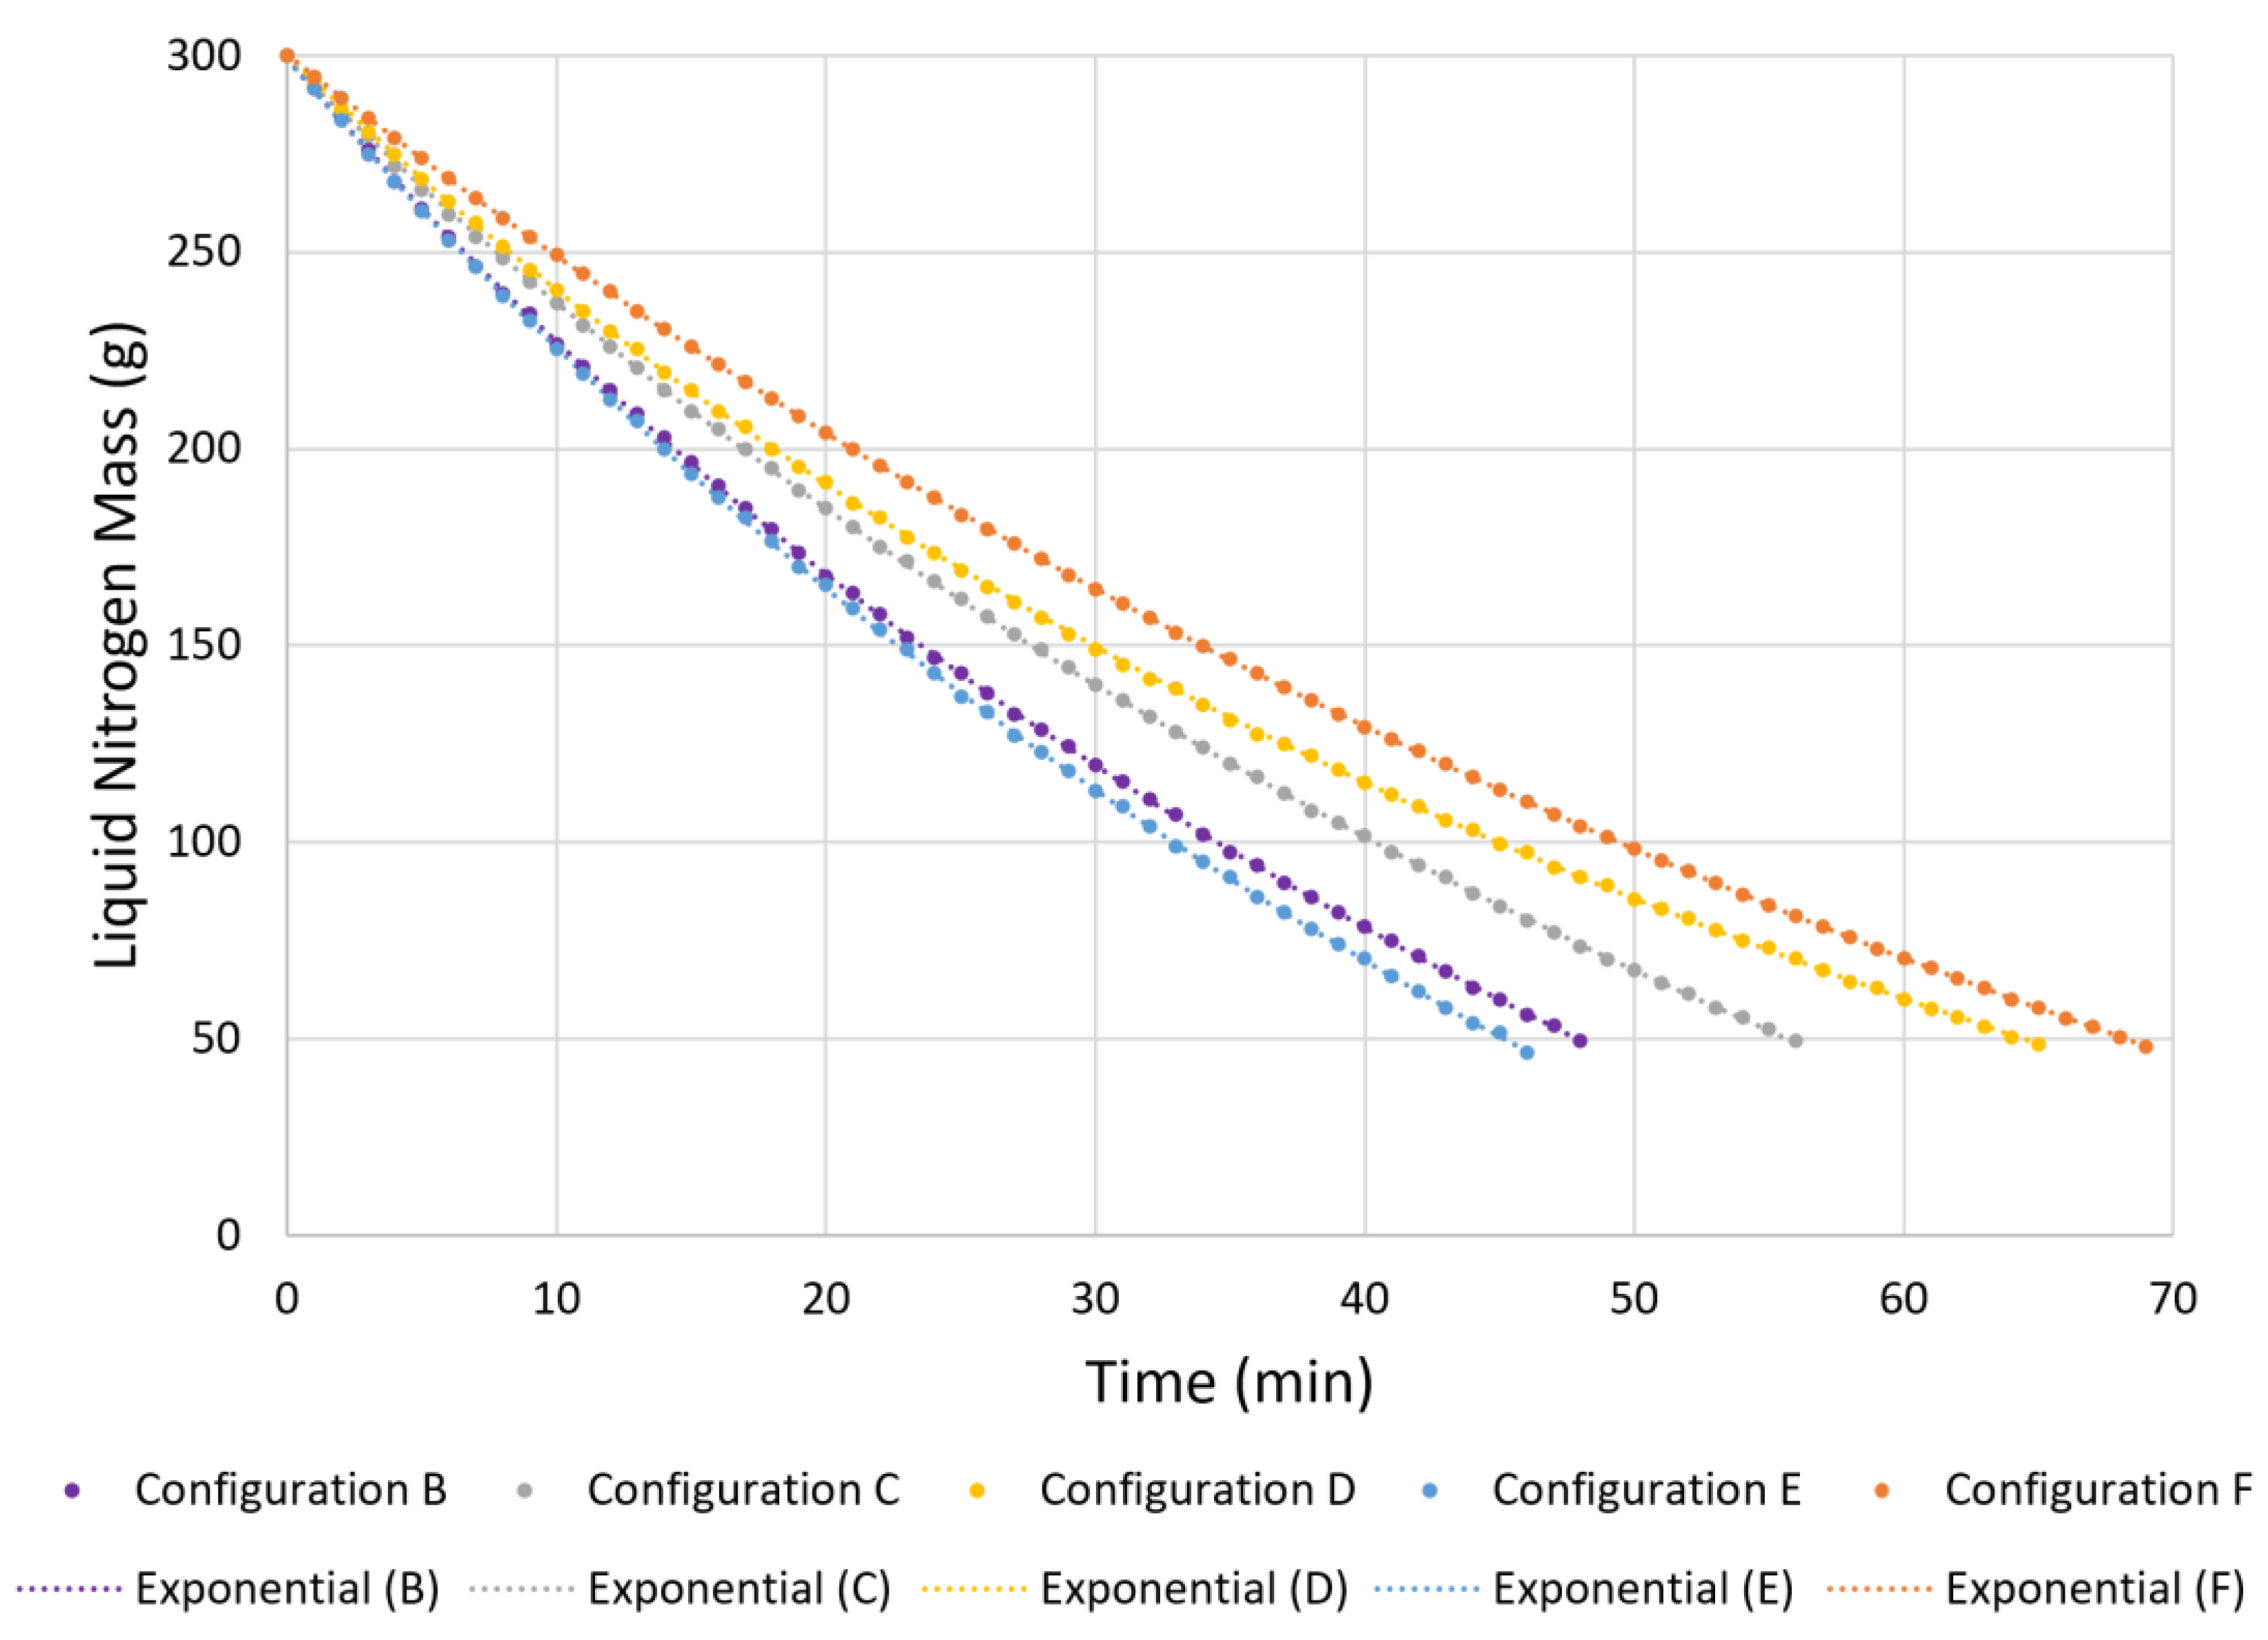
3. Results
4. Discussion
5. Conclusions
6. Patents
Author Contributions
Funding
Data Availability Statement
Acknowledgments
Conflicts of Interest
Appendix A

| Time (min) | Run 1 Mass (g) | Run 2 Mass (g) | Run 3 Mass (g) | Run 4 Mass (g) | Average Mass (g) | SD (g) |
|---|---|---|---|---|---|---|
| 0 | 300 | 300 | 300 | 300 | 300.0 | 0.0 |
| 10 | 294 | 294 | 294 | 294 | 294.0 | 0.0 |
| 20 | 290 | 288 | 288 | 288 | 288.5 | 1.0 |
| 30 | 282 | 282 | 284 | 284 | 283.0 | 1.2 |
| 40 | 276 | 276 | 278 | 276 | 276.5 | 1.0 |
| 50 | 270 | 272 | 272 | 272 | 271.5 | 1.0 |
| 60 | 264 | 266 | 266 | 266 | 265.5 | 1.0 |
| 70 | 260 | 260 | 260 | 260 | 260.0 | 0.0 |
| 80 | 254 | 256 | 256 | 256 | 255.5 | 1.0 |
| 90 | 248 | 250 | 250 | 252 | 250.0 | 1.6 |
| 100 | 244 | 244 | 244 | 246 | 244.5 | 1.0 |
| 110 | 238 | 240 | 240 | 242 | 240.0 | 1.6 |
| 120 | 234 | 234 | 234 | 236 | 234.5 | 1.0 |
| 130 | 228 | 228 | 230 | 230 | 229.0 | 1.2 |
| 140 | 222 | 224 | 224 | 226 | 224.0 | 1.6 |
| 150 | 218 | 218 | 218 | 222 | 219.0 | 2.0 |
| 160 | 214 | 214 | 214 | 216 | 214.5 | 1.0 |
| 170 | 208 | 210 | 210 | 212 | 210.0 | 1.6 |
| 180 | 202 | 206 | 204 | 208 | 205.0 | 2.6 |
| 190 | 200 | 200 | 200 | 202 | 200.5 | 1.0 |
| 200 | 194 | 196 | 196 | 198 | 196.0 | 1.6 |
| 210 | 190 | 190 | 190 | 194 | 191.0 | 2.0 |
| 220 | 186 | 186 | 186 | 188 | 186.5 | 1.0 |
| 230 | 180 | 182 | 182 | 184 | 182.0 | 1.6 |
| 240 | 176 | 178 | 176 | 180 | 177.5 | 1.9 |
| 250 | 172 | 174 | 174 | 176 | 174.0 | 1.6 |
| 260 | 168 | 170 | 168 | 170 | 169.0 | 1.2 |
| 270 | 164 | 164 | 164 | 166 | 164.5 | 1.0 |
| 280 | 158 | 160 | 160 | 162 | 160.0 | 1.6 |
| 290 | 154 | 156 | 156 | 158 | 156.0 | 1.6 |
| 300 | 150 | 152 | 152 | 152 | 151.5 | 1.0 |
| 310 | 146 | 148 | 146 | 148 | 147.0 | 1.2 |
| 320 | 142 | 144 | 144 | 144 | 143.5 | 1.0 |
| 330 | 138 | 138 | 138 | 140 | 138.5 | 1.0 |
| 340 | 132 | 136 | 134 | 136 | 134.5 | 1.9 |
| 350 | 130 | 130 | 132 | 132 | 131.0 | 1.2 |
| 360 | 124 | 128 | 126 | 128 | 126.5 | 1.9 |
| 370 | 120 | 124 | 124 | 124 | 123.0 | 2.0 |
| 380 | 118 | 120 | 120 | 120 | 119.5 | 1.0 |
| 390 | 112 | 116 | 116 | 116 | 115.0 | 2.0 |
| 400 | 110 | 110 | 112 | 112 | 111.0 | 1.2 |
| 410 | 104 | 108 | 106 | 108 | 106.5 | 1.9 |
| 420 | 100 | 104 | 104 | 104 | 103.0 | 2.0 |
| 430 | 98 | 100 | 100 | 102 | 100.0 | 1.6 |
| 440 | 94 | 96 | 96 | 96 | 95.5 | 1.0 |
| 450 | 90 | 92 | 92 | 92 | 91.5 | 1.0 |
| 460 | 86 | 88 | 90 | 90 | 88.5 | 1.9 |
| 470 | 84 | 84 | 84 | 86 | 84.5 | 1.0 |
| 480 | 80 | 80 | 82 | 82 | 81.0 | 1.2 |
| 490 | 76 | 78 | 78 | 78 | 77.5 | 1.0 |
| 500 | 72 | 74 | 74 | 76 | 74.0 | 1.6 |
| 510 | 68 | 68 | 70 | 72 | 69.5 | 1.9 |
| 520 | 66 | 66 | 68 | 68 | 67.0 | 1.2 |
| 530 | 62 | 64 | 64 | 66 | 64.0 | 1.6 |
| 540 | 58 | 60 | 60 | 60 | 59.5 | 1.0 |
| 550 | 54 | 56 | 56 | 56 | 55.5 | 1.0 |
| 560 | 50 | 52 | 52 | 54 | 52.0 | 1.6 |
| 570 | 48 | 50 | 48 | 50 | 49.0 | 1.2 |
| Time (min) | Run 1 Mass (g) | Run 2 Mass (g) | Run 3 Mass (g) | Run 4 Mass (g) | Average Mass (g) | SD (g) |
|---|---|---|---|---|---|---|
| 0 | 300 | 300 | 300 | 300 | 300.0 | 0.0 |
| 1 | 290 | 292 | 292 | 292 | 291.5 | 1.0 |
| 2 | 284 | 284 | 284 | 284 | 284.0 | 0.0 |
| 3 | 276 | 276 | 274 | 278 | 276.0 | 1.6 |
| 4 | 268 | 268 | 266 | 270 | 268.0 | 1.6 |
| 5 | 262 | 260 | 260 | 262 | 261.0 | 1.2 |
| 6 | 256 | 254 | 252 | 254 | 254.0 | 1.6 |
| 7 | 248 | 246 | 244 | 248 | 246.5 | 1.9 |
| 8 | 240 | 240 | 238 | 240 | 239.5 | 1.0 |
| 9 | 236 | 234 | 232 | 236 | 234.5 | 1.9 |
| 10 | 228 | 226 | 224 | 228 | 226.5 | 1.9 |
| 11 | 222 | 220 | 220 | 222 | 221.0 | 1.2 |
| 12 | 216 | 214 | 214 | 216 | 215.0 | 1.2 |
| 13 | 210 | 208 | 208 | 210 | 209.0 | 1.2 |
| 14 | 204 | 202 | 202 | 204 | 203.0 | 1.2 |
| 15 | 198 | 196 | 194 | 198 | 196.5 | 1.9 |
| 16 | 192 | 190 | 188 | 192 | 190.5 | 1.9 |
| 17 | 186 | 184 | 182 | 188 | 185.0 | 2.6 |
| 18 | 180 | 178 | 178 | 182 | 179.5 | 1.9 |
| 19 | 174 | 172 | 172 | 176 | 173.5 | 1.9 |
| 20 | 168 | 166 | 166 | 170 | 167.5 | 1.9 |
| 21 | 164 | 162 | 162 | 166 | 163.5 | 1.9 |
| 22 | 158 | 156 | 158 | 160 | 158.0 | 1.6 |
| 23 | 152 | 150 | 152 | 154 | 152.0 | 1.6 |
| 24 | 148 | 146 | 146 | 148 | 147.0 | 1.2 |
| 25 | 144 | 142 | 142 | 144 | 143.0 | 1.2 |
| 26 | 138 | 136 | 138 | 140 | 138.0 | 1.6 |
| 27 | 132 | 132 | 132 | 134 | 132.5 | 1.0 |
| 28 | 128 | 128 | 128 | 130 | 128.5 | 1.0 |
| 29 | 124 | 124 | 124 | 126 | 124.5 | 1.0 |
| 30 | 118 | 118 | 120 | 122 | 119.5 | 1.9 |
| 31 | 114 | 114 | 116 | 118 | 115.5 | 1.9 |
| 32 | 110 | 110 | 112 | 112 | 111.0 | 1.2 |
| 33 | 106 | 106 | 108 | 108 | 107.0 | 1.2 |
| 34 | 102 | 100 | 102 | 104 | 102.0 | 1.6 |
| 35 | 96 | 98 | 98 | 98 | 97.5 | 1.0 |
| 36 | 92 | 94 | 94 | 96 | 94.0 | 1.6 |
| 37 | 88 | 90 | 90 | 90 | 89.5 | 1.0 |
| 38 | 84 | 86 | 88 | 86 | 86.0 | 1.6 |
| 39 | 80 | 82 | 82 | 84 | 82.0 | 1.6 |
| 40 | 76 | 78 | 80 | 80 | 78.5 | 1.9 |
| 41 | 72 | 76 | 76 | 76 | 75.0 | 2.0 |
| 42 | 68 | 72 | 72 | 72 | 71.0 | 2.0 |
| 43 | 64 | 68 | 68 | 68 | 67.0 | 2.0 |
| 44 | 60 | 64 | 64 | 64 | 63.0 | 2.0 |
| 45 | 58 | 60 | 60 | 62 | 60.0 | 1.6 |
| 46 | 54 | 56 | 56 | 58 | 56.0 | 1.6 |
| 47 | 50 | 54 | 54 | 56 | 53.5 | 2.5 |
| 48 | 46 | 50 | 50 | 52 | 49.5 | 2.5 |
| Time (min) | Run 1 Mass (g) | Run 2 Mass (g) | Run 3 Mass (g) | Run 4 Mass (g) | Average Mass (g) | SD (g) |
|---|---|---|---|---|---|---|
| 0 | 300 | 300 | 300 | 300 | 300.0 | 0.0 |
| 1 | 294 | 294 | 294 | 292 | 293.5 | 1.0 |
| 2 | 286 | 288 | 286 | 284 | 286.0 | 1.6 |
| 3 | 280 | 282 | 280 | 276 | 279.5 | 2.5 |
| 4 | 274 | 274 | 272 | 268 | 272.0 | 2.8 |
| 5 | 266 | 270 | 266 | 262 | 266.0 | 3.3 |
| 6 | 260 | 262 | 260 | 256 | 259.5 | 2.5 |
| 7 | 254 | 256 | 256 | 250 | 254.0 | 2.8 |
| 8 | 248 | 250 | 250 | 246 | 248.5 | 1.9 |
| 9 | 242 | 244 | 244 | 240 | 242.5 | 1.9 |
| 10 | 236 | 240 | 238 | 234 | 237.0 | 2.6 |
| 11 | 232 | 234 | 232 | 228 | 231.5 | 2.5 |
| 12 | 226 | 228 | 226 | 224 | 226.0 | 1.6 |
| 13 | 220 | 222 | 222 | 218 | 220.5 | 1.9 |
| 14 | 214 | 216 | 216 | 214 | 215.0 | 1.2 |
| 15 | 208 | 210 | 212 | 208 | 209.5 | 1.9 |
| 16 | 204 | 206 | 206 | 204 | 205.0 | 1.2 |
| 17 | 198 | 200 | 202 | 200 | 200.0 | 1.6 |
| 18 | 194 | 194 | 196 | 196 | 195.0 | 1.2 |
| 19 | 188 | 190 | 190 | 190 | 189.5 | 1.0 |
| 20 | 184 | 184 | 186 | 186 | 185.0 | 1.2 |
| 21 | 180 | 180 | 180 | 180 | 180.0 | 0.0 |
| 22 | 174 | 174 | 176 | 176 | 175.0 | 1.2 |
| 23 | 170 | 170 | 174 | 172 | 171.5 | 1.9 |
| 24 | 166 | 164 | 168 | 168 | 166.5 | 1.9 |
| 25 | 160 | 160 | 164 | 164 | 162.0 | 2.3 |
| 26 | 156 | 156 | 158 | 160 | 157.5 | 1.9 |
| 27 | 152 | 150 | 154 | 156 | 153.0 | 2.6 |
| 28 | 148 | 148 | 148 | 152 | 149.0 | 2.0 |
| 29 | 144 | 142 | 146 | 146 | 144.5 | 1.9 |
| 30 | 138 | 138 | 142 | 142 | 140.0 | 2.3 |
| 31 | 134 | 134 | 138 | 138 | 136.0 | 2.3 |
| 32 | 132 | 130 | 132 | 134 | 132.0 | 1.6 |
| 33 | 126 | 126 | 130 | 130 | 128.0 | 2.3 |
| 34 | 122 | 122 | 126 | 126 | 124.0 | 2.3 |
| 35 | 118 | 118 | 122 | 122 | 120.0 | 2.3 |
| 36 | 116 | 114 | 118 | 118 | 116.5 | 1.9 |
| 37 | 112 | 110 | 114 | 114 | 112.5 | 1.9 |
| 38 | 106 | 106 | 110 | 110 | 108.0 | 2.3 |
| 39 | 104 | 102 | 106 | 108 | 105.0 | 2.6 |
| 40 | 100 | 100 | 102 | 104 | 101.5 | 1.9 |
| 41 | 96 | 96 | 98 | 100 | 97.5 | 1.9 |
| 42 | 92 | 92 | 96 | 96 | 94.0 | 2.3 |
| 43 | 90 | 88 | 92 | 94 | 91.0 | 2.6 |
| 44 | 86 | 84 | 90 | 88 | 87.0 | 2.6 |
| 45 | 82 | 82 | 84 | 86 | 83.5 | 1.9 |
| 46 | 78 | 78 | 82 | 82 | 80.0 | 2.3 |
| 47 | 76 | 74 | 78 | 80 | 77.0 | 2.6 |
| 48 | 72 | 72 | 74 | 76 | 73.5 | 1.9 |
| 49 | 70 | 68 | 70 | 72 | 70.0 | 1.6 |
| 50 | 66 | 66 | 68 | 70 | 67.5 | 1.9 |
| 51 | 62 | 62 | 66 | 66 | 64.0 | 2.3 |
| 52 | 60 | 60 | 62 | 64 | 61.5 | 1.9 |
| 53 | 56 | 56 | 60 | 60 | 58.0 | 2.3 |
| 54 | 54 | 54 | 56 | 58 | 55.5 | 1.9 |
| 55 | 50 | 52 | 54 | 54 | 52.5 | 1.9 |
| 56 | 48 | 48 | 50 | 52 | 49.5 | 1.9 |
| Time (min) | Run 1 Mass (g) | Run 2 Mass (g) | Run 3 Mass (g) | Run 4 Mass (g) | Average Mass (g) | SD (g) |
|---|---|---|---|---|---|---|
| 0 | 300 | 300 | 300 | 300 | 300.0 | 0.0 |
| 1 | 292 | 292 | 294 | 294 | 293.0 | 1.2 |
| 2 | 286 | 286 | 288 | 286 | 286.5 | 1.0 |
| 3 | 282 | 280 | 280 | 280 | 280.5 | 1.0 |
| 4 | 276 | 274 | 276 | 274 | 275.0 | 1.2 |
| 5 | 270 | 268 | 268 | 268 | 268.5 | 1.0 |
| 6 | 264 | 262 | 264 | 262 | 263.0 | 1.2 |
| 7 | 258 | 258 | 258 | 256 | 257.5 | 1.0 |
| 8 | 252 | 252 | 252 | 250 | 251.5 | 1.0 |
| 9 | 246 | 246 | 246 | 244 | 245.5 | 1.0 |
| 10 | 240 | 242 | 240 | 240 | 240.5 | 1.0 |
| 11 | 234 | 236 | 236 | 234 | 235.0 | 1.2 |
| 12 | 230 | 232 | 230 | 228 | 230.0 | 1.6 |
| 13 | 226 | 226 | 226 | 224 | 225.5 | 1.0 |
| 14 | 220 | 220 | 220 | 218 | 219.5 | 1.0 |
| 15 | 214 | 216 | 216 | 214 | 215.0 | 1.2 |
| 16 | 210 | 210 | 210 | 208 | 209.5 | 1.0 |
| 17 | 206 | 206 | 206 | 204 | 205.5 | 1.0 |
| 18 | 200 | 200 | 200 | 200 | 200.0 | 0.0 |
| 19 | 196 | 196 | 196 | 194 | 195.5 | 1.0 |
| 20 | 192 | 192 | 192 | 190 | 191.5 | 1.0 |
| 21 | 186 | 186 | 186 | 186 | 186.0 | 0.0 |
| 22 | 182 | 184 | 182 | 182 | 182.5 | 1.0 |
| 23 | 178 | 178 | 178 | 176 | 177.5 | 1.0 |
| 24 | 172 | 174 | 176 | 172 | 173.5 | 1.9 |
| 25 | 168 | 170 | 170 | 168 | 169.0 | 1.2 |
| 26 | 164 | 166 | 166 | 164 | 165.0 | 1.2 |
| 27 | 160 | 162 | 162 | 160 | 161.0 | 1.2 |
| 28 | 156 | 158 | 158 | 156 | 157.0 | 1.2 |
| 29 | 152 | 154 | 154 | 152 | 153.0 | 1.2 |
| 30 | 148 | 150 | 150 | 148 | 149.0 | 1.2 |
| 31 | 144 | 146 | 146 | 144 | 145.0 | 1.2 |
| 32 | 142 | 142 | 142 | 140 | 141.5 | 1.0 |
| 33 | 138 | 140 | 140 | 138 | 139.0 | 1.2 |
| 34 | 134 | 136 | 136 | 134 | 135.0 | 1.2 |
| 35 | 130 | 132 | 132 | 130 | 131.0 | 1.2 |
| 36 | 128 | 128 | 128 | 126 | 127.5 | 1.0 |
| 37 | 124 | 126 | 126 | 124 | 125.0 | 1.2 |
| 38 | 122 | 122 | 124 | 120 | 122.0 | 1.6 |
| 39 | 118 | 120 | 120 | 116 | 118.5 | 1.9 |
| 40 | 114 | 116 | 116 | 114 | 115.0 | 1.2 |
| 41 | 112 | 114 | 112 | 110 | 112.0 | 1.6 |
| 42 | 108 | 110 | 110 | 108 | 109.0 | 1.2 |
| 43 | 106 | 106 | 106 | 104 | 105.5 | 1.0 |
| 44 | 102 | 104 | 104 | 102 | 103.0 | 1.2 |
| 45 | 100 | 100 | 100 | 98 | 99.5 | 1.0 |
| 46 | 98 | 98 | 98 | 96 | 97.5 | 1.0 |
| 47 | 94 | 94 | 94 | 92 | 93.5 | 1.0 |
| 48 | 90 | 92 | 92 | 90 | 91.0 | 1.2 |
| 49 | 88 | 90 | 90 | 88 | 89.0 | 1.2 |
| 50 | 86 | 86 | 86 | 84 | 85.5 | 1.0 |
| 51 | 82 | 84 | 84 | 82 | 83.0 | 1.2 |
| 52 | 80 | 80 | 82 | 80 | 80.5 | 1.0 |
| 53 | 78 | 78 | 78 | 76 | 77.5 | 1.0 |
| 54 | 74 | 76 | 76 | 74 | 75.0 | 1.2 |
| 55 | 72 | 74 | 74 | 72 | 73.0 | 1.2 |
| 56 | 70 | 72 | 72 | 68 | 70.5 | 1.9 |
| 57 | 66 | 68 | 70 | 66 | 67.5 | 1.9 |
| 58 | 64 | 66 | 66 | 62 | 64.5 | 1.9 |
| 59 | 64 | 64 | 64 | 60 | 63.0 | 2.0 |
| 60 | 60 | 60 | 62 | 58 | 60.0 | 1.6 |
| 61 | 58 | 58 | 58 | 56 | 57.5 | 1.0 |
| 62 | 56 | 56 | 56 | 54 | 55.5 | 1.0 |
| 63 | 52 | 54 | 54 | 52 | 53.0 | 1.2 |
| 64 | 50 | 52 | 52 | 48 | 50.5 | 1.9 |
| 65 | 48 | 50 | 48 | 48 | 48.5 | 1.0 |
| Time (min) | Run 1 Mass (g) | Run 2 Mass (g) | Run 3 Mass (g) | Run 4 Mass (g) | Average Mass (g) | SD (g) |
|---|---|---|---|---|---|---|
| 0 | 300 | 300 | 300 | 300 | 300.0 | 0.0 |
| 1 | 292 | 290 | 292 | 292 | 291.5 | 1.0 |
| 2 | 284 | 282 | 284 | 284 | 283.5 | 1.0 |
| 3 | 276 | 274 | 276 | 274 | 275.0 | 1.2 |
| 4 | 270 | 266 | 270 | 266 | 268.0 | 2.3 |
| 5 | 262 | 258 | 262 | 260 | 260.5 | 1.9 |
| 6 | 254 | 252 | 254 | 252 | 253.0 | 1.2 |
| 7 | 248 | 244 | 248 | 246 | 246.5 | 1.9 |
| 8 | 240 | 238 | 240 | 238 | 239.0 | 1.2 |
| 9 | 234 | 230 | 234 | 232 | 232.5 | 1.9 |
| 10 | 228 | 224 | 226 | 224 | 225.5 | 1.9 |
| 11 | 220 | 218 | 220 | 218 | 219.0 | 1.2 |
| 12 | 214 | 210 | 214 | 212 | 212.5 | 1.9 |
| 13 | 208 | 206 | 208 | 206 | 207.0 | 1.2 |
| 14 | 200 | 200 | 200 | 200 | 200.0 | 0.0 |
| 15 | 194 | 192 | 194 | 194 | 193.5 | 1.0 |
| 16 | 188 | 186 | 188 | 188 | 187.5 | 1.0 |
| 17 | 184 | 180 | 184 | 182 | 182.5 | 1.9 |
| 18 | 178 | 174 | 178 | 176 | 176.5 | 1.9 |
| 19 | 170 | 168 | 172 | 170 | 170.0 | 1.6 |
| 20 | 166 | 164 | 166 | 166 | 165.5 | 1.0 |
| 21 | 160 | 158 | 160 | 160 | 159.5 | 1.0 |
| 22 | 154 | 152 | 156 | 154 | 154.0 | 1.6 |
| 23 | 150 | 146 | 150 | 150 | 149.0 | 2.0 |
| 24 | 144 | 140 | 144 | 144 | 143.0 | 2.0 |
| 25 | 138 | 134 | 138 | 138 | 137.0 | 2.0 |
| 26 | 134 | 130 | 134 | 134 | 133.0 | 2.0 |
| 27 | 128 | 124 | 128 | 128 | 127.0 | 2.0 |
| 28 | 124 | 120 | 124 | 124 | 123.0 | 2.0 |
| 29 | 118 | 116 | 120 | 118 | 118.0 | 1.6 |
| 30 | 114 | 110 | 114 | 114 | 113.0 | 2.0 |
| 31 | 108 | 106 | 112 | 110 | 109.0 | 2.6 |
| 32 | 104 | 100 | 106 | 106 | 104.0 | 2.8 |
| 33 | 100 | 96 | 100 | 100 | 99.0 | 2.0 |
| 34 | 96 | 92 | 96 | 96 | 95.0 | 2.0 |
| 35 | 92 | 88 | 92 | 92 | 91.0 | 2.0 |
| 36 | 86 | 84 | 86 | 88 | 86.0 | 1.6 |
| 37 | 82 | 80 | 82 | 84 | 82.0 | 1.6 |
| 38 | 78 | 76 | 78 | 80 | 78.0 | 1.6 |
| 39 | 74 | 72 | 74 | 76 | 74.0 | 1.6 |
| 40 | 72 | 68 | 70 | 72 | 70.5 | 1.9 |
| 41 | 66 | 64 | 66 | 68 | 66.0 | 1.6 |
| 42 | 62 | 60 | 62 | 64 | 62.0 | 1.6 |
| 43 | 58 | 56 | 58 | 60 | 58.0 | 1.6 |
| 44 | 54 | 52 | 54 | 56 | 54.0 | 1.6 |
| 45 | 52 | 50 | 50 | 54 | 51.5 | 1.9 |
| 46 | 46 | 46 | 46 | 48 | 46.5 | 1.0 |
| Time (min) | Run 1 Mass (g) | Run 2 Mass (g) | Run 3 Mass (g) | Run 4 Mass (g) | Average Mass (g) | SD (g) |
|---|---|---|---|---|---|---|
| 0 | 300 | 300 | 300 | 300 | 300.0 | 0.0 |
| 1 | 295 | 294 | 295 | 295 | 294.8 | 0.5 |
| 2 | 289 | 289 | 289 | 290 | 289.3 | 0.5 |
| 3 | 285 | 284 | 284 | 284 | 284.3 | 0.5 |
| 4 | 279 | 279 | 279 | 279 | 279.0 | 0.0 |
| 5 | 274 | 275 | 273 | 274 | 274.0 | 0.8 |
| 6 | 269 | 269 | 269 | 269 | 269.0 | 0.0 |
| 7 | 264 | 265 | 263 | 263 | 263.8 | 1.0 |
| 8 | 259 | 260 | 258 | 258 | 258.8 | 1.0 |
| 9 | 254 | 255 | 253 | 253 | 253.8 | 1.0 |
| 10 | 250 | 250 | 249 | 248 | 249.3 | 1.0 |
| 11 | 245 | 246 | 244 | 243 | 244.5 | 1.3 |
| 12 | 240 | 241 | 240 | 239 | 240.0 | 0.8 |
| 13 | 235 | 236 | 235 | 234 | 235.0 | 0.8 |
| 14 | 231 | 232 | 230 | 229 | 230.5 | 1.3 |
| 15 | 226 | 228 | 226 | 224 | 226.0 | 1.6 |
| 16 | 222 | 223 | 221 | 220 | 221.5 | 1.3 |
| 17 | 217 | 219 | 217 | 215 | 217.0 | 1.6 |
| 18 | 212 | 215 | 213 | 211 | 212.8 | 1.7 |
| 19 | 208 | 210 | 208 | 207 | 208.3 | 1.3 |
| 20 | 204 | 206 | 204 | 202 | 204.0 | 1.6 |
| 21 | 200 | 202 | 200 | 198 | 200.0 | 1.6 |
| 22 | 195 | 198 | 196 | 194 | 195.8 | 1.7 |
| 23 | 191 | 193 | 192 | 190 | 191.5 | 1.3 |
| 24 | 187 | 189 | 188 | 186 | 187.5 | 1.3 |
| 25 | 183 | 185 | 183 | 182 | 183.3 | 1.3 |
| 26 | 179 | 181 | 180 | 178 | 179.5 | 1.3 |
| 27 | 175 | 178 | 176 | 175 | 176.0 | 1.4 |
| 28 | 171 | 174 | 172 | 171 | 172.0 | 1.4 |
| 29 | 167 | 170 | 168 | 167 | 168.0 | 1.4 |
| 30 | 163 | 166 | 164 | 164 | 164.3 | 1.3 |
| 31 | 160 | 162 | 161 | 160 | 160.8 | 1.0 |
| 32 | 156 | 159 | 157 | 156 | 157.0 | 1.4 |
| 33 | 152 | 155 | 153 | 153 | 153.3 | 1.3 |
| 34 | 149 | 151 | 150 | 149 | 149.8 | 1.0 |
| 35 | 146 | 148 | 146 | 146 | 146.5 | 1.0 |
| 36 | 142 | 145 | 143 | 142 | 143.0 | 1.4 |
| 37 | 138 | 141 | 139 | 139 | 139.3 | 1.3 |
| 38 | 135 | 138 | 136 | 135 | 136.0 | 1.4 |
| 39 | 132 | 134 | 132 | 132 | 132.5 | 1.0 |
| 40 | 128 | 131 | 129 | 129 | 129.3 | 1.3 |
| 41 | 125 | 128 | 126 | 126 | 126.3 | 1.3 |
| 42 | 122 | 125 | 123 | 123 | 123.3 | 1.3 |
| 43 | 119 | 121 | 120 | 119 | 119.8 | 1.0 |
| 44 | 115 | 118 | 117 | 116 | 116.5 | 1.3 |
| 45 | 112 | 115 | 113 | 113 | 113.3 | 1.3 |
| 46 | 109 | 112 | 110 | 110 | 110.3 | 1.3 |
| 47 | 106 | 108 | 107 | 107 | 107.0 | 0.8 |
| 48 | 103 | 105 | 104 | 104 | 104.0 | 0.8 |
| 49 | 100 | 103 | 101 | 101 | 101.3 | 1.3 |
| 50 | 97 | 100 | 98 | 98 | 98.3 | 1.3 |
| 51 | 94 | 97 | 95 | 95 | 95.3 | 1.3 |
| 52 | 91 | 94 | 92 | 93 | 92.5 | 1.3 |
| 53 | 89 | 91 | 89 | 90 | 89.8 | 1.0 |
| 54 | 86 | 88 | 86 | 87 | 86.8 | 1.0 |
| 55 | 83 | 85 | 84 | 84 | 84.0 | 0.8 |
| 56 | 80 | 83 | 81 | 81 | 81.3 | 1.3 |
| 57 | 77 | 80 | 78 | 79 | 78.5 | 1.3 |
| 58 | 75 | 77 | 75 | 76 | 75.8 | 1.0 |
| 59 | 72 | 74 | 72 | 73 | 72.8 | 1.0 |
| 60 | 69 | 72 | 70 | 71 | 70.5 | 1.3 |
| 61 | 67 | 69 | 67 | 69 | 68.0 | 1.2 |
| 62 | 65 | 66 | 64 | 66 | 65.3 | 1.0 |
| 63 | 62 | 64 | 62 | 64 | 63.0 | 1.2 |
| 64 | 59 | 61 | 59 | 61 | 60.0 | 1.2 |
| 65 | 57 | 59 | 57 | 59 | 58.0 | 1.2 |
| 66 | 54 | 56 | 54 | 57 | 55.3 | 1.5 |
| 67 | 52 | 54 | 52 | 54 | 53.0 | 1.2 |
| 68 | 50 | 51 | 49 | 52 | 50.5 | 1.3 |
| 69 | 47 | 49 | 47 | 49 | 48.0 | 1.2 |
References
- Padmanaban, S.; Nithiyananthan, K.; Karthikeyan, S.P.; Holm-Nielsen, J.B. Microgrids, 1st ed.; CRC Press: Boca Raton, FL, USA, 2020; ISBN 978-0-367-81592-9. [Google Scholar]
- Raya-Armenta, J.M.; Bazmohammadi, N.; Avina-Cervantes, J.G.; Sáez, D.; Vasquez, J.C.; Guerrero, J.M. Energy Management System Optimization in Islanded Microgrids: An Overview and Future Trends. Renew. Sustain. Energy Rev. 2021, 149, 111327. [Google Scholar] [CrossRef]
- Haerer, R. Whack-a-Mole Fuel Selection: Reducing Operational Risks and Mitigating New Challenges in the US Department of Defense. Climate and Security Fellowship Program, 2021. Available online: https://climateandsecurity.org/wp-content/uploads/2021/10/Climate-Security-Risk-Briefers_Climate-and-Security-Fellows-Program_October-2021-1.pdf#page=27 (accessed on 6 November 2022).
- Ton, D.T.; Smith, M.A. The U.S. Department of Energy’s Microgrid Initiative. Electr. J. 2012, 25, 84–94. [Google Scholar] [CrossRef]
- Holdmann, G.P.; Wies, R.W.; Vandermeer, J.B. Renewable Energy Integration in Alaska’s Remote Islanded Microgrids: Economic Drivers, Technical Strategies, Technological Niche Development, and Policy Implications. Proc. IEEE 2019, 107, 1820–1837. [Google Scholar] [CrossRef]
- Van Broekhoven, S.; Judson, N.; Galvin, J.; Marqusee, J. Leading the Charge: Microgrids for Domestic Military Installations. IEEE Power Energy Mag. 2013, 11, 40–45. [Google Scholar] [CrossRef]
- Kafetzis, A.; Ziogou, C.; Panopoulos, K.D.; Papadopoulou, S.; Seferlis, P.; Voutetakis, S. Energy Management Strategies Based on Hybrid Automata for Islanded Microgrids with Renewable Sources, Batteries and Hydrogen. Renew. Sustain. Energy Rev. 2020, 134, 110118. [Google Scholar] [CrossRef]
- Ganesan, S.; Subramaniam, U.; Ghodke, A.A.; Elavarasan, R.M.; Raju, K.; Bhaskar, M.S. Investigation on Sizing of Voltage Source for a Battery Energy Storage System in Microgrid With Renewable Energy Sources. IEEE Access 2020, 8, 188861–188874. [Google Scholar] [CrossRef]
- Liu, J.; Chen, H.; Zhang, W.; Yurkovich, B.; Rizzoni, G. Energy Management Problems Under Uncertainties for Grid-Connected Microgrids: A Chance Constrained Programming Approach. IEEE Trans. Smart Grid 2017, 8, 2585–2596. [Google Scholar] [CrossRef]
- Ismail, M.S.; Moghavvemi, M.; Mahlia, T.M.I.; Muttaqi, K.M.; Moghavvemi, S. Effective Utilization of Excess Energy in Standalone Hybrid Renewable Energy Systems for Improving Comfort Ability and Reducing Cost of Energy: A Review and Analysis. Renew. Sustain. Energy Rev. 2015, 42, 726–734. [Google Scholar] [CrossRef] [Green Version]
- Altin, M.; Hansen, A.D.; Barlas, T.K.; Das, K.; Sakamuri, J.N. Optimization of Short-Term Overproduction Response of Variable Speed Wind Turbines. IEEE Trans. Sustain. Energy 2018, 9, 1732–1739. [Google Scholar] [CrossRef]
- Rahman, M.M.; Oni, A.O.; Gemechu, E.; Kumar, A. Assessment of Energy Storage Technologies: A Review. Energy Convers. Manag. 2020, 223, 113295. [Google Scholar] [CrossRef]
- Koohi-Fayegh, S.; Rosen, M.A. A Review of Energy Storage Types, Applications and Recent Developments. J. Energy Storage 2020, 27, 101047. [Google Scholar] [CrossRef]
- Musolino, V.; Pievatolo, A.; Tironi, E. A Statistical Approach to Electrical Storage Sizing with Application to the Recovery of Braking Energy. Energy 2011, 36, 6697–6704. [Google Scholar] [CrossRef]
- O’Callaghan, O.; Donnellan, P. Liquid Air Energy Storage Systems: A Review. Renew. Sustain. Energy Rev. 2021, 146, 111113. [Google Scholar] [CrossRef]
- Damak, C.; Leducq, D.; Hoang, H.M.; Negro, D.; Delahaye, A. Liquid Air Energy Storage (LAES) as a Large-Scale Storage Technology for Renewable Energy Integration—A Review of Investigation Studies and near Perspectives of LAES. Int. J. Refrig. 2020, 110, 208–218. [Google Scholar] [CrossRef]
- Borri, E.; Tafone, A.; Romagnoli, A.; Comodi, G. A Review on Liquid Air Energy Storage: History, State of the Art and Recent Developments. Renew. Sustain. Energy Rev. 2021, 137, 110572. [Google Scholar] [CrossRef]
- Wang, S.X.; Xue, X.D.; Zhang, X.L.; Guo, J.; Zhou, Y.; Wang, J.J. The Application of Cryogens in Liquid Fluid Energy Storage Systems. Phys. Procedia 2015, 67, 728–732. [Google Scholar] [CrossRef] [Green Version]
- Benato, A.; Stoppato, A. Pumped Thermal Electricity Storage: A Technology Overview. Therm. Sci. Eng. Prog. 2018, 6, 301–315. [Google Scholar] [CrossRef]
- Joshi, D.M.; Patel, H.K. Analysis of Cryogenic Cycle with Process Modeling Tool: Aspen HYSYS. J. Instrum. 2015, 10, T10001. [Google Scholar] [CrossRef]
- Howe, T.A.; Pollman, A.G.; Gannon, A.J. Operating Range for a Combined, Building-Scale Liquid Air Energy Storage and Expansion System: Energy and Exergy Analysis. Entropy 2018, 20, 770. [Google Scholar] [CrossRef] [Green Version]
- Willis, R.; Pollman, A.; Gannon, A.; Hernandez, A. Preliminary Modeling of a Building-Scale Liquid Air Energy Storage Systems Using Aspen HYSYS. In Proceedings of the 2018 MORS Symposium, Monterey, CA, USA, 18–21 June 2018. [Google Scholar]
- Girouard, C.; Pollman, A.; Hernandez, A. Modeling and Simulation Informed Conceptual Design, Analysis, and Initial Component Selection of A Supply-Side Building Scale Laes System for Renewable, Islanded Microgrid Resiliency. In Proceedings of the 87th Military Operations Society Symposium, Colorado Springs, CO, USA, 17–20 June 2019. [Google Scholar]
- Fredrickson, A.; Pollman, A.; Gannon, A.; Smith, W. Selection of a Heat Exchanger for a Small-Scale Liquid Air Energy Storage System. In Proceedings of the ASME 2021 Power Conference, Anaheim, CA, USA, 20–22 July 2021. [Google Scholar]
- Swanson, H.M.; Pollman, A.G.; Hernandez, A. Experimental Evaluation of Dewar Volume and Cryocooler Cold Finger Size in a Small-Scale Stirling Liquid Air Energy Storage (LAES) System. In Proceedings of the ASME 2021 Power Conference, Virtual, 20–22 July 2021. [Google Scholar]
- Torosyan, M.; Pollman, A.; Gannon, A.; Hernandez, A. Performance and Complexity Trade Study of Candidate Liquid Air Generation Techniques. In Proceedings of the ASME 2021 Power Conference, Virtual, 20–22 July 2021. [Google Scholar]
- Bailey, N.A.; Girouard, C.M.; Pollman, A.G. Dual Stirling Cycle Liquid Air Battery. U. S. Patent 20220042478A1, 10 February 2022. [Google Scholar]
- Arnold, S.; Fackrell, C.; Horton, D.; Pollman, A.; Smeeks, F.; Sweet, J. Need, Function, and Requirements Analysis for Liquid Air Energy Storage Prototype on a Military Microgrid. In Proceedings of the MORS Symposium, Quantico, VA, USA, 13–16 June 2022. [Google Scholar]
- Lobunets, Y. Thermoelectric Generator for Utilizing Cold Energy of Cryogen Liquids. J. Electron. Mater. 2019, 48, 5491–5496. [Google Scholar] [CrossRef]
- Barron, R.; Nellis, G. Cryogenic Heat Transfer, 2nd ed.; CRC Press: Boca Raton, FL, USA, 2016; ISBN 978-1-4822-2744-4. [Google Scholar]
- Bostock, T.D.; Scurlock, R.G. Low-Loss Storage and Handling of Cryogenic Liquids: The Application of Cryogenic Fluid Dynamics; Springer: Berlin, Germany, 2019; ISBN 978-3-030-10641-6. [Google Scholar]
- Lynam, P.; Mustafa, A.; Proctor, W.; Scurlock, R. Reduction of the Heat Flux into Liquid Helium in Wide Necked Metal Dewars. Cryogenics 1969, 9, 242–247. [Google Scholar] [CrossRef]
- Swartz, E.T. Efficient Cryogenic Design, a System Approach. J. Low Temp. Phys. 1995, 101, 249–252. [Google Scholar] [CrossRef]
- Bailey, N.A.; Pollman, A.G.; Paulo, E.P. Energy Recovery for Dual-Stirling Liquid Air Energy Storage Prototype. In Proceedings of the ASME 2020 Power Conference collocated with the 2020 International Conference on Nuclear Engineering, Virtual, 4–5 August 2020. [Google Scholar]
- National Institute of Standards and Technology. Available online: https://www.nist.gov/ (accessed on 16 August 2022).


| Experimental Dewar Configuration | Description |
|---|---|
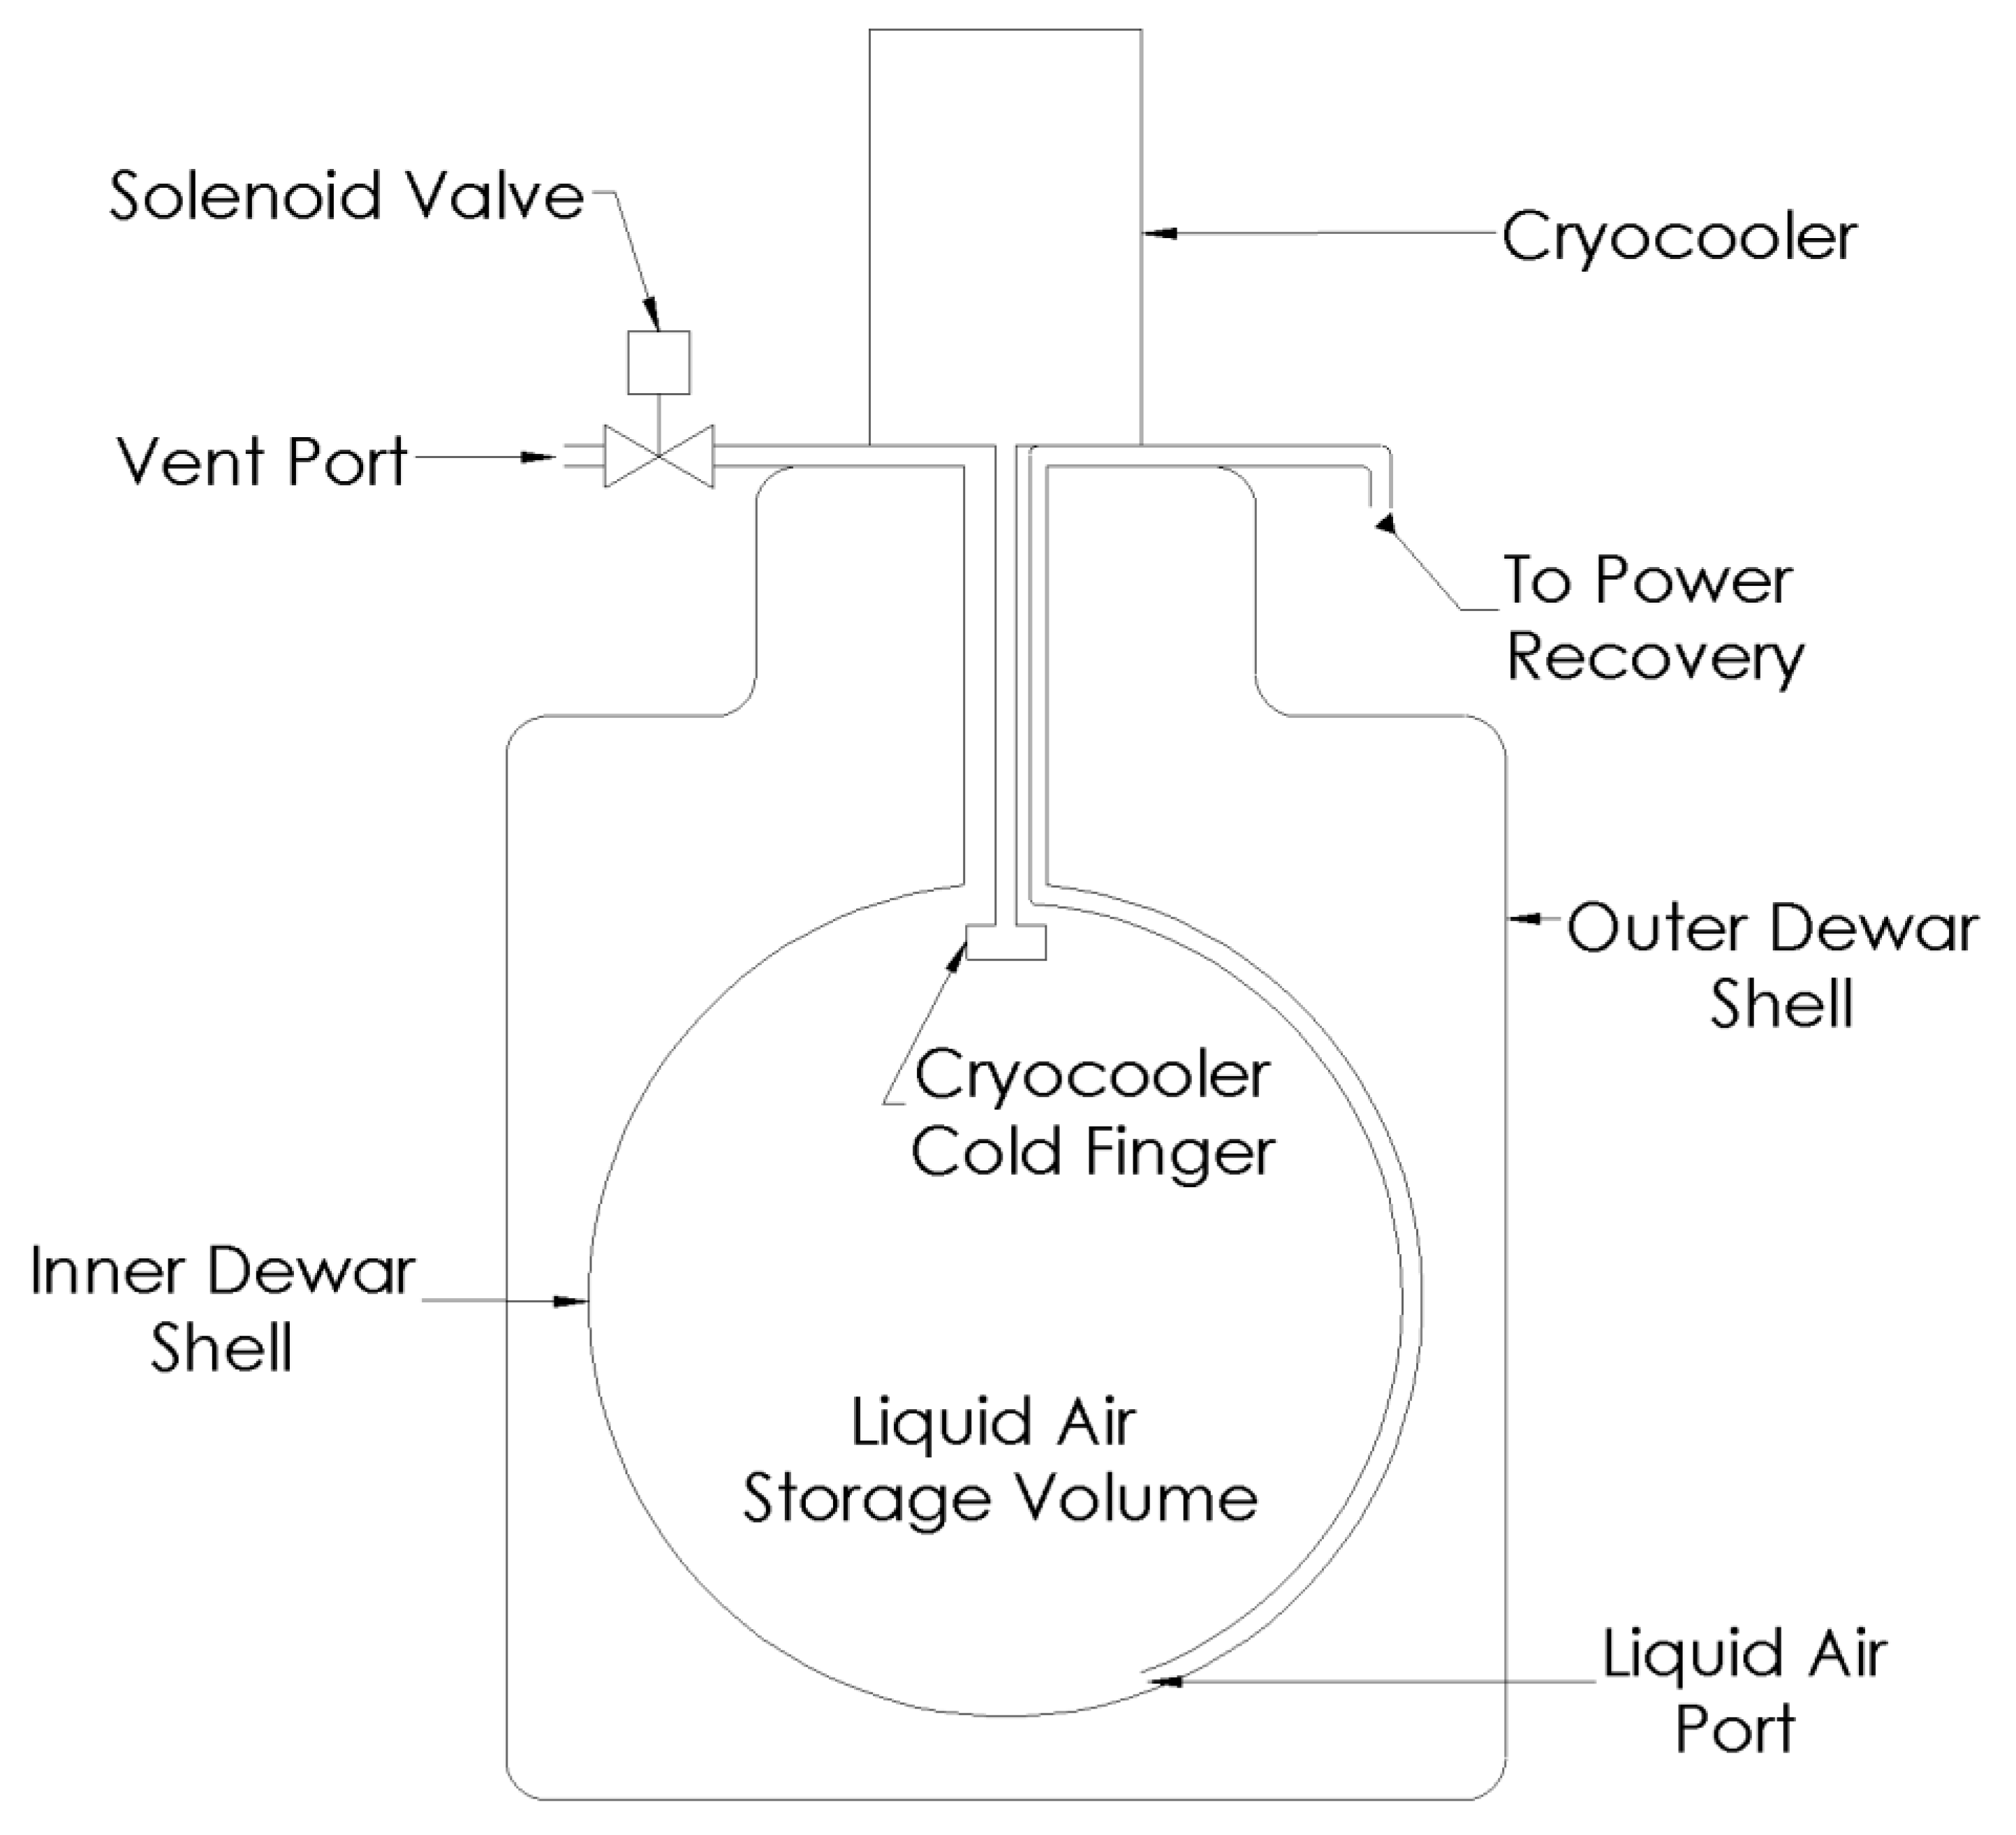
| A | Baseline 473 mL Hydro Flask TempShield bottle-Dewar with no modification. Contains a vacuum jacket. |
| B | Modified baseline bottle-Dewar with a hole in the bottom outer shell and no vacuum jacket. |
| C | Modified baseline bottle-Dewar with a hole in the bottom outer and inner shells, a bottom mounted capped brass fitting that does not have metal-metal conduction to the outer bottle-Dewar shell, and no vacuum jacket. |
| D | Modified baseline bottle-Dewar with a capped threaded Teflon fastener penetrating the bottom outer and inner shells with no vacuum jacket. |
| E | Modified baseline bottle-Dewar with a capped threaded brass fastener penetrating the bottom outer and inner shells with no vacuum jacket. |
| F | Modified baseline bottle-Dewar with a capped threaded brass fastener penetrating the bottom outer and inner shells with a vacuum jacket. |
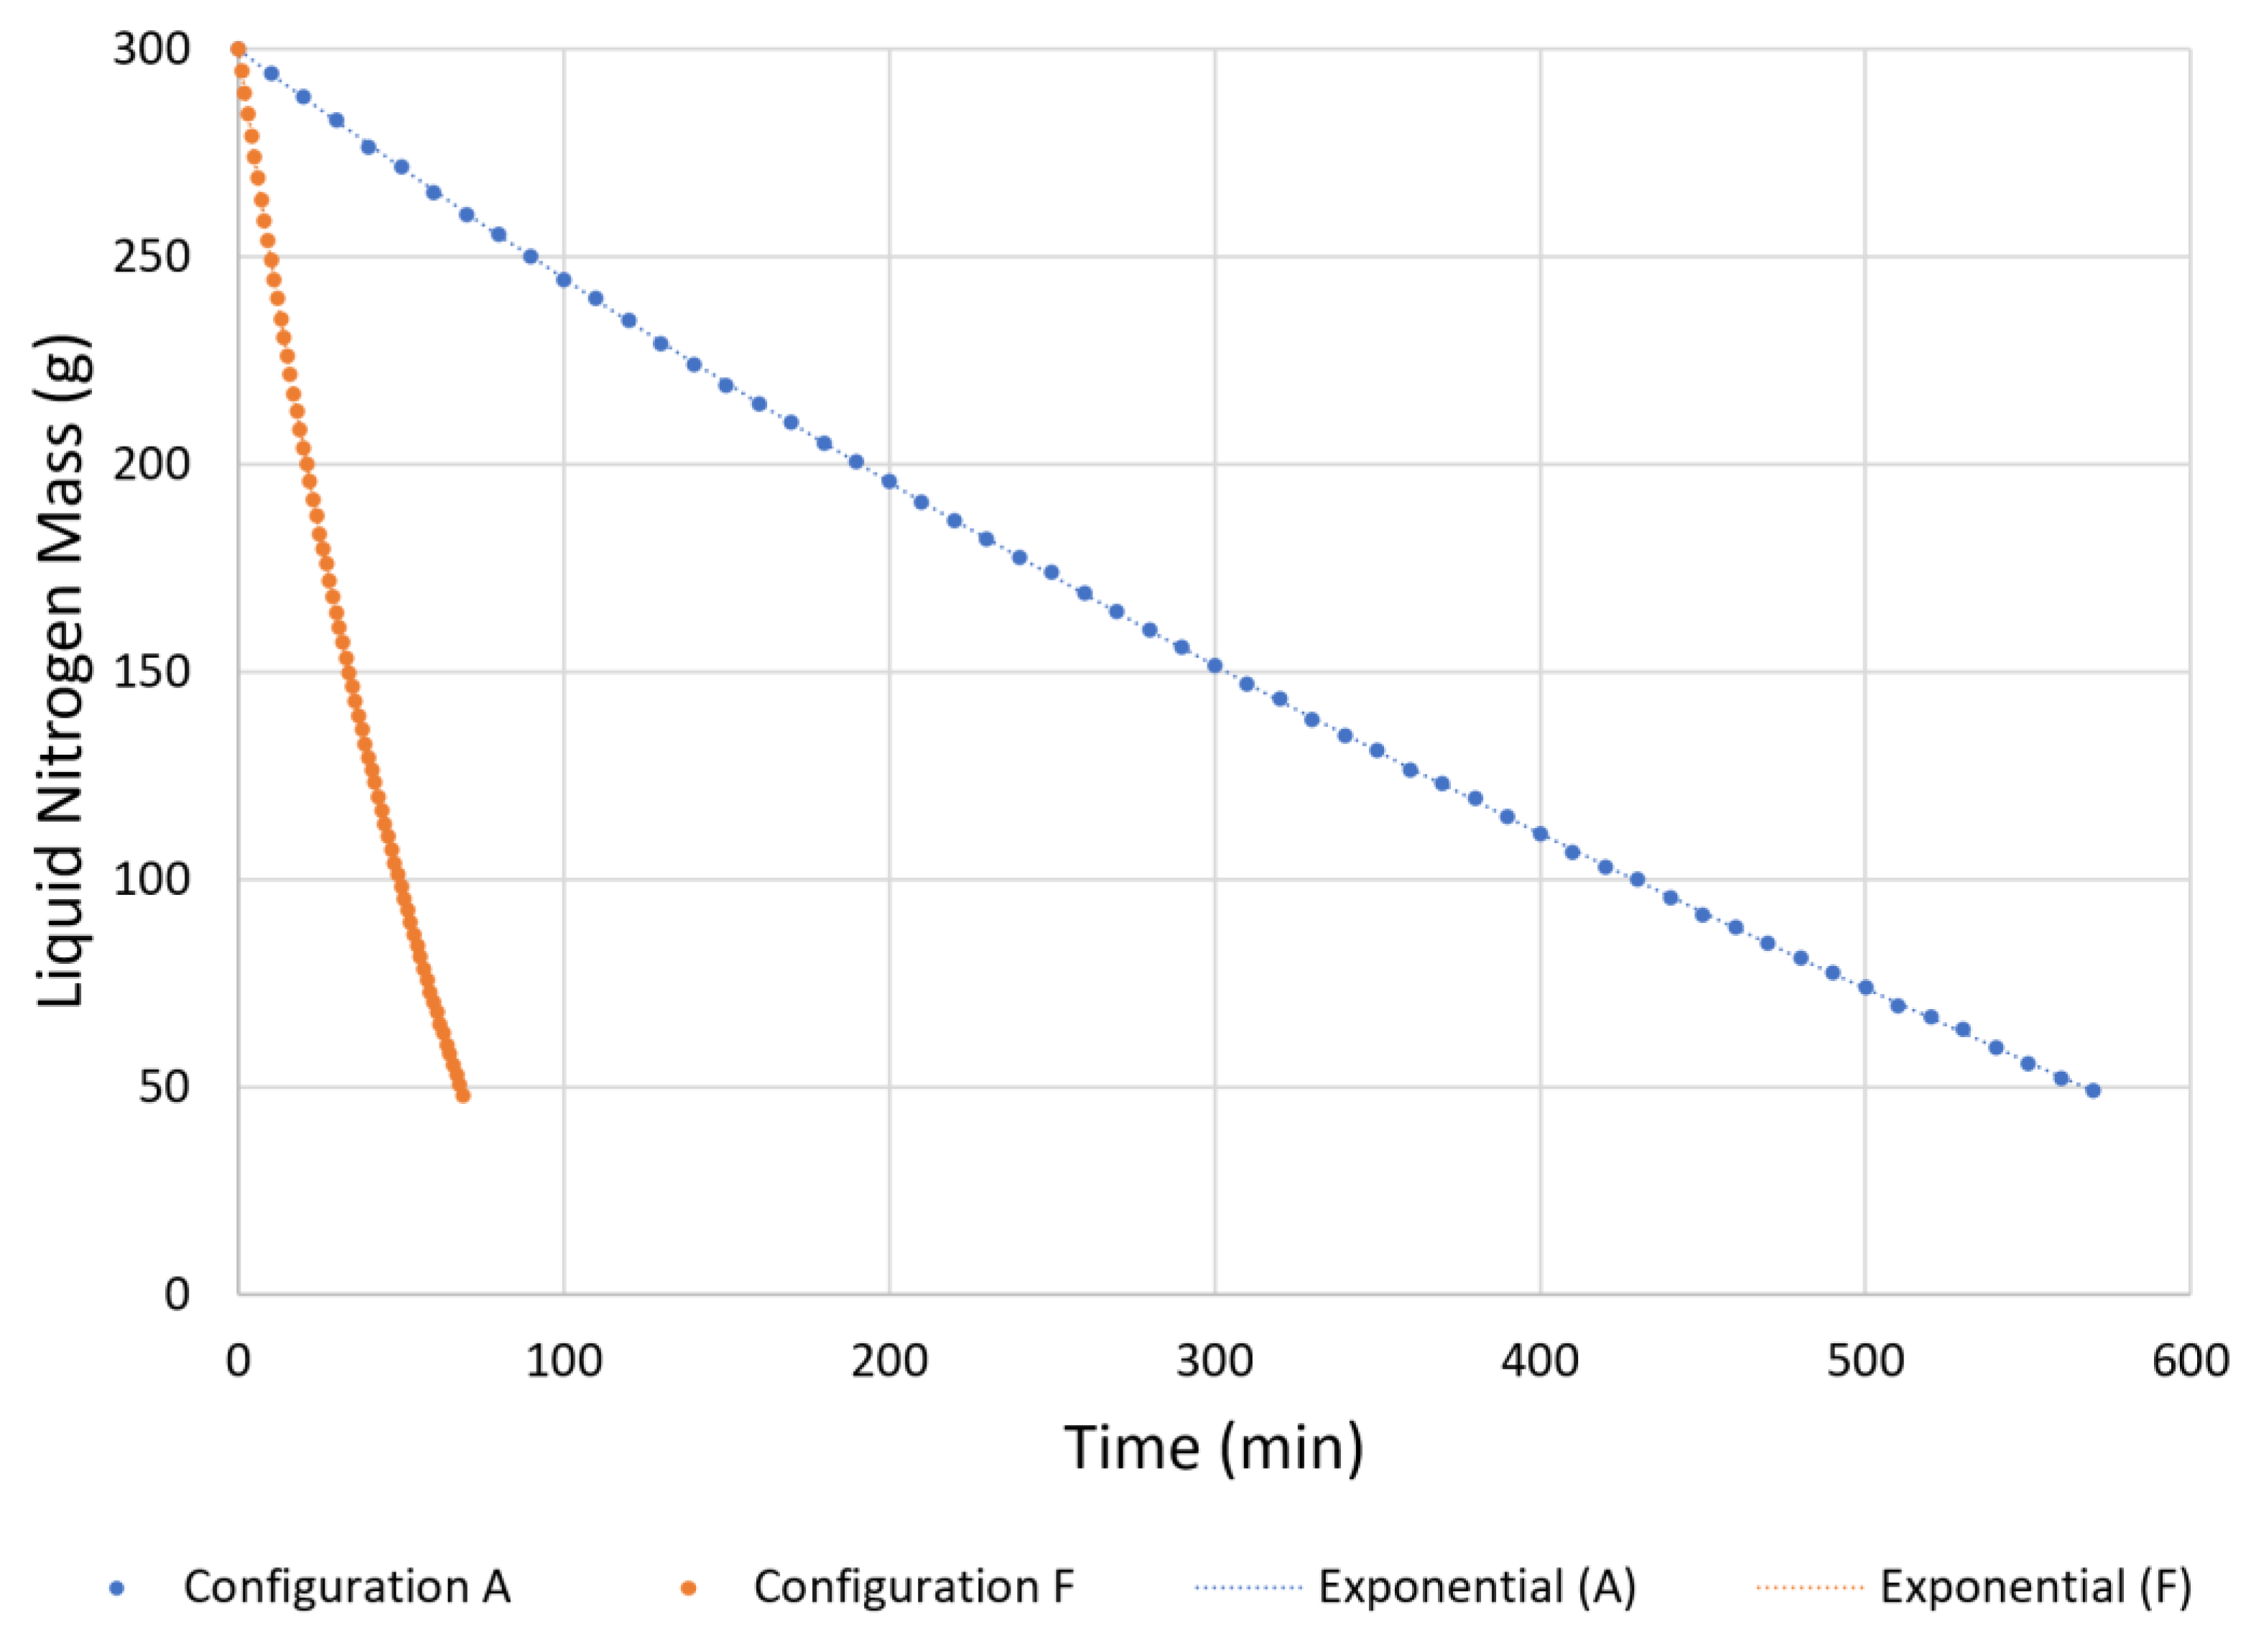
| Experimental Dewar Configuration | Normalized Evaporation Equation and R2 Value | Final LN2 Mass (g) | Evaporation Time (min) |
|---|---|---|---|
| A | y = 1.147e−0.8685x − 0.1477e0.7679x R2 = 1.0000 | 49.0 | 570 |
| B | y = 1.081e−1.121x − 0.08338e0.811x R2 = 1.0000 | 49.5 | 48 |
| C | y = 1.102e−1.07x − 0.1056e0.7096x R2 = 1.0000 | 49.5 | 56 |
| D | y = 1.045e−1.317x − 0.04467e0.967x R2 = 1.0000 | 48.5 | 65 |
| E | y = 1.207e−0.9559x − 0.2102e0.3818x R2 = 1.0000 | 46.5 | 46 |
| F | y = 1.231e−0.9628x − 0.2302e0.2965x R2 = 1.0000 | 48.0 | 69 |
Publisher’s Note: MDPI stays neutral with regard to jurisdictional claims in published maps and institutional affiliations. |
© 2022 by the authors. Licensee MDPI, Basel, Switzerland. This article is an open access article distributed under the terms and conditions of the Creative Commons Attribution (CC BY) license (https://creativecommons.org/licenses/by/4.0/).
Share and Cite
Fackrell, C.; Pollman, A.; Van Bossuyt, D.L.; Gannon, A.J. Experimental Assessment of a Novel Dual Opening Dewar for Use on a Liquid Air Energy Storage System Installed on Remote, Islanded, Renewable Microgrids. Inventions 2022, 7, 101. https://doi.org/10.3390/inventions7040101
Fackrell C, Pollman A, Van Bossuyt DL, Gannon AJ. Experimental Assessment of a Novel Dual Opening Dewar for Use on a Liquid Air Energy Storage System Installed on Remote, Islanded, Renewable Microgrids. Inventions. 2022; 7(4):101. https://doi.org/10.3390/inventions7040101
Chicago/Turabian StyleFackrell, Christofer, Anthony Pollman, Douglas L. Van Bossuyt, and Anthony J. Gannon. 2022. "Experimental Assessment of a Novel Dual Opening Dewar for Use on a Liquid Air Energy Storage System Installed on Remote, Islanded, Renewable Microgrids" Inventions 7, no. 4: 101. https://doi.org/10.3390/inventions7040101