
IDeS (Industrial Design Structure) Method Applied to the Automotive Design Framework: Two Sports Cars with Shared Platform

 ,
,  ,
,  and
and
Abstract
:1. Introduction
2. Materials and Methods
2.1. Project Setup and Development
2.1.1. Environment Analysis
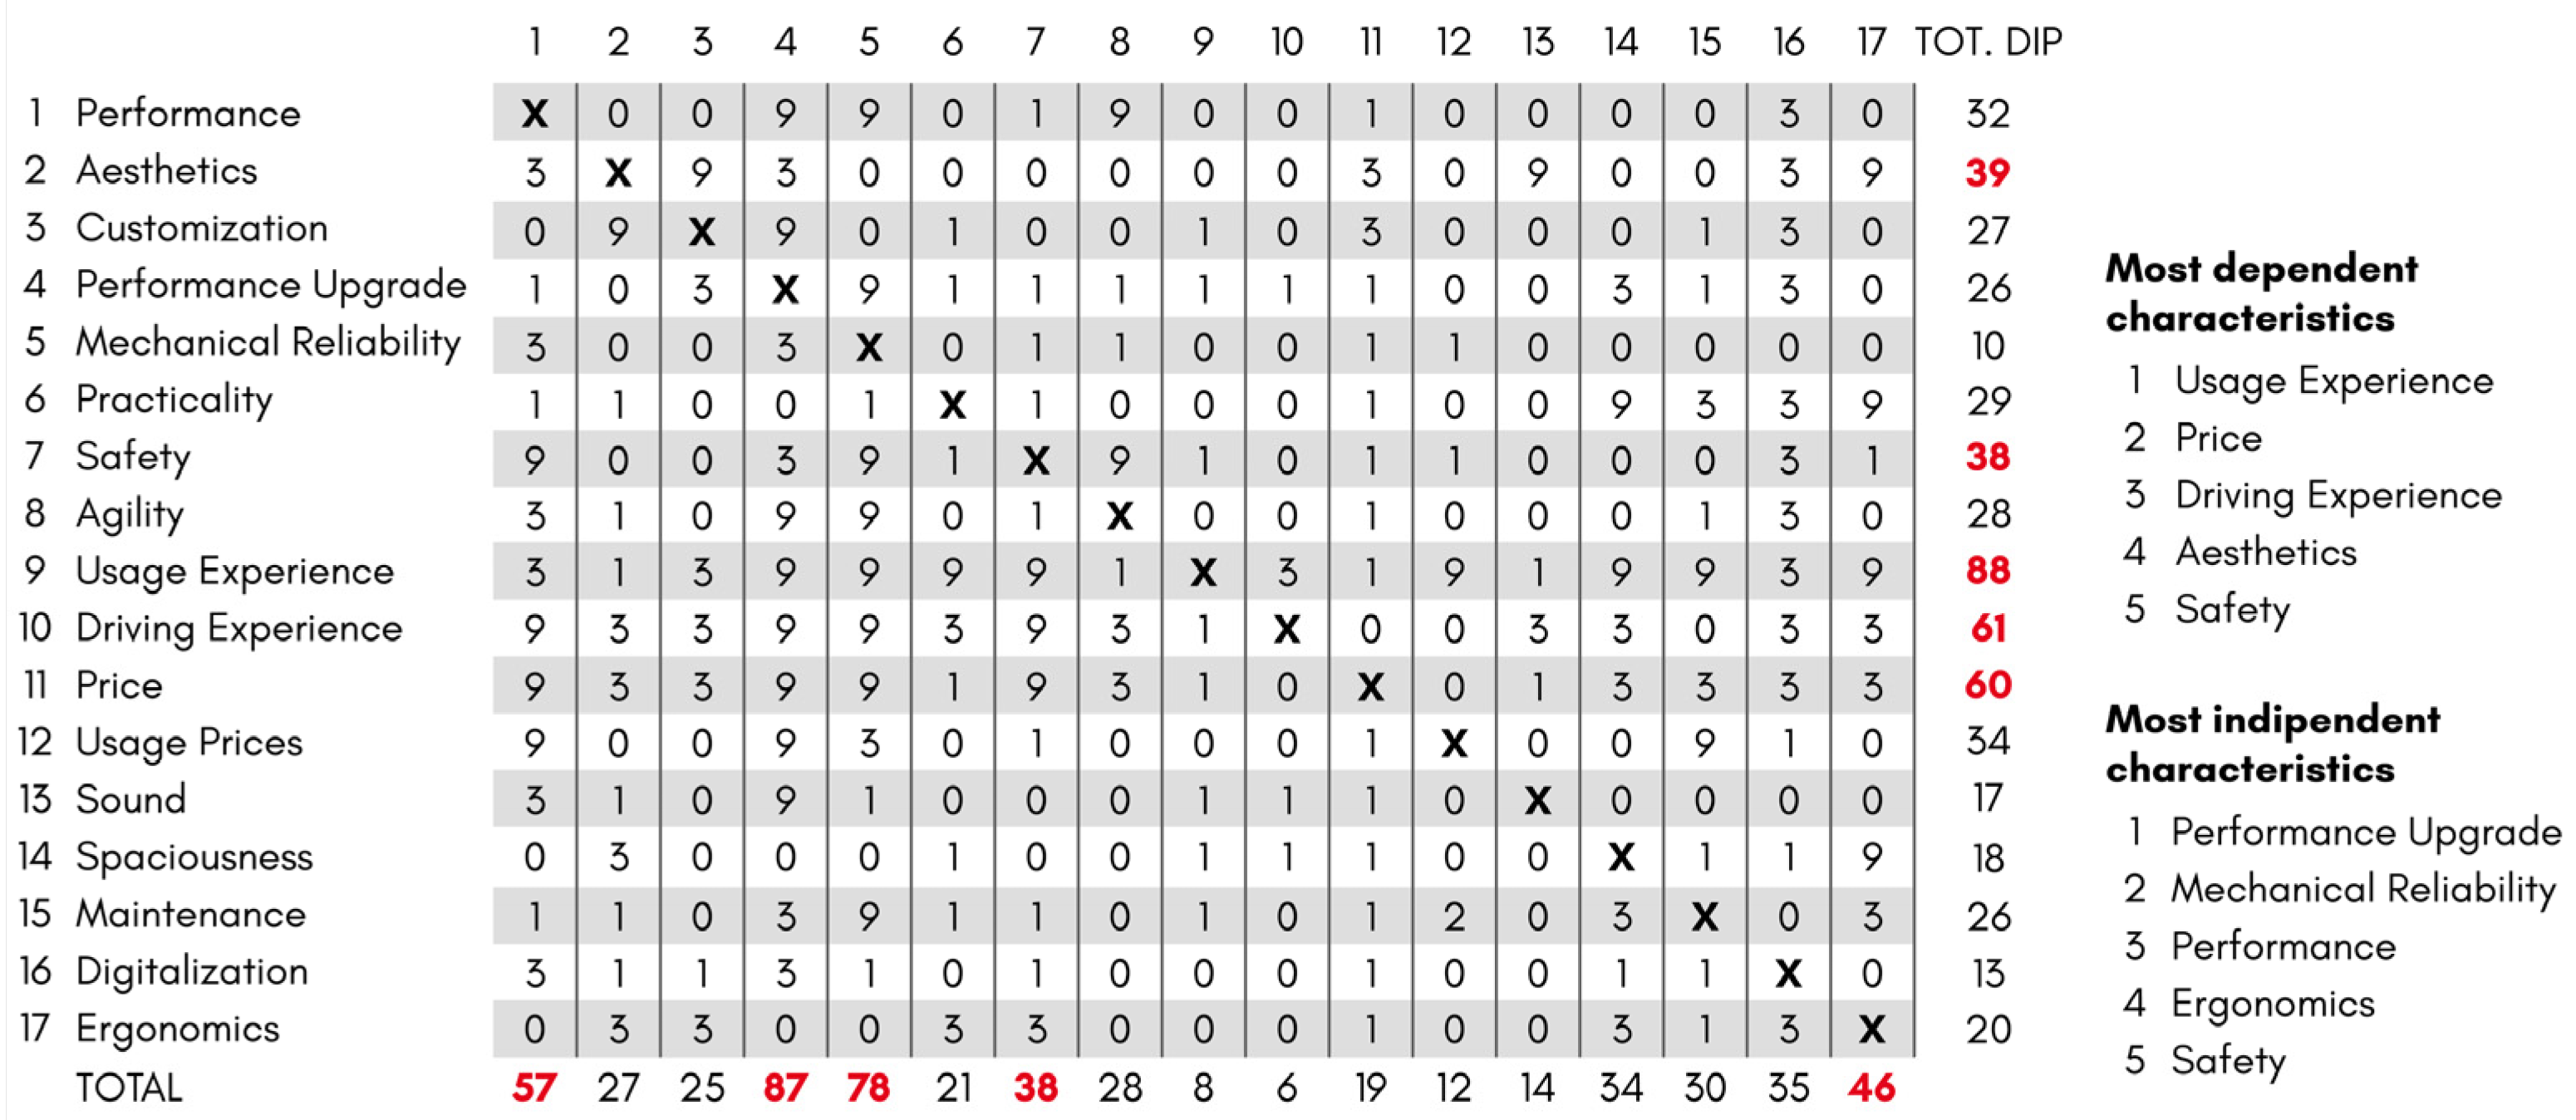
2.1.2. QFD Method
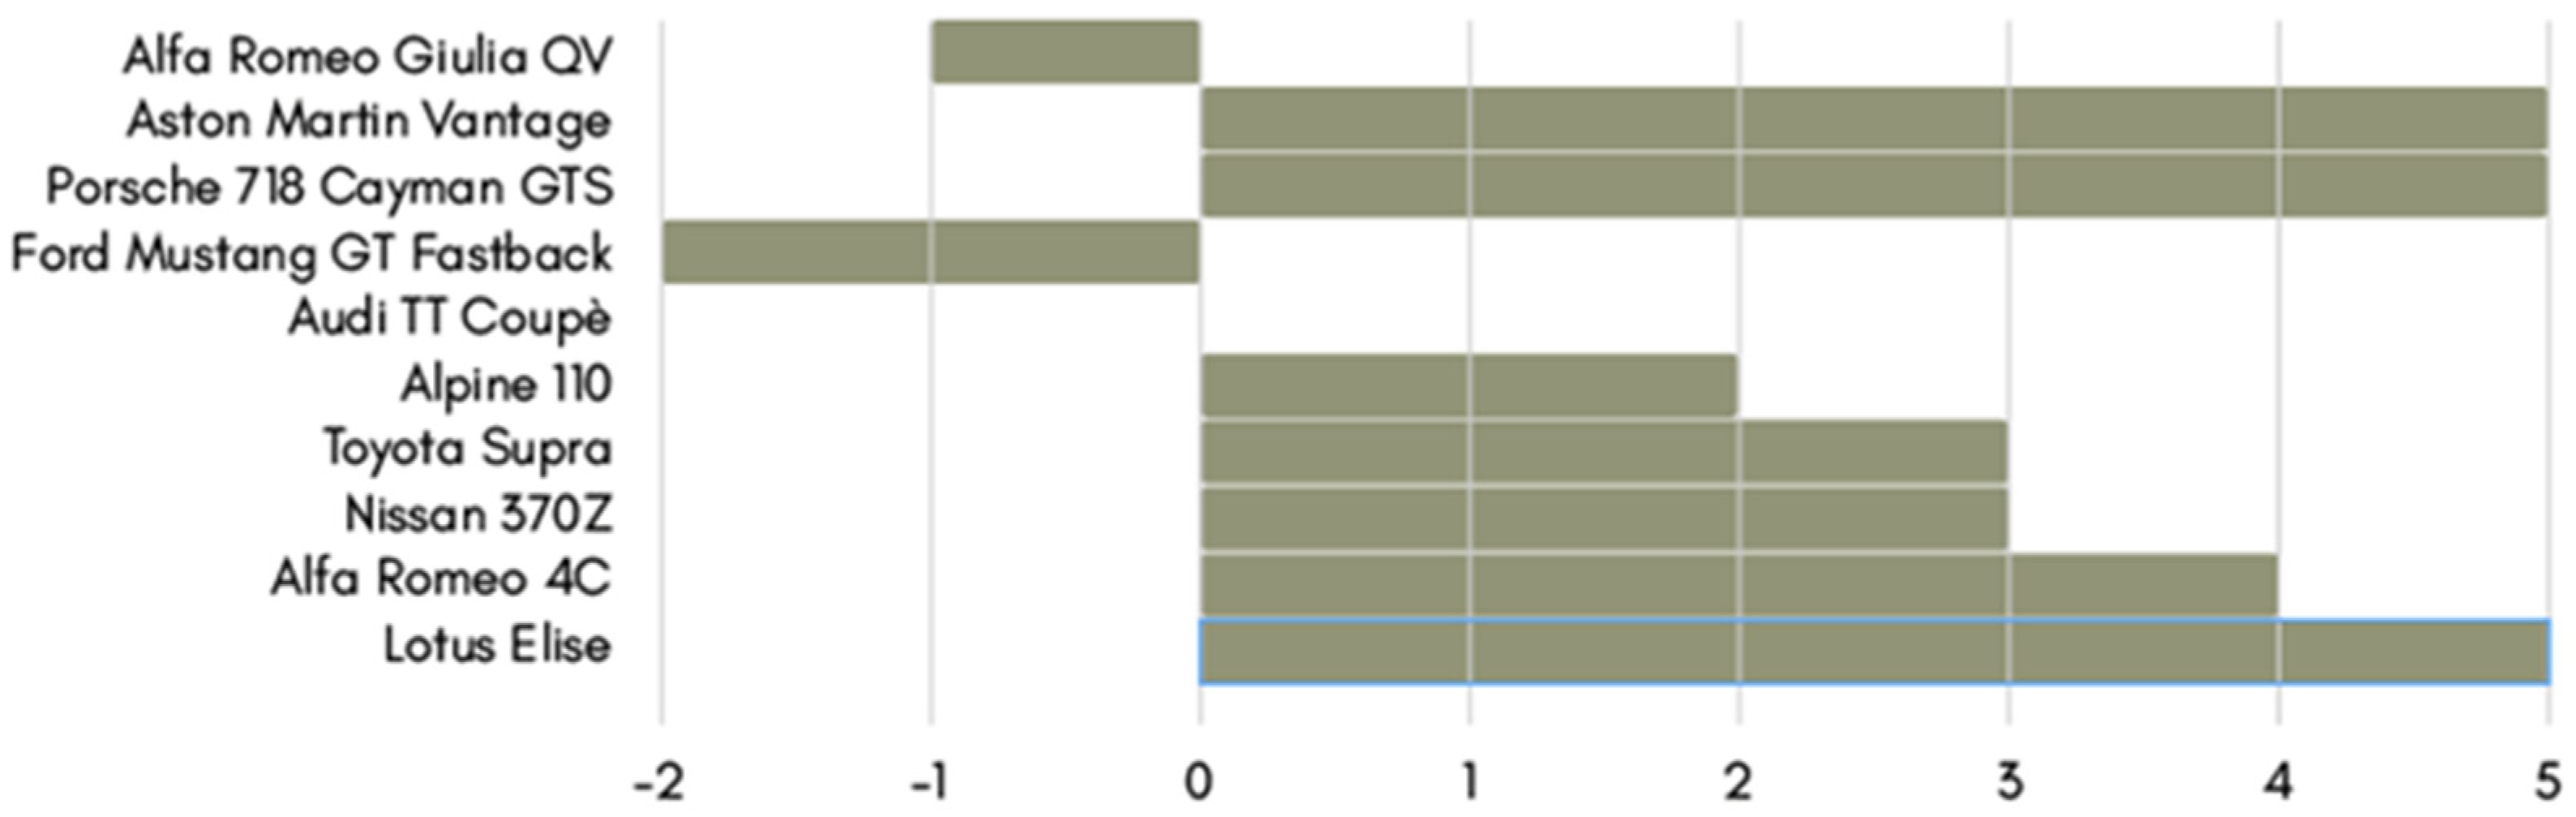
2.1.3. Benchmarking and Top-Flop Analysis
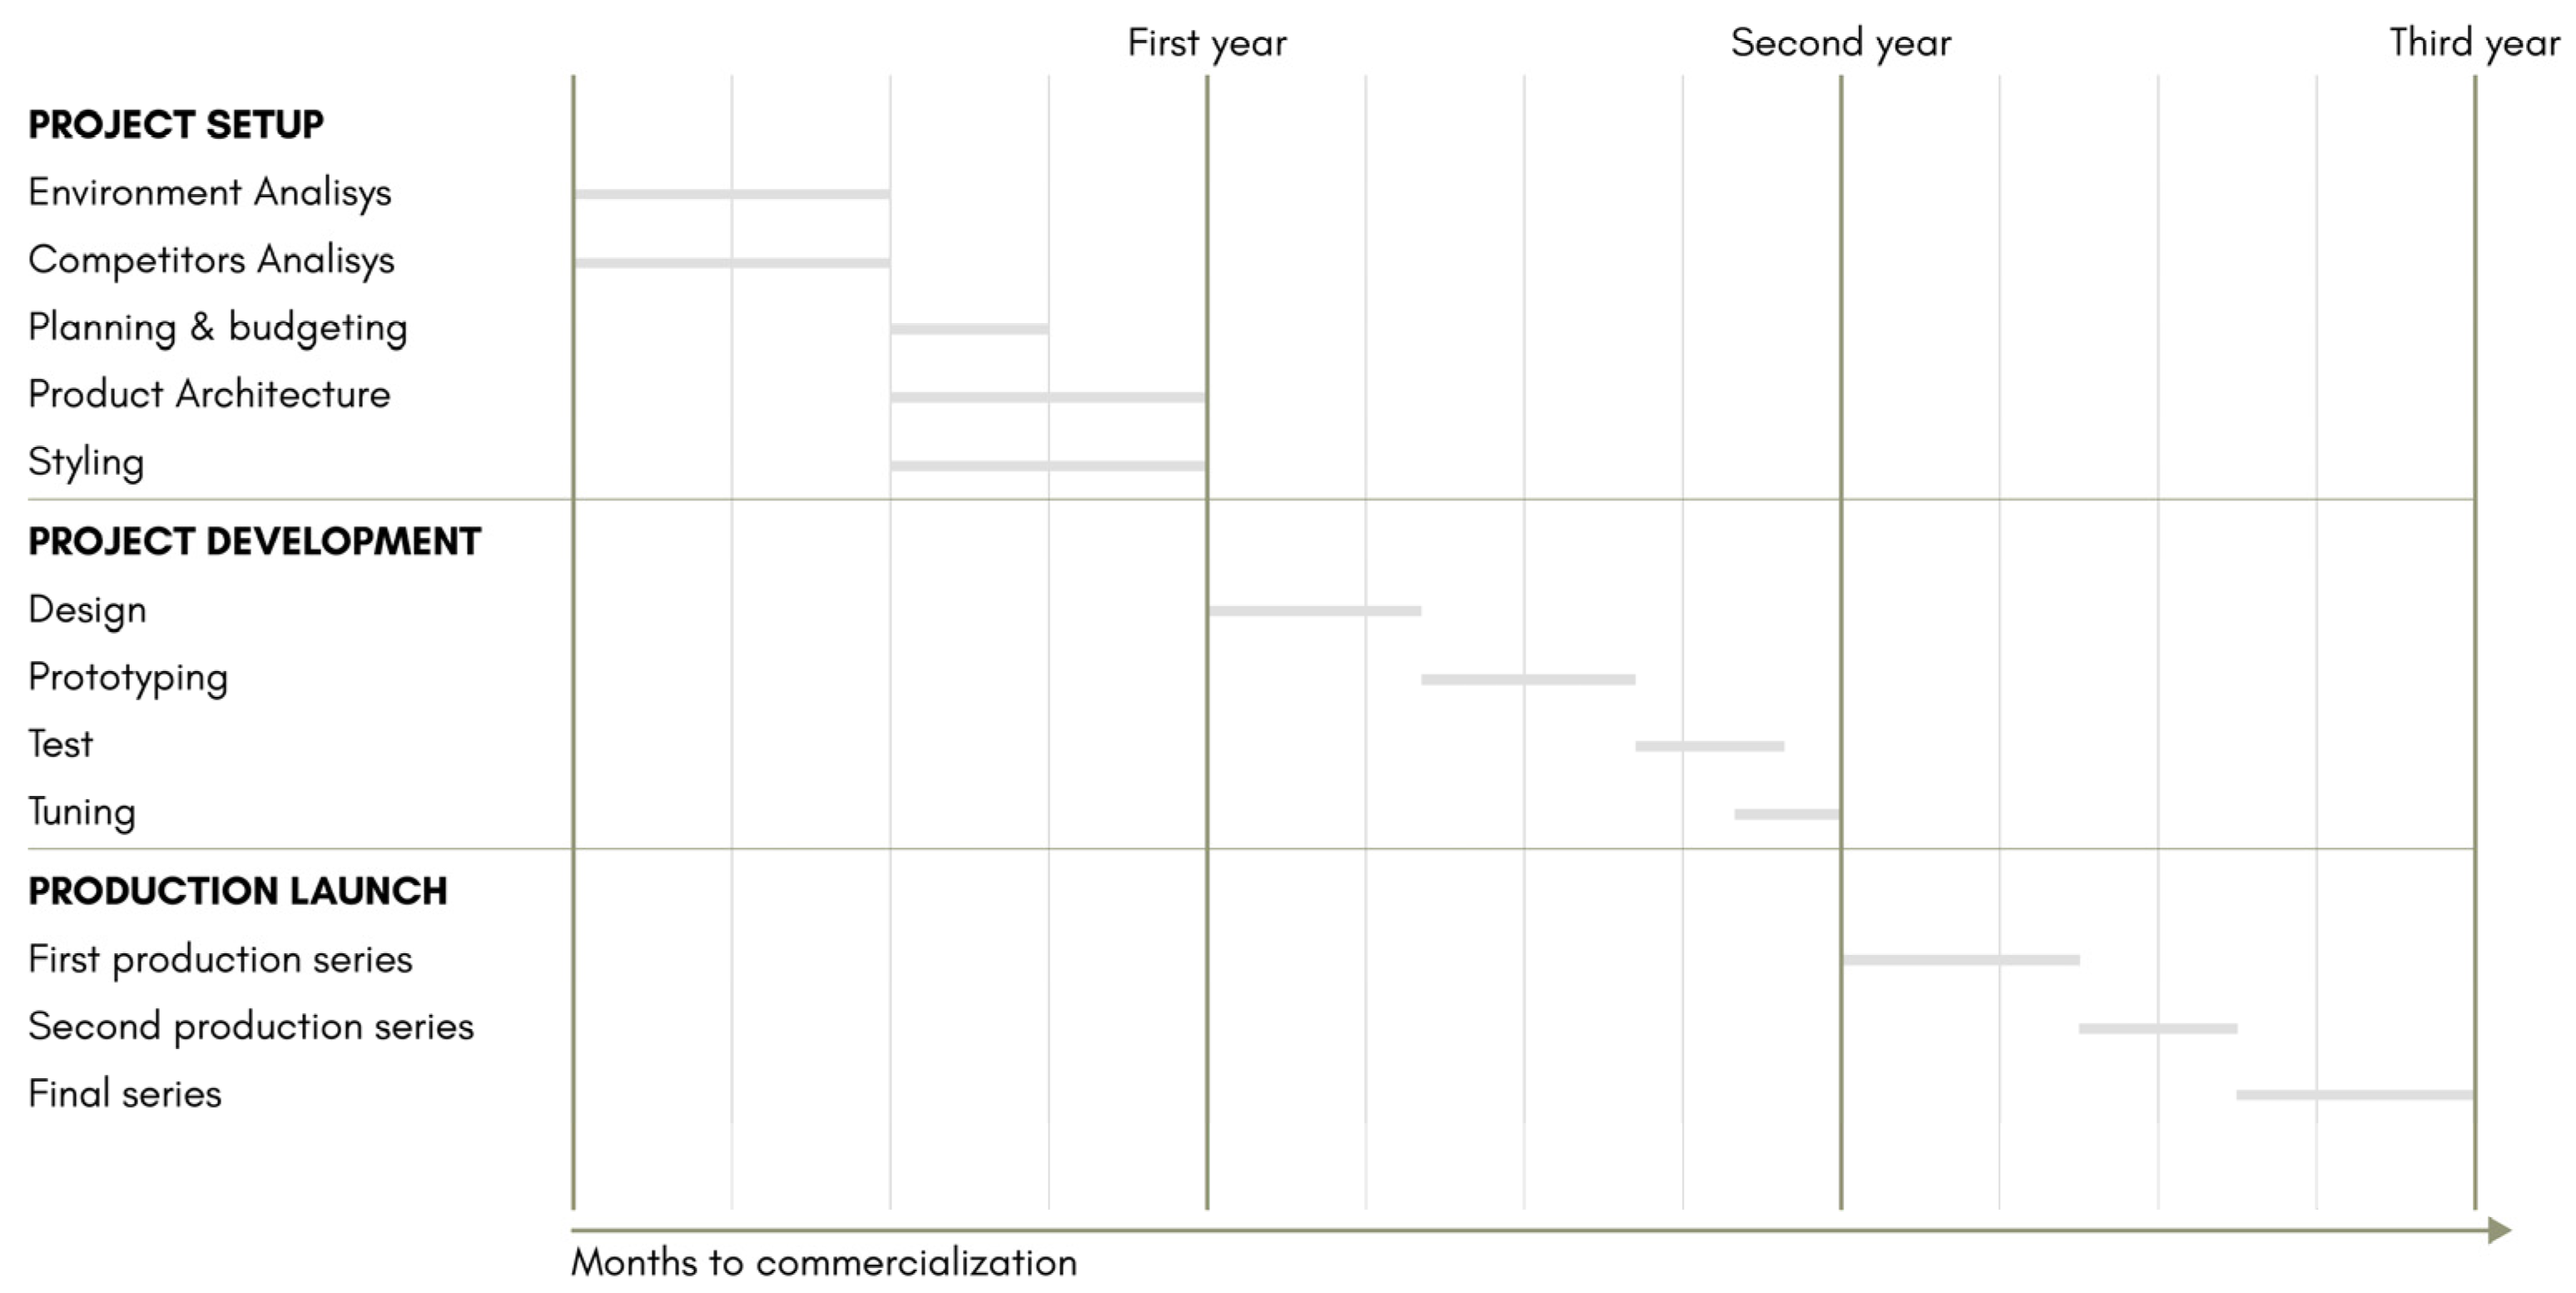
2.1.4. Planning
2.1.5. Budget
2.1.6. Product Architecture
2.1.7. Stylistic Design Engineering (SDE)
2.2. Design Phase
2.2.1. Design Engineering
2.2.2. Virtual Prototyping and Scaled Model Mockup
2.2.3. Testing
2.2.4. Setup
2.2.5. Redesign
2.3. Case Studies
2.3.1. Design Setup
Environment Analysis
Quality Function Deployment (QFD)
Benchmarking and TFA
Activity Planning
Budget Planning—Research and Development Costs
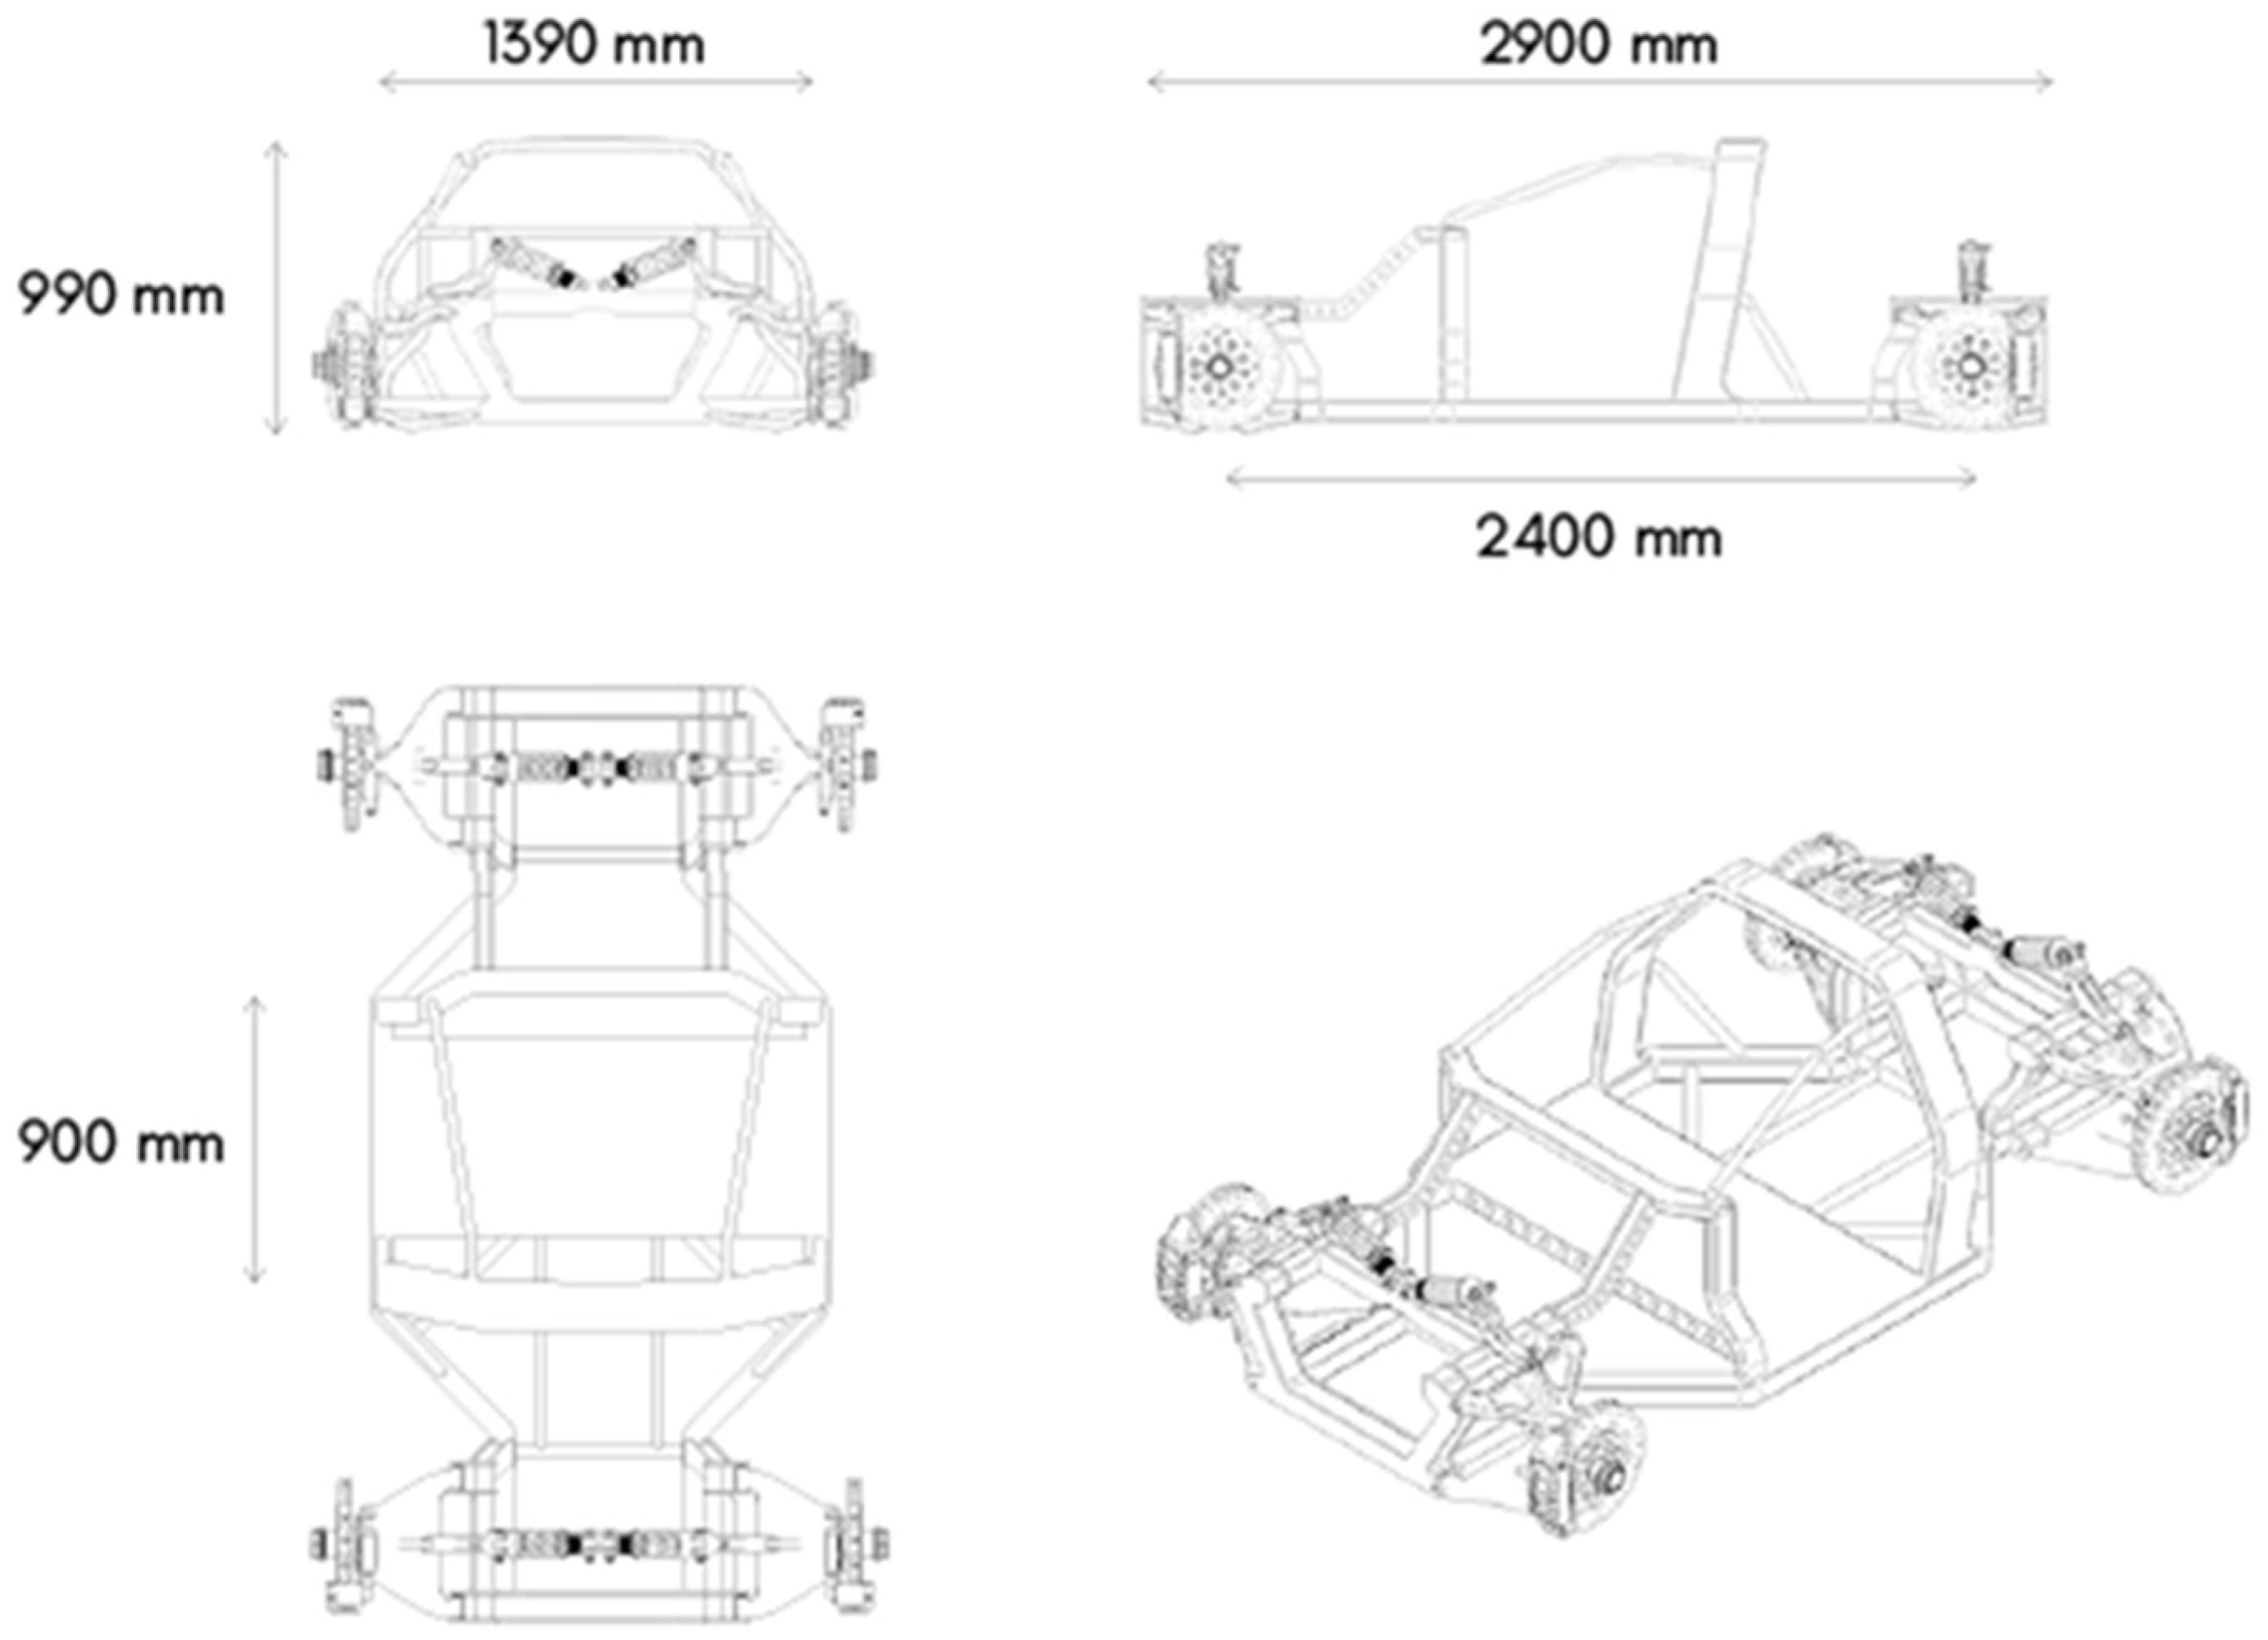
Product Architecture
Stylistic Design Engineering (SDE)
2.3.2. Product Improvement
Stylistic Analysis
3. Results
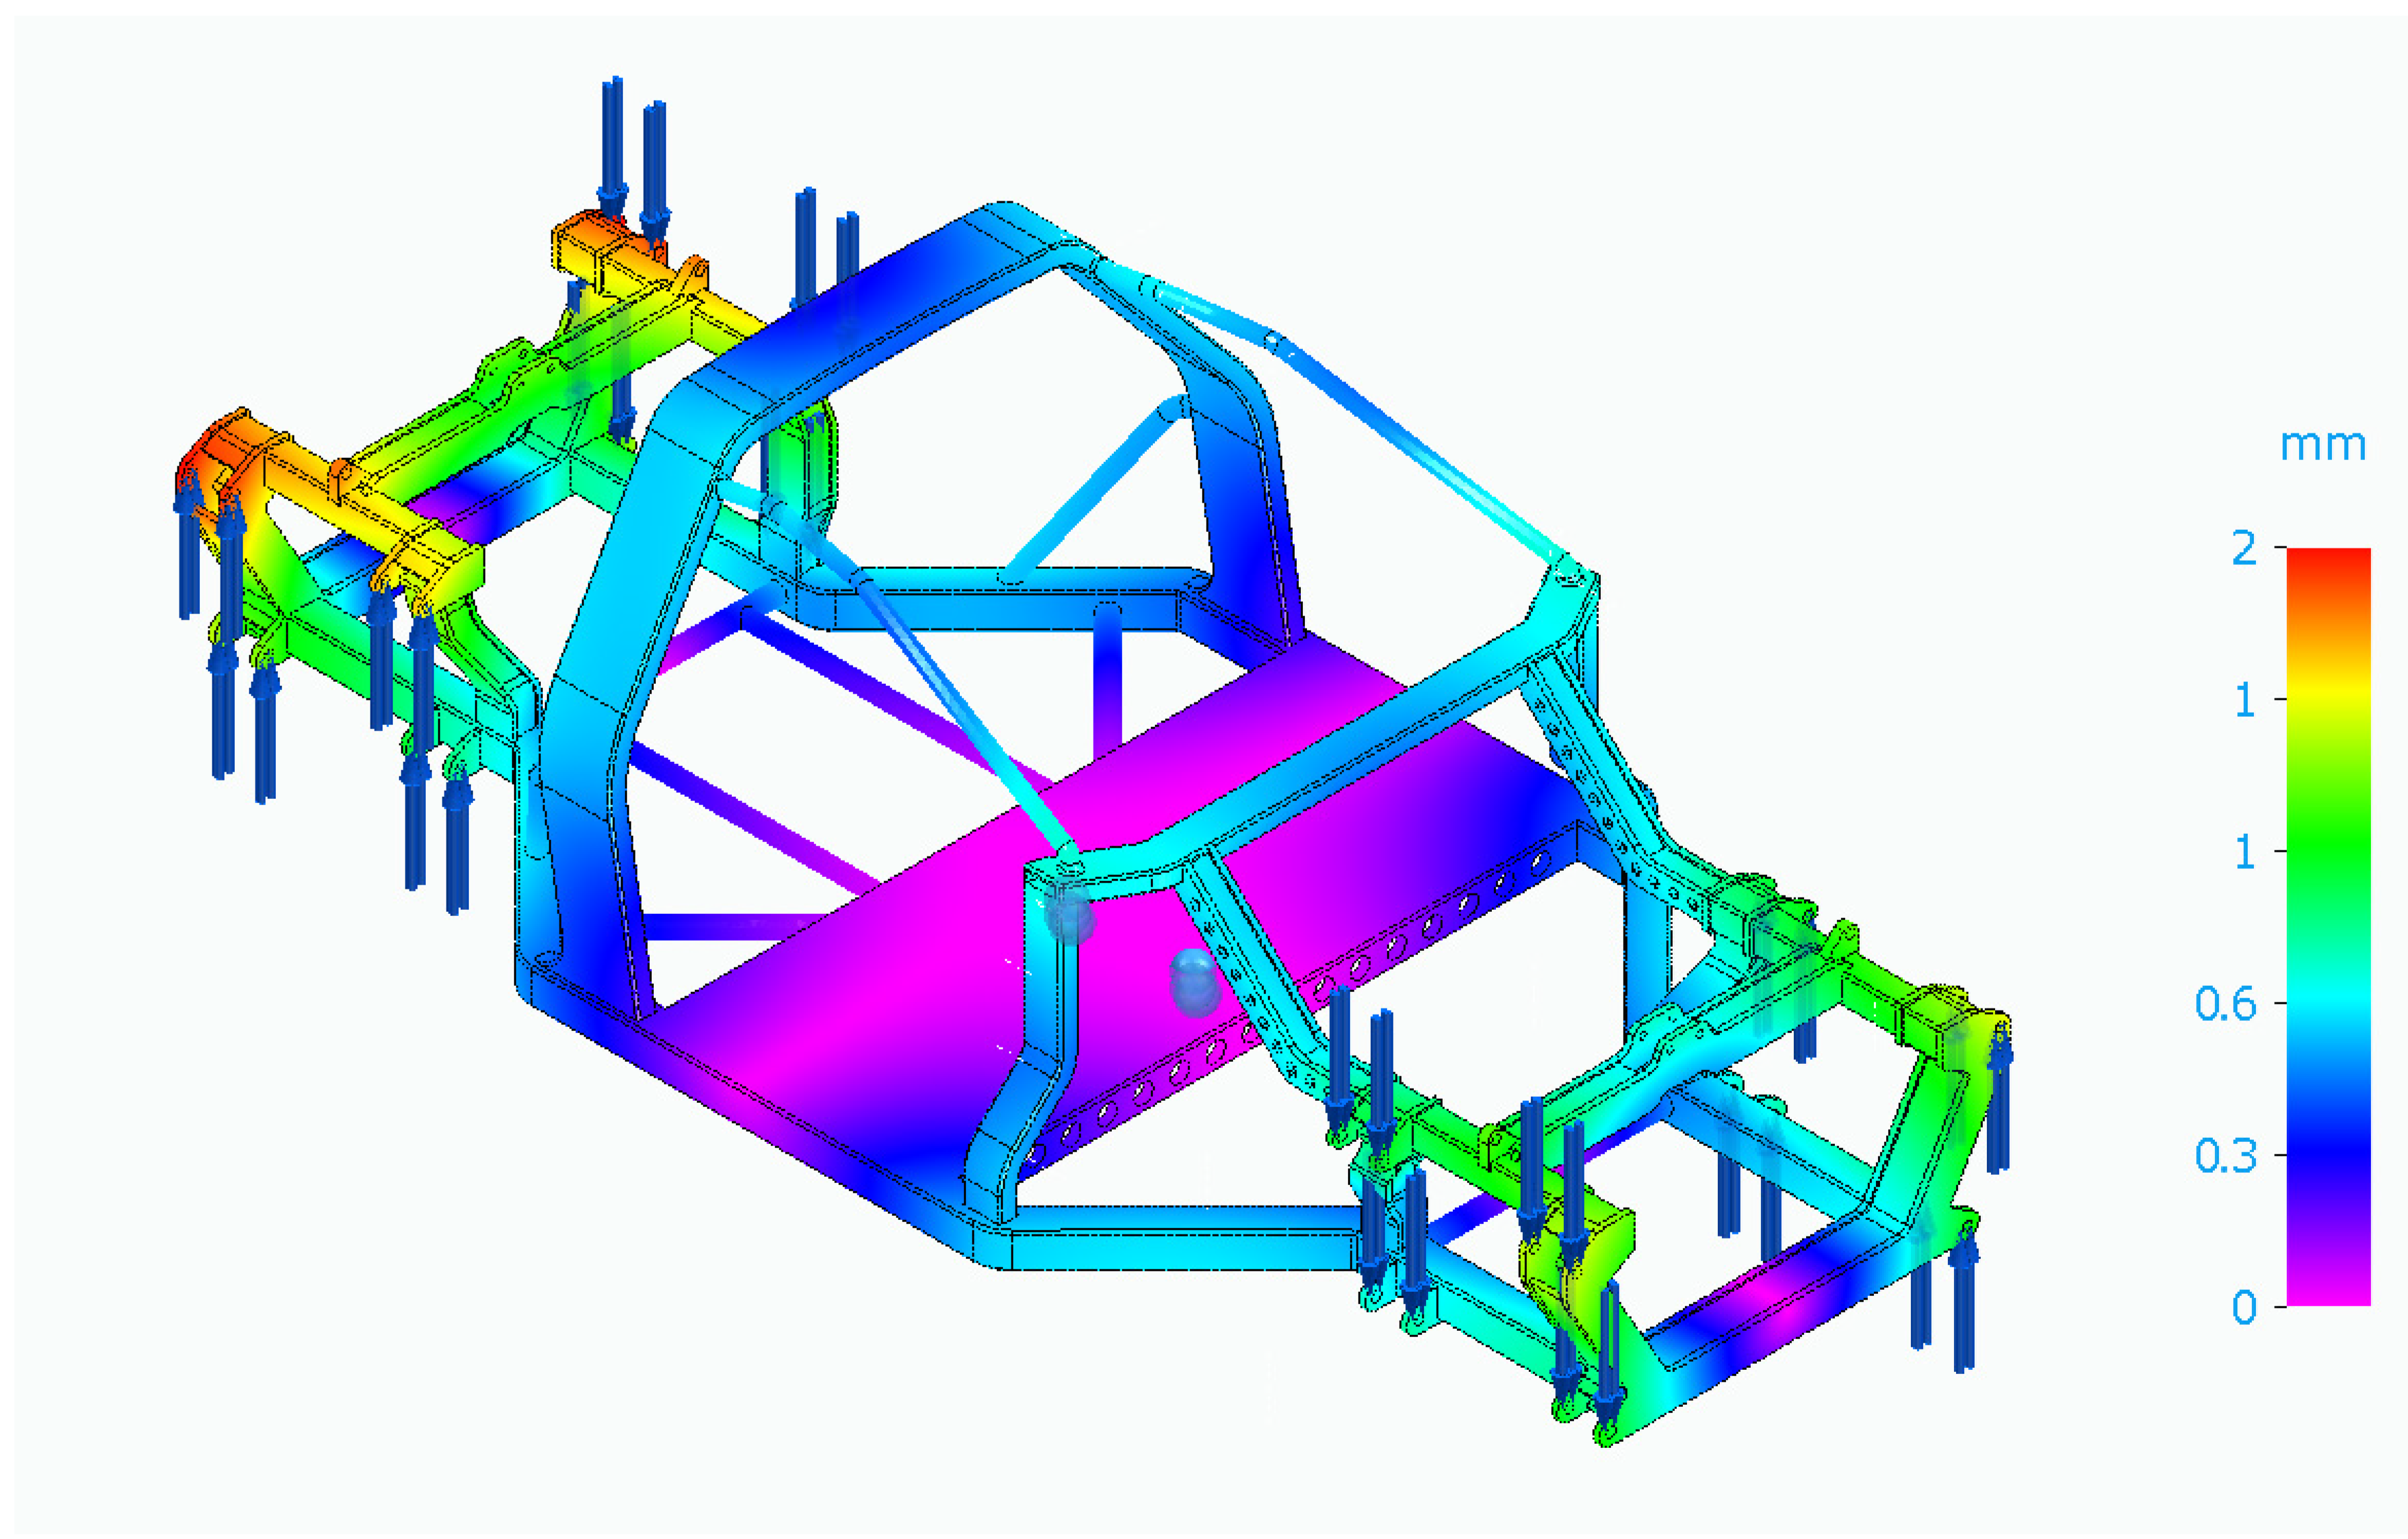
3.1. Chassis Design
FEM Analysis
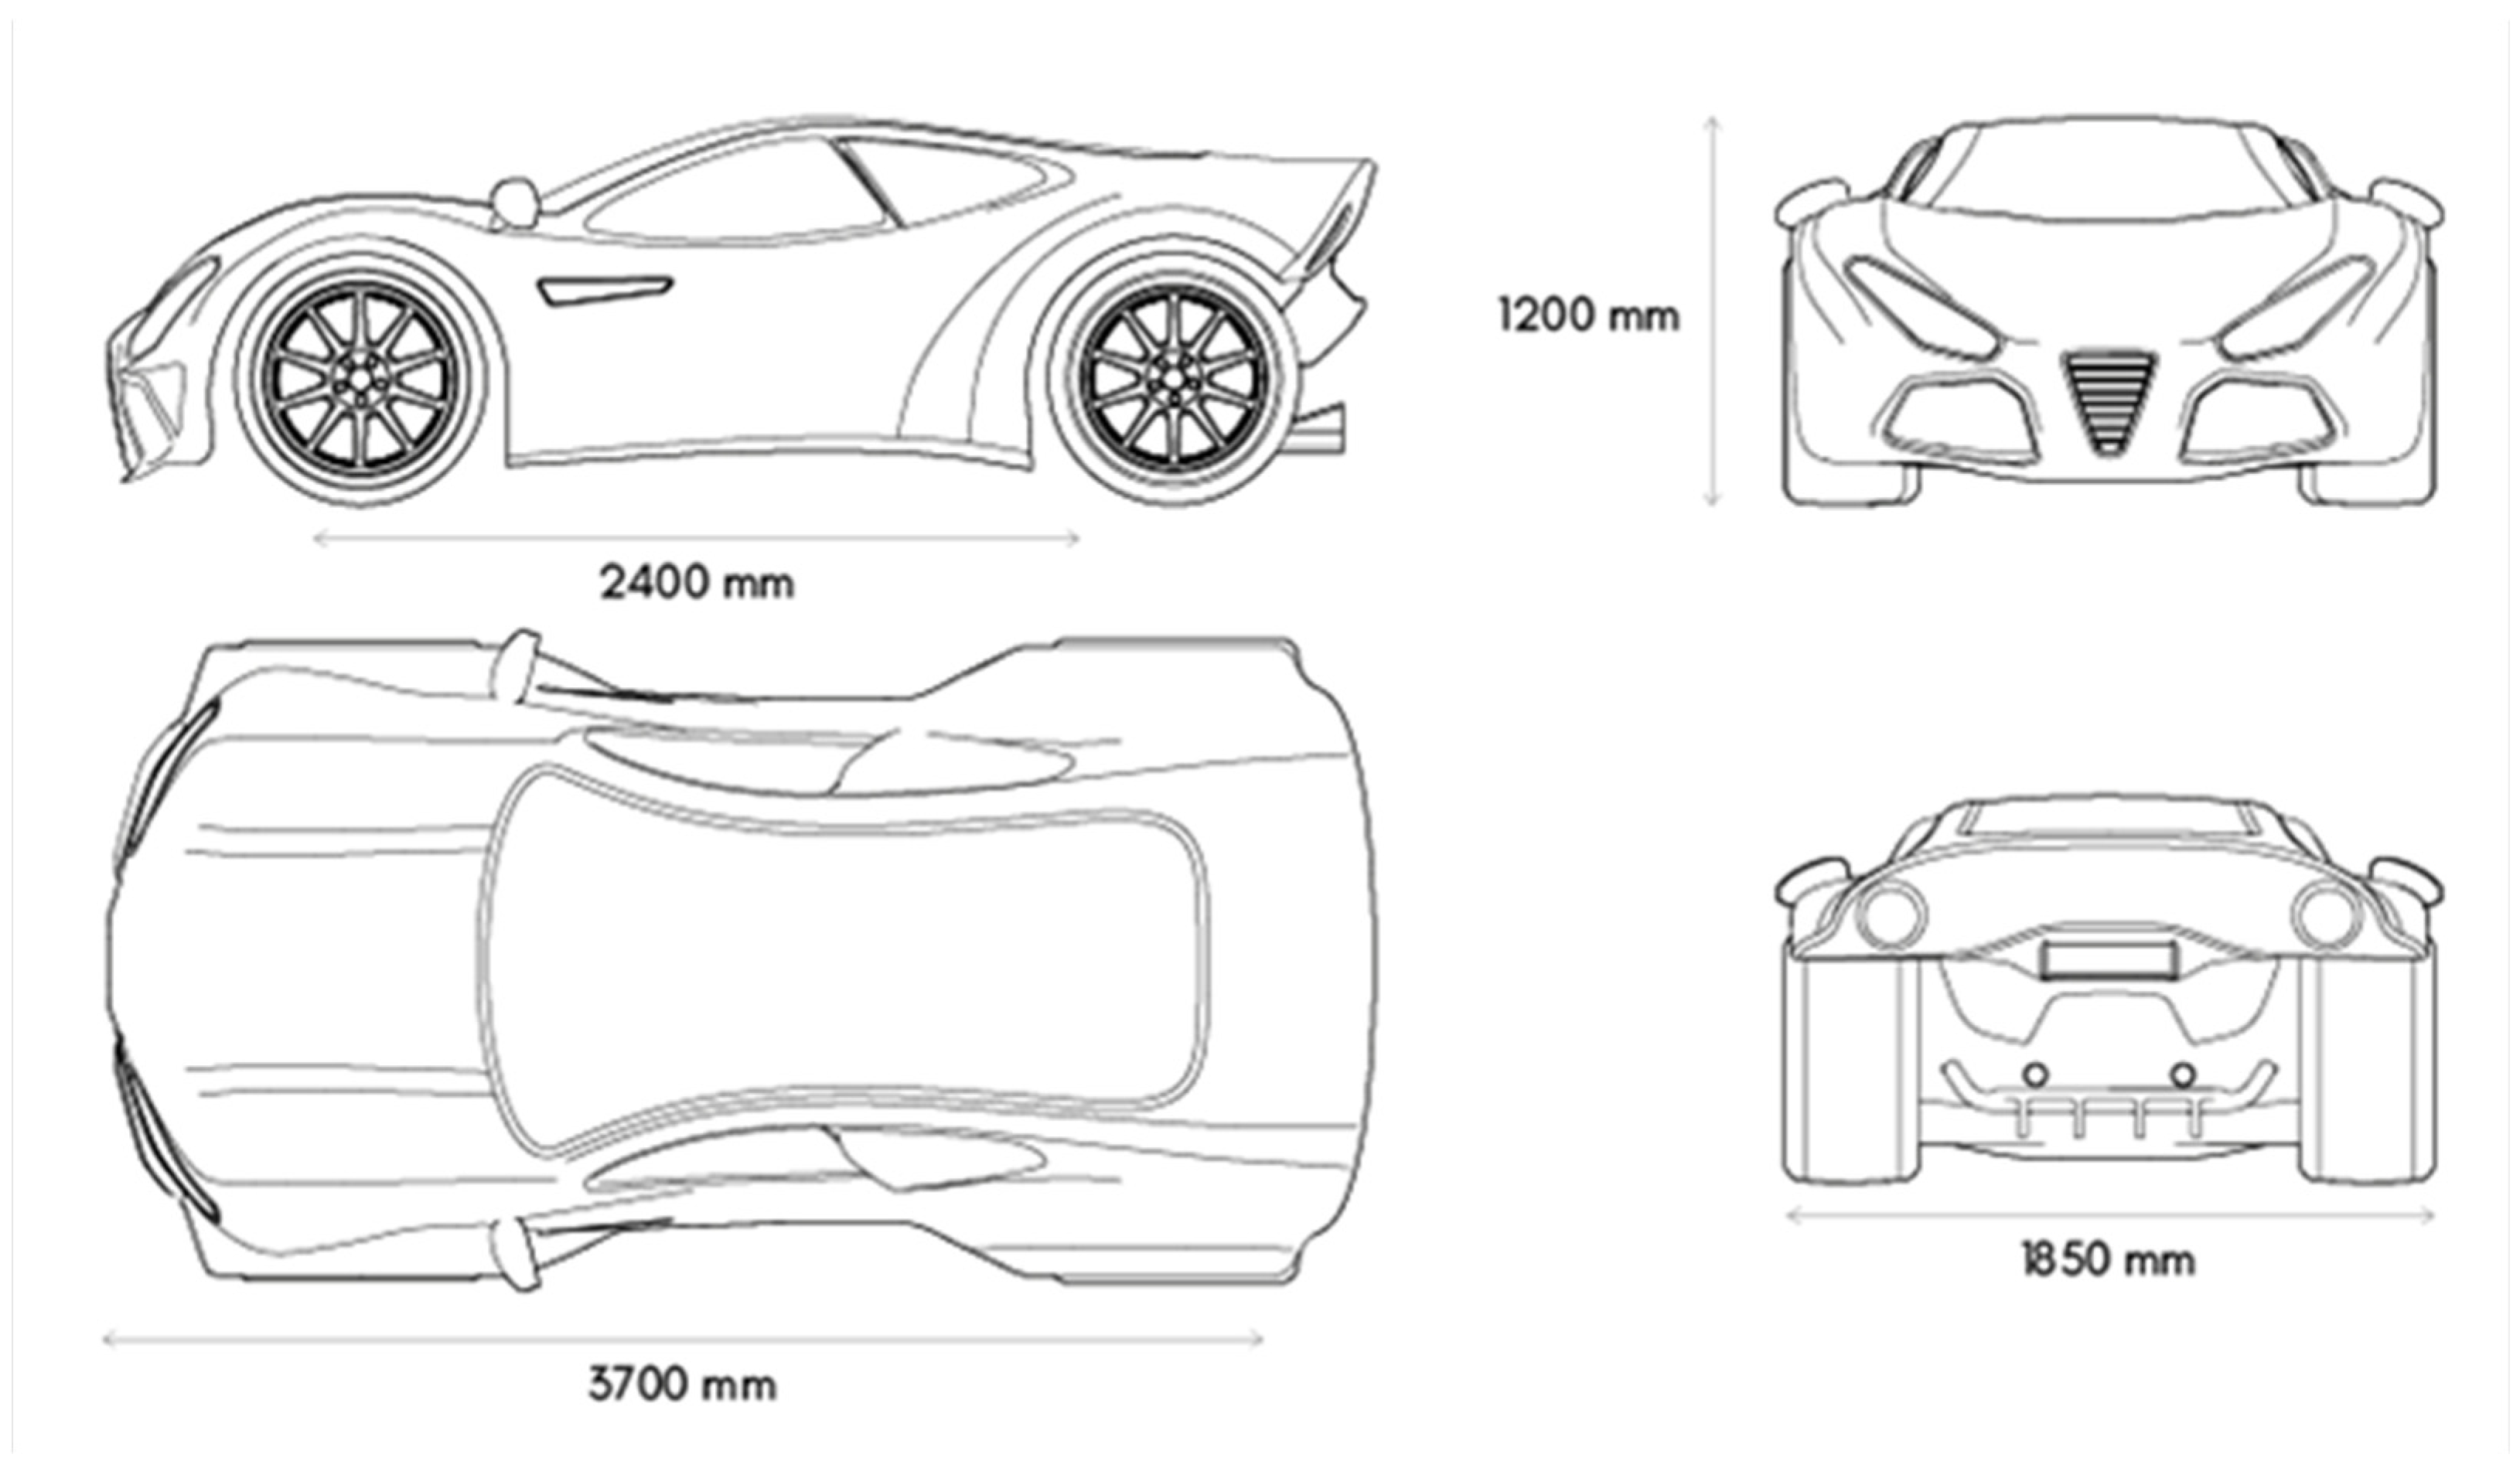
3.2. Car Body 3D Modelling
3.2.1. Car Body CFD Analysis
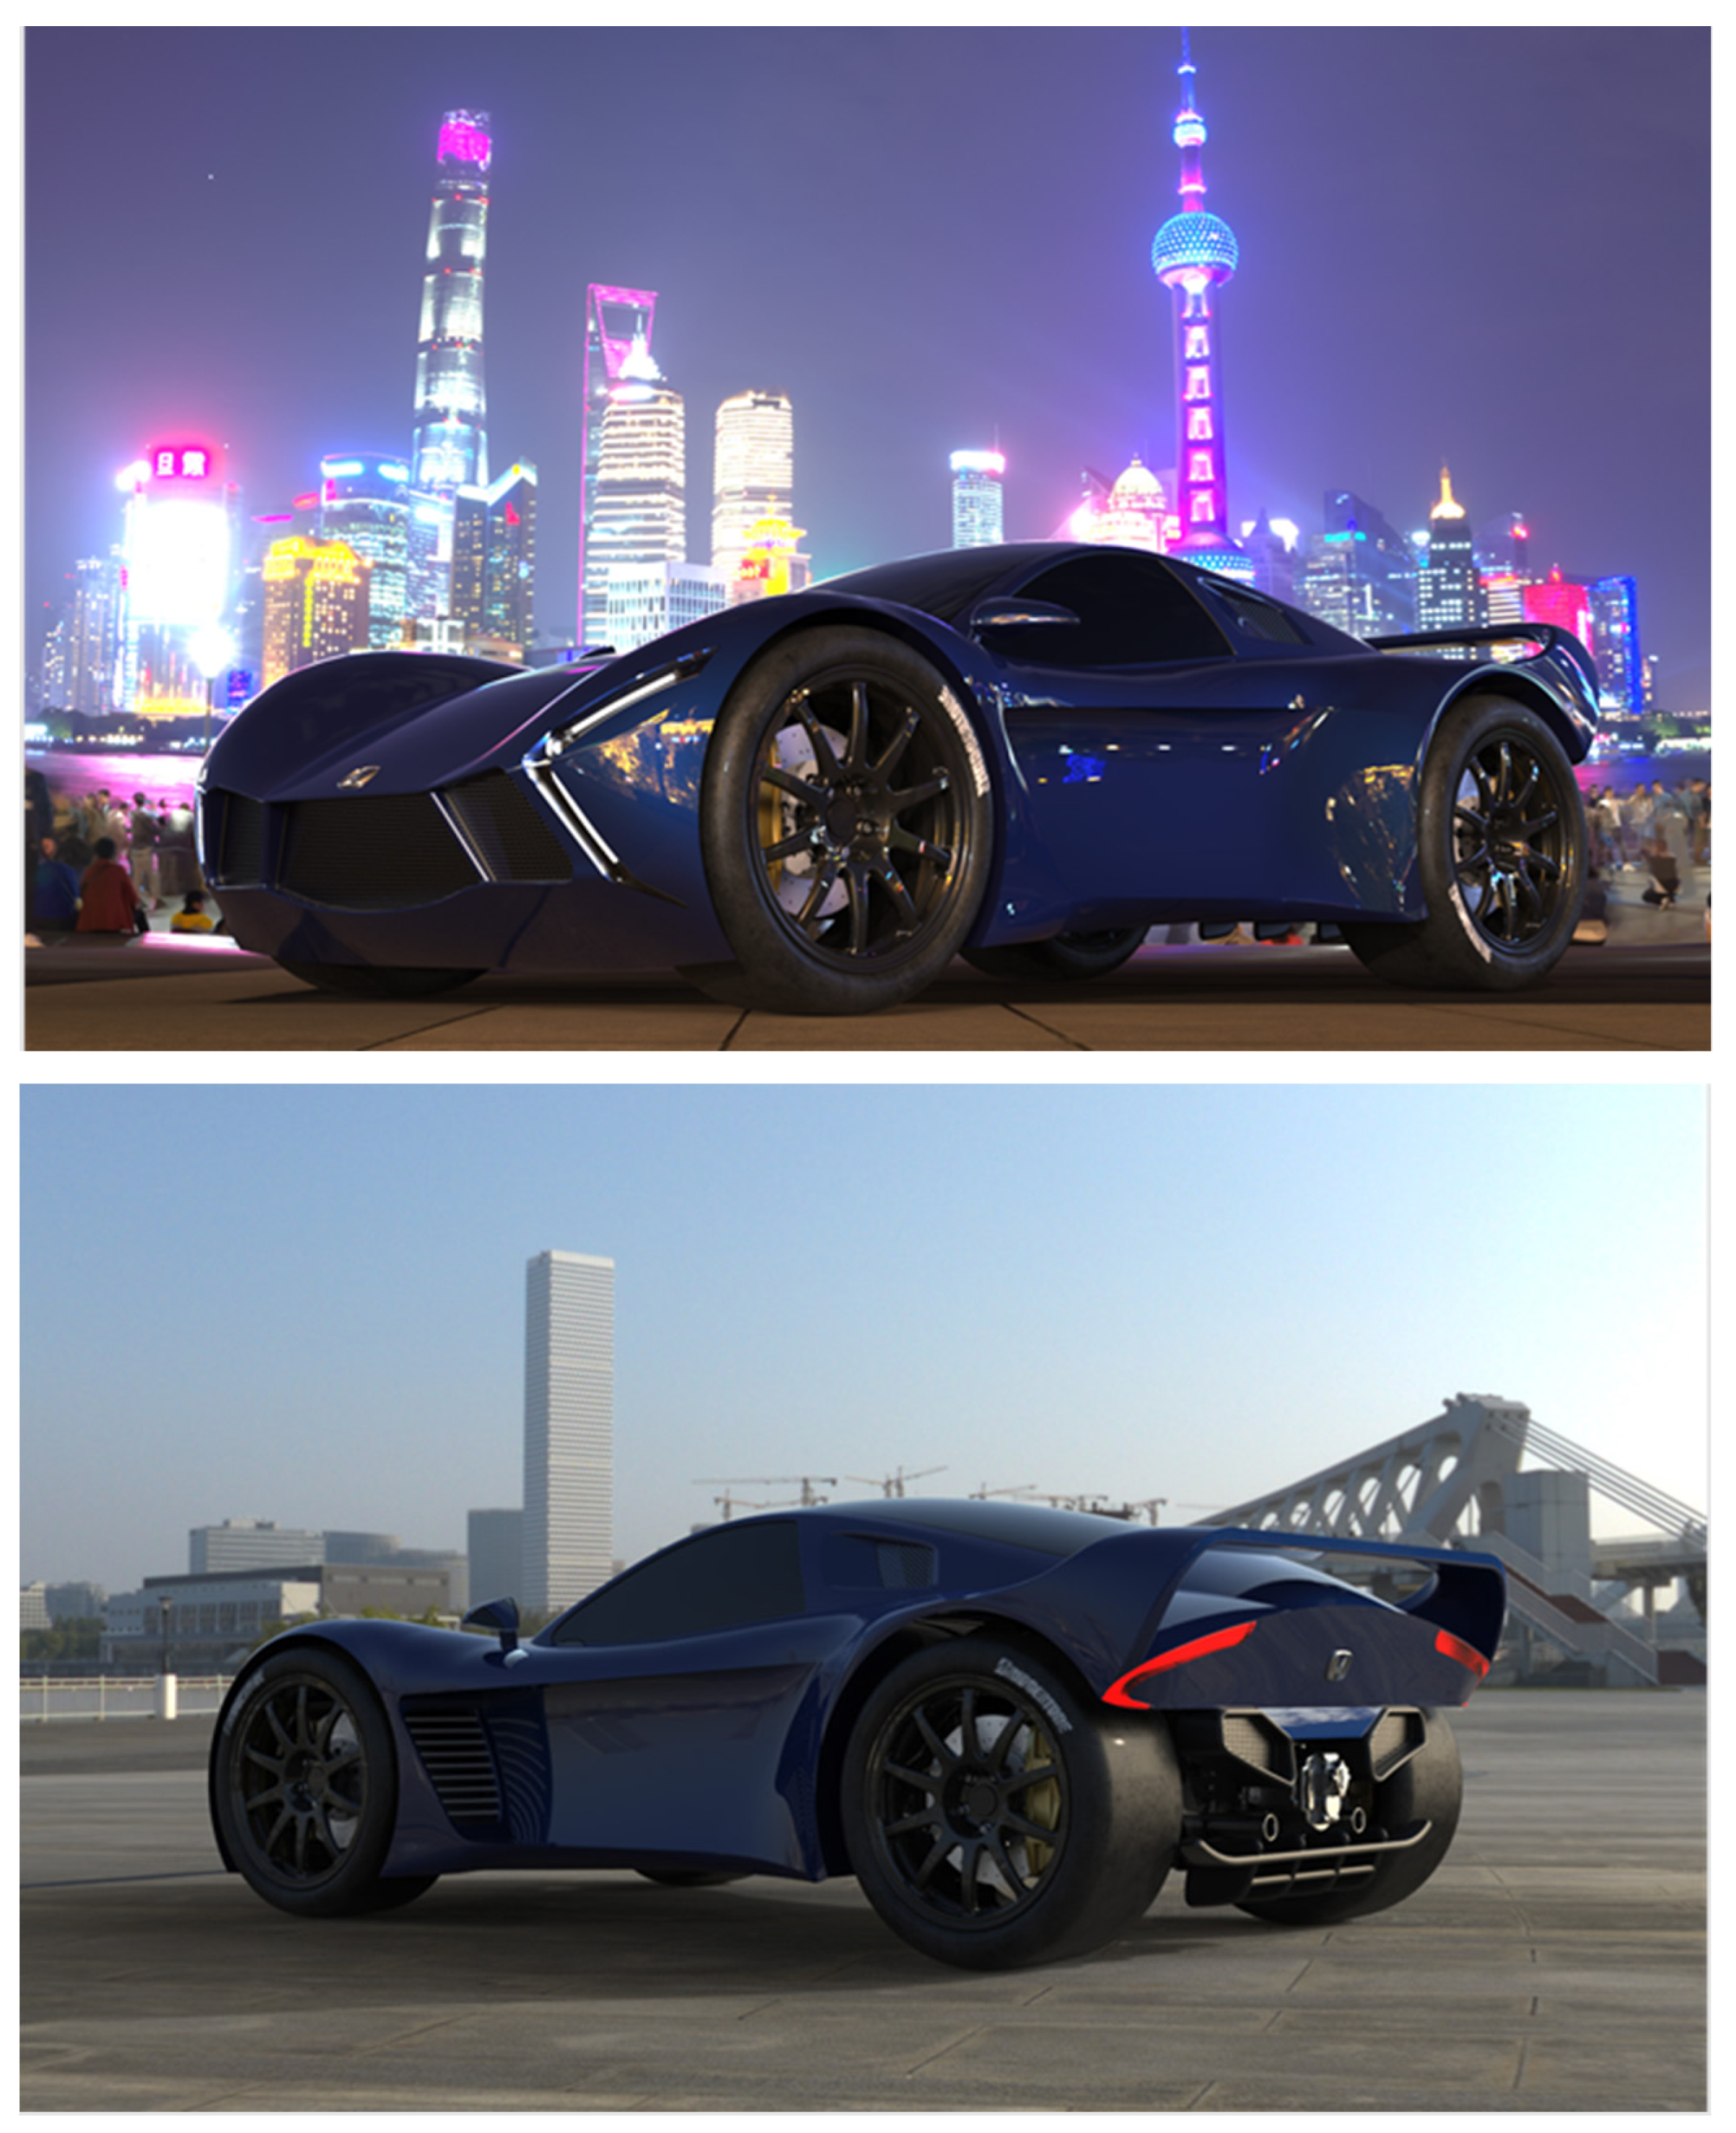
3.2.2. Real-Life-Inspired Renderings
3.2.3. Physical Models at Scale
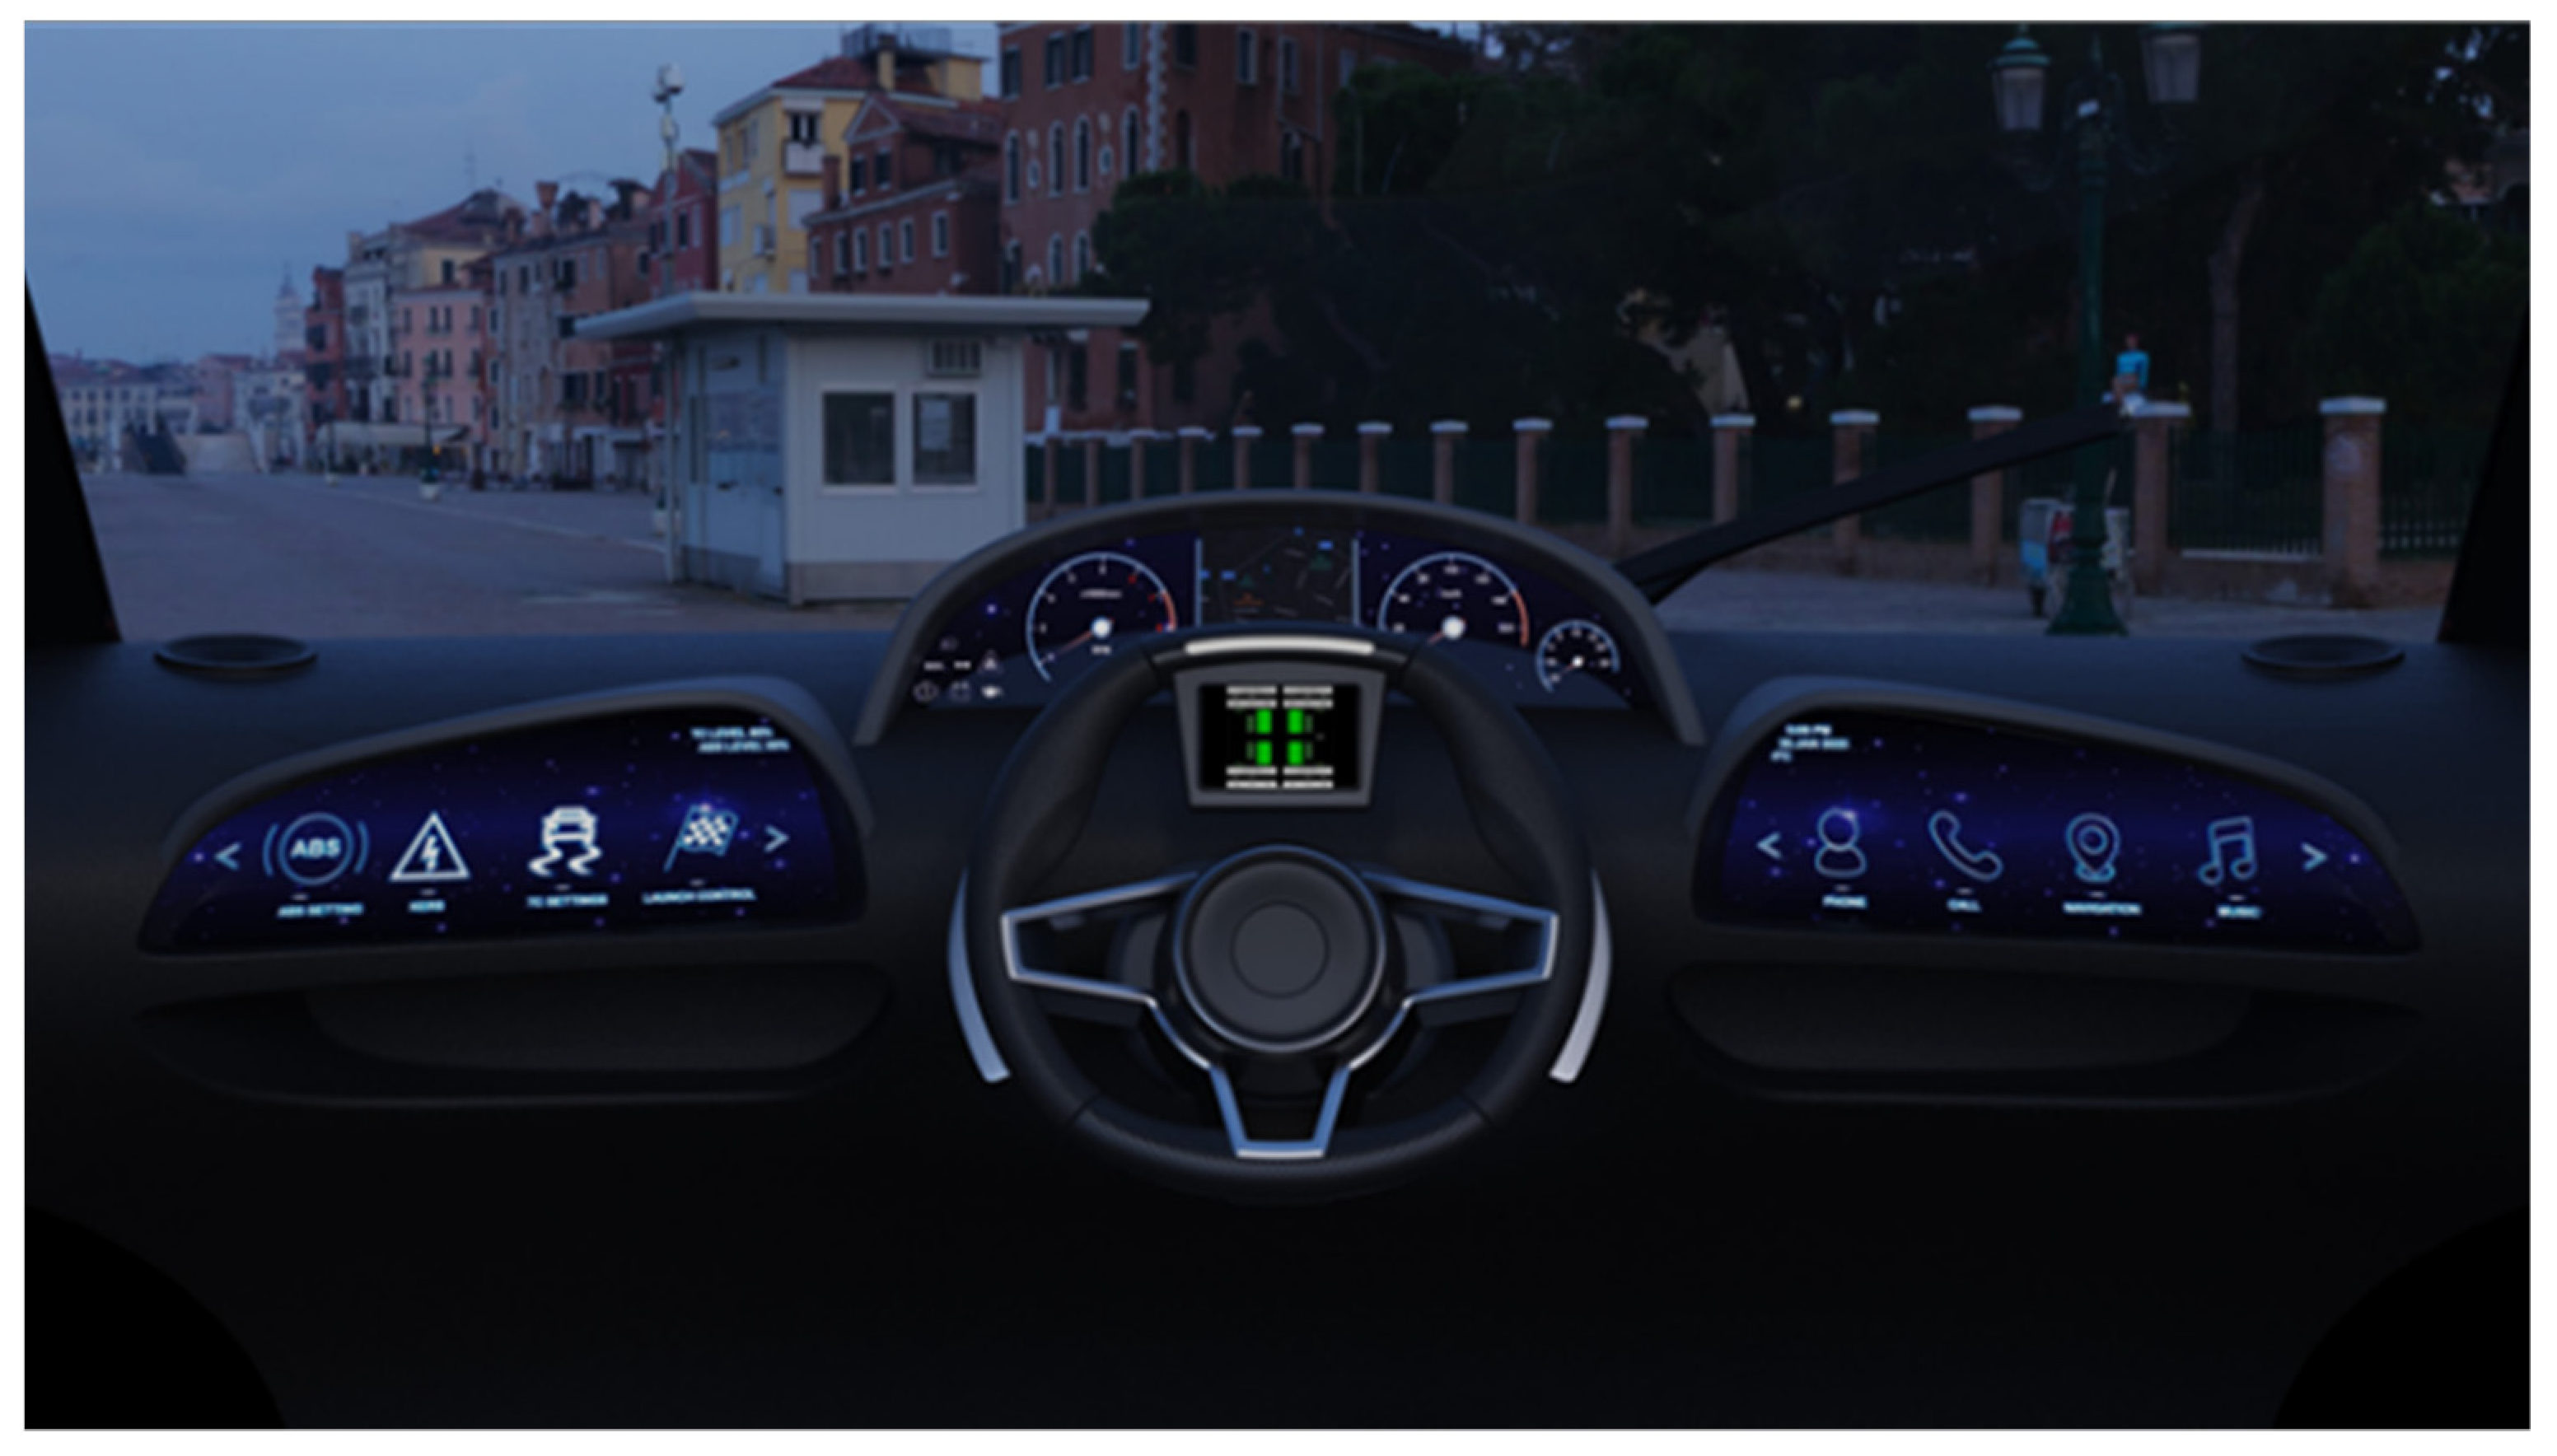
3.2.4. Dashboard View and ADAS
- -
- Traditional and mandatory on-vehicle information (RPM, speedometer, GPS, etc.);
- -
- Advanced driver assistant systems (lane warning, parking support, adaptive cruise control, etc.);
- -
- Entertainment and telematics functions (calls, music, address book, etc.).
4. Discussion
5. Conclusions
Author Contributions
Funding
Informed Consent Statement
Data Availability Statement
Conflicts of Interest
References
- Frizziero, L.; Liverani, A.; Donnici, G.; Conti, E.; Dello Preite, B.; Lamanna, U.; Leon-Cardenas, C.; Garulli, M. GD (Generative Design) applied to a Plastics Recovery Drone (PRD) using IDeS (Industrial Design Structure). Inventions 2021, 6, 82. [Google Scholar] [CrossRef]
- Graham, G.; Burns, L.; Hennelly, P.; Meriton, R. Electric sports cars and their impact on the component sourcing process. Bus. Process Manag. J. 2018, 25, 438–455. [Google Scholar] [CrossRef]
- Rieck, F.; Machielse, K.; van Duin, R. Will automotive be the future of mobility? Striving for six zeros. World Electr. Veh. J. 2020, 11, 10. [Google Scholar] [CrossRef] [Green Version]
- Mausbach, A.G.; Diels, C.; Evans, S.; Harrow, D.; Safa, F.; Quinlan, D. Ecofitting: Design directions upgrading cars to zero emissions. In Proceedings of the 2021 Sixteenth International Conference on Ecological Vehicles and Renewable Energies (EVER), Monte-Carlo, Monaco, 5–7 May 2021; IEEE: Piscataway, NJ, USA, 2021; pp. 1–7. [Google Scholar]
- Johnson, S. Classic cars: Keep motoring heritage alive. Eng. Technol. 2021, 16, 42–47. [Google Scholar] [CrossRef]
- Weldon, P.; Morrissey, P.; O’Mahony, M. Long-term cost of ownership comparative analysis between electric vehicles and internal combustion engine vehicles. Sustain. Cities Soc. 2018, 39, 578–591. [Google Scholar] [CrossRef]
- Han, J.; Vahidi, A.; Sciarretta, A. Fundamentals of energy efficient driving for combustion engine and electric vehicles: An optimal control perspective. Automatica 2019, 103, 558–572. [Google Scholar] [CrossRef]
- Adhikari, M.; Ghimire, L.P.; Kim, Y.; Aryal, P.; Khadka, S.B. Identification and analysis of barriers against electric vehicle use. Sustainability 2020, 12, 4850. [Google Scholar] [CrossRef]
- Chandra Kruse, L.; Nickerson, J.V. Portraying Design Essence. In Proceedings of the 51st Hawaii International Conference in System Science (HICSS), Big Island, HI, USA, 3 January 2018. [Google Scholar]
- De Winter, J.C.F.; Eisma, Y.B.; Cabrall, C.D.D.; Hancock, P.A.; Stanton, N.A. Situation awareness based on eye movements in relation to the task environment. Cogn. Technol. Work 2019, 21, 99–111. [Google Scholar] [CrossRef] [Green Version]
- Donnici, G.; Frizziero, L.; Liverani, A.; Galiè, G.; Lelli, F. A New SUV Conceived by Stylistic Design Engineering (SDE). In Proceedings of the International Conference on Industrial Engineering and Operations Management, Bangkok, Thailand, 5–7 March 2019; IEOM Society: Bologna, Italy, 2019; pp. 2125–2142. [Google Scholar]
- Frizziero, L.; Donnici, G.; Francia, D.; Caligiana, G.; Gaddoni, A. Stylistic design engineering (SDE) for an innovative green vehicle following QFD and triz applications. Int. J. Mech. Prod. Eng. Res. Dev. 2019, 9, 805–827. [Google Scholar] [CrossRef]
- Donnici, G.; Frizziero, L.; Liverani, A.; Buscaroli, G.; Raimondo, L.; Saponaro, E.; Venditti, G. A new car concept developed with stylistic design engineering (SDE). Inventions 2020, 5, 30. [Google Scholar] [CrossRef]
- Verganti, R. Innovazione, Design e Management. Strategie e Politiche per il Sistema-Piemonte; Politecnico di Milano, Harvard Business School: Milan, Italy, 2008. [Google Scholar]
- Canestraro, N. The Impact of Design Thinking on Education: The case of Active Learning Lab; Ca’ Foscari University of Venice: Venice, Italy, 2017. [Google Scholar]
- Frizziero, L.; Donnici, G.; Dhaimini, K.; Liverani, A.; Caligiana, G. Advanced design applied to an original multi-purpose ventilator achievable by additive manufacturing. Appl. Sci. 2018, 8, 2635. [Google Scholar] [CrossRef] [Green Version]
- Frizziero, L.; Donnici, G.; Liverani, A.; Alessandri, G.; Menozzi, G.C.; Varotti, E. Developing innovative crutch using IDeS (industrial design structure) methodology. Appl. Sci. 2019, 9, 5032. [Google Scholar] [CrossRef] [Green Version]
- Frizziero, L.; Liverani, A.; Donnici, G.; Giuliano, I.; Picciariello, M.G.; Tucci, M.L.; Reimer, D.; Ali, A. Application of IDeS (Industrial Design Structure) to Sustainable Mobility: Case Study of an Innovative Bicycle. Inventions 2021, 6, 22. [Google Scholar] [CrossRef]
- Donnici, G.; Frizziero, L.; Liverani, A.; Aiello, S.; Marinelli, L.; Salzano, A. Stylistic Design Engineering (SDE) Framed Inside IDES (industrial design structure) to Conceive a New Future Citycar. In Proceedings of the International Conference on Industrial Engineering and Operations Management, Detroit, MI, USA, 10–14 August 2020; IEOM Society: Bologna, Italy, 2020. [Google Scholar]
- Butt, J. A strategic roadmap for the manufacturing industry to implement industry 4.0. Designs 2020, 4, 11. [Google Scholar] [CrossRef]
- Ikumapayi, O.M.; Akinlabi, E.T.; Mwema, F.M.; Ogbonna, O.S. Six sigma versus lean manufacturing—An overview. Mater. Today Proc. 2020, 26, 3275–3281. [Google Scholar] [CrossRef]
- Gijo, E.V.; Bhat, S.; Antony, J.; Park, S.H. Ten commandments for successful implementation of Design for Six Sigma. TQM J. 2021, 33, 1666–1682. [Google Scholar] [CrossRef]
- Erdil, N.O.; Arani, O.M. Quality function deployment: More than a design tool. Int. J. Qual. Serv. Sci. 2019, 11, 142–166. [Google Scholar] [CrossRef]
- Vanany, I.; Maarif, G.A.; Soon, J.M. Application of multi-based quality function deployment (QFD) model to improve halal meat industry. J. Islam. Mark. 2019, 10, 97–124. [Google Scholar] [CrossRef]
- Gandara, G.S.; Muri, R.; Purba, H.H. Increase service selling of formaldehyde products by implementing Quality Function Deployment (QFD). J. Appl. Res. Ind. Eng. 2019, 6, 219–231. [Google Scholar]
- Giacobone, G.A.; Mincolelli, G. Human-Centered Design for Automotive Styling Design: Conceptualizing a Car from QFD to ViP. In Proceedings of the International Conference on Intelligent Human Systems Integration, Modena, Italy, 19–21 February 2020; Springer: New York, NY, USA, 2020; pp. 59–65. [Google Scholar]
- Adiandari, A.M.; Winata, H.; Fitriandari, M.; Hariguna, T. Improving the quality of Internet banking services: An implementation of the quality function deployment (QFD) concept. Manag. Sci. Lett. 2020, 10, 1121–1128. [Google Scholar] [CrossRef]
- Hasibuan, A.; Parinduri, L.; Sulaiman, O.K.; Suleman, A.R.; Harahap, A.K.Z.; Hasibuan, M.; Rupilele, F.G.J.; Simarmata, J.; Kurniasih, N.; Daengs, G.S.A.; et al. Service quality improvement by using the quality function deployment (QFD) method at the government general hospital. J. Phys. Conf. Ser. 2019, 1363, 012095. [Google Scholar] [CrossRef]
- Ping, Y.-J.; Liu, R.; Lin, W.; Liu, H.-C. A new integrated approach for engineering characteristic prioritization in quality function deployment. Adv. Eng. Inform. 2020, 45, 101099. [Google Scholar] [CrossRef]
- Murtazina, M.S.; Avdeenko, T. V An ontology-based approach to support for requirements traceability in agile development. Procedia Comput. Sci. 2019, 150, 628–635. [Google Scholar] [CrossRef]
- Kchaou, D.; Bouassida, N.; Mefteh, M.; Ben-Abdallah, H. Recovering semantic traceability between requirements and design for change impact analysis. Innov. Syst. Softw. Eng. 2019, 15, 101–115. [Google Scholar] [CrossRef]
- Saleem, M.; Minhas, N.M. Information retrieval based requirement traceability recovery approaches-a systematic literature review. Univ. Sindh J. Inf. Commun. Technol. 2018, 2, 180–188. [Google Scholar]
- Donnici, G.; Frizziero, L.; Francia, D.; Liverani, A.; Caligiana, G. Innovation design driven by QFD and TRIZ to develop new urban transportation means. Aust. J. Mech. Eng. 2019, 19, 300–316. [Google Scholar] [CrossRef]
- Donnici, G.; Frizziero, L.; Francia, D.; Liverani, A.; Caligiana, G. TRIZ method for innovation applied to an hoverboard. Cogent Eng. 2018, 5, 1524537. [Google Scholar] [CrossRef]
- Tan, C.; Chung, H.; Barton, K.; Hu, S.J.; Freiheit, T. Incorporating customer personalization preferences in open product architecture design. J. Manuf. Syst. 2020, 56, 72–83. [Google Scholar] [CrossRef]
- Meissner, D.; Burton, N.; Galvin, P.; Sarpong, D.; Bach, N. Understanding cross border innovation activities: The linkages between innovation modes, product architecture and firm boundaries. J. Bus. Res. 2020, 128, 762–769. [Google Scholar] [CrossRef]
- Munoz, F. New Car Registrations in Europe’s Largest Market At Lowest Level Since 1985. Available online: https://www.jato.com/new-car-registrations-in-europes-largest-market-at-lowest-level-since-1985/ (accessed on 18 January 2022).
- Waluś, K.J.; Warguła, Ł.; Krawiec, P.; Adamiec, J.M. Legal regulations of restrictions of air pollution made by non-road mobile machinery—The case study for Europe: A review. Environ. Sci. Pollut. Res. 2017, 25, 3243–3259. [Google Scholar] [CrossRef] [Green Version]
- Bauer, C.; Scheid, L.; Carroll, S.G. EU Plotting Ban on Internal Combustion Engine as of 2025: Industry. Euractiv, 2 March 2021. [Google Scholar]
- Carey, N.; Steitz, C. EU Proposes Effective Ban for New Fossil-Fuel Cars From 2035. Available online: https://www.reuters.com/business/retail-consumer/eu-proposes-effective-ban-new-fossil-fuel-car-sales-2035-2021-07-14/ (accessed on 20 March 2022).
- Briggs Automotive Company (BAC). BAC Mono—The Power of One. Available online: https://www.bac-mono.com/mono-r (accessed on 10 January 2022).
- Ariel Motor Company. Atom—Specifications. Available online: https://www.arielmotor.co.uk/atom/atom-specifications/ (accessed on 10 March 2022).
- Ferryanto, L. The Path to Improved Product Development. Lean Six Sigma Rev. 2008, 8, 21. [Google Scholar]
- Ericsson, E.; Gustafsson, P.; Lilliesköld, J.; Sörqvist, L. DFSS–Evolution or Revolution? A Study of Critical Effects Related to Successful Implementation of DFSS. In Proceedings of the ICQSS Conference, Cardiff, UK, 22–24 August 2018; Volume 2009. [Google Scholar]


| Design A: Stone | Design B: Natural | ||
|---|---|---|---|
| Area (m2) | 1.29 | Area (m2) | 1.33 |
| Drag Force (N) | 670 | Drag Force (N) | 730 |
| Speed (Km/h) | 55.5 | Speed (Km/h) | 55.5 |
| Air Density (Kg/m3) | 1.225 | Air Density (Kg/m3) | 1.225 |
| Cd | 0.27529 | Cd | 0.29092 |
Publisher’s Note: MDPI stays neutral with regard to jurisdictional claims in published maps and institutional affiliations. |
© 2022 by the authors. Licensee MDPI, Basel, Switzerland. This article is an open access article distributed under the terms and conditions of the Creative Commons Attribution (CC BY) license (https://creativecommons.org/licenses/by/4.0/).
Share and Cite
Frizziero, L.; Leon-Cardenas, C.; Colasurdo, G.; Vicaretti, A.; Liverani, A. IDeS (Industrial Design Structure) Method Applied to the Automotive Design Framework: Two Sports Cars with Shared Platform. Inventions 2022, 7, 36. https://doi.org/10.3390/inventions7020036
Frizziero L, Leon-Cardenas C, Colasurdo G, Vicaretti A, Liverani A. IDeS (Industrial Design Structure) Method Applied to the Automotive Design Framework: Two Sports Cars with Shared Platform. Inventions. 2022; 7(2):36. https://doi.org/10.3390/inventions7020036
Chicago/Turabian StyleFrizziero, Leonardo, Christian Leon-Cardenas, Gabriele Colasurdo, Alessandro Vicaretti, and Alfredo Liverani. 2022. "IDeS (Industrial Design Structure) Method Applied to the Automotive Design Framework: Two Sports Cars with Shared Platform" Inventions 7, no. 2: 36. https://doi.org/10.3390/inventions7020036