
Determination of Atorvastatin with Voltammetric Sensors Based on Nanomaterials
.jpg)


Abstract
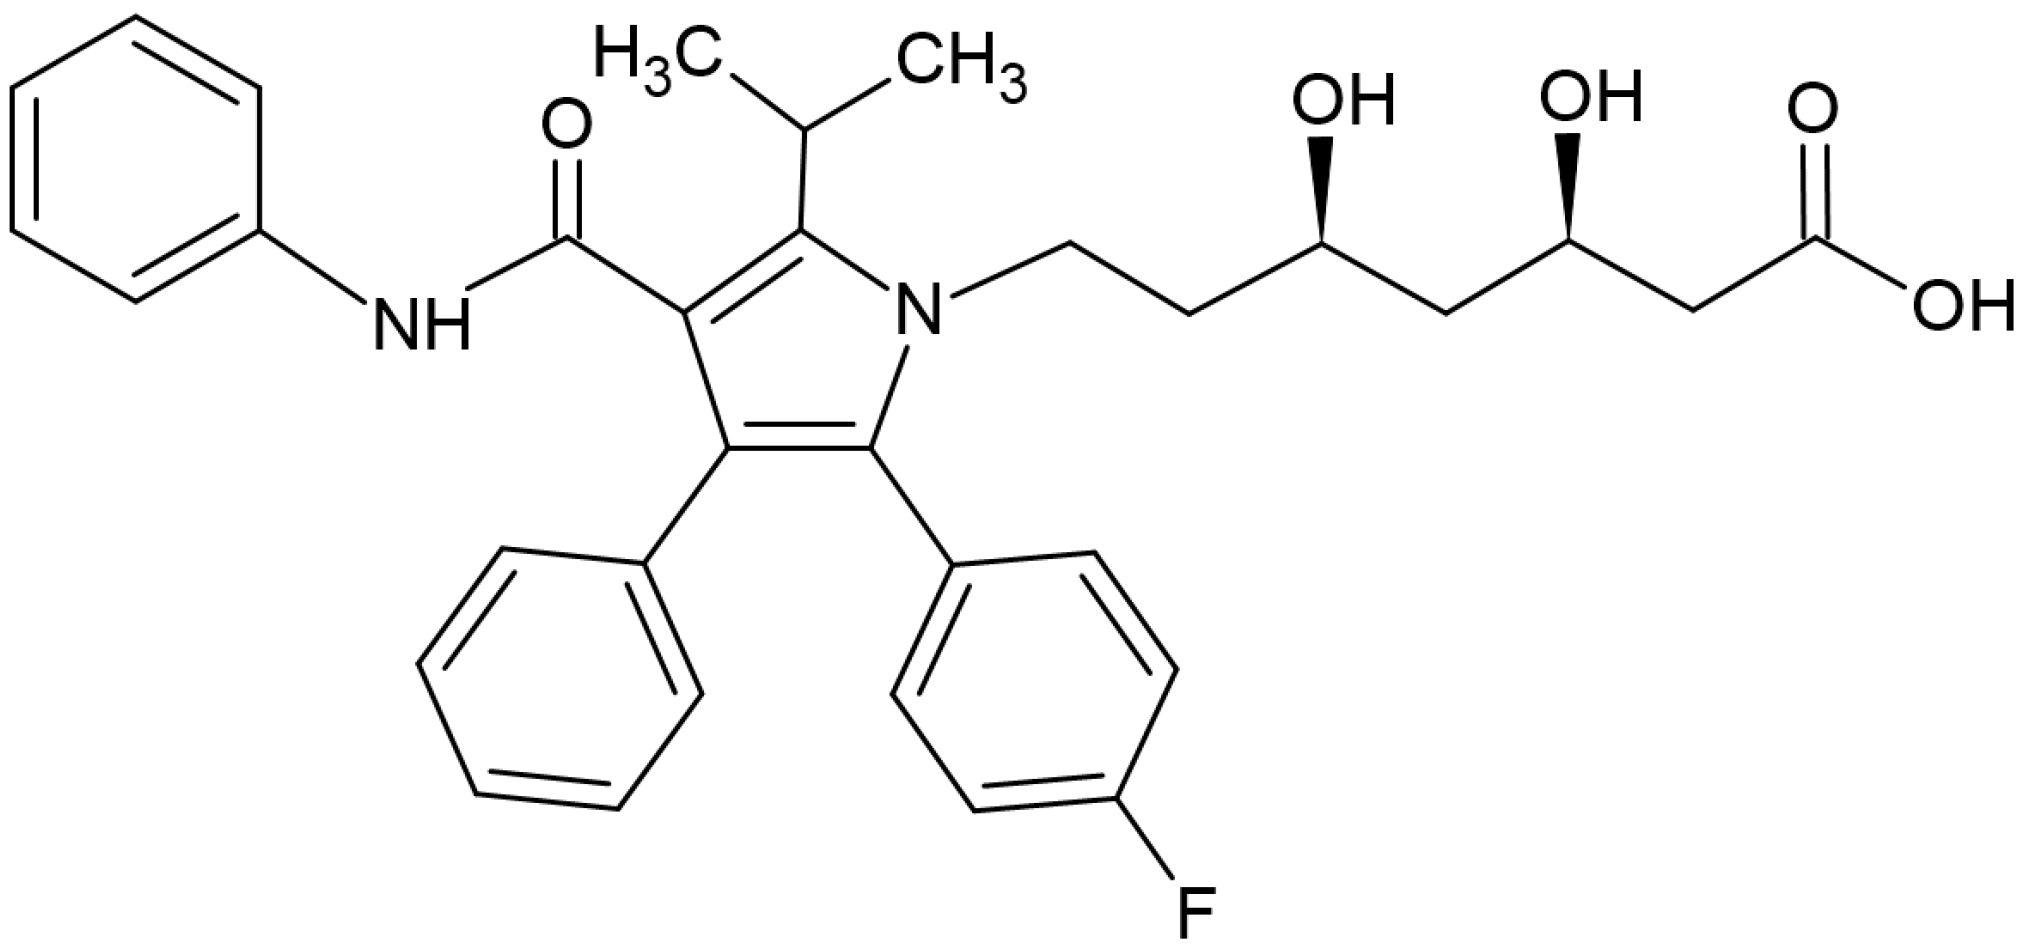
:1. Introduction
2. Materials and Methods
2.1. Reactives and Solutions
2.2. Electrochemical Measurements
2.3. Analysis of Phramaceutical Samples
3. Results and Discussion
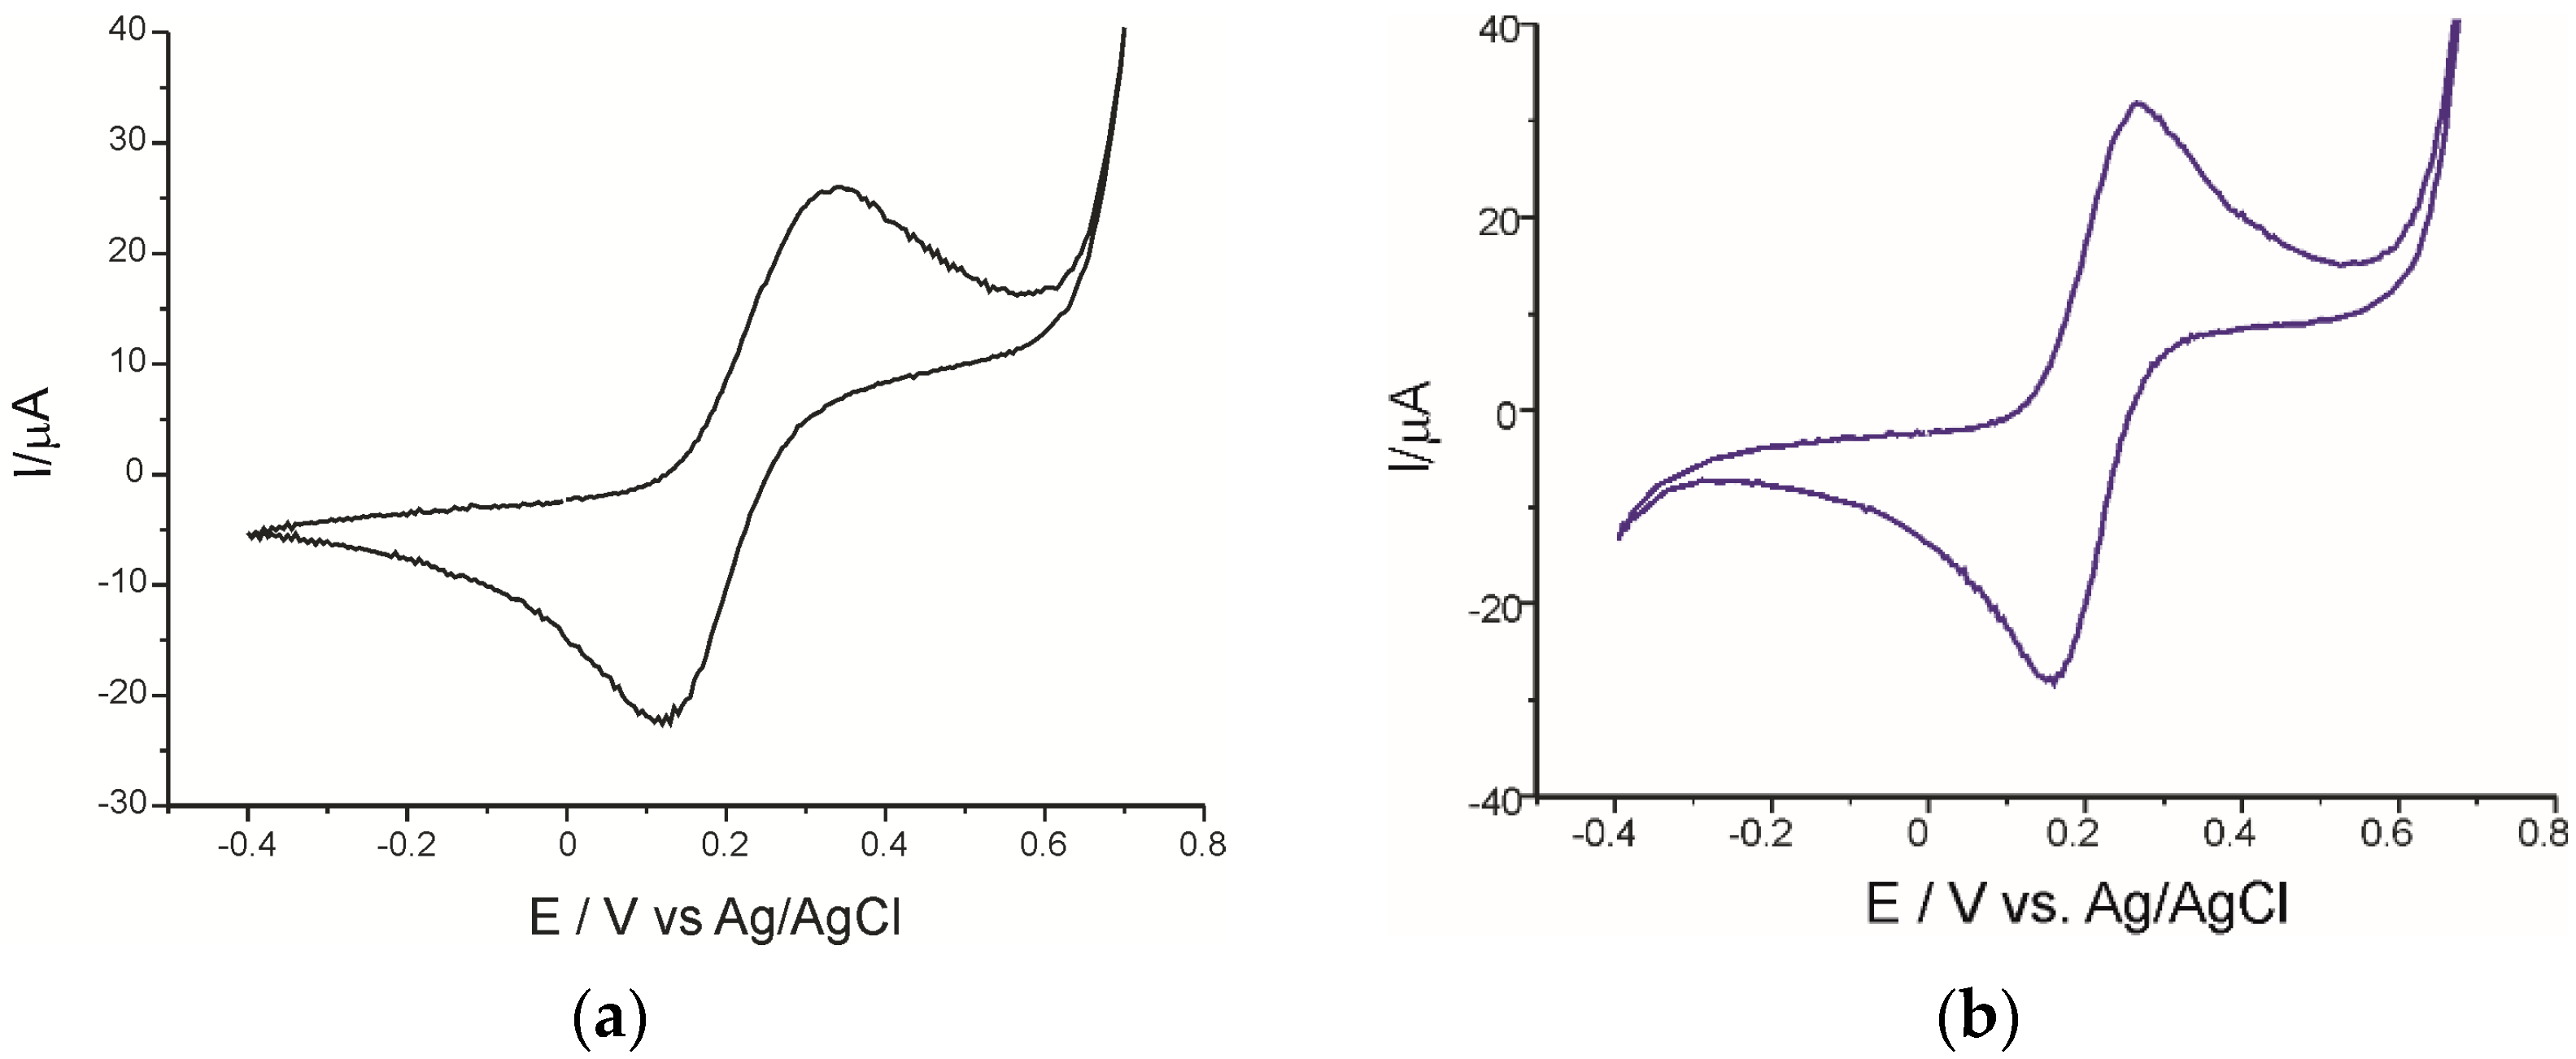
3.1. Study of the Electrochemical Behavior of Sensors in KCl Solution and Potassium Ferrocyanide/KCl Solution
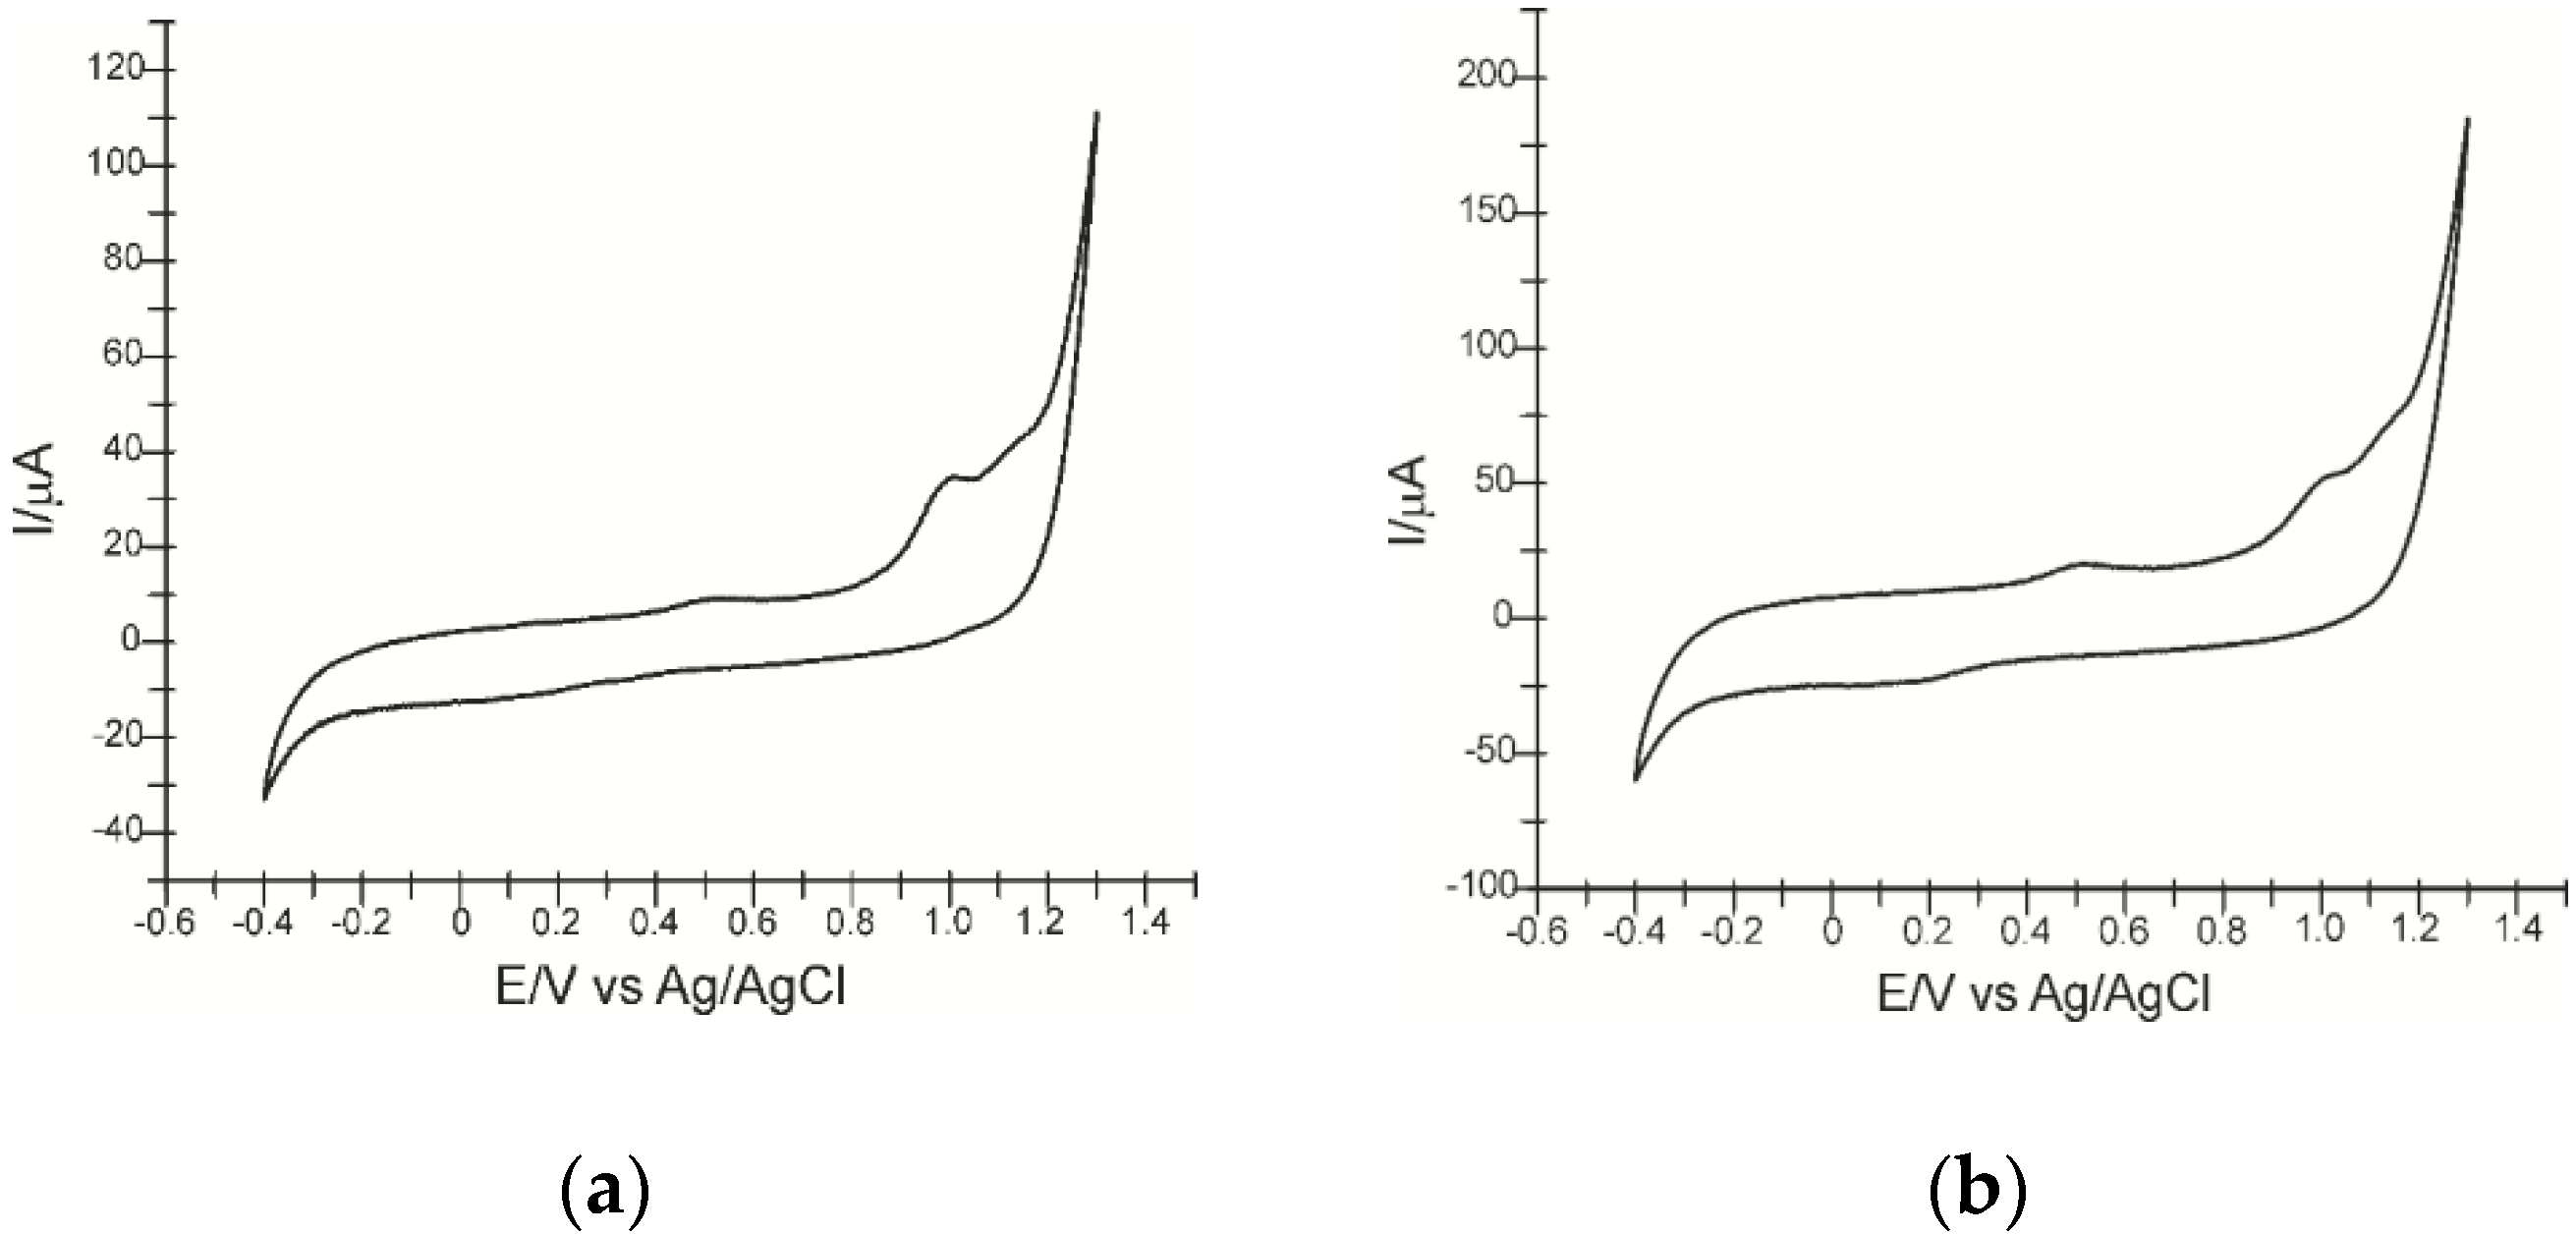
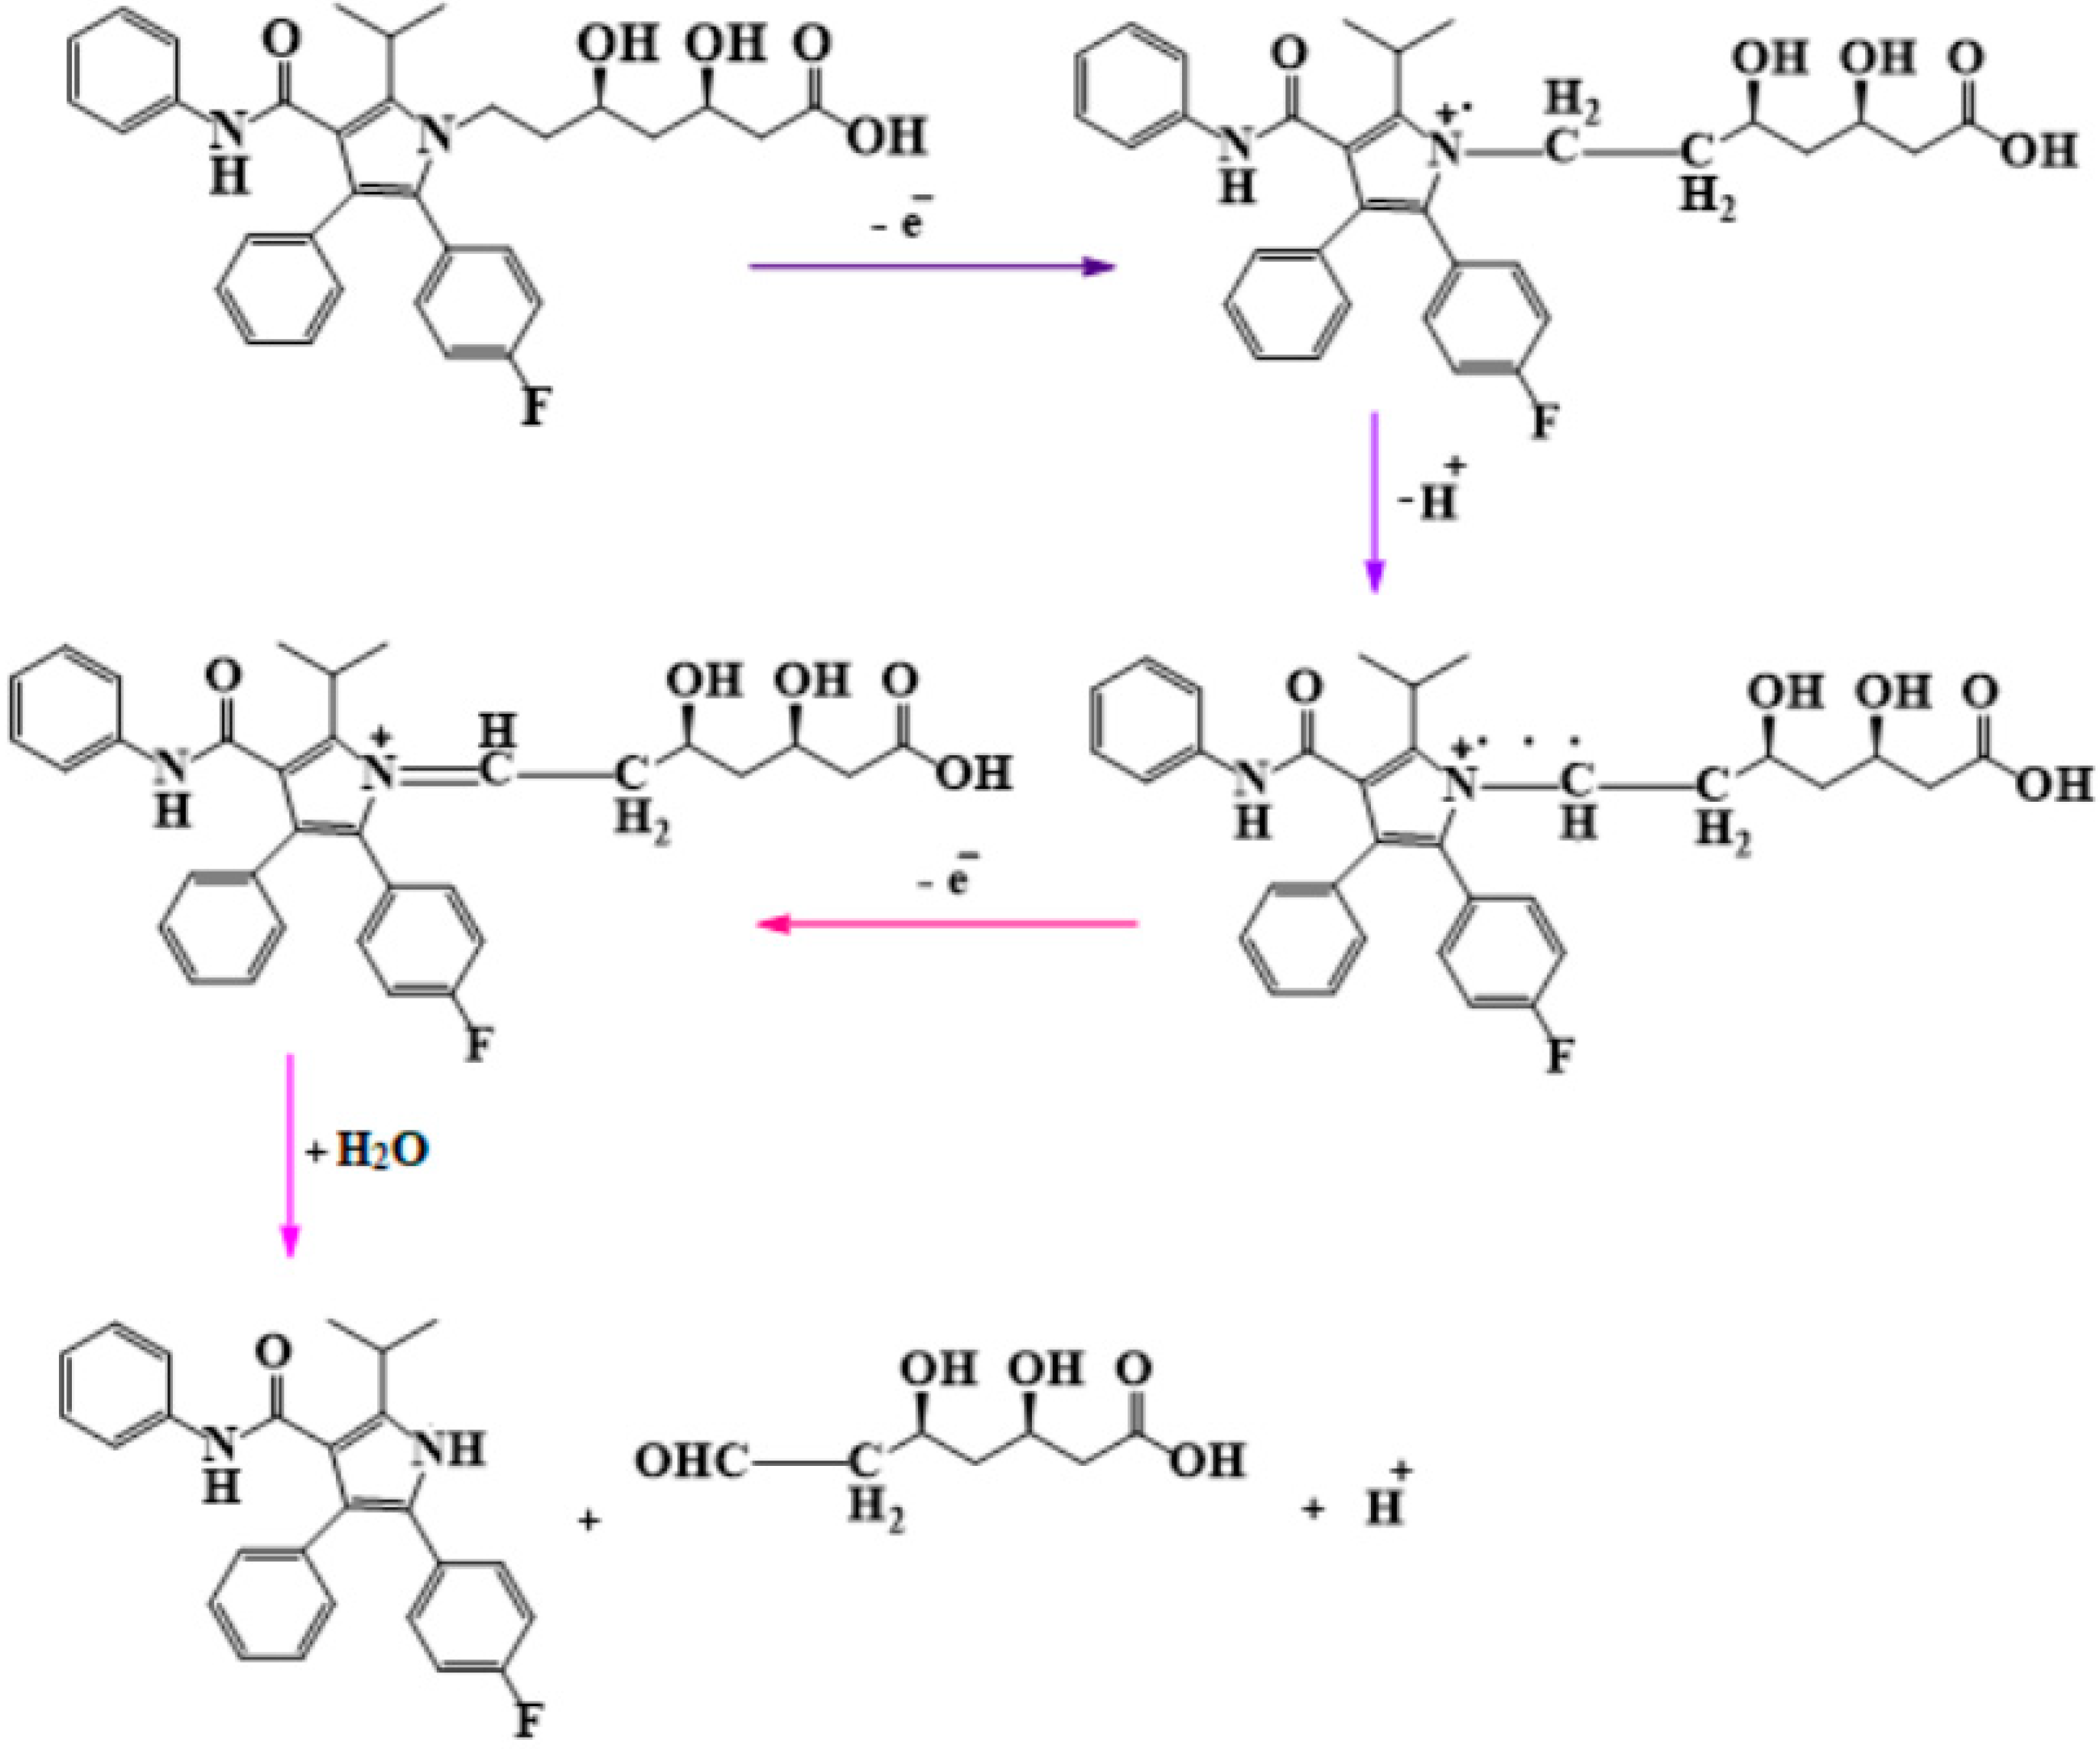
3.2. Study of the Electrochemical Behavior of the Sensors in Atorvastatin Solition (Support Electrolyte Solution KCl 10−1 M)
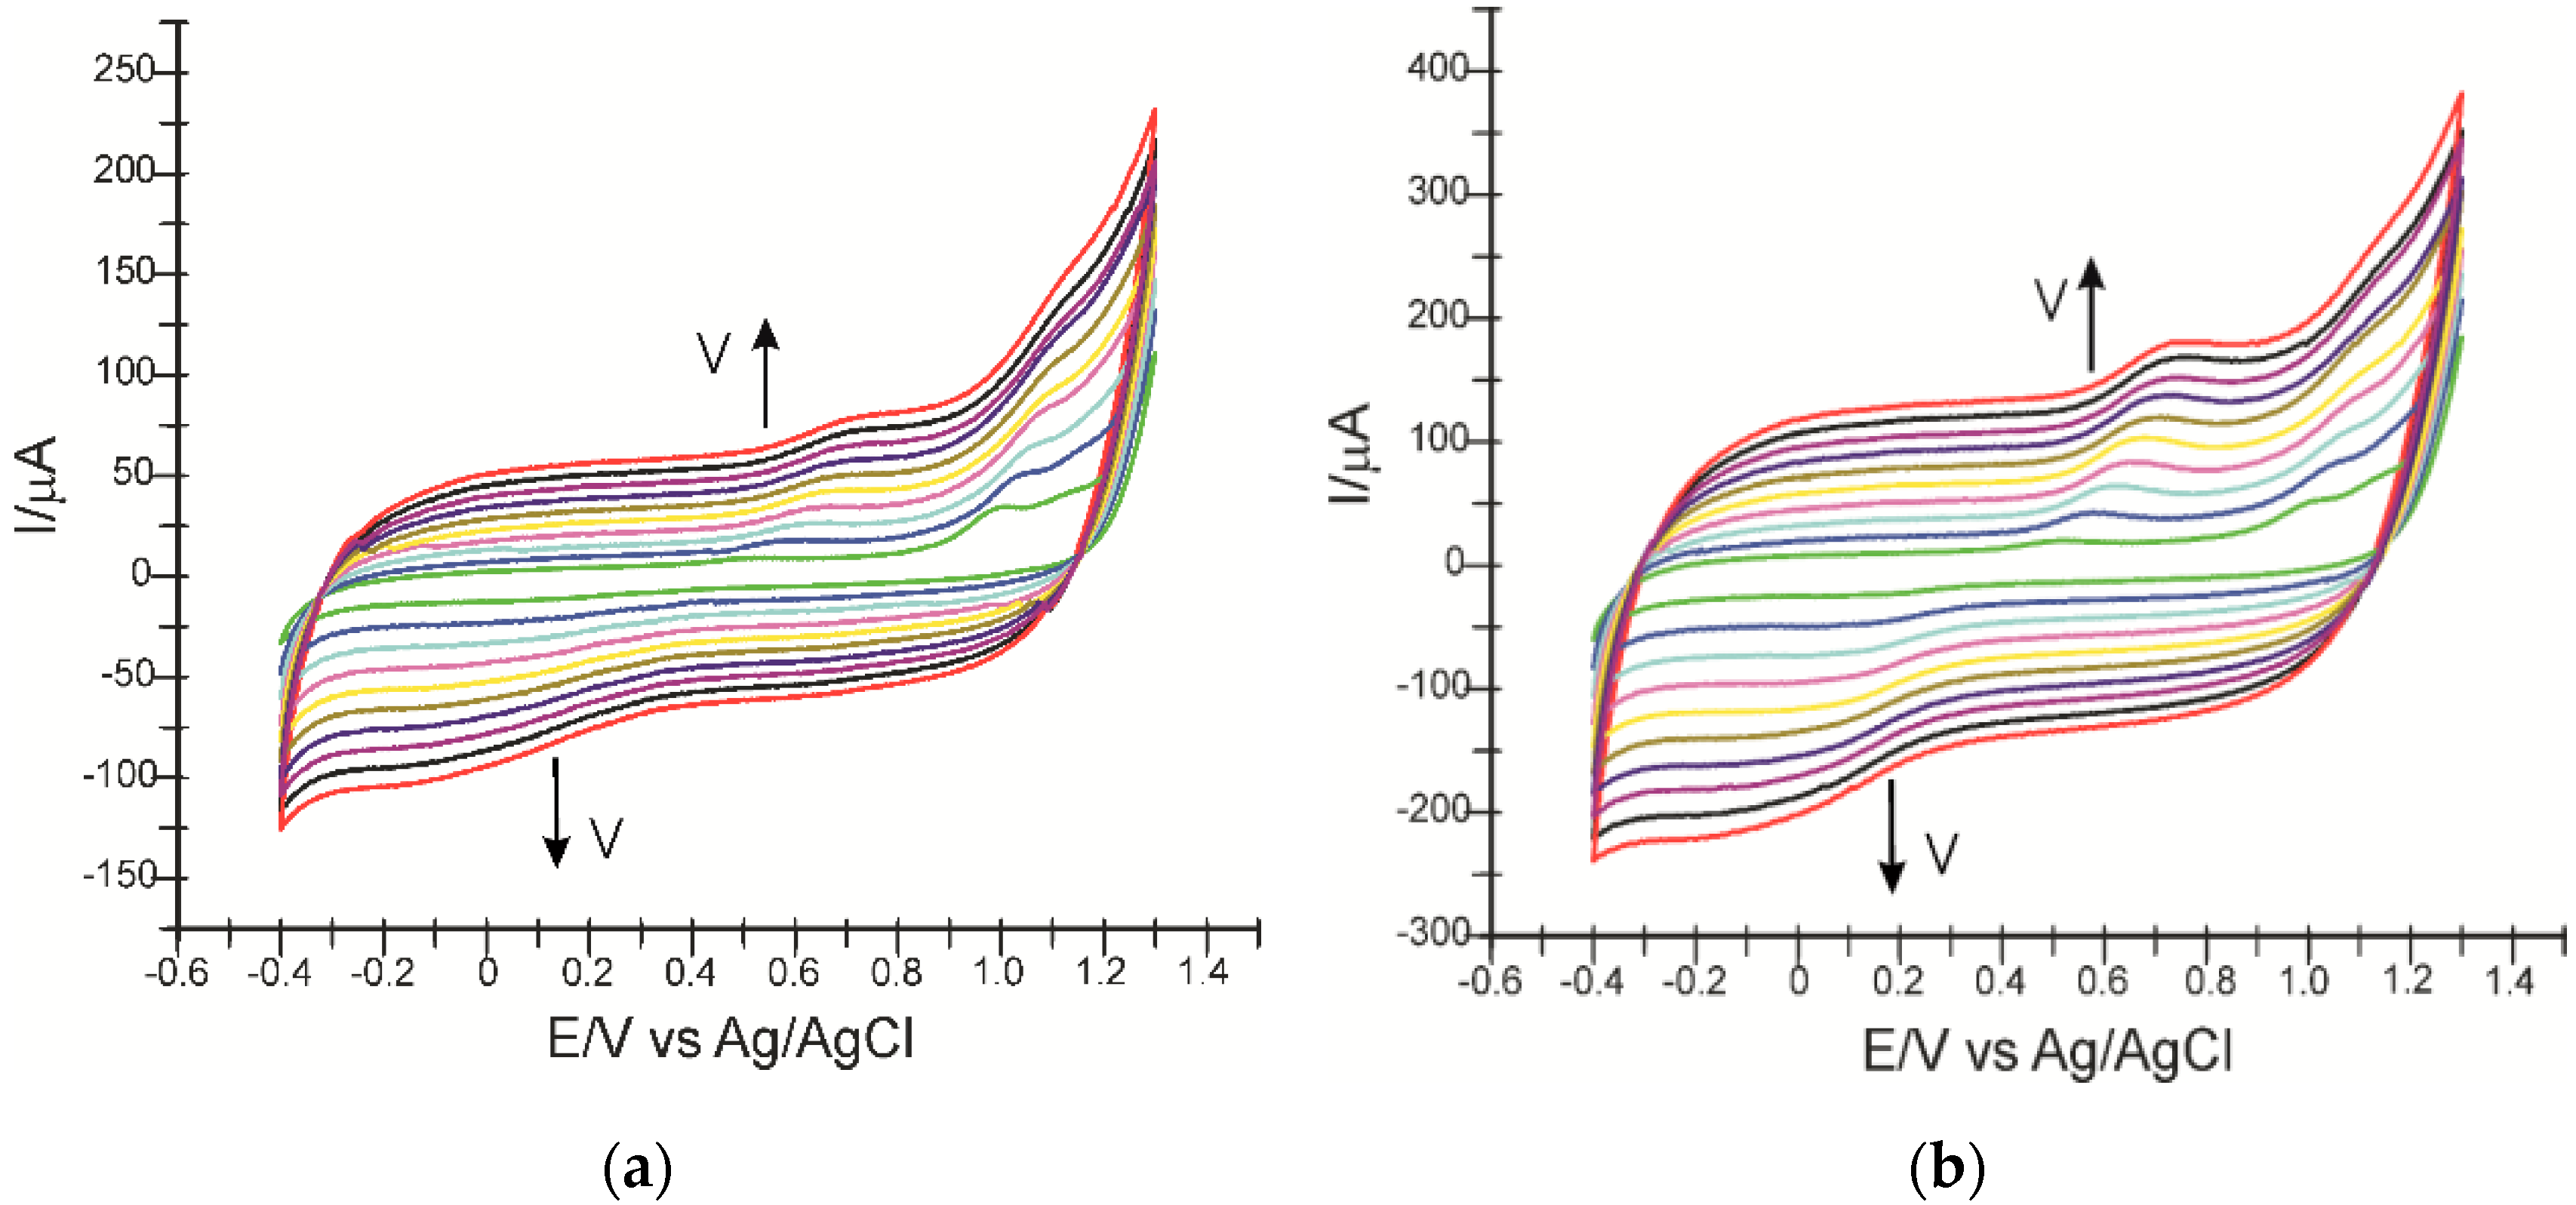
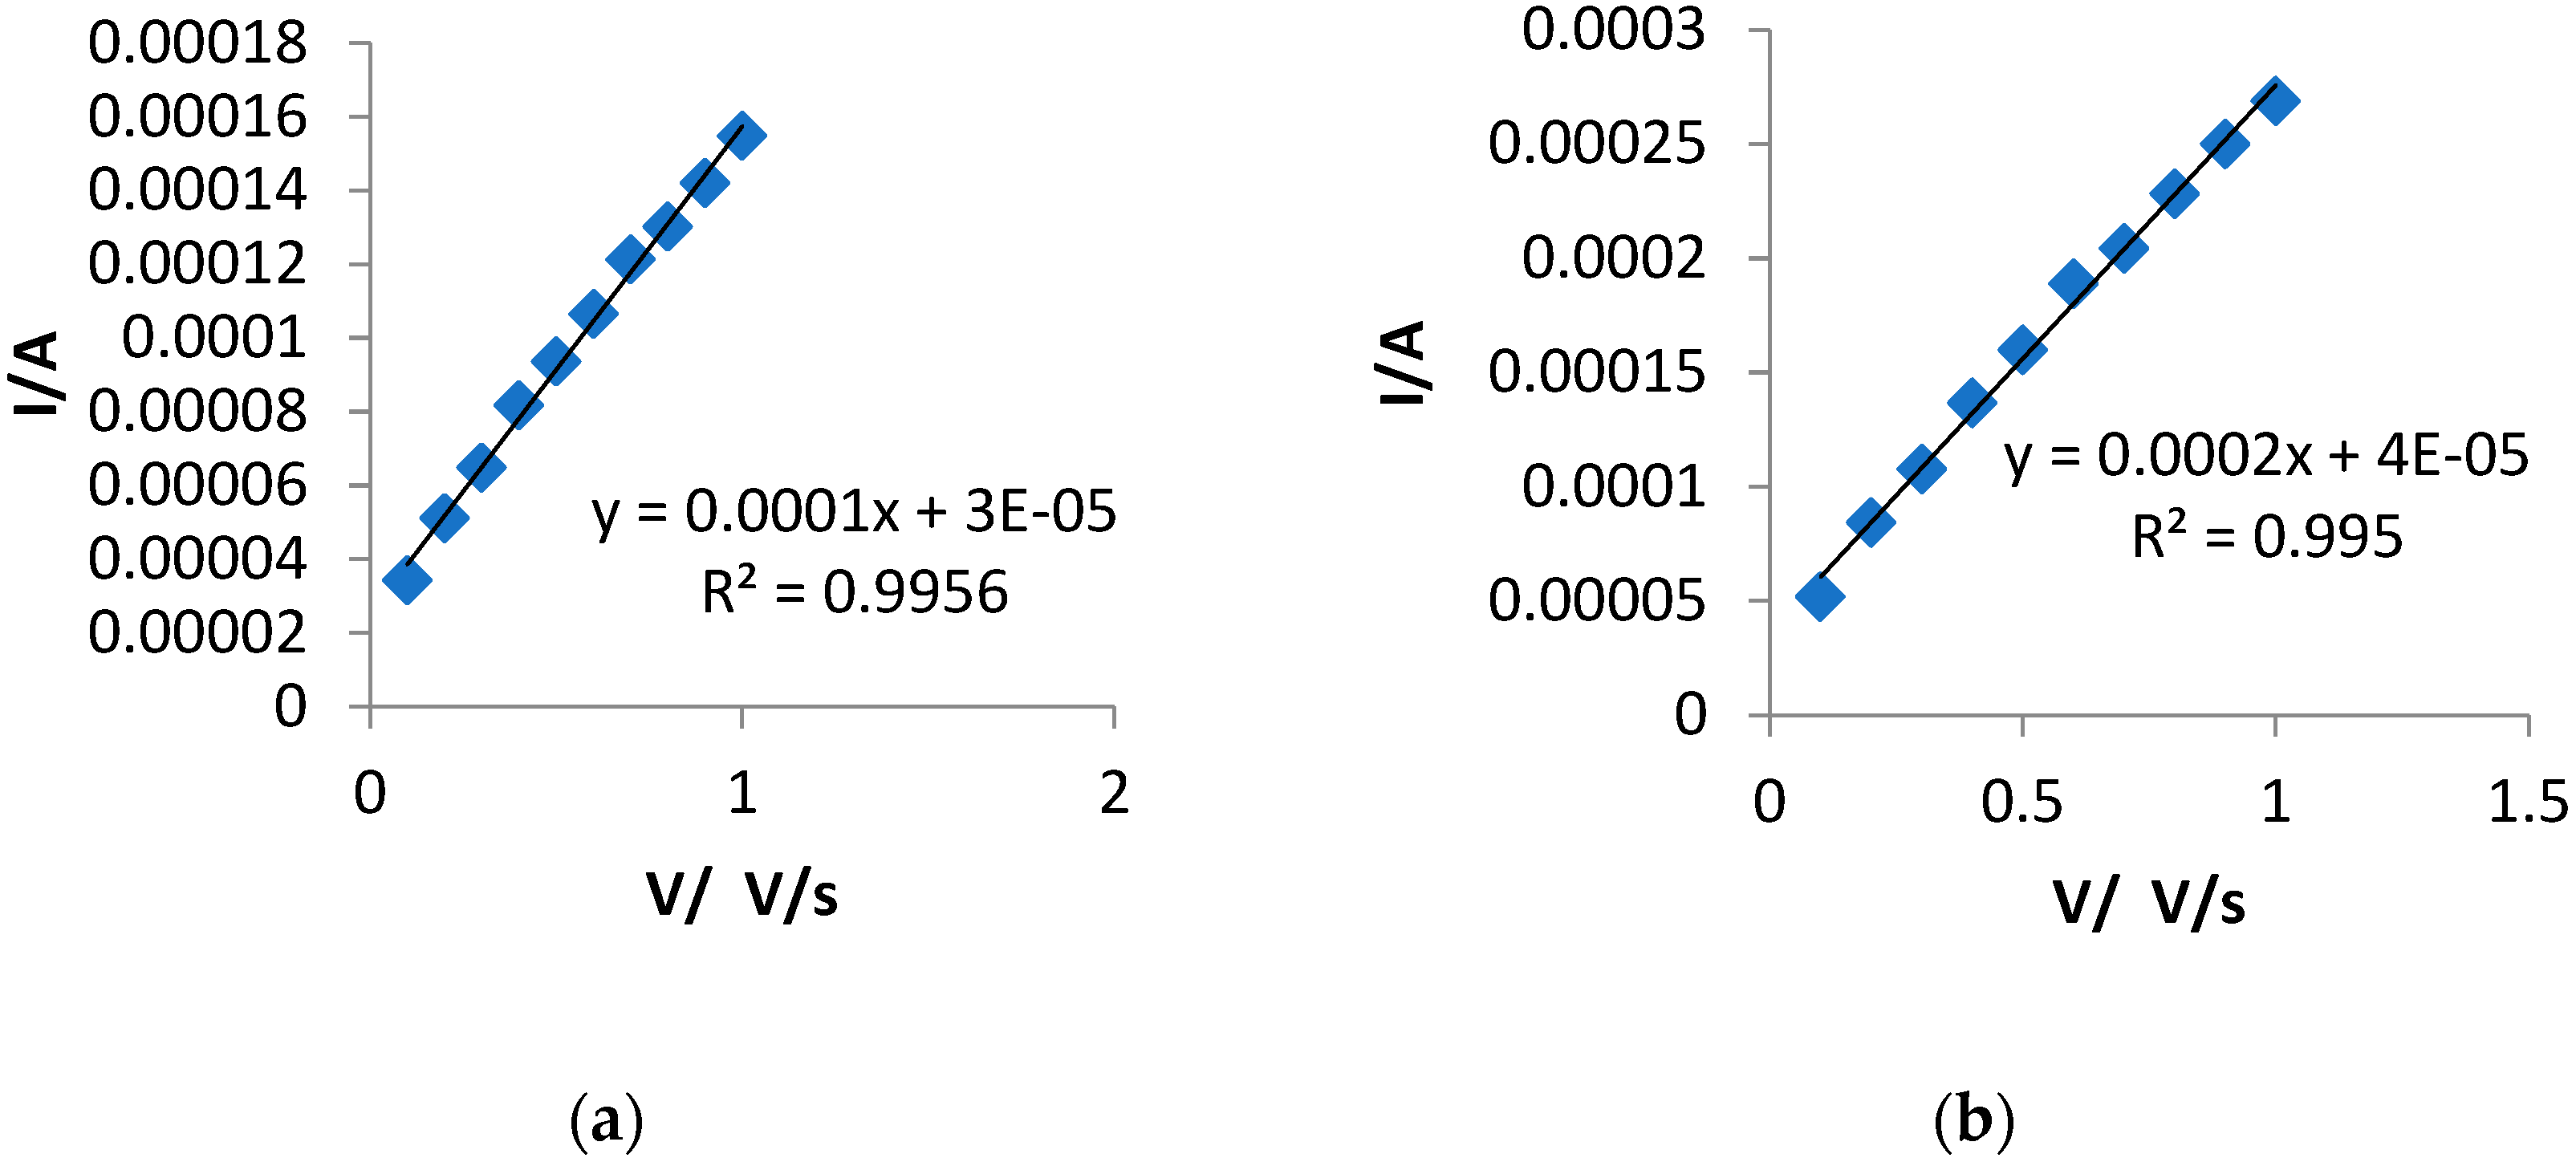
3.3. Influence of the Scan Rate on the Sensors’ Responses
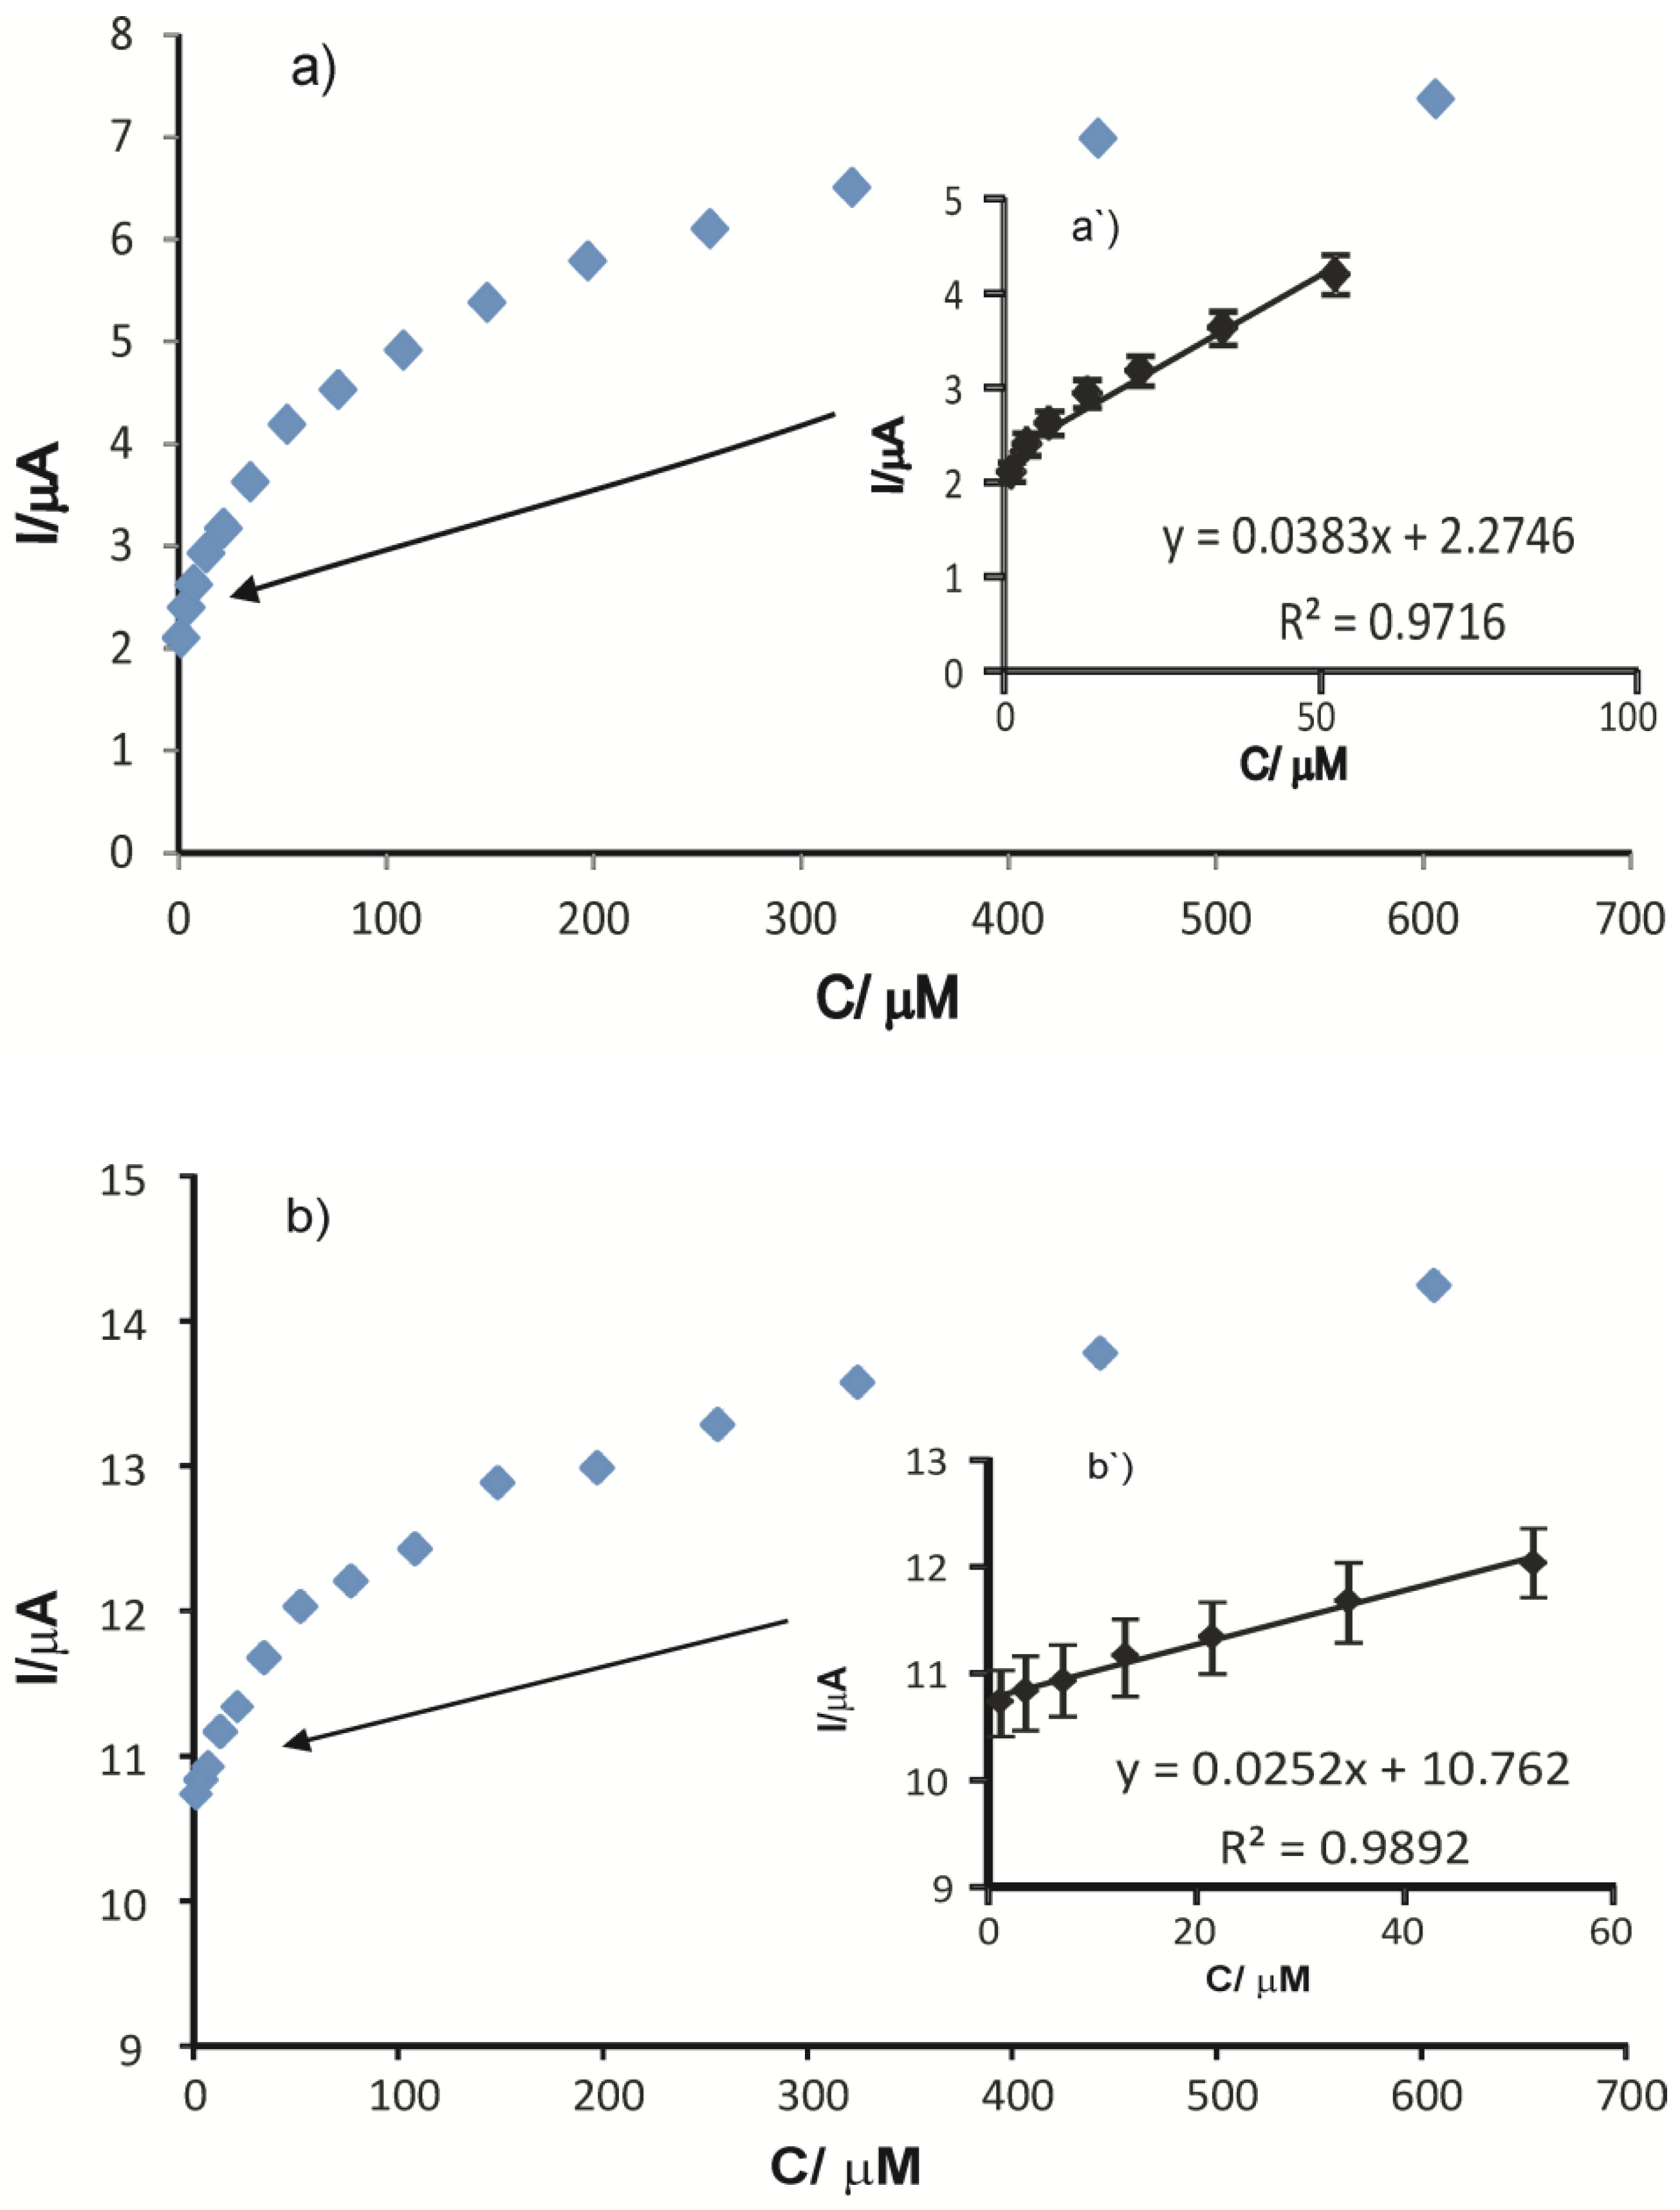
3.4. Calibration Curve and Detection Limit
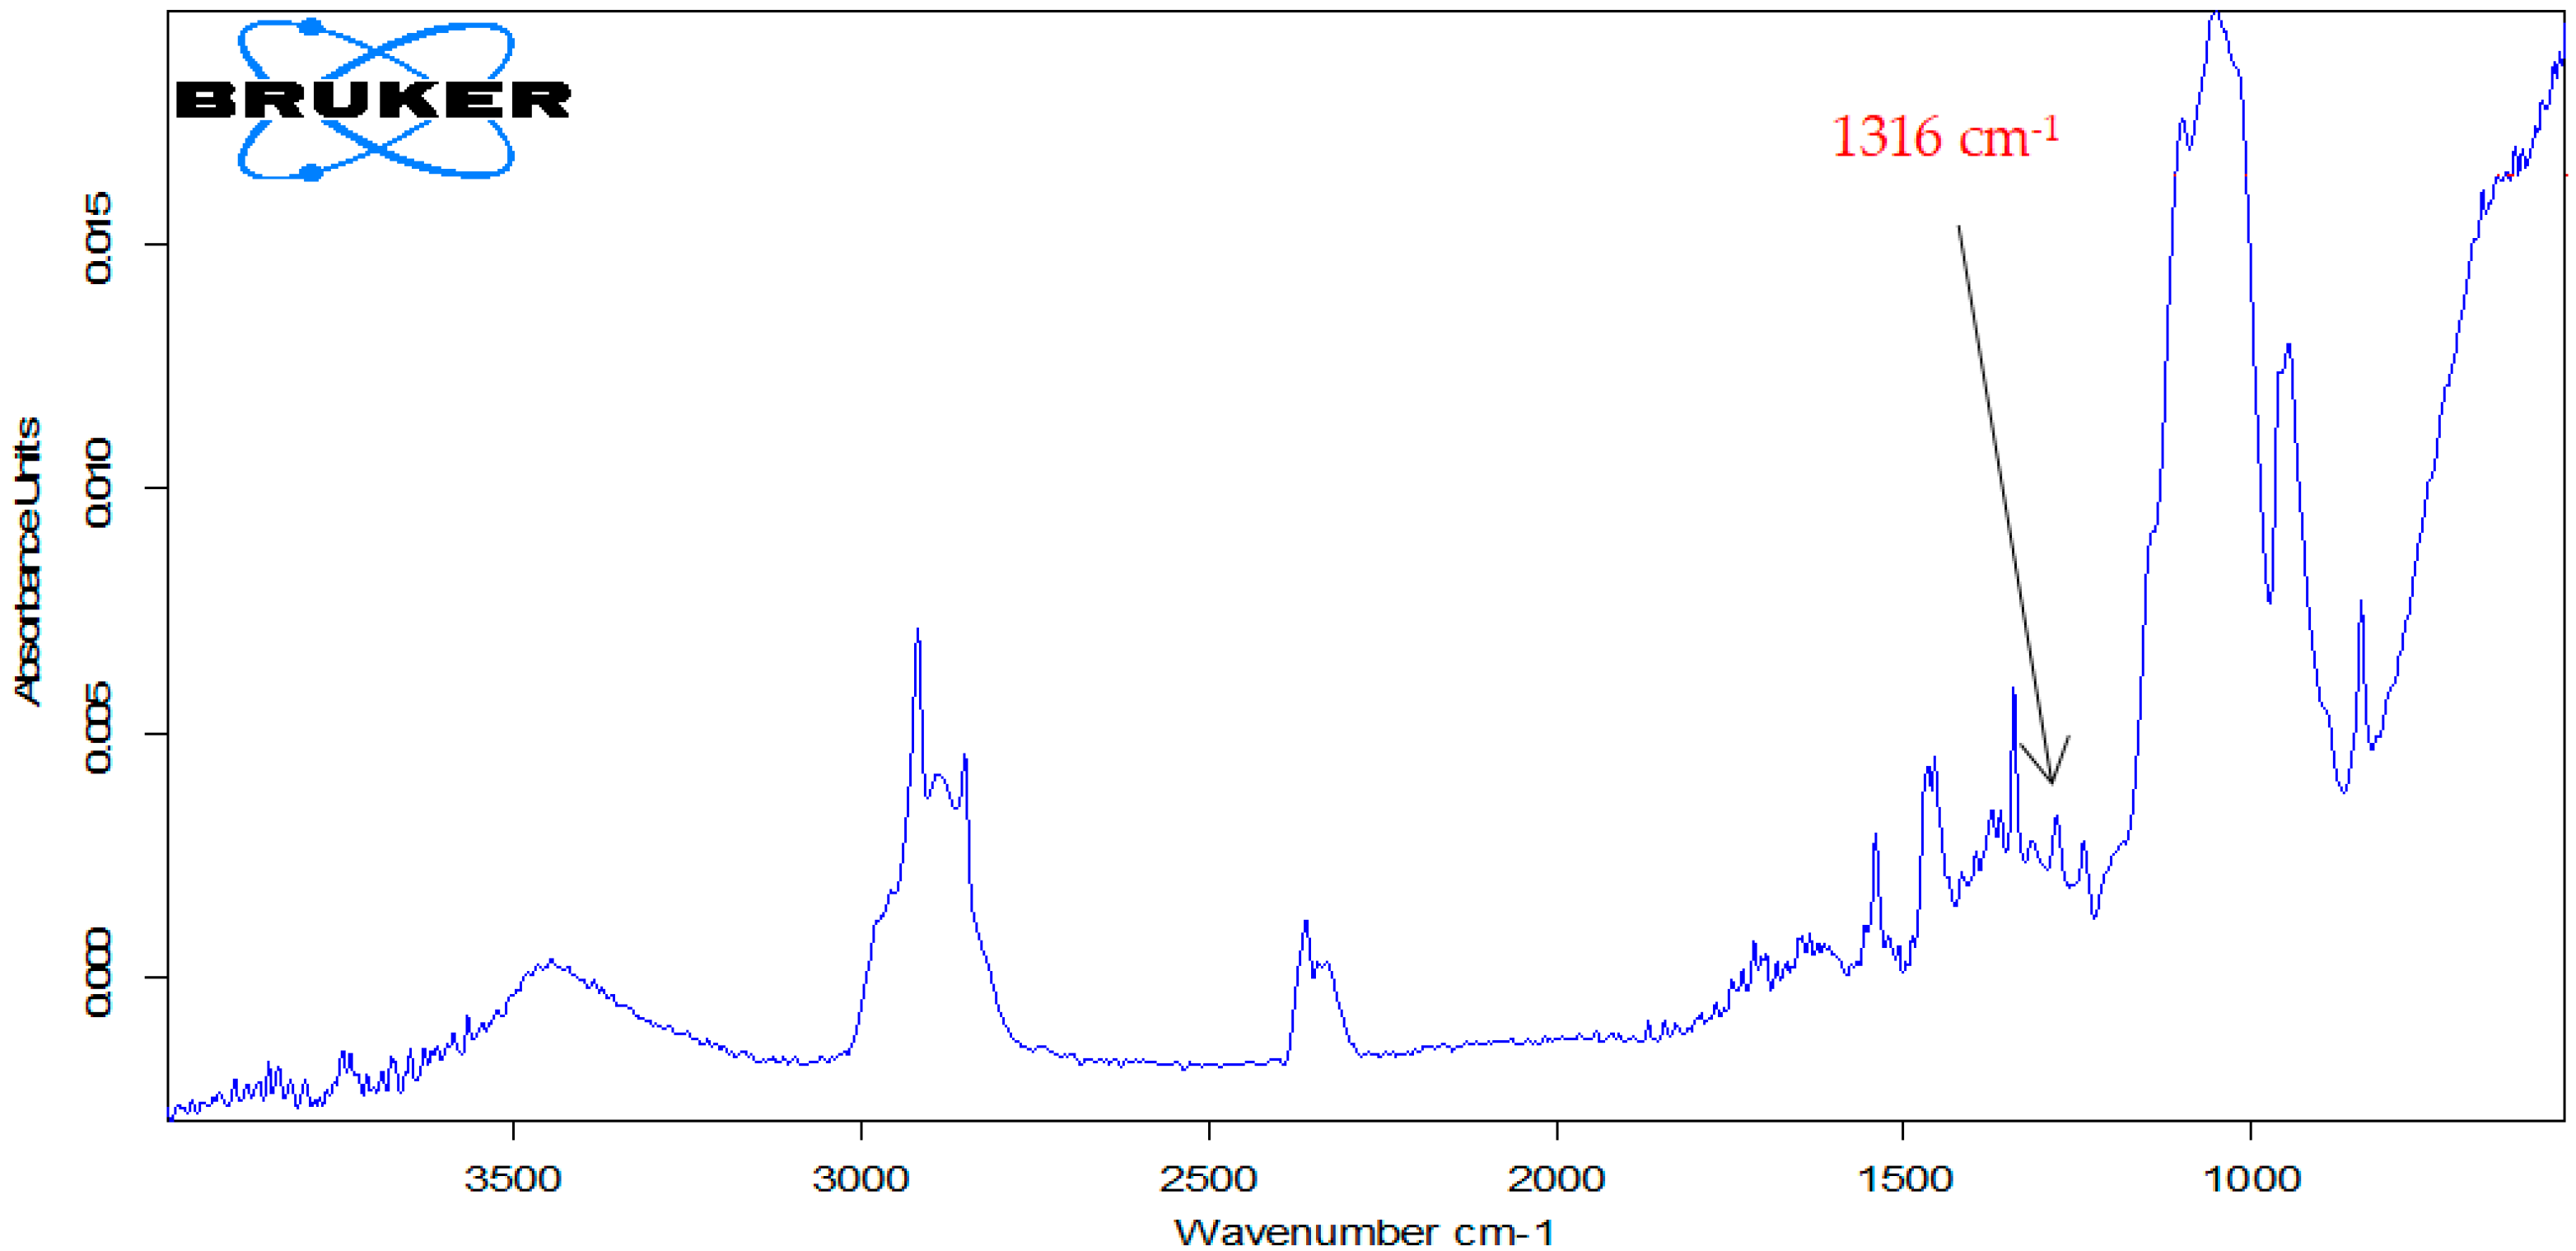
3.5. Atorvastatin Determination in the Pharmaceutical Products
3.6. Recovery Test
4. Conclusions
Author Contributions
Funding
Institutional Review Board Statement
Informed Consent Statement
Data Availability Statement
Acknowledgments
Conflicts of Interest
References
- Tsoukas, M.A.; Mantzoros, C.S. Lipodystrophy Syndromes. In Endocrinology: Adult and Pediatric; Elsevier: New York, NY, USA, 2016; pp. 648–661.e5. ISBN 978-0-323-18907-1. [Google Scholar]
- Atorvastatin (CHEBI:39548). Available online: https://www.ebi.ac.uk/chebi/searchId.do?chebiId=CHEBI:39548 (accessed on 31 July 2021).
- Ramkumar, S.; Raghunath, A.; Raghunath, S. Statin Therapy: Review of Safety and Potential Side Effects. Acta Cardiol. Sin. 2016, 32, 631–639. [Google Scholar] [CrossRef] [PubMed]
- Sewright, K.A.; Clarkson, P.M.; Thompson, P.D. Statin Myopathy: Incidence, Risk Factors, and Pathophysiology. Curr. Atheroscler. Rep. 2007, 9, 389–396. [Google Scholar] [CrossRef]
- Martins, A.F.; Frank, C.D.S.; Altissimo, J.; de Oliveira, J.A.; da Silva, D.S.; Reichert, J.F.; Souza, D.M. Determination of Statin Drugs in Hospital Effluent with Dispersive Liquid–Liquid Microextraction and Quantification by Liquid Chromatography. J. Environ. Sci. Health Part A 2017, 52, 939–945. [Google Scholar] [CrossRef] [PubMed]
- Danafar, H.; Hamidi, M. Method Validation of Amlodipine and Atorvastatin by Liquid Chromatography–Mass Spectrometry (LC–MS) Method in Human Plasma. Cogent Med. 2016, 3, 1129790. [Google Scholar] [CrossRef]
- Emhofer, L.; Himmelsbach, M.; Buchberger, W.; Klampfl, C.W. High-Performance Liquid Chromatography Drift-Tube Ion-Mobility Quadrupole Time-of-Flight/Mass Spectrometry for the Identity Confirmation and Characterization of Metabolites from Three Statins (Lipid-Lowering Drugs) in the Model Plant Cress (Lepidium Sativum) after Uptake from Water. J. Chromatogr. A 2019, 1592, 122–132. [Google Scholar] [CrossRef]
- Dastkhoon, M.; Ghaedi, M.; Asfaram, A.; Arabi, M.; Ostovan, A.; Goudarzi, A. Cu@SnS/SnO2 Nanoparticles as Novel Sorbent for Dispersive Micro Solid Phase Extraction of Atorvastatin in Human Plasma and Urine Samples by High-Performance Liquid Chromatography with UV Detection: Application of Central Composite Design (CCD). Ultrason. Sonochem. 2017, 36, 42–49. [Google Scholar] [CrossRef]
- Bioanalytical Method Development and Validation of Atorvastatin in Human Plasma by Using UV-Visibile Spectrophotometry—ProQuest. Available online: https://www.proquest.com/openview/ffa8b2baa35d2ac4fbec030eeda904e2/1?pq-origsite=gscholar&cbl=54977 (accessed on 15 July 2021).
- Yilmaz, B.; Kaban, S. UV and First Derivative Spectrophotometric Methods for the Estimation of Atorvastatin in Pharmaceutical Preparations. J. Adv. Pharm. Res. 2018, 2, 89–94. [Google Scholar] [CrossRef]
- Bukkitgar, S.D.; Shetti, N.P.; Kulkarni, R.M. Construction of Nanoparticles Composite Sensor for Atorvastatin and Its Determination in Pharmaceutical and Urine Samples. Sens. Actuators B Chem. 2018, 255, 1462–1470. [Google Scholar] [CrossRef]
- Yilmaz, B.; Kaban, S. Electrochemical Behavior of Atorvastatin at Glassy Carbon Electrode and Its Direct Determination in Pharmaceutical Preparations by Square Wave and Differential Pulse Voltammetry. Indian J. Pharm. Sci. 2016, 78, 360–367. [Google Scholar] [CrossRef] [Green Version]
- Fazlolahzadeh, O.; Rouhollahi, A.; Hadi, M. Electroanalytical Determination of Atorvastatin in Pharmaceutical Formulations Based on Edge-Plane Pyrolytic Graphite Electrode. Anal. Bioanal. Electrochem. 2016, 8, 566–577. [Google Scholar]
- Naseri, A.; Hormozi-Nezhad, M.R.; Shahrokhian, S.; Asadian, E. Silver Nanowires Immobilized on Gold-Modified Glassy Carbon Electrode for Electrochemical Quantification of Atorvastatin. J. Electroanal. Chem. 2020, 876, 114540. [Google Scholar] [CrossRef]
- Kumar, S.; Bukkitgar, S.D.; Singh, S.; Pratibha; Singh, V.; Reddy, K.R.; Shetti, N.P.; Venkata Reddy, C.; Sadhu, V.; Naveen, S. Electrochemical Sensors and Biosensors Based on Graphene Functionalized with Metal Oxide Nanostructures for Healthcare Applications. ChemistrySelect 2019, 4, 5322–5337. [Google Scholar] [CrossRef]
- Dakshayini, B.S.; Reddy, K.R.; Mishra, A.; Shetti, N.P.; Malode, S.J.; Basu, S.; Naveen, S.; Raghu, A.V. Role of Conducting Polymer and Metal Oxide-Based Hybrids for Applications in Ampereometric Sensors and Biosensors. Microchem. J. 2019, 147, 7–24. [Google Scholar] [CrossRef]
- Kuzin, Y.; Kappo, D.; Porfireva, A.; Shurpik, D.; Stoikov, I.; Evtugyn, G.; Hianik, T. Electrochemical DNA Sensor Based on Carbon Black—Poly(Neutral Red) Composite for Detection of Oxidative DNA Damage. Sensors 2018, 18, 3489. [Google Scholar] [CrossRef] [Green Version]
- Shamgsumova, R.V.; Shurpik, D.N.; Evtugyn, V.G.; Stoikov, I.I.; Evtugyn, G.A. Electrochemical Determination of Malathion on an Acetylcholinesterase-Modified Glassy Carbon Electrode. Anal. Lett. 2018, 51, 1911–1926. [Google Scholar] [CrossRef]
- Iijima, S. Helical Microtubules of Graphitic Carbon. Nature 1991, 354, 56–58. [Google Scholar] [CrossRef]
- Apetrei, C.; Apetrei, I.M. Biosensor Based on Tyrosinase Immobilized on a Single-Walled Carbon Nanotube-Modified Glassy Carbon Electrode for Detection of Epinephrine. IJN 2013, 4391. [Google Scholar] [CrossRef] [PubMed] [Green Version]
- Claussen, J.C.; Kumar, A.; Jaroch, D.B.; Khawaja, M.H.; Hibbard, A.B.; Porterfield, D.M.; Fisher, T.S. Nanostructuring Platinum Nanoparticles on Multilayered Graphene Petal Nanosheets for Electrochemical Biosensing. Adv. Funct. Mater. 2012, 22, 3399–3405. [Google Scholar] [CrossRef]
- Apetrei, I.M.; Apetrei, C. A Modified Nanostructured Graphene-Gold Nanoparticle Carbon Screen-Printed Electrode for the Sensitive Voltammetric Detection of Rutin. Measurement 2018, 114, 37–43. [Google Scholar] [CrossRef]
- Cheng, W.; Dong, S.; Wang, E. Gold Nanoparticles as Fine Tuners of Electrochemical Properties of the Electrode/Solution Interface. Langmuir 2002, 18, 9947–9952. [Google Scholar] [CrossRef]
- Guo, S.; Wang, E. Synthesis and Electrochemical Applications of Gold Nanoparticles. Anal. Chim. Acta 2007, 598, 181–192. [Google Scholar] [CrossRef]
- Alim, S.; Vejayan, J.; Yusoff, M.M.; Kafi, A.K.M. Recent Uses of Carbon Nanotubes & Gold Nanoparticles in Electrochemistry with Application in Biosensing: A Review. Biosens. Bioelectron. 2018, 121, 125–136. [Google Scholar] [CrossRef]
- Serafín, V.; Martínez-García, G.; Agüí, L.; Yáñez-Sedeño, P.; Pingarrón, J.M. Multiplexed Determination of Human Growth Hormone and Prolactin at a Label Free Electrochemical Immunosensor Using Dual Carbon Nanotube–Screen Printed Electrodes Modified with Gold and PEDOT Nanoparticles. Analyst 2014, 139, 4556–4563. [Google Scholar] [CrossRef] [PubMed]
- Apetrei, I.M.; Apetrei, C. Voltammetric Determination of Melatonin Using a Graphene-Based Sensor in Pharmaceutical Products. Int. J. Nanomed. 2016, 11, 1859–1866. [Google Scholar] [CrossRef] [Green Version]
- Bounegru, A.; Apetrei, C. Voltammetric Sensors Based on Nanomaterials for Detection of Caffeic Acid in Food Supplements. Chemosensors 2020, 8, 41. [Google Scholar] [CrossRef]
- Bard, A.J.; Faulkner, L.R. Electrochemical Methods: Fundamentals and Applications, 2nd ed.; Wiley: New York, NY, USA, 2001; ISBN 978-0-471-04372-0. [Google Scholar]
- Bounegru, A.V.; Apetrei, C. Carbonaceous Nanomaterials Employed in the Development of Electrochemical Sensors Based on Screen-Printing Technique—A Review. Catalysts 2020, 10, 680. [Google Scholar] [CrossRef]
- García-Carmona, L.; Moreno-Guzmán, M.; Sierra, T.; González, M.C.; Escarpa, A. Filtered Carbon Nanotubes-Based Electrodes for Rapid Sensing and Monitoring of L-Tyrosine in Plasma and Whole Blood Samples. Sens. Actuators B Chem. 2018, 259, 762–767. [Google Scholar] [CrossRef]
- Bounegru, A.V.; Apetrei, C. Voltamperometric Sensors and Biosensors Based on Carbon Nanomaterials Used for Detecting Caffeic Acid—A Review. IJMS 2020, 21, 9275. [Google Scholar] [CrossRef]
- Bounegru, A.V.; Apetrei, C. Development of a Novel Electrochemical Biosensor Based on Carbon Nanofibers–Gold Nanoparticles–Tyrosinase for the Detection of Ferulic Acid in Cosmetics. Sensors 2020, 20, 6724. [Google Scholar] [CrossRef]
- Pourtaheri, E.; Taher, M.A.; Ali, G.A.; Agarwal, S.; Gupta, V.K. Low-Cost and Highly Sensitive Sensor for Determining Atorvastatin Using PbTe Nanoparticles-Modified Graphite Screen-Printed Electrode. Int. J. Electrochem. Sci. 2019, 14, 9622–9632. [Google Scholar] [CrossRef]
- Silva, T.A.; Zanin, H.; Vicentini, F.C.; Corat, E.J.; Fatibello-Filho, O. Electrochemical Determination of Rosuvastatin Calcium in Pharmaceutical and Human Body Fluid Samples Using a Composite of Vertically Aligned Carbon Nanotubes and Graphene Oxide as the Electrode Material. Sens. Actuators B Chem. 2015, 218, 51–59. [Google Scholar] [CrossRef]
- Silva, T.A.; Pereira, G.F.; Fatibello-Filho, O.; Eguiluz, K.I.B.; Salazar-Banda, G.R. Square-Wave Voltammetric Determination of Rosuvastatin Calcium in Pharmaceutical and Biological Fluid Samples Using a Cathodically Pretreated Boron-Doped Diamond Electrode. Diam. Relat. Mater. 2015, 58, 103–109. [Google Scholar] [CrossRef]
- Apetrei, I.M.; Rodriguez-Mendez, M.L.; Apetrei, C.; de Saja, J.A. Fish Freshness Monitoring Using an E-Tongue Based on Polypyrrole Modified Screen-Printed Electrodes. IEEE Sens. J. 2013, 13, 2548–2554. [Google Scholar] [CrossRef]
- Tavousi, A.; Ahmadi, E.; Mohammadi-Behzad, L.; Riahifar, V.; Maghemi, F. Sensitive Electrochemical Sensor Using Polypyrrole-Coated Fe3O4 Core-Shell Nanoparticles/Multiwall Carbon Nanotubes Modified Graphite Electrode for Atorvastatin Analysis. Microchem. J. 2020, 158, 105159. [Google Scholar] [CrossRef]
- Kamalzadeh, Z.; Shahrokhian, S. Electrochemical Determination of Atorvastatin on Nano-Scaled Polypyrrole Film. Bioelectrochemistry 2014, 98, 1–10. [Google Scholar] [CrossRef] [PubMed]
- Wei, L. Electrochemical Sensor for Ultrasensitive Determination of Atorvastatin Based on Polypyrrole Functionalized Graphene Sheets. Int. J. Electrochem. Sci. 2018, 10173–10180. [Google Scholar] [CrossRef]
- Silva, T.A.; Zanin, H.; Vicentini, F.C.; Corat, E.J.; Fatibello-Filho, O. Differential Pulse Adsorptive Stripping Voltammetric Determination of Nanomolar Levels of Atorvastatin Calcium in Pharmaceutical and Biological Samples Using a Vertically Aligned Carbon Nanotube/Graphene Oxide Electrode. Analyst 2014, 139, 2832. [Google Scholar] [CrossRef] [Green Version]
- Abbar, J.C.; Nandibewoor, S.T. Voltammetric Oxidation and Determination of Atorvastatin Based on the Enhancement Effect of Cetyltrimethyl Ammonium Bromide at a Carbon Paste Electrode. Colloids Surf. B Biointerfaces 2013, 106, 158–164. [Google Scholar] [CrossRef] [PubMed]
- Eskiköy, D.; Durmuş, Z.; Kiliç, E. Electrochemical Oxidation of Atorvastatin and Its Adsorptive Stripping Determination in Pharmaceutical Dosage Forms and Biological Fluids. Collect. Czech. Chem. Commun. 2011, 76, 1633–1649. [Google Scholar] [CrossRef]
- Shahraeini, S.S.; Akbari, J.; Saeedi, M.; Morteza-Semnani, K.; Abootorabi, S.; Dehghanpoor, M.; Rostamkalaei, S.S.; Nokhodchi, A. Atorvastatin Solid Lipid Nanoparticles as a Promising Approach for Dermal Delivery and an Anti-Inflammatory Agent. AAPS PharmSciTech 2020, 21, 263. [Google Scholar] [CrossRef]


| Sensor | Epa (V) | Epc (V) | E1/2 (V) | E (V) | Ia (µA) | Ic (µA) | Ic/Ia |
|---|---|---|---|---|---|---|---|
| SPCE | 0.334 | 0.118 | 0.226 | 0.216 | 25.95 | −21.94 | 0.84 |
| AuNP-CNT/SPCE | 0.272 | 0.156 | 0.214 | 0.116 | 31.31 | −28.02 | 0.89 |
| Electrode | Geometric Area (cm2) | Active Area (cm2) | Roughness Factor |
|---|---|---|---|
| SPCE | 0.1256 | 0.2836 | 2.25 |
| AuNP-CNT/SPCE | 0.9842 | 7.84 |
| Electrode | Equation | R2 | (mol × cm−2) |
|---|---|---|---|
| SPCE | Ip = 1.32 × 10⁻⁴ v + 2.53 × 10⁻⁵ | 0.9956 | 1.11 × 10⁻¹¹ |
| AuNP-CNT/SPCE | Ip = 2.39 × 10⁻⁴ v + 3.65 × 10⁻⁵ | 0.9950 | 4.94 × 10⁻¹⁰ |
| Sensor | Equation of the Linear Calibration Curve | R2 | LOD (µM) | LOQ (µM) |
|---|---|---|---|---|
| SPCE | Ipa = 0.0383 c + 2.2746 | 0.9716 | 6.75 × 10⁻⁷ | 2.25 × 10⁻⁶ |
| AuNP-CNT/SPCE | Ipa = 0.0252 c + 10.762 | 0.9892 | 1.92 × 10⁻⁷ | 6.39 × 10⁻⁷ |
| Sensitive Materials | Detection Technique | Linear Range (μM) | LOD (μM) | Real Sample | Ref. |
|---|---|---|---|---|---|
| PbTe NPs/SPE 1 | cronAmp | 1–70 | 0.05 | Tablet urine | [34] |
| GCE 2 | DPV | 1–50 | 0.2 | Tablet | [12] |
| SWV | 0–3 | ||||
| Fe3O4@PPy/MWCNTs/GE 3 | SWASV | 0.0314–201 | 0.0230 | Tablet and human serum | [38] |
| AgNWs/Au/GCE 4 | CV DPV | 10 × 10−6–1 × 10⁻³ | 1 × 10⁻³ | Tablet | [14] |
| EPPGE 5 | DP VSWV | 0.0960–5.60 0.0960–7.74 | 21.0 23.0 | Tablet | [13] |
| PPY/CNTs/GCE 6 | LSV | 0.005–1.0 | 0.0015 | Tablet | [39] |
| ZnO/NS/CPE 7 | DPV SWV | 1.00–12.0 0.01–0.1 | 7 × 10⁻⁴ 1.2 × 10⁻⁴ | Tablet and urine | [11] |
| PPY-GNs/GCE 8 | DPV | 20.0–200 | 1.20 | Tablet | [40] |
| VACNT-GO electrode 9 | DPAdSV | 0.09–3.81 | 9.4 × 10⁻³ | Urine and human serum | [41] |
| CPE in the presence of CTAB 10 | DPV | 0.05–10 | 4.08 × 10⁻³ | Tablet and urine | [42] |
| Product | Atorvastatin Quantity Reported by the Manufacturer (mg/cp) | Atorvastatin Quantity Experimentally Determined | |
|---|---|---|---|
| CV (mg/cp) method | FTIR (mg/cp) method | ||
| Sortis 20 mg | 20 | 20 ± 1 | 21 ± 2 |
| Sortis 10 mg | 10 | 10 ± 0.5 | 10.5 ± 0.5 |
| Atorvastatin Concentration (×106 M) | Atorvastatin Quantity (×106 M) | Recovery (%) ± RSD (n = 5) |
|---|---|---|
| 3 | 3.03 | 100.5 ± 0.9 |
| 5 | 4.97 | 99.4 ± 0.8 |
| 7 | 7.06 | 100.9 ± 0.9 |
Publisher’s Note: MDPI stays neutral with regard to jurisdictional claims in published maps and institutional affiliations. |
© 2021 by the authors. Licensee MDPI, Basel, Switzerland. This article is an open access article distributed under the terms and conditions of the Creative Commons Attribution (CC BY) license (https://creativecommons.org/licenses/by/4.0/).
Share and Cite
Gunache, R.O.; Bounegru, A.V.; Apetrei, C. Determination of Atorvastatin with Voltammetric Sensors Based on Nanomaterials. Inventions 2021, 6, 57. https://doi.org/10.3390/inventions6030057
Gunache RO, Bounegru AV, Apetrei C. Determination of Atorvastatin with Voltammetric Sensors Based on Nanomaterials. Inventions. 2021; 6(3):57. https://doi.org/10.3390/inventions6030057
Chicago/Turabian StyleGunache (Roșca), Ramona Oana, Alexandra Virginia Bounegru, and Constantin Apetrei. 2021. "Determination of Atorvastatin with Voltammetric Sensors Based on Nanomaterials" Inventions 6, no. 3: 57. https://doi.org/10.3390/inventions6030057