Article

Simple Design Methodology for R.C. Slabs by Hybrid Reinforcing of Steel Rebars and Uniaxial or Triaxial Geogrids

by
Ramy Nasr Abdelmonem Mohamed
1,*,
Ahmed Mohamed El Sebai
1 and
Ahmed Shaban Abdel-Hay Gabr
2
1
Civil Engineering Department, Faculty of Engineering, Al-Azhar University, Nasr City, Cairo 11751, Egypt
2
Civil Engineering Department, Faculty of Engineering, Beni-Suef University, Beni-Suef 62511, Egypt
*
Author to whom correspondence should be addressed.
Inventions 2021, 6(2), 32; https://doi.org/10.3390/inventions6020032
Submission received: 14 April 2021 / Revised: 1 May 2021 / Accepted: 2 May 2021 / Published: 4 May 2021
(This article belongs to the Section Inventions and Innovation in Advanced Manufacturing)

Abstract

:
This paper’s objective is to provide simple design relations for the reinforced concrete slabs by a hybrid reinforcing of uniaxial or triaxial geogrids in addition to steel rebars. We hope this can provide guidance for further researchers to estimate the flexural bending capacity of the concrete slabs, the necessary grade of uniaxial or triaxial geogrids, and the necessary count of uniaxial or triaxial geogrids’ layers by conducting first-principles analytical, quantitative analyses for a previously published concrete slabs’ experimental data of reinforced concrete slabs by hybrid reinforcing of steel rebars and uniaxial or triaxial geogrids. Throughout this paper, simple design relations were added to estimate the concrete slabs’ experimental moment at the post-peak load based on the assumption that the uniaxial or triaxial geogrids’ tensile force (as concrete slab’s reinforcement) is equal to its peak tensile strength (obtained by the experimental axial tensile test). This resulted in a variance that frequently has a range of ±10% when compared with the actual experimental data. For more accuracy, simple design relations were added to estimate the uniaxial or triaxial geogrids’ characteristic tensile force at the post-peak load, which resulted in an estimated concrete slab’s experimental moment at the post-peak load with a variance that frequently has a range of ±5% when compared with the actual experimental data.

1. Introduction

Geogrids are one of the polymer materials classified as geosynthetic materials and are made primarily of polymer materials such as polyester, polypropylene, and polyethylene [1]. They are used in special civil works and infrastructure for stabilization and reinforcement [2]. The use of geogrids as reinforcing material has since extended to pavement systems, particularly for reinforcing materials for asphalt layers as stabilization material for unbound layers [3], as an inter-layer system for the applications of pavement overlays [4], as a reinforcing material for shrinkage in Portland cement concrete [5,6], as a concrete pavement reinforcing material [7] and as an inter-layer system for mitigating the reflective cracking of concrete overlays [8,9] or for mitigating the reflective cracking of the asphalt overlays placed over jointed rigid pavements [10,11].
The geogrids use as a reinforcing material for Portland cement concrete overlays and thin members were studied in a few pieces of research [12]. Besides, a few pieces of research were done on the geogrids use as strengthening materials either for reinforced concrete beams and reinforced concrete slabs [1,13], as a concrete slab-reinforcing material [14,15], and as a concrete beam reinforcing material [16,17]. The purpose of this paper is to provide a simple design relation to estimating the moment of resistance in the necessary grade of uniaxial or triaxial geogrids and their count of layers for the concrete slabs reinforced by hybrid reinforcing of steel rebars and geogrids by conducting a first-principles analytical, quantitative analysis for previously published experimental data of reinforced concrete slabs by a hybrid reinforcing of steel rebars and geogrids [18]. The graphical summary of the paper is illustrated in Figure 1.

2. Focused Literature Review on the Hybrid Reinforcing System of Geogrids and Steel Rebar

Mohamed et al.’s (2020) research aimed to innovate the steel rebars and geogrids as a hybrid reinforcing system for the concrete slabs. The experimental research program consisted of thirteen concrete one-way slabs split into one concrete control slab and two groups. These concrete one-way slabs were examined under a four-point loading method until they collapsed in flexural. For a detailed investigation of steel rebars and geogrids as a hybrid reinforcing system, strain gauges were affixed to the concrete slabs’ bottom reinforcing of steel rebars and geogrids [18]. Alamli et al.’s (2017) research investigated the behavior of punching shear for the reinforced concrete’s two-way slabs by the biaxial geogrids and steel rebars of different reinforcing ratios. Their experimental research program consisted of examining fifteen concrete slabs under a central vertical static load. In order to examine the criteria of the existence of biaxial geogrids, the compressive strength of concrete, and the reinforcing ratio of steel rebars, these concrete slabs were split into three groups [19]. Ali et al.’s (2018) research aimed to investigate the behavior of punching shear for reinforced concrete two-way slabs by pieces of geogrids with different dimensions and shapes in addition to steel rebars. Their experimental research program consisted of examining nine concrete slabs under a central vertical static load [20]. Tharani et al.’s (2019) research investigated the impact behavior of reinforced concrete two-way slabs by biaxial geogrids in addition to steel rebars. Their experimental research program consisted of examining three concrete slabs under a drop-weight impact load to examine the influence of the count of additional biaxial geogrids’ layers. The results of these tested concrete slabs were verified and compared to the outcomes of a finite element study by ABAQUS software [21]. Different investigations in the literature related to the use of the geogrids as reinforcing materials for concrete slabs were investigated in the above literature review; the following main conclusions were observed:
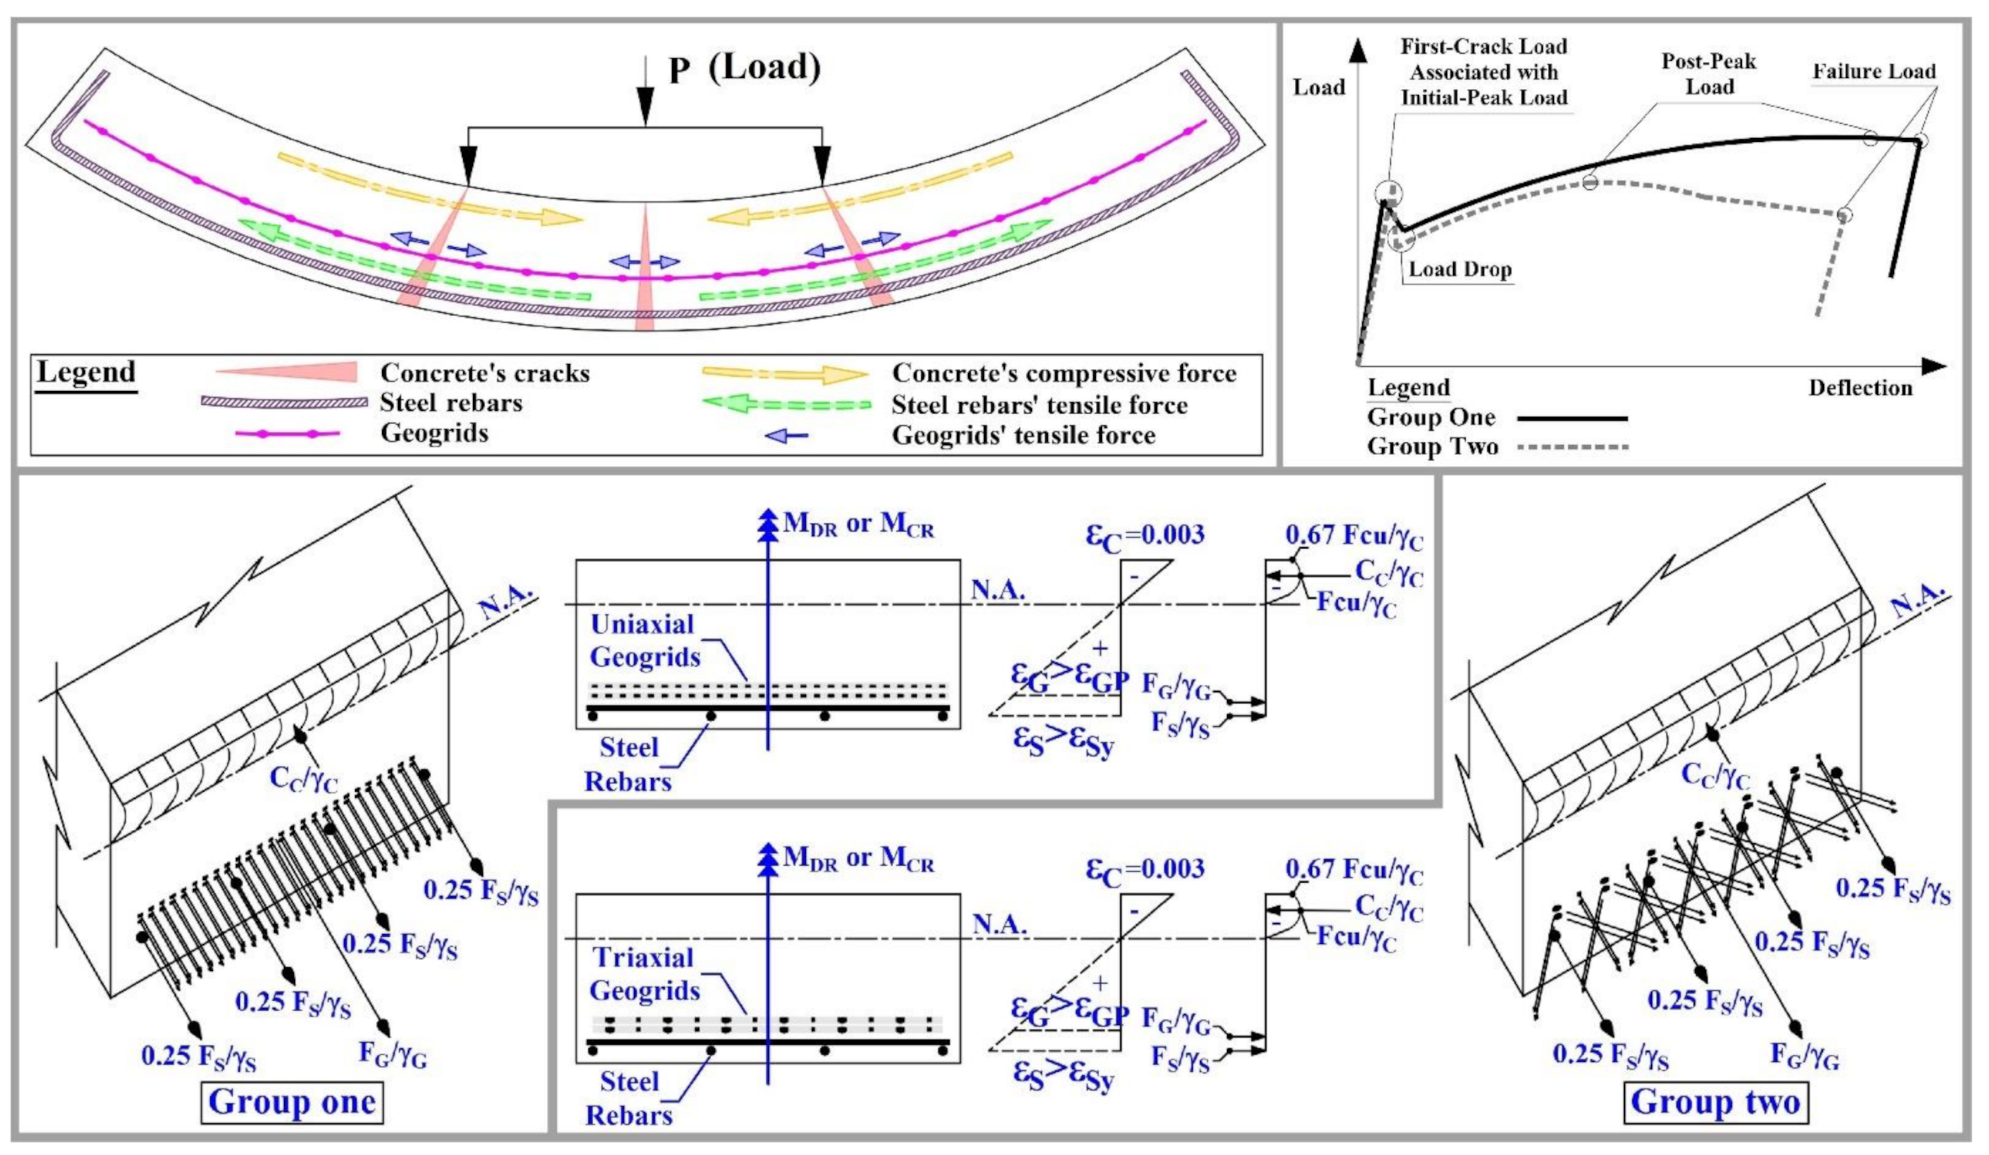
  • The use of steel rebars and geogrids as a hybrid reinforcing material for concrete slabs provides a greater first-crack load and a greater ultimate load comparing to the conventional reinforcing material of steel rebars or using geogrids as the main reinforcing material. Meanwhile, it increased the deflection values.
  • For the hybrid reinforcing of steel rebars and geogrids, the reduction of steel rebars’ reinforcing ratio to 0.13% led to a reduction in the geogrids’ contribution and its effectiveness as concrete slab-reinforcing material. Accordingly, it cannot be dependent on geogrids as the main reinforcing material for concrete slabs.
  • The impact energy capacity and impact resistance of concrete slabs have improved by using the hybrid reinforcing steel rebars and geogrids with a positive relation to the count of the geogrids’ layers.
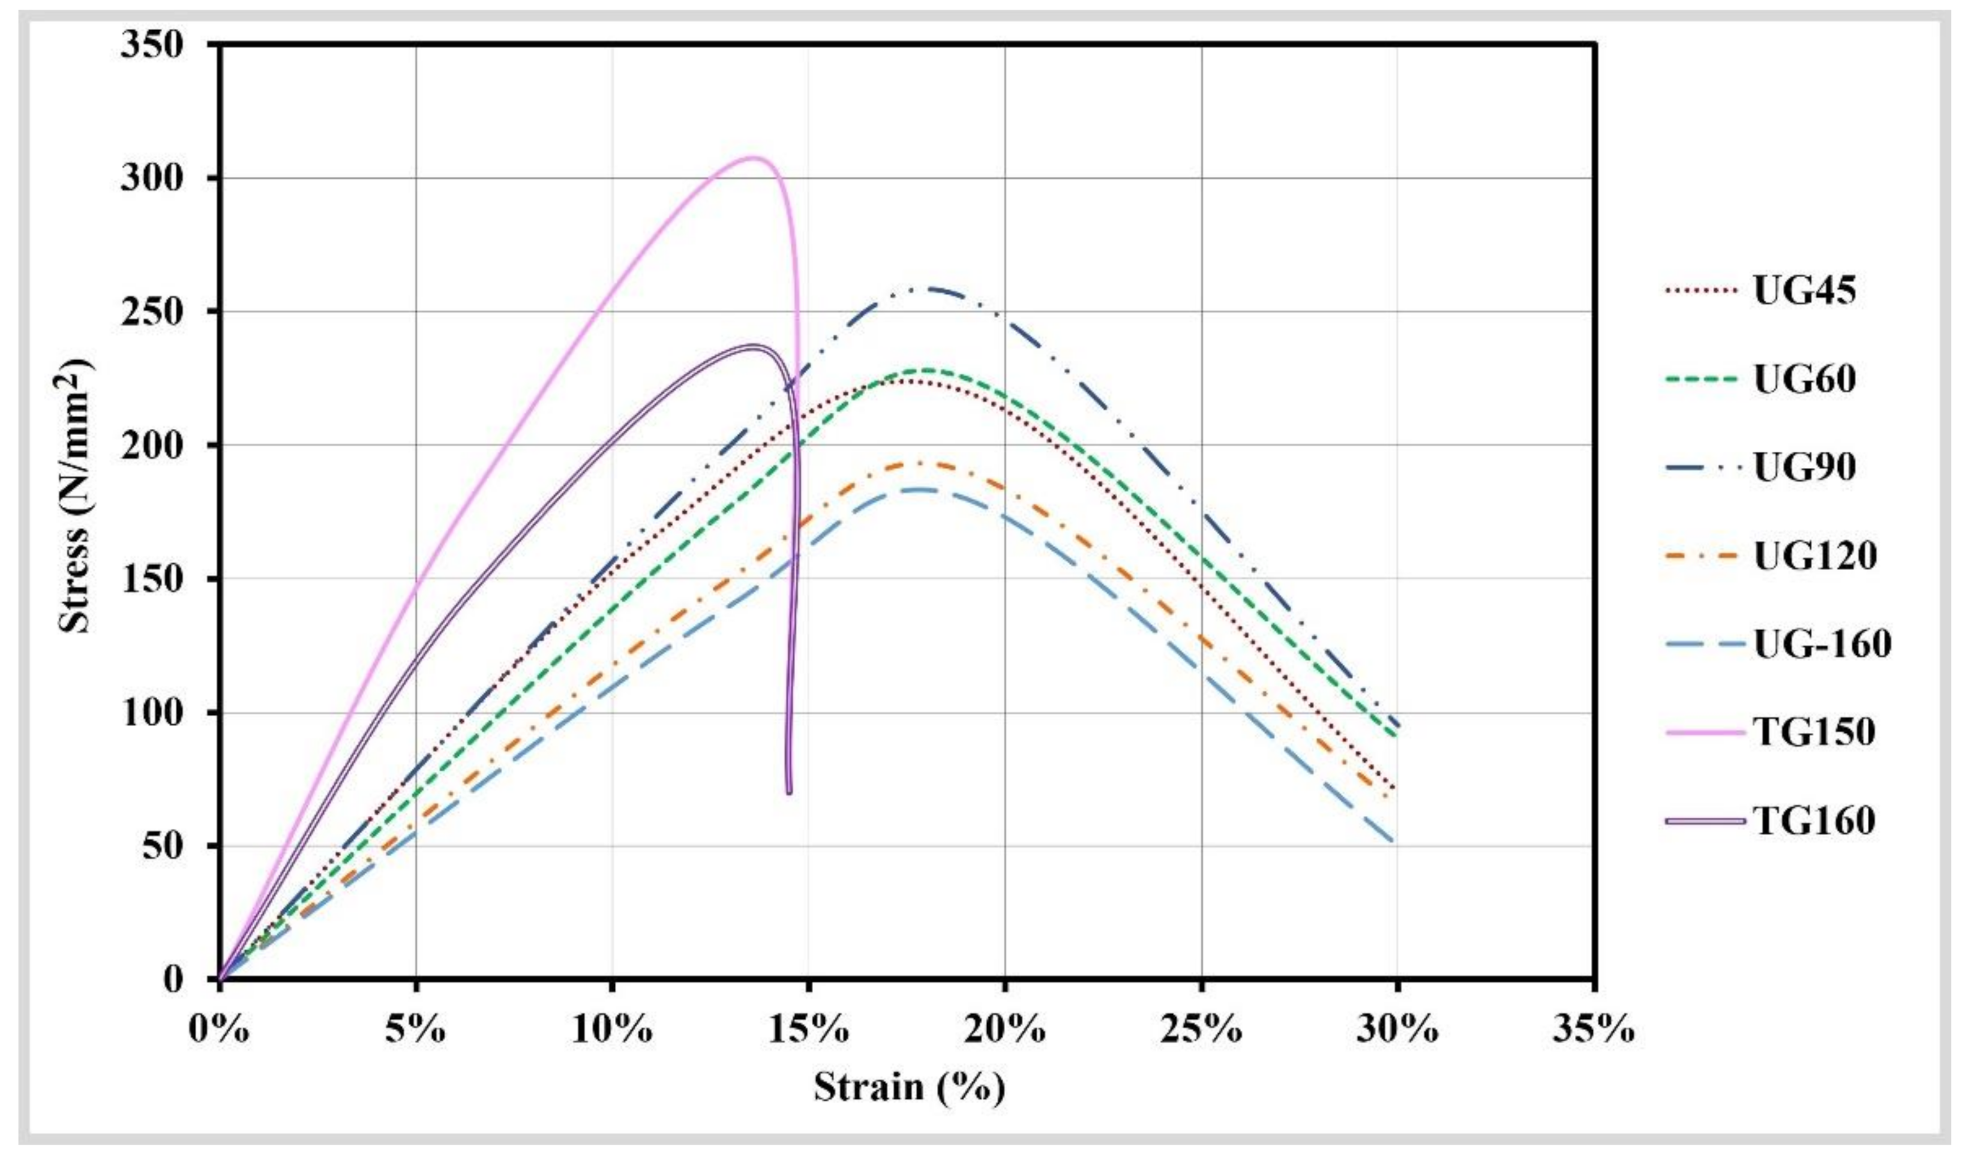
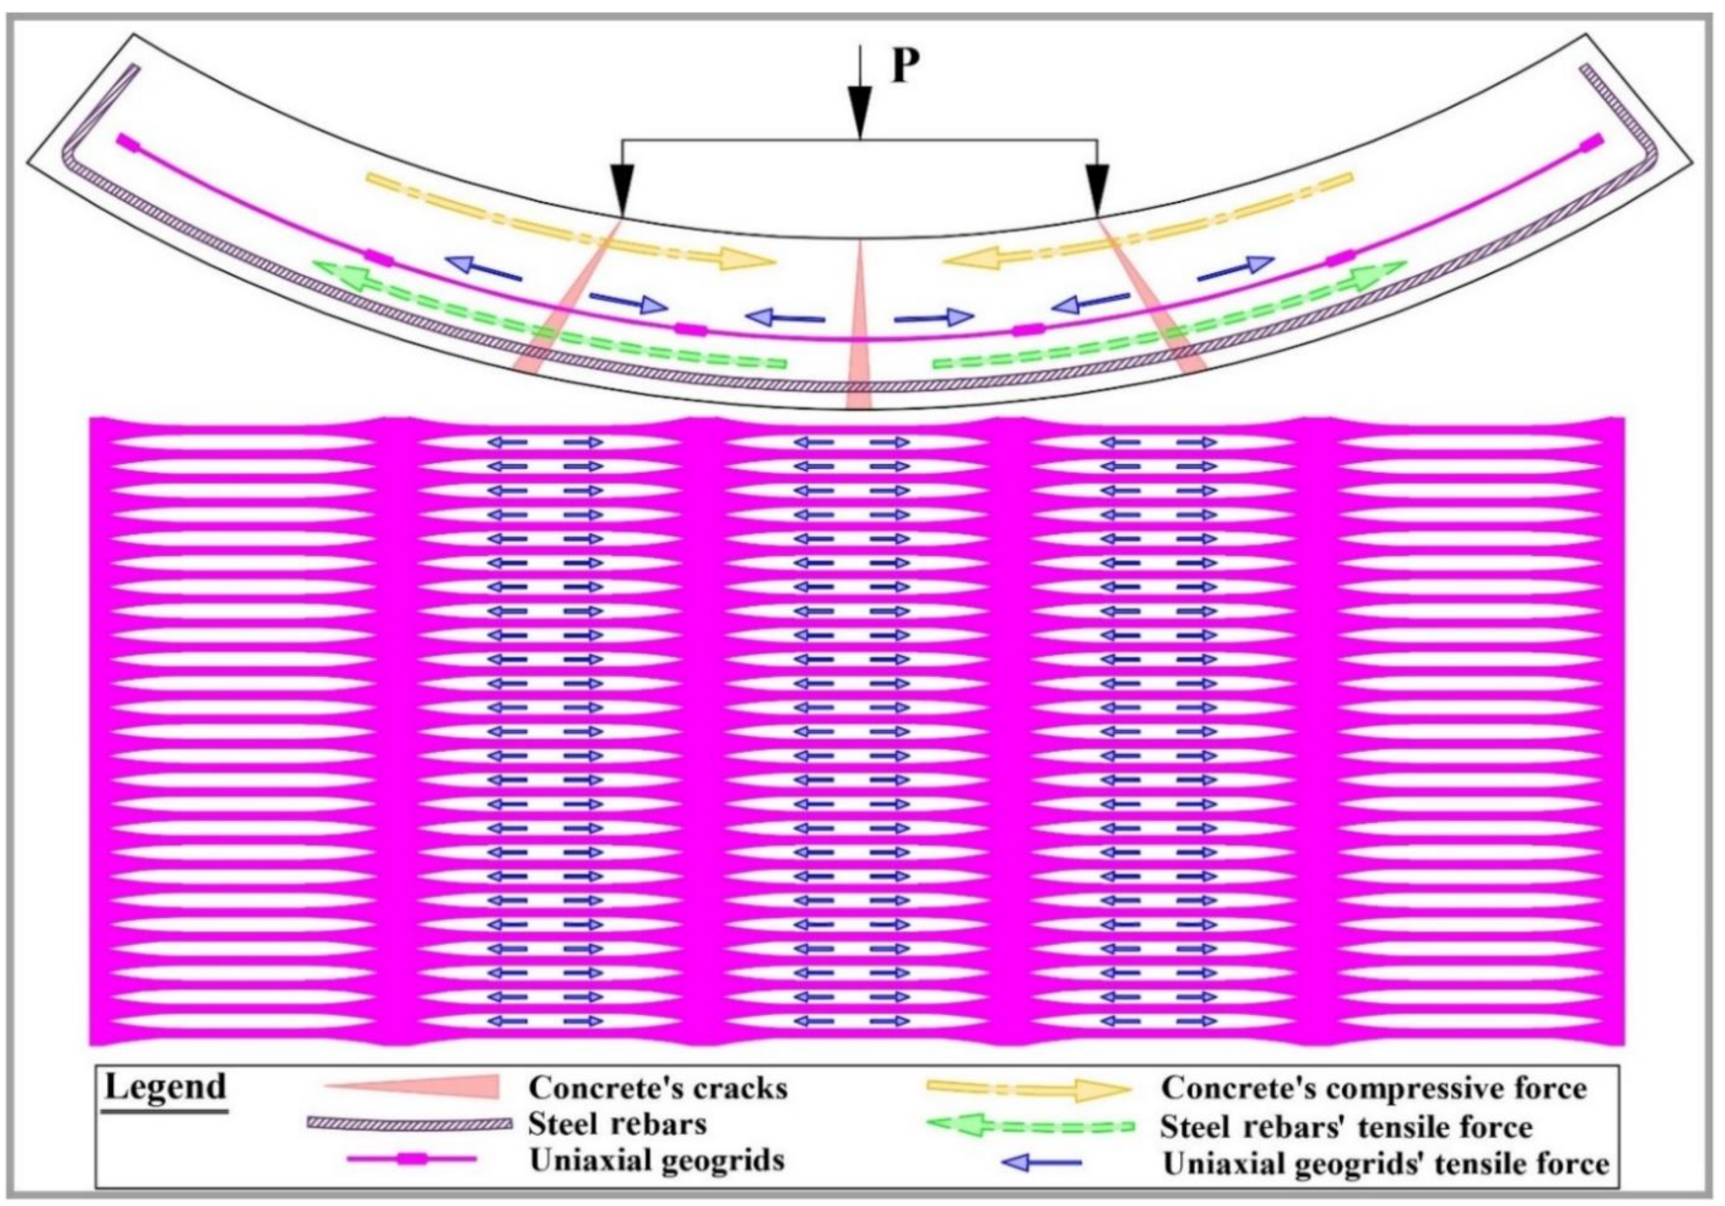
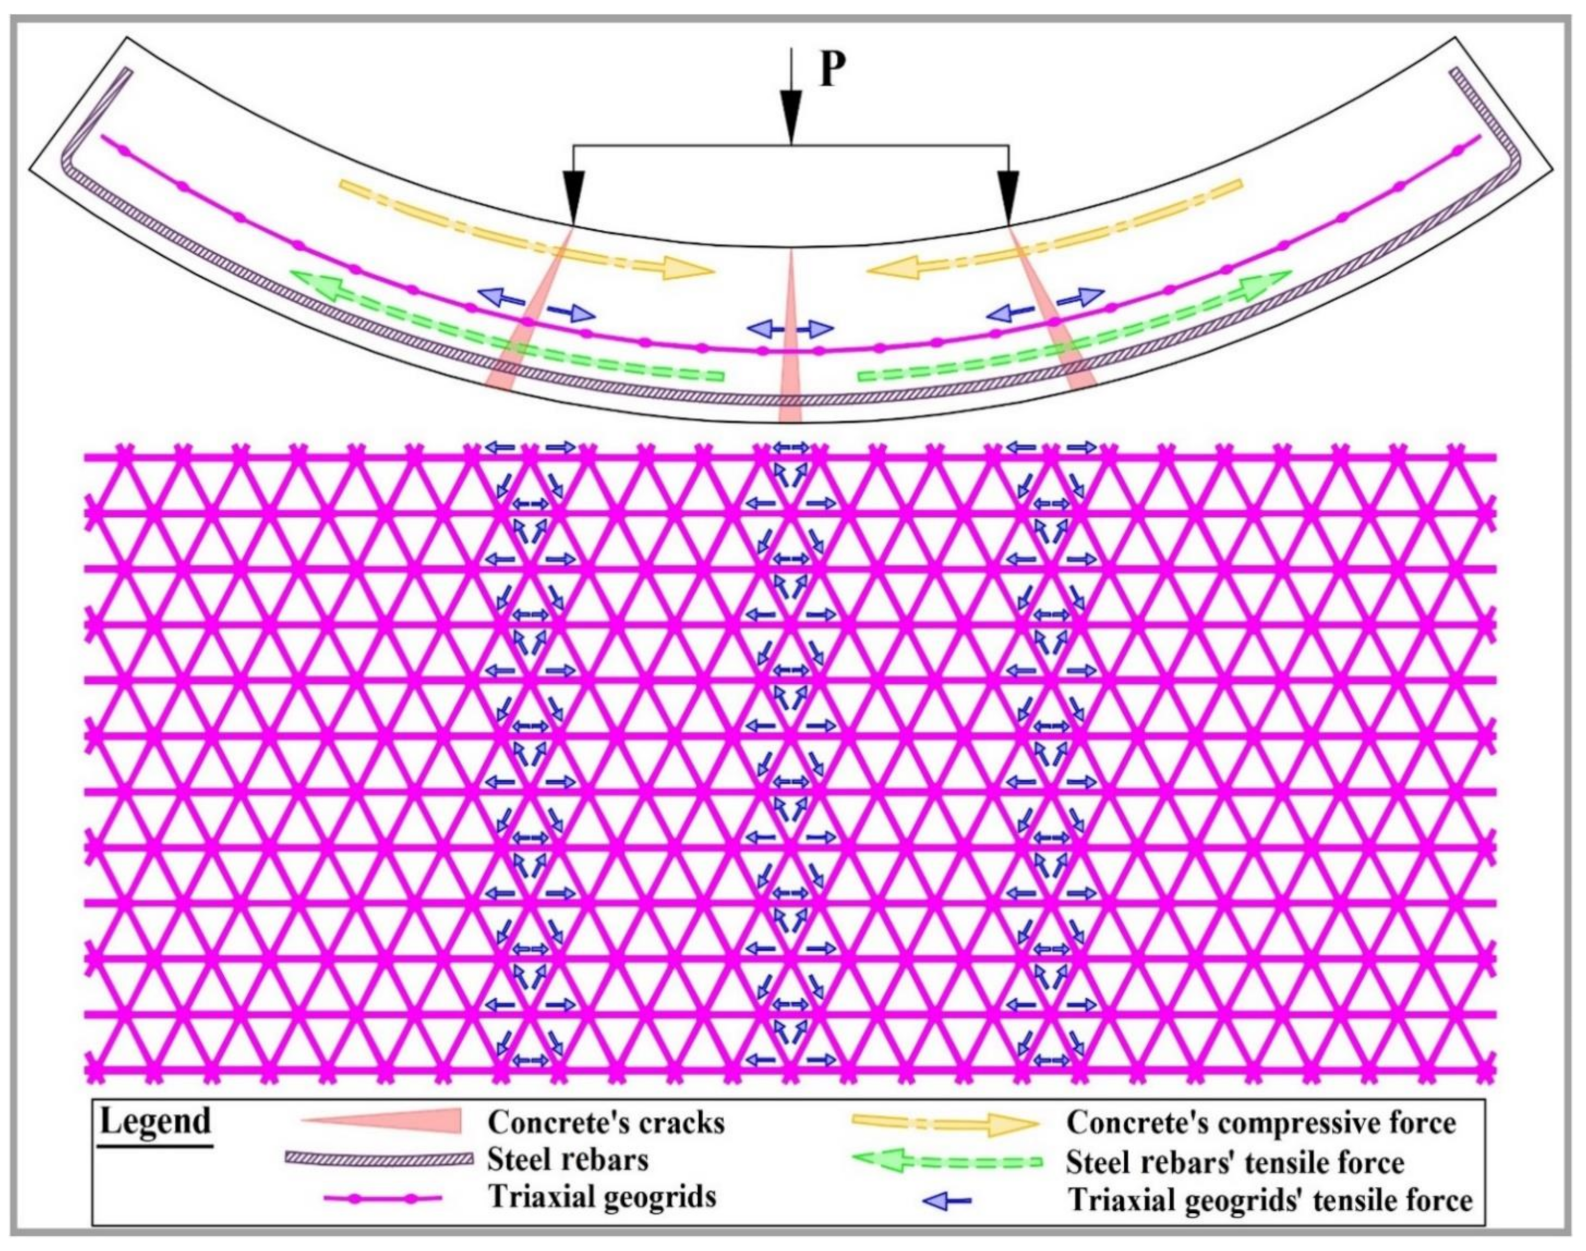
  • The hybrid reinforcing of steel rebars and uniaxial geogrids provided efficient utilization and better performance, particularly for uniaxial geogrids with the grade of 120 kN/m and greater, as it provided greater benefits in terms of values, including and not limited to capacity of loads, capacity of energy absorption, and displacement ductility index. It also provided more effective utilization, including and not limited to better flexural performance and greater benefits in terms of cost compared to the case of using the conventional reinforcing of steel rebars using the hybrid reinforcing of steel rebars and triaxial geogrids. However, the hybrid reinforcing of steel rebars and triaxial geogrids provided smaller deflection values and greater values of first-crack load values. As a recommendation, the uniaxial geogrids is should be tension-stressed before the concrete pouring.

3. Characteristics of Used Materials

The concrete mix was prepared by using crushed limestone as coarse aggregate, natural sand as fine aggregate, and Portland cement with a grade of 42.5. The design mix of the used concrete is illustrated in Table 1. The maximum coarse aggregate nominal size is restricted to 10 mm, which is less than the opening apertures of the uniaxial or triaxial geogrids to enable the coarse aggregate to move and fill the gaps between the ribs of the uniaxial or triaxial geogrids, to have a better bond between the uniaxial or triaxial geogrids and concrete, and to prevent the concrete honeycombing. The concrete admixture of a high range water-reducing agent and superplasticizer was used to improve the concrete workability while maintaining a water-to-cement ratio of 0.5. The concrete mixture has a 28-day cube compressive strength (Fcu) of 40 N/mm2. The reinforcing materials used for concrete slabs in this investigation were steel rebars and uniaxial or triaxial geogrids. It should be indicated that because the tested concrete slabs are one-way concrete slabs, biaxial geogrids were overlooked, and the geogrid-reinforcing materials in this investigation were uniaxial and triaxial geogrids. The experimental characteristics of the steel rebars are illustrated in Table 2. As specified by the experimental tests and the manufacturer, the mechanical and physical characteristics of the used uniaxial and triaxial geogrids are illustrated in Figure 2, Table 3, and Table 4. Figure 3 illustrates the stress–strain curve per each grade of uniaxial and triaxial geogrids.

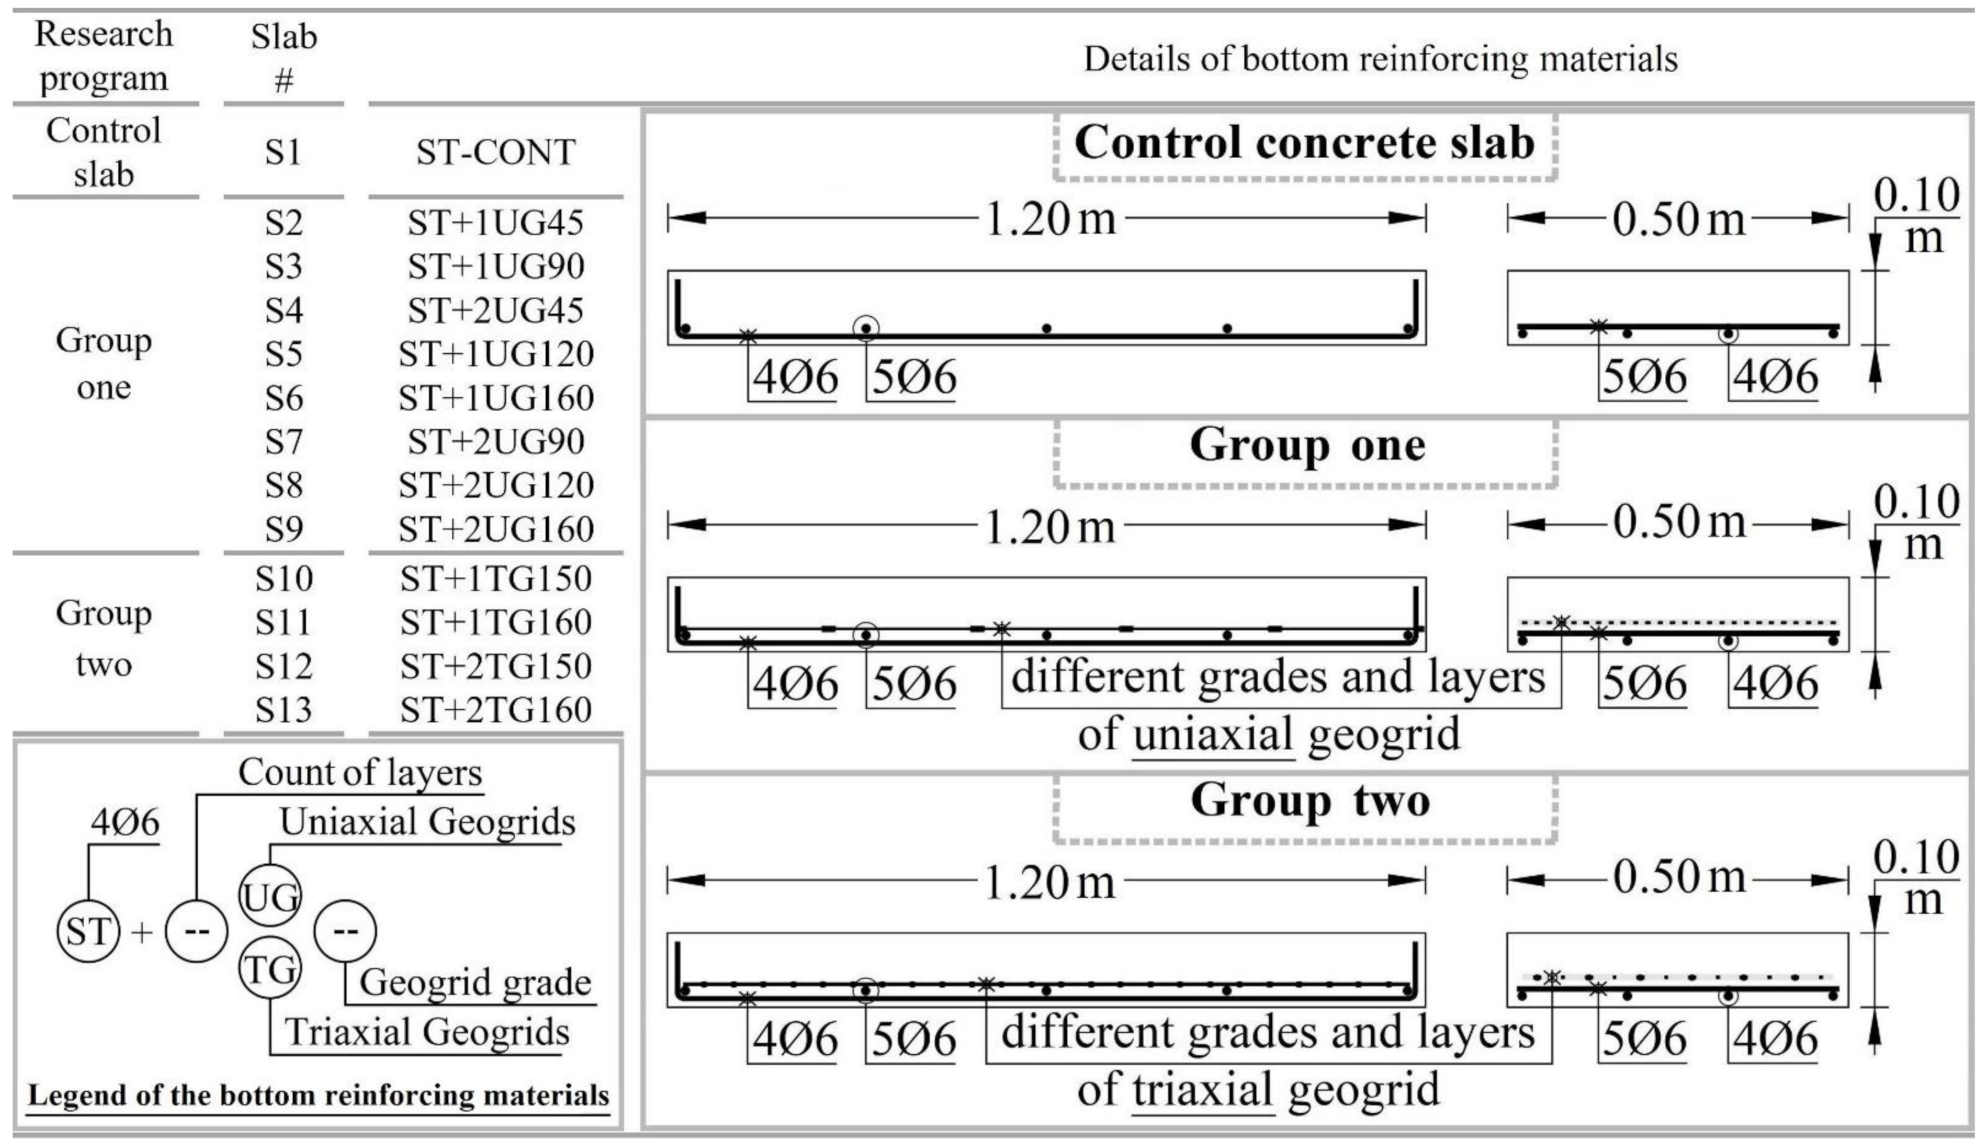
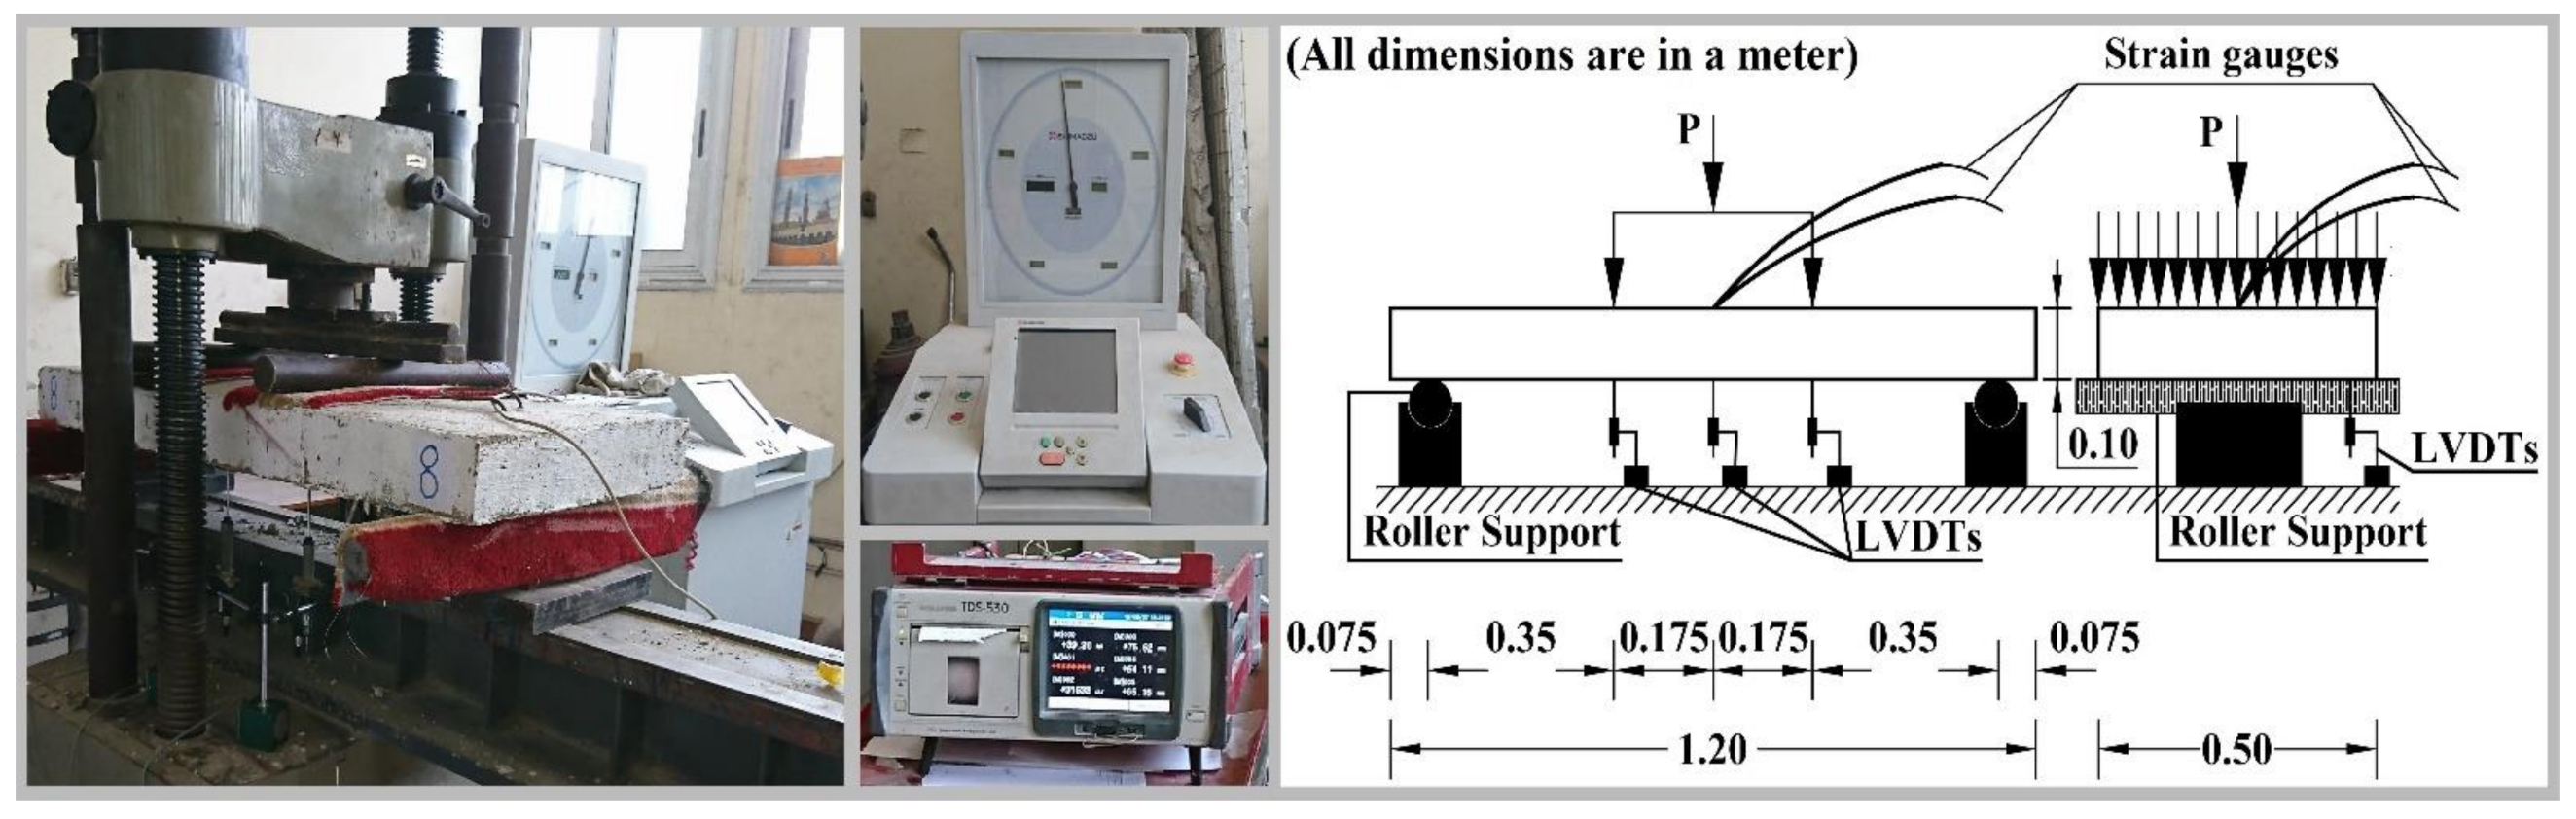
4. Summary of the Experimental Program and Results

The experimental program of this investigation included one control slab and two groups of 13 concrete slabs with the following dimensions: length 120 cm, width 50 cm, and depth 10 cm. The reinforcing details of each group’s concrete slabs are illustrated in detail in Figure 4. Group one contained 8 concrete slabs, which were hybrid reinforced by different grades and a number of layers of uniaxial geogrids as additional reinforcing to the steel rebars. Group two contained 4 concrete slabs, which were hybrid reinforced by different grades and a number of layers of triaxial geogrids as additional reinforcing to the steel rebars. The rest of the concrete slab was reinforced only by the steel rebars in order to be considered as concrete control-slab.
All of the concrete slabs were loaded and tested by a gradually increased four-point loading method with a 500-kN-capacity Shimadzu machine until they collapsed in flexure (the protocol of loading is 2 mm for each minute of deformation control). Each load was positioned at one-third of the slab span in order to provide zero shear force and maximum bending moment throughout the concrete slabs’ middle third. Two roller supports were used, and both were positioned at a distance of 7.5 cm from the slab end. To record the deflections values at the positions where the concentrated loads were positioned and to the mid-span, three LVDTs (vertical linear variable differential transducers) were fixed to each concrete slab. A computerized data logger was used to monitor and record the measurement data of the machine load, the strain gauges, and the three LVDTs. The experimental test setup details are summarized in Figure 5. The experimental results are summarized in Table 5.

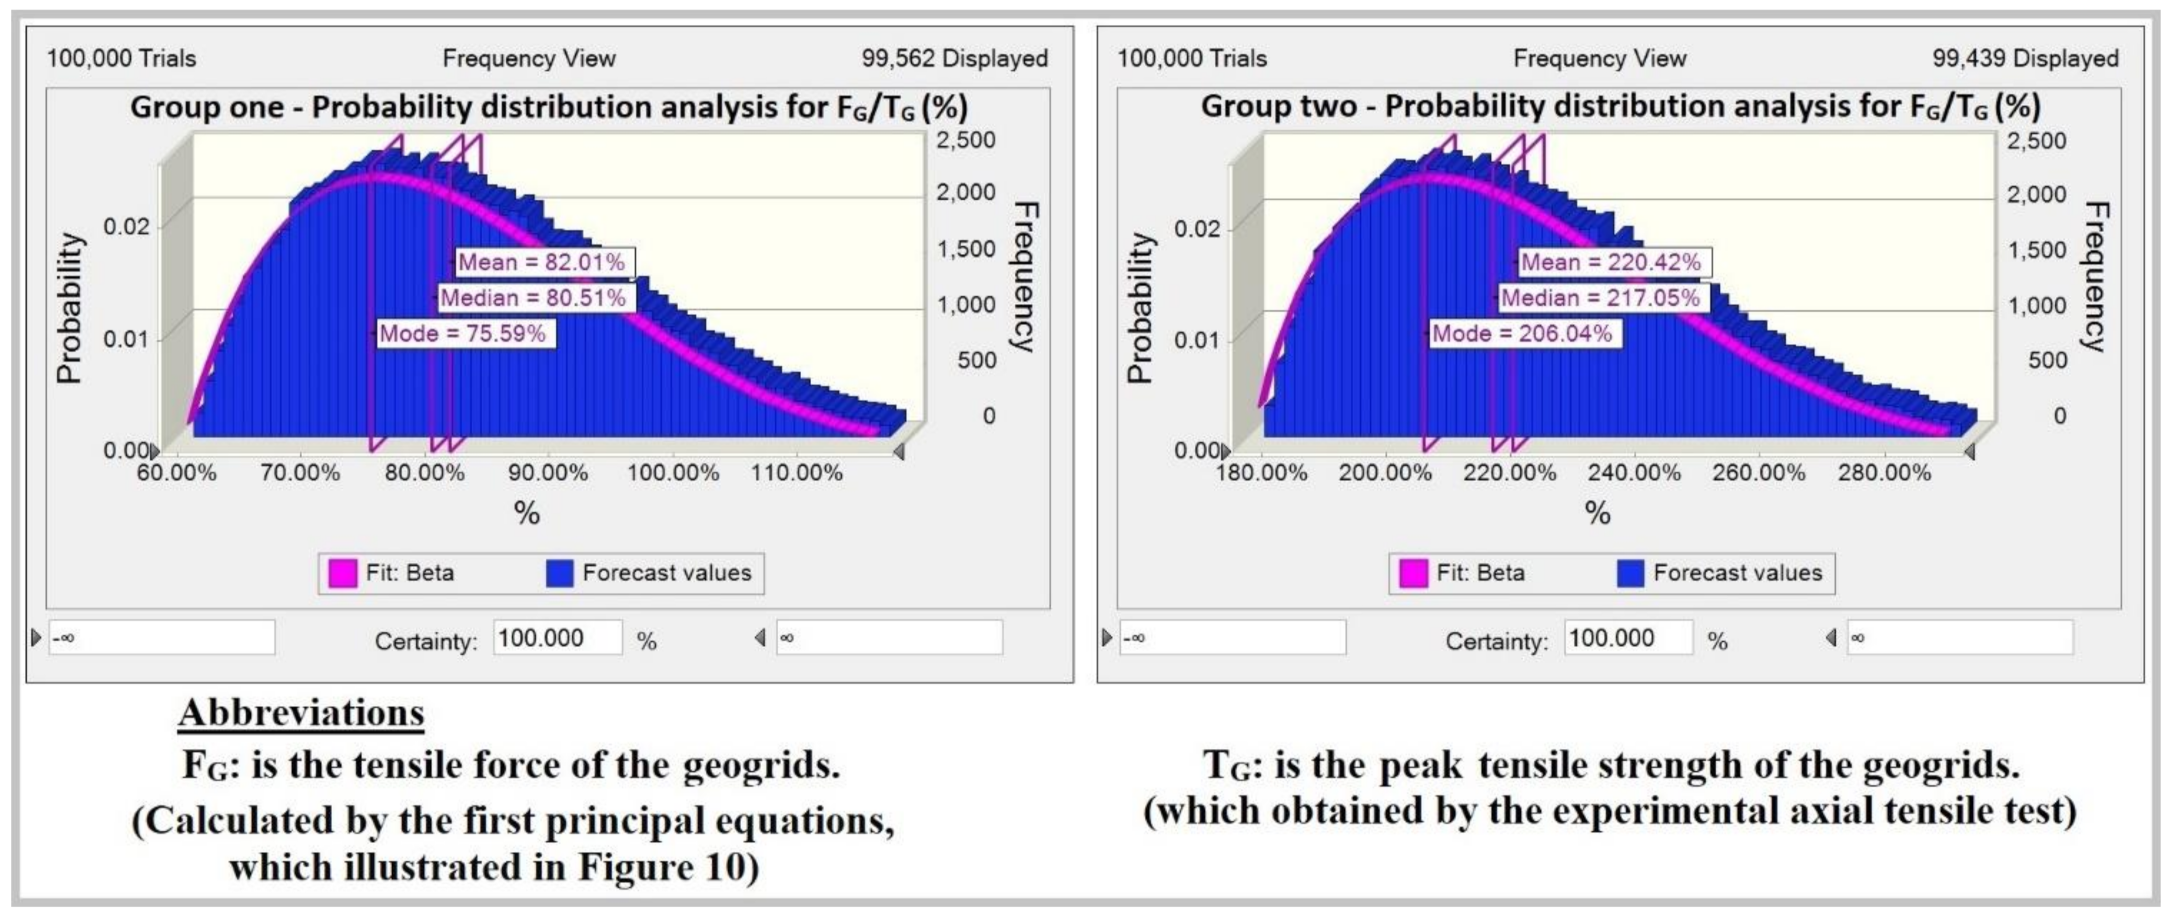
5. Geogrids Tensile Force at the Post-Peak Load

The tensile force of the geogrids at the post-peak load for each concrete slab was estimated depending on the Limit States Design Method of concrete structures, as declared in the Egyptian Code for Design and Construction of Concrete Structures (ECP:203-2018) [23], and based on the characteristic state of the concrete slabs’ materials. Thus, the materials’ strength reduction factors of concrete and steel rebars were not considered.
Accordingly, the compressive strain of the top concrete slab is equal to 0.3%, and the tensile force of the bottom steel rebars is equal to its yield force. The design and the idealized characteristic stress–strain curves for the concrete material and steel rebars material as declared in ECP:203-2018 are illustrated in Figure 6. The design stain diagrams and the design stress diagrams per each case of using the hybrid reinforcing of steel rebars and uniaxial geogrids as a concrete slab-reinforcing material (the concrete slabs of group one) or using the hybrid reinforcing of steel rebars and triaxial geogrids as a concrete slab-reinforcing material (the concrete slabs of group two) are illustrated in Figure 7. Accordingly, the tensile force of each concrete slab’s geogrids was estimated in accordance with the Limit States Design Method of concrete structures, as declared in ECP:203-2018 and summarized throughout Table 6.
The peak tensile strength of the geogrids is estimated from Equation-(1) (Note: as per the hybrid reinforcing configuration of the concrete slabs for group one and group two, the strip width of the geogrids is equal to 45 cm). For the case of using the hybrid reinforcing of steel rebars and uniaxial geogrids (group one under this study), the ratio of uniaxial geogrids’ tensile force to its peak tensile strength had a percentage value ranging from 60.10% to 129.37%, as illustrated in Table 6; it should be indicated that no rib-cuttings had occurred for group one and the uniaxial geogrids reached its specified yield strain by its manufacturer at a load value ranging from 90% (cases of one flexural cracks occurred) to 100% (cases of two flexural cracks occurred) of the post-peak load [18].
For the case of using the hybrid reinforcing of steel rebars and triaxial geogrids (group two under this study), the ratio of triaxial geogrids’ tensile force to its peak tensile strength had a percentage value ranging from 178.13% to 321.72%, as illustrated in Table 6. It should be indicated that numerous rib-cuttings occurred for group two and the triaxial geogrids reached its numerical yield strain approximately at the post-peak load for the case of using one layer, while the triaxial geogrids reached its numerical yield strain after the post-peak load for the case of using two layers [18]. After reviewing the presented data in Table 6, the decision was to estimate the characteristic resistance moment and the design resistance moment per each concrete slab in order to conclude a simple design relation between them, the experimental moment at the post-peak load, the grade of the geogrids (geogrids’ peak tensile strength), the strip width of the geogrids, and the count of the geogrid layers.
TG = T W N
where TG is the tensile strength of the geogrids (kN), T is the peak tensile strength of the geogrids (kN/m), W is the strip width of the geogrids (m), and N is the count of the geogrids’ layers.
It should be indicated that as concluded from the geogrids’ experimental stress–strain curves (as illustrated in Figure 3), the specified yield strain by its manufacturer of uniaxial geogrids is corresponding to a tensile strength value approximately equal to 75% of its peak tensile strength, while the specified yield strain by the numerical analysis of triaxial geogrids corresponds to a tensile strength value approximately equal to 60% of its peak tensile strength. As shown in Figure 3 and Table 6, the uniaxial geogrids as concrete slab-reinforcing material carried an approximate equal or greater tensile force (which estimated by the first principal equations) in comparison to its experimental tensile strength at the same strain (which obtained from the axial tensile test), while the triaxial geogrids as concrete slab-reinforcing material always carried greater tensile force (which was estimated by the first principal equations) in comparison to its experimental tensile strength at the same strain, which was obtained from the axial tensile test. The reason for that is the transverse bars or integral nodes of the uniaxial or triaxial geogrids as concrete-reinforcing material are confined entirely in the concrete, keeping its location and providing prevention of the transmitting of tensile force to the next uniaxial geogrids’ rib portions or triaxial geogrids’ hexagon pitches leading to dividing the total tensile force (concrete slab’s total internal tensile force carried by geogrids) into the contributing uniaxial geogrids’ ribs portions or triaxial geogrids’ hexagon pitches to carrying it. This is so the carried tensile for each geogrids’ rib portions or hexagonal pitches is a part of the total concrete slab’s internal tensile force carried by geogrids [18]. At the same time, during the experimental axial tensile test, the transverse bars or the integral nodes have free movement, so the carried tensile strength for each geogrids’ rib portions or hexagonal pitches is equal to the total tensile strength. Figure 8 and Figure 9 clarify this issue in more detail.
Accordingly, geogrids are expected to have a better performance if it is hybrid with a moderate (not the minimum) steel rebar ratio, as this condition is expected to increase, spread, and distribute the flexural cracks throughout the concrete slab’s tension zone length [18].

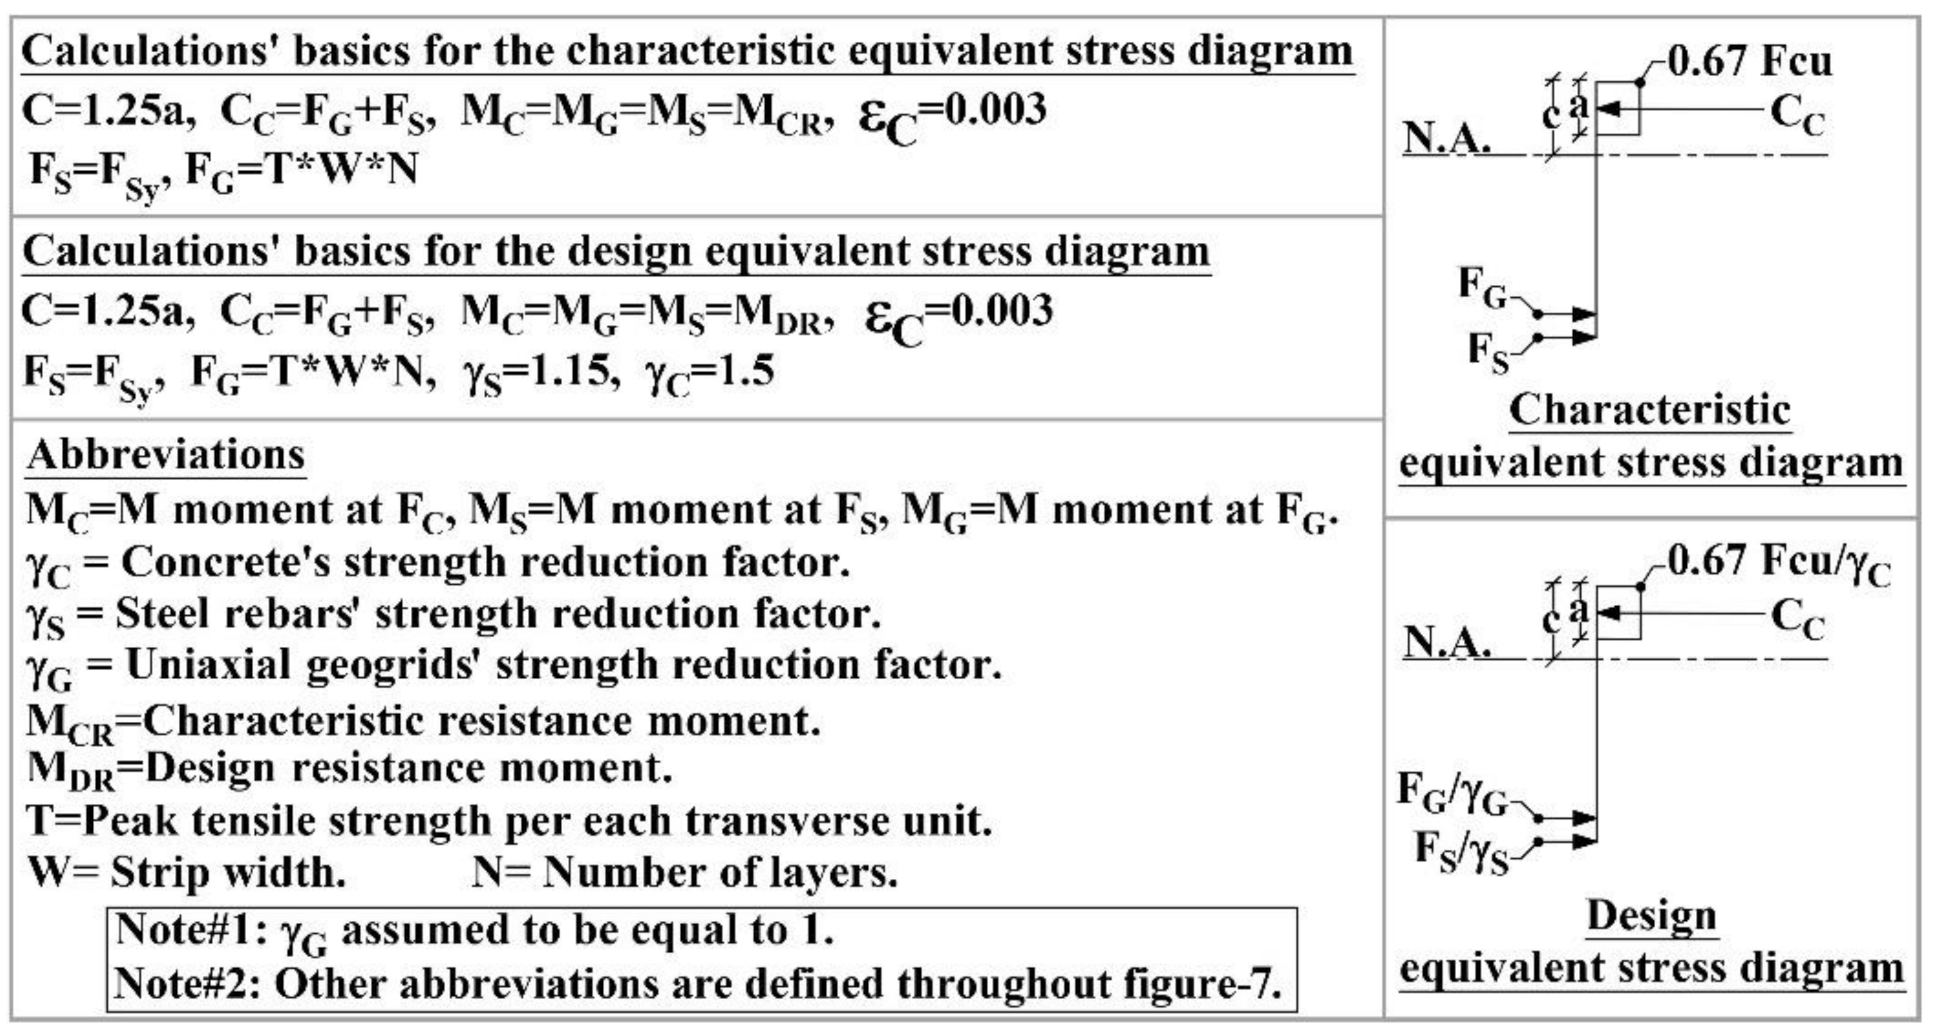
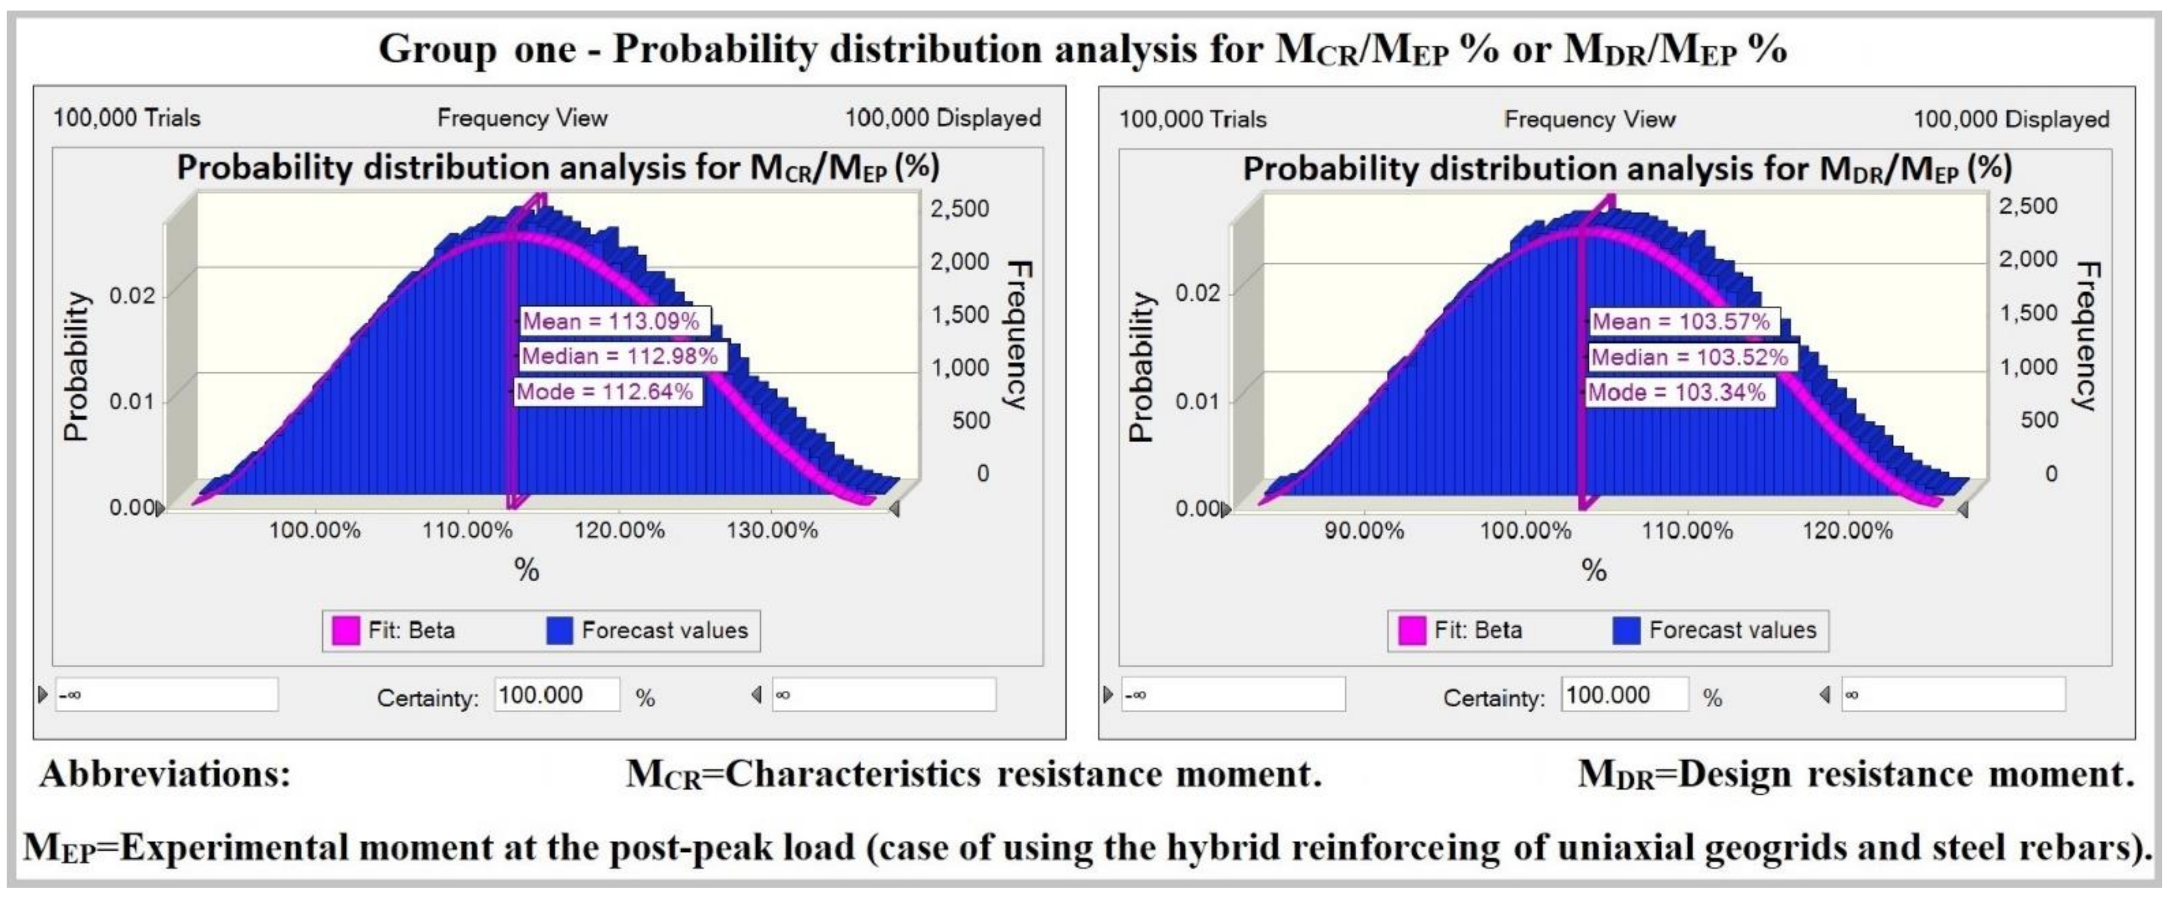
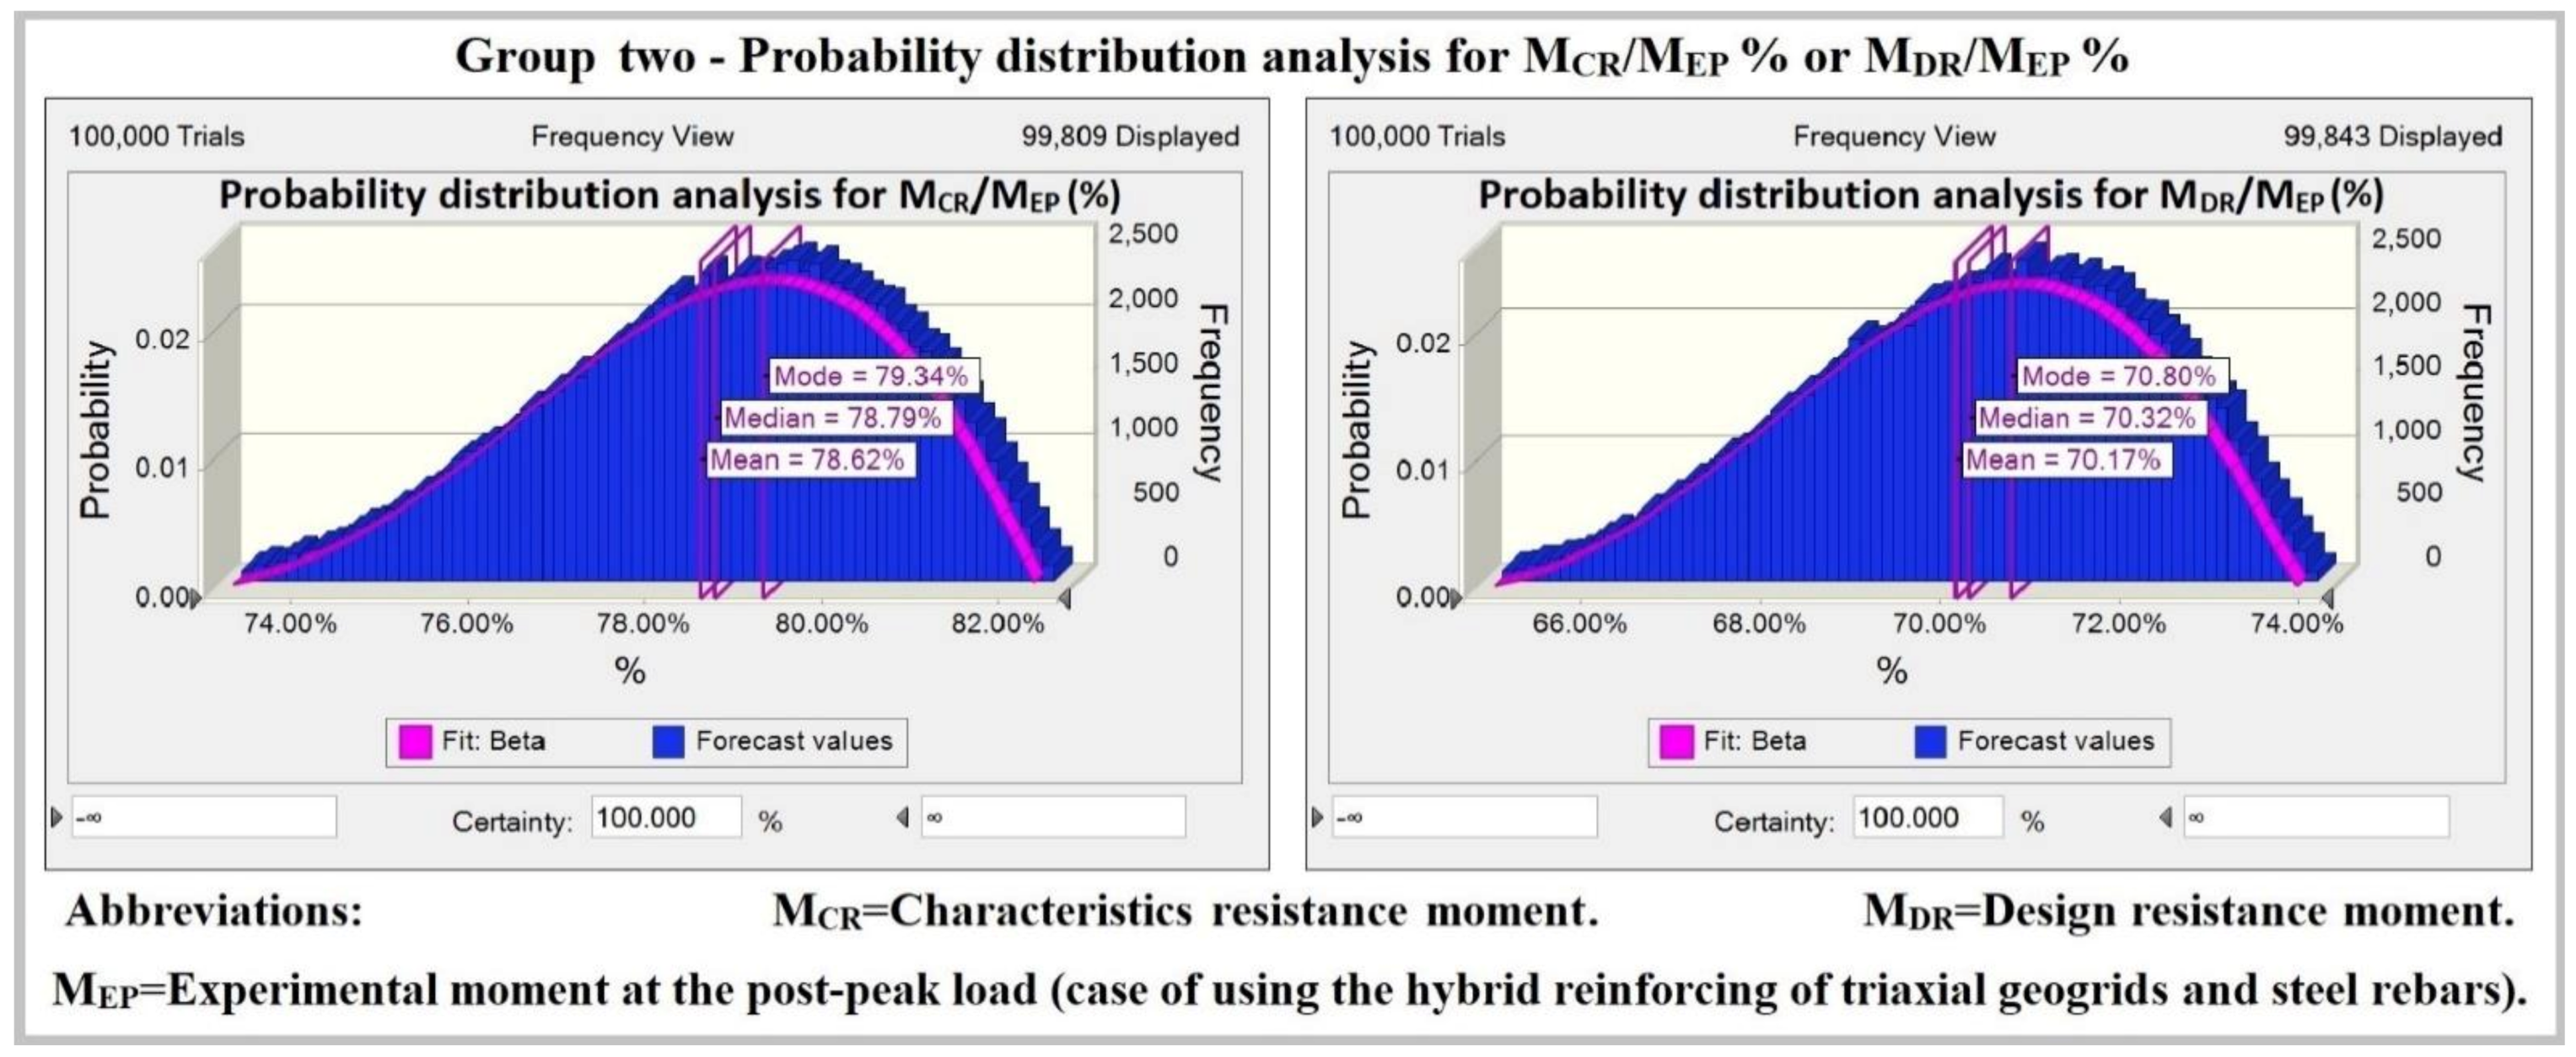
6. Experimental Moment, Characteristics Resistance Moment, and Design Resistance Moment

For each concrete slab, the characteristic resistance moment and the design resistance moment were estimated in accordance with the Limit States Design Method of Concrete Structures, as declared in the Egyptian Code of Concrete Structures Design and Construction (ECP:203-2018) [23]. Accordingly, the compressive strain of the top concrete slab is equal to 0.3%; the tensile force of the bottom steel rebars is equal to its yield force. The strength reduction factor of the materials is equal to 1.15 or 1.5, respectively, for estimating the design force in steel rebars or concrete, and the strength reduction factor of the materials is equal to 1 for estimating the characteristic force in steel rebars or concrete.
It should be indicated that as the strength reduction factor of the geogrids is not declared by any design codes of the concrete structures, the strength reduction factor of the geogrids is assumed to be equal to 1 for both cases of estimating the characteristic or design tensile force of the geogrids as concrete slab-reinforcing material. Also, the decision was made to take the tensile force of the geogrids to be equal to its peak tensile strength, which was estimated from Equation (1) for both cases of estimating the concrete slabs’ characteristic or design resistance moment. Figure 10 shows the estimation basics of both cases of estimating the concrete slabs’ characteristics and design resistance moment. Table 7 shows the estimated values of the characteristic resistance moment, the design resistance moment, and their ratios to the experimental moment at the post-peak load.

7. Simple Design Relation to Estimate the Desired Grade of Geogrids and Its Count of Layers

After reviewing the presented data throughout Table 7, it was clear that the ratios of the characteristic resistance moment or the design resistance moment to the experimental moment at the post-peak load had unequal values; accordingly, an analysis of the probability distribution should be done in order to provide a more constant value of them.
For group one (the case of using the hybrid reinforcing of steel rebars and uniaxial geogrids), the ratio of the characteristic resistance moment to the experimental moment had a percent value that ranges from 90.97% to 136.84%, and the ratio of the design resistance moment to the experimental moment at the post-peak load had a percent value ranges from 82.30% to 125.75%. As such, an analysis of the probability distribution was done in order to provide a more constant value to them, as illustrated in Figure 11. The results of the probability distribution analysis for the percentage ratio of the characteristic resistance moment to the experimental moment at the post-peak load indicted that the median value is equal to 112.98%, the mean value is equal to 113.09%, and the mode value is equal to 112.64%; accordingly, the experimental moment at the post-peak load is equal to 0.88 times the characteristic resistance moment, as illustrated in Equation (2). The results of the probability distribution analysis for the percentage ratio of the design resistance moment to the experimental moment at the post-peak load indicated that the median value is equal to 103.52%, the mean is equal to 103.57%, and the mode is equal to 103.34%. Thus, the experimental moment at the post-peak load is equal to 0.97 times the design resistance moment, as illustrated in Equation (2).
MEP = 0.88 MCR = 0.97 MDR, (Where FG = TG = T W N and the case of using the hybrid reinforcing of steel rebars and uniaxial geogrids)
where MEP is the experimental moment at the post-peak load; MCR is the characteristic resistance moment; MDR is the design resistance moment; FG is the tensile force of the uniaxial geogrids (kN); TG is the tensile strength of the geogrids (kN). T is the peak tensile strength of the uniaxial geogrids (kN/m); W is the strip width of the uniaxial geogrids (m), and N is the count of the uniaxial geogrids’ layers.
For group two (the case of using the hybrid reinforcing of steel rebars and triaxial geogrids), the ratio of the characteristic resistance moment to the experimental moment had a percent value that ranges from 71.89% to 82.46%, and the ratio of the design resistance moment to the experimental moment at the post-peak load had percentage value ranges from 63.81% to 74.03%. Therefore, an analysis of the probability distribution was done in order to provide a more constant value of them, as illustrated in Figure 12. The results of the probability distribution analysis for the percentage ratio of the characteristic resistance moment to the experimental moment at the post-peak load indicted that the median value is equal to 78.79%, the mean value is equal to 78.62%, and the mode value is equal to 79.34%; accordingly, the experimental moment at the post-peak load is equal to 1.26 times the characteristic resistance moment, as illustrated in Equation (3). The results of the probability distribution analysis for the percentage ratio of the design resistance moment to the experimental moment at the post-peak load indicted that the median value is equal to 70.32%, the mean is equal to 70.37%, and the mode is equal to 70.8%; accordingly, the experimental moment at the post-peak load is equal to 1.41 times the design resistance moment, as illustrated in Equation (3).
MEP = 1.26 MCR = 1.41 MDR, (Where FG = TG = T W N and the case of using the hybrid reinforcing of steel rebars and triaxial geogrids)
where MEP is the experimental moment at the post-peak load, MCR is the characteristic resistance moment, MDR is the design resistance moment, FG is the tensile force of the triaxial geogrids (kN), TG is the tensile strength of the geogrids (kN), T is the peak tensile strength of the triaxial geogrids (kN/m), W is the strip width of the triaxial geogrids (m), and N is the count of the triaxial geogrids’ layers.
The estimated values of the experimental moment at the post-peak load (MEP) from Equation (2) or Equation (3) and their ratios to the experimental ones are illustrated in Table 8, which resulted in a variance that frequently has a range of ± 10% when compared with the actual experimental data.
It should be indicated that both equation-(2) and equation-(3) objective to estimate the experimental moment at the post-peak load in terms of characteristic resistance moment or design resistance moment and based on the assumption of the geogrids’ tensile force at the post-peak load is equal to their peak tensile strength which estimated from Equation (1). However, the geogrids’ experimental tensile force at the post-peak load is not equal to their tensile strength; accordingly, an analysis of the probability distribution was done for the mentioned ratios of the geogrids’ experimental tensile force at the post-peak load (which estimated by the first principal equations) to their peak tensile strength in Table 6 in order to provide a more constant value of them, as illustrated in Figure 13. For group one, the results of the probability distribution analysis for the mentioned ratios of uniaxial geogrids’ experimental tensile force at the post-peak load to their peak tensile strength in Table 6 indicated that the median value is equal to 80.51%, the mean value is equal to 82.01%, and the mode value is equal to 75.59%. Therefore, the uniaxial geogrids’ characteristic tensile force at the post-peak load is equal to 0.76 times their peak tensile strength, as illustrated in Equation (4).
For group two, the results of the probability distribution analysis for the mentioned ratios of triaxial geogrids’ characteristic tensile force at the post-peak load to their peak tensile strength in Table 6 indicated that the median value is equal to 217.05%, the mean value is equal to 220.42%, and the mode value is equal to 206.04%. Therefore, the uniaxial geogrids’ experimental tensile force at the post-peak load is equal to 2.06 times their peak tensile strength, as illustrated in Equation (5). The characteristic resistance moment is re-estimated based on the estimated geogrids’ characteristic tensile force from Equation (4) and Equation (5) and compared to the experimental moment at the post-peak load, as illustrated in Table 9, which resulted in a variance that frequently had a range of ± 5% when compared with the actual experimental data.
FCG = 0.76 T W N (case of using the hybrid reinforcing of steel rebars and uniaxial geogrids)
FCG = 2.06 T W N (case of using the hybrid reinforcing of steel rebars and triaxial geogrids)
where FCG is the characteristic tensile force of the geogrids (kN), T is the peak tensile strength of the geogrids (kN/m), W is the strip width of the geogrids (m), and N is the count of the geogrids’ layers.

8. Conclusions and Recommendations

Uniaxial geogrids as concrete slab-reinforcing material carried an approximately equal or greater tensile force (which was estimated by first principal equations) in comparison to its experimental tensile strength corresponding to the same strain, which was obtained from the axial tensile test. The triaxial geogrids, as concrete slab-reinforcing material, always carried greater tensile force (which was estimated by first principal equations) in comparison to its experimental tensile strength corresponding to the same strain, which was obtained from the axial tensile test. The reason for that is the transverse bars or integral nodes are confined entirely by the concrete in uniaxial or triaxial geogrids, as concrete-reinforcing material, keeping its location and providing prevention of the transmitting of tensile force to the next uniaxial geogrids’ rib portions or triaxial geogrids’ hexagon pitches. This leads to the dividing of the total tensile force (concrete slab’s total internal tensile force carried by geogrids) being carried by the contributing uniaxial geogrids’ rib portions or triaxial geogrids’ hexagon pitches. This is so the carried tensile for each geogrids’ rib portions or hexagonal pitches is a part of the total concrete slab’s internal tensile force, which is carried by the geogrids. Meanwhile, during the experimental axial tensile test, the geogrids’ transverse bars or the integral nodes have free movement. Thus, the carried tensile strength for each geogrids’ rib portions or hexagonal pitches is equal to the total tensile strength.
For the design relations of the reinforced concrete slabs by the hybrid reinforcing of steel rebars and uniaxial geogrids, the concrete slabs’ experimental moment at the post-peak load could be estimated by the equation of “MEP = 0.88 MCR = 0.97 MDR, (based on the assumption of FG = TG = T W N)”, and for more accuracy, the uniaxial geogrids’ characteristic tensile force could be estimated by the equation of “FCG = 0.76 T W N”. For the design relations of the reinforced concrete slabs by the hybrid reinforcing of steel rebars and triaxial geogrids, the concrete slabs’ experimental moment at the post-peak load could be estimated by the equation of “MEP = 1.26 MCR = 1.41 MDR, (based on the assumption of FG = TG = T W N)”, and for more accuracy, the triaxial geogrids’ characteristic tensile force could be estimated by the equation of “FCG = 2.06 T W N”. Where MEP is the experimental moment at the post-peak load, MCR is the characteristic resistance moment, MDR is the design resistance moment, FG is the tensile force of the geogrids (kN), TG is the tensile strength of the geogrids (kN), T is the peak tensile strength of the geogrids (kN/m), W is the strip width of the geogrids (m), N is the count of the geogrids’ layers, and FCG is the characteristic tensile force of the geogrids (kN).
It should be noted that, based on the implemented configuration of the hybrid reinforcing method in this study, the steel rebars had a minimum reinforcing ratio for all concrete slabs, while the geogrids had different types, tensile strengths, and layer numbers. As concluded from the experimental study, geogrids are expected to have better performance if they are a hybrid with a moderate (not the minimum) reinforcing ratio of the steel rebars. Accordingly, the above-mentioned equations’ constants could be affected by increasing the reinforcing ratio of the steel rebars.

9. Future Studies

We hope to engage in further study of the effect of increasing the reinforcing ratio of the steel rebars on the above-mentioned equations’ constants. In addition, we hope to study the effectiveness of pretensioning the uniaxial geogrids before the concrete pouring to provide uniaxial geogrid prestressed concrete slabs or beams, as this principle expects to improve mechanical properties, minimize plastic deformation, and increase the cost-benefit ratio.

Author Contributions

All authors contributed to this research paper and discussed the results and reviews during all phases of the research paper. All authors have read and accepted the published version of the research paper.

Funding

This research received no external funding.

Conflicts of Interest

The authors declare no conflict of interest.

References

  1. Saranyadevi, M.; Suresh, M.; Sivaraja, M. Strengthening of Concrete Beam by Reinforcing with Geosynthetic Materials. Int. J. Adv. Res. Educ. Technol. 2016, 3, 245–251. [Google Scholar]
  2. Maxwell, S.; Kim, W.-H.; Tuncer, B.E.; Benson, C.H. Effectiveness of Geo-Synthetics in Stabilizing Soft Subgrades; University of Wisconsin-Madison: Madison, WI, USA, 2005. [Google Scholar]
  3. Webster, S.L. Geogrid Reinforced Base Course for Flexible Pavements for Light Aircraft: Test. Section Construction, Behaviour under Traffic, Laboratory Tests, and Design Criteria; National Technical Information Service: Springfield, VA, USA, 1992. [Google Scholar]
  4. Sharbaf, M. Laboratory Evaluation of Geogrid-Reinforced Flexible Pavements. Master’s Thesis, University of Nevada, Las Vegas, NV, USA, May 2016. [Google Scholar]
  5. Al-Hedad, S.A.; Bambridge, E.; Muhammad, N.S. Influence of Geogrid on The Drying Shrinkage Performance of Concrete Pavements. Constr. Build. Mater. 2017, 146, 165–174. [Google Scholar] [CrossRef] [Green Version]
  6. Al-Hedad, A.S.A.; Farhan, N.A.; Zhang, M.; Sheikh, M.N.; Hadi, M.N.S. Effect of geogrid reinforcement on the drying shrinkage and thermal expansion of geopolymer concrete. Struct. Concr. 2020, 21, 1029–1039. [Google Scholar] [CrossRef]
  7. Al-Hedad, A.-A.; Hadi, M.N.S. Effect of geogrid reinforcement on the strains at compressive zone of concrete pavements. Struct. Concr. 2020, 1–11. [Google Scholar] [CrossRef]
  8. Al Basiouni Al Masri, Z.; Daou, A.; Haj Chhade, R.; Chehab, G. Experimental and Numerical Assessment of the Behavior of Geogrid-Reinforced Concrete and Its Application in Concrete Overlays. J. Mater. Civ. Eng. 2018, 30, 04018332. [Google Scholar] [CrossRef]
  9. Itani, H.; Saad, G.A.; Chehab, G.R. The use of geogrid reinforcement for enhancing the performance of concrete overlays: An experimental and numerical assessment. Constr. Build. Mater. 2016, 124, 826–837. [Google Scholar] [CrossRef]
  10. Khodaii, A.; Fallah, S. Effects of Geo-Synthetic Reinforcement on The Propagation of Reflection Cracking in Asphalt Overlays. Int. J. Civ. Eng. 2009, 7, 131–140. [Google Scholar]
  11. Walubita, L.F.; Nyamuhokya, T.P.; Komba, J.; Tanvir, H.A.; Souliman, M.; Naik, B. Comparative assessment of the interlayer shear-bond strength of geogrid reinforcements in hot-mix asphalt. Constr. Build. Mater. 2018, 191, 726–735. [Google Scholar] [CrossRef]
  12. Tang, X.; Chehab, G.R.; Kim, S. Laboratory study of geogrid reinforcement in Portland cement concrete. In Proceedings of the 6th RILEM International Conference on Cracking in Pavements, Chicago, IL, USA, 16–18 June 2018; pp. 769–778. [Google Scholar]
  13. Ahmed Shaban, A.H.G. Strengthening of Reinforced Concrete Slabs Using Different types of Geo-Grids. Int. J. Civ. Eng. Technol. 2019, 10, 1851–1861. [Google Scholar]
  14. Al Qadi, A.N.; Al-Kadi, Q.N.S.; Al-Zaidyeen, S.M. Impact Strength of Oil-Palm Shell on Lightweight Concrete Slabs Reinforced with a Geo-Grid. J. Mater. Civ. Eng. 2015, 27, 04014264. [Google Scholar] [CrossRef]
  15. Tang, X.; Mohamad, N.; Higgins, J.; Higgins, I. Concrete Slab-on-Grade Reinforced by Geogrids. In Proceedings of the Eight International Conference on Case Histories in Geotechnical Engineering, Philadelphia, PA, USA, 24–27 March 2019. [Google Scholar]
  16. Mohamed, R.N.A.; El Sebai, A.M.; Gabr, A.S.A.-H. Flexural Behavior Analysis and Design Approach for R.C. Beams by Hybrid Reinforcement of Steel Rebars and HDPE Uniaxial Geogrids. Lat. Am. J. Solids Struct. 2021, 18, 1–27. [Google Scholar] [CrossRef]
  17. El Meski, F.; Chehab, G.R. Flexural behavior of concrete beams reinforced with different types of geogrids. J. Mater. Civ. Eng. 2014, 26, 04014038. [Google Scholar] [CrossRef]
  18. Mohamed, R.N.A.; El Sebai, A.M.; Gabr, A.S.A.-H. Flexural Behavior of Reinforced Concrete Slabs Reinforced with Innovative Hybrid Reinforcement of Geogrids and Steel Bars. Buildings 2020, 10, 161. [Google Scholar] [CrossRef]
  19. Ahmed Alamli, A.S.; Yousif, M.A.; Mohammed, M.H. Reinforced Concrete Strengthening by Using Geotextile Reinforcement for Foundations and Slabs. Int. J. Civ. Struct. Environ. Infrastruct. Eng. Res. Dev. 2017, 7, 35–46. [Google Scholar] [CrossRef]
  20. Ali, Y.S.; Awad Waryosh, W.; Yousif, M.A. Increasing Ultimate Strength of Reinforced Concrete Slab by Using Geogrid. Glob. J. Eng. Sci. Res. Manag. 2018, 5, 83–94. [Google Scholar] [CrossRef]
  21. Tharani, K.; Mahendran, N.; Vijay, T.J. Experimental Investigation of Geogrid Reinforced Concrete Slab. Int. J. Eng. Adv. Technol. 2019, 8, 158–163. [Google Scholar]
  22. Dong, Y.-L.; Han, J.; Bai, X.-H. Numerical analysis of tensile behavior of geogrids with rectangular and triangular apertures. Geotext. Geomembr. 2011, 29, 83–91. [Google Scholar] [CrossRef]
  23. Egyptian Ministry of Housing; Egyptian Code Standing Committee for Design and Construction of Concrete Structures. Egyptian Code for Design and Construction of Concrete Structures (ECP:203-2018); Housing and Building National Research Center (HBRC): Dokki, Egypt, 2018.
Figure 1. Graphical summary of the paper.
Inventions 06 00032 g001
Figure 2. Dimensional characteristics of the used uniaxial geogrids and triaxial geogrids.
Inventions 06 00032 g002
Figure 3. Stress–strain curve per each grade of uniaxial geogrids and triaxial geogrids.
Inventions 06 00032 g003
Figure 4. General arrangement and reinforcing material details per each group of the experimental program.
Inventions 06 00032 g004
Figure 5. The test setup details.
Inventions 06 00032 g005
Figure 6. The design and the idealized characteristic stress–strain curves for the concrete and steel rebars material.
Inventions 06 00032 g006
Figure 7. The design stain diagrams and the design stress diagrams per each case of using the hybrid reinforcing of steel rebars and uniaxial geogrids as a concrete slab-reinforcing material (the concrete slabs of group one) or using the hybrid reinforcing of steel rebars and triaxial geogrids as a concrete slab-reinforcing material (the concrete slabs of group two).
Inventions 06 00032 g007
Figure 8. The internal forces in the uniaxial geogrids, the steel rebars, and the concrete.
Inventions 06 00032 g008
Figure 9. The internal forces in the triaxial geogrids, the steel rebars, and the concrete.
Inventions 06 00032 g009
Figure 10. The estimations basics.
Inventions 06 00032 g010
Figure 11. Probability distribution analysis for the ratios of the characteristic resistance moment or design resistance moment to the experimental moment at the post-peak load (case of using the hybrid reinforcing of steel rebars and uniaxial geogrids).
Inventions 06 00032 g011
Figure 12. Probability distribution analysis for the ratios of the characteristic resistance moment or design resistance moment to the experimental moment at the post-peak load (case of using the hybrid reinforcing of steel rebars and triaxial geogrids).
Inventions 06 00032 g012
Figure 13. Probability distribution analysis for the ratios of uniaxial or triaxial geogrids’ experimental tensile force at the post-peak load to their tensile strength.
Inventions 06 00032 g013
Table 1. The design mix of the used concrete.
Concrete–Mix, WC = 0.5, 1.5% Admixture
Cement Grade 42.5SandCrushed LimestoneWaterWater Reducing and Super-Plasticizer Concrete AdmixtureCone SlumpCompressive Strength after 28 days
400 kg/m3600 kg/m31200 kg/m3200 kg/m36 kg/m36.5 cm40 N/mm2
Table 2. The characteristics of the used steel rebars as per the experimental tests.
Characteristics of the Steel Rebars
Diameter in mm (nominal)6Cross-Area in mm2 (nominal)28.29
Weight in kg/m (experimental)0.224Cross-Area in mm2 (experimental)28.52
Yield Load in kN (experimental)8.4Ultimate Load in kN (experimental)13.51
Yield Stress in N/mm2 (experimental)296.97Tensile Resistance in N/mm2 (experimental)477.51
Yield Strain in Micro-strain (experimental)1485Elongation After Break Down in % (experimental)32.7
Young’s modulus in N/mm2 (experimental) 200000
Table 3. Characteristics of the used uniaxial geogrids by the experimental tests and the manufacturer.
CharacteristicsUniaxial Geogrids (UG) Grades
UG45UG90UG120UG160
RL in mm (physical)220220220220
Rs in mm (physical)18151513
Bw in mm (physical)12.51516.819.5
Rw in mm (physical)2.73.346.1
Bt in mm (physical)3.65.577.5
Rt in mm (physical)1.31.72.42.3
Mass per Unit Area in g/m23006008001000
Tensile Strength at 2% Strain in kN/m (theoretical)11263645
Tensile Strength at 5% Strain in kN/m (theoretical)25507290
Tensile design Strength in kN/m (theoretical)21.242.456.575.4
Yield Point Elongation in % (theoretical)11.5131313
Peak Tensile Strength in kN/m (theoretical)4590120160
Peak Tensile Strength in kN/m (experimental)45.5679.36103.91143.46
Peak Strain in % (Experimental)30303030
Young’s modulus in N/mm2 (experimental)1500155012001100
MaterialHigh-Density Polyethylene (HDPE)
Table 4. Characteristics of the used triaxial geogrids by the experimental tests, the manufacturer, and the numerical analysis.
CharacteristicsTriaxial Geogrids (TG) Grades
TG150TG160
Transverse (1)Diagonal (2)Transverse (1)Diagonal (2)
Mid-rib depth D in mm (physical)1.11.41.51.8
Mid-rib width W in mm (physical)1.211.31.1
Rib pitch P in mm (physical)4040
Rib shapeRectangularRectangular
Aperture shapeTriangularTriangular
Radial Secant Stiffness at 0.5% Strain in kN/m (theoretical)360 (–75)390 (−75)
Radial Secant Stiffness at 2% Strain in kN/m (theoretical)250 (−65)290 (−65)
Hexagon Pitch in mm (theoretical)80 (±4)80 (±4)
Radial Secant Stiffness Ratio (theoretical)0.80.8
Peak Tensile Strength in kN/m (experimental)17.2119.45
Radial Secant Stiffness at 2% strain in kN/m (Experimental), according to BS EN 1SO 10319:1996195245
Peak Strain in % (experimental)14.514.5
Yield Strain in % (numerical) [22]6.46.4
Young’s modulus in N/mm2 (experimental)28002350
MaterialPolypropylene with a Minimum of 2% Finely Divided Carbon Black Content
Table 5. The summary of the experimental results.
Group No.Concrete Slab NumberLoading Period Critical PointsExperimental Moment at the Post-Peak Load (kN·m)
First-Crack Load Associated with Initial-Peak Load (kN)Load Drop (kN)Steel-Yield Load (kN)Post-Peak Load (kN)Failure Load (kN)
Control SlabS1-ST-CONT22.1617.918.3721.1821.153.71
Group OneS2-ST+1UG4524.3519.520.5925.6925.464.49
S3-ST+1UG9024.1821.421.3926.5926.594.65
S4-ST+2UG4525.9218.121.8427.6827.394.84
S5-ST+1UG12025.2221.422.1429.229.125.11
S6-ST+1UG16027.1720.322.9233.8233.745.91
S7-ST+2UG9025.3323.422.8832.7532.645.73
S8-ST+2UG12026.3322.624.2236.734.596.42
S9-ST+2UG16028.1624.125.1739.6739.616.94
Group TwoS10-ST+1TG15025.5917.919.2422.9619.494.02
S11-ST+1TG16027.8418.920.1226.1521.664.57
S12-ST+2TG15026.5919.719.9125.7818.054.51
S13-ST+2TG16028.942021.3927.2722.124.77
The Load-Deflection Behaviour and the Load-Loading Period Critical Points Inventions 06 00032 i001
Table 6. The tensile force of the geogrids per each concrete slab and its ratio to geogrids’ peak tensile strength.
Group NumberConcrete Slab No.The Tensile Force of Geogrids (FG) at the Experimental Post-Peak Load (kN)The Peak Tensile Strength of Geogrids (TG), Estimated by Equation-(1)
(kN)
FG/TG
(%)
Group oneS2-ST+1UG4526.5220.51129.37%
S3-ST+1UG9029.3435.71282.15%
S4-ST+2UG4532.7741.00479.91%
S5-ST+1UG12036.9346.759.578.98%
S6-ST+1UG16050.5264.55778.25%
S7-ST+2UG9049.0871.42468.70%
S8-ST+2UG12063.9793.51968.40%
S9-ST+2UG16077.61129.11460.10%
Group twoS10-ST+1TG15019.377.75250.12%
S11-ST+1TG16028.158.76321.72%
S12-ST+2TG15027.5915.49178.13%
S13-ST+2TG16032.1417.51183.65%
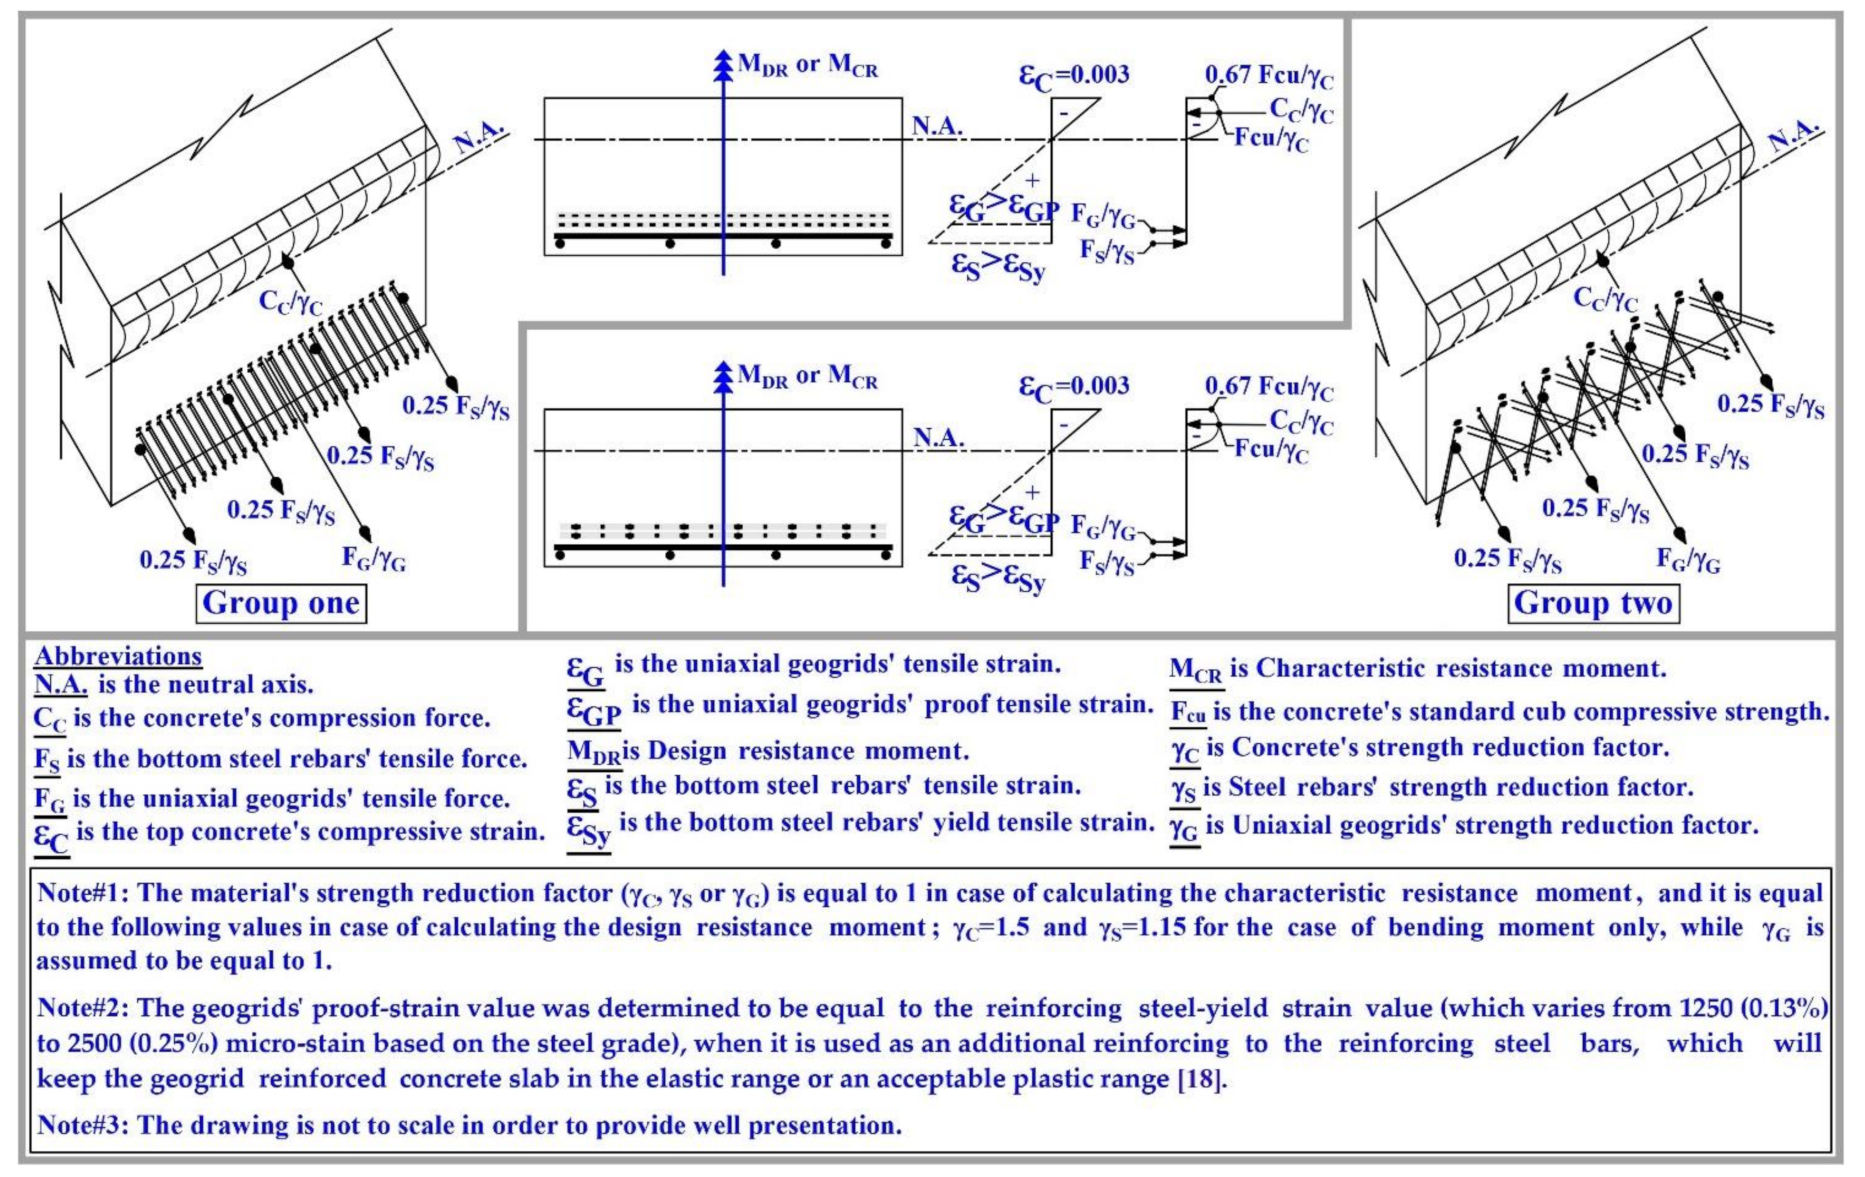
First note: The tensile force of the geogrids was estimated based on: ● Considering the characteristic state of the concrete slabs’ material (the strength reduction factors of the concrete slabs’ materials are not considered), the top concrete’s compressive strain is equal to 0.3%, and the bottom steel rebars tensile force equal to its yield force. ● The bending moment of the concrete slabs is equal to its experimental moment at the post-peak load.
Second note: The geogrids’ rib-cuttings occurred only for group two’s concrete slabs, as numerous rib-cuttings of triaxial geogrids occurred.
Table 7. The estimated values of the characteristic resistance moment (MCR), the design resistance moment (MDR), and their ratios to the experimental moment at the post-peak load (MEP).
Group No.Concrete SlabsMEP (kN·m)MCR (kN·m)MDR (kN·m)MCR/MEP (%)MDR/MEP (%)
Group oneS2-ST+1UG454.504.093.7090.97%82.30%
S3-ST+1UG904.655.064.65108.74%99.93%
S4-ST+2UG454.845.364.94110.65%101.98%
S5-ST+1UG1205.115.735.29112.13%103.52%
S6-ST+1UG1605.926.776.28114.39%106.11%
S7-ST+2UG905.737.056.53123.01%113.94%
S8-ST+2UG1206.428.037.43125.03%115.69%
S9-ST+2UG1606.949.508.73136.84%125.75%
Group twoS10-ST+1TG1504.023.232.8680.39%71.18%
S11-ST+1TG1604.583.292.9271.89%63.81%
S12-ST+2TG1504.513.723.3482.46%74.03%
S13-ST+2TG1604.773.843.4580.47%72.29%
Table 8. The estimated values of the experimental moment at the post-peak load (MEP) from Equation (2) or Equation (3) and their ratios to the experimental ones.
Group No.Concrete SlabsMEP
(kN·m)
MEP = 0.88 MCR
(where FG = TG)
(kN·m)
MEP = 0.97 MDR
(where FG = TG)
(kN·m)
0.88 MCR/MEP
(%)
0.97 MDR/MEP
(%)
Group
one
S2-ST+1UG454.53.59923.58979.98%79.76%
S3-ST+1UG904.654.45284.510595.76%97.00%
S4-ST+2UG454.844.71684.791897.45%99.00%
S5-ST+1UG1205.115.04245.131398.68%100.42%
S6-ST+1UG1605.925.95766.0916100.64%102.90%
S7-ST+2UG905.736.2046.3341108.27%110.54%
S8-ST+2UG1206.427.06647.2071110.07%112.26%
S9-ST+2UG1606.948.368.4681120.46%122.02%
Group No.Concrete SlabsMEP
(kN·m)
MEP = 1.26 MCR
(where FG = TG)
(kN·m)
MEP = 1.41 MDR
(where FG = TG)
(kN·m)
1.26 MCR/MEP
(%)
1.41 MDR/MEP
(%)
Group
two
S10-ST+1TG1504.024.06984.0326101.24%100.31%
S11-ST+1TG1604.584.14544.117290.51%89.90%
S12-ST+2TG1504.514.68724.7094103.93%104.42%
S13-ST+2TG1604.774.83844.8645101.43%101.98%
Table 9. The estimated values of the characteristic resistance moment (MCR) considering Equation (4) for group one and Equation (5) for group two and their ratios to the experimental moment at the post-peak load (MEP).
Group numberConcrete SlabsMEP (kN·m)MCR (kN·m)MCR/MEP (%)
Group
one
S2-ST+1UG454.503.7783.86%
S3-ST+1UG904.654.5196.92%
S4-ST+2UG454.844.7497.85%
S5-ST+1UG1205.115.0298.24%
S6-ST+1UG1605.925.8398.50%
S7-ST+2UG905.736.04105.39%
S8-ST+2UG1206.426.81106.03%
S9-ST+2UG1606.947.98114.95%
Group
two
S10-ST+1TG1504.023.7994.33%
S11-ST+1TG1604.583.9185.44%
S12-ST+2TG1504.514.78105.95%
S13-ST+2TG1604.775.01104.98%
Publisher’s Note: MDPI stays neutral with regard to jurisdictional claims in published maps and institutional affiliations.

