Article

HVAC Systems Applied in University Buildings with Control Based on PMV and aPMV Indexes

by
Eusébio Z. E. Conceição
1,2,*,
António F. M. Sousa
2,
João M. M. Gomes
2 and
António E. Ruano
1,2,3
1
Faculdade de Ciências e Tecnologia, Universidade do Algarve, Campus de Gambelas, 8005-139 Faro, Portugal
2
CINTAL, Campus de Gambelas, 8005-139 Faro, Portugal
3
IDMEC, Instituto Superior Técnico, Universidade de Lisboa, 1049-001 Lisboa, Portugal
*
Author to whom correspondence should be addressed.
Inventions 2019, 4(1), 3; https://doi.org/10.3390/inventions4010003
Submission received: 10 December 2018 / Revised: 9 January 2019 / Accepted: 10 January 2019 / Published: 15 January 2019

Abstract

:
In this work, HVAC (Heating, Ventilation and Air Conditioning) systems applied in university buildings with control based on PMV (Predicted Mean Vote) and aPMV (adaptive Predicted Mean Vote) indexes are discussed. The building’s thermal behavior with complex topology, in transient thermal conditions, for summer and winter conditions is simulated by software. The university building is divided into 124 spaces, on two levels with an area of 5931 m2, and is composed of 201 transparent surfaces and 1740 opaque surfaces. There are 86 compartments equipped with HVAC systems. The simulation considers the actual occupation and ventilation cycles, the external environmental variables, the internal HVAC system and the occupants’ and building’s characteristics. In this work, a new HVAC control system, designed to simultaneously obtain better occupants’ thermal comfort levels according to category C of ISO 7730 with less energy consumption, is presented. This new HVAC system with aPMV index control is numerically implemented, and its performance is compared with the performance of the same HVAC system with the usual PMV index control. Both HVAC control systems turn on only when the PMV index or the aPMV index reaches values below −0.7, in winter conditions, and when the PMV index or the aPMV index reaches values above +0.7, in summer conditions. In accordance with the results obtained, the HVAC system guarantees negative PMV and aPMV indexes in winter conditions and positive PMV and aPMV indexes in summer conditions. The energy consumption level is higher in winter conditions than in summer conditions for compartments with shading, and it is lower in winter conditions than in summer conditions for compartments exposed to direct solar radiation. The consumption level is higher using the PMV control than with the aPMV control. Air temperature, in accordance with Portuguese standards, is higher than 20 °C in winter conditions and lower than 27 °C in summer conditions. In Mediterranean climates, the HVAC systems with aPMV control provide better occupants’ thermal comfort levels and less energy consumption than the HVAC system with PMV control.

1. Introduction

Large amounts of carbon dioxide are emitted to the atmosphere by transportation systems, energy production, industry, and buildings. Owing to the urgent need to reduce the ecological footprint of these activities, alternative solutions to the use of fossil fuels should be taken.
The solution involves two decisive factors, namely energy efficiency and the substitution of the use of polluting fossil energy sources by clean renewable energy sources such as the sun, wind, and biomass. Energy efficiency should be a concern of policy-makers and other players in the energy market, as well as of the technicians who design, accompany, implement, and maintain electrical and mechanical installations.
In buildings, Heating, Ventilation and Air Conditioning (HVAC) is the main energy-consuming equipment [1]. Thus, energy efficiency can be improved by reducing the energy consumption of already installed equipment, making its use more rational and achieving the thermal comfort for the occupants of the air-conditioned spaces. HVAC energy demand is directly related to the indoor temperature setpoint, air infiltration, incident solar radiation, window type, window-wall ratio, internal loads, building type and climate [2]. An adequate evaluation of the thermal performance of the building envelope is needed [3,4], because it will influence the thermal load of the air-conditioned compartments and, therefore, the HVAC performance. Indeed, the building envelope data (type of elements and their dimensions) is an important step in a building thermal behavior numerical simulation [5]. In this type of simulation, it is important to define the interior and external walls, floors, ceilings, transparent surfaces and other interior details characteristics, and the thermal conductivity, the thermal capacity, and the specific mass of the building envelope elements [5,6].
In Portugal, after reaching its highest peak in 2005, final energy consumption has steadily decreased in the last decade [7]. In 2015, the electrical energy consumption in the State buildings sector in Portugal represented 5.3% of the total National electrical energy consumption [8]. Typically, the energy consumption of HVAC systems corresponds to approximately 50% of the total energy consumption of a public service building, such as the University campus buildings employed in this work [7]. The increasing use of HVAC systems in this type of buildings also makes it increasingly important to use efficient control systems in order to ensure a compromise between the lowest possible energy consumption and the best possible level of thermal comfort. Therefore, designing HVAC control systems that have these goals has become an important area [9].
ISO 7730 defines thermal comfort as “the condition of the mind that expresses satisfaction with the thermal environment” [10]. In fact, the sensation of satisfaction is very subjective, and it can be described as a mental condition or state of mind, constructed by the individual from various extrinsic and intrinsic factors. The diversity of opinions and sensations is due to the subjectivity inherent in the reactions of each human being, who responds differently to similar stimuli, based on previous cultural experiences and habits, namely the habitual climate in which he/she lives, his/her physical constitution, his/her conditions of physical and psychological health at the moment, and the clothing used, among others.
Thermal comfort indexes have been developed over the years by several researchers. The most well-known is called PMV (Predicted Mean Vote). This index was developed by Fanger [11], and it was first included in ASHRAE standard 55 in 1981, also present in the 2013 revised version [12], and later on in ISO 7730 in 1994, also present in the 2005 revised version [10]. The PMV index is based on the thermal balance of the human body with the environment that surrounds it, being therefore a so-called rational approach to the concept of thermal comfort. According to Fanger and ISO 7730 standard, the predicted mean vote is the expected average of the values voted by a large group of people exposed to the same environmental space, with similar activity and clothing [10,11]. ASHRAE created a scale to be used in surveys, in which occupants of the spaces choose an integer value (vote) between −3 and +3. Zero means that the person feels comfortable, in thermal equilibrium with the environment, negative values correspond to cold thermal discomfort sensations, and positive values correspond to hot thermal discomfort sensations, according to the seven-point thermal sensation scale: −3, cold; −2, cool; −1, slightly cool; 0, neutral; +1, slightly warm; +2, warm; +3, hot [10]. The equations used to calculate the PMV index, according to a set of parameters, are presented in ISO 7730. There are six parameters, four of them environmental parameters (air temperature, mean radiant temperature, air humidity and air velocity) and two personal parameters (metabolic rate and clothing insulation) [
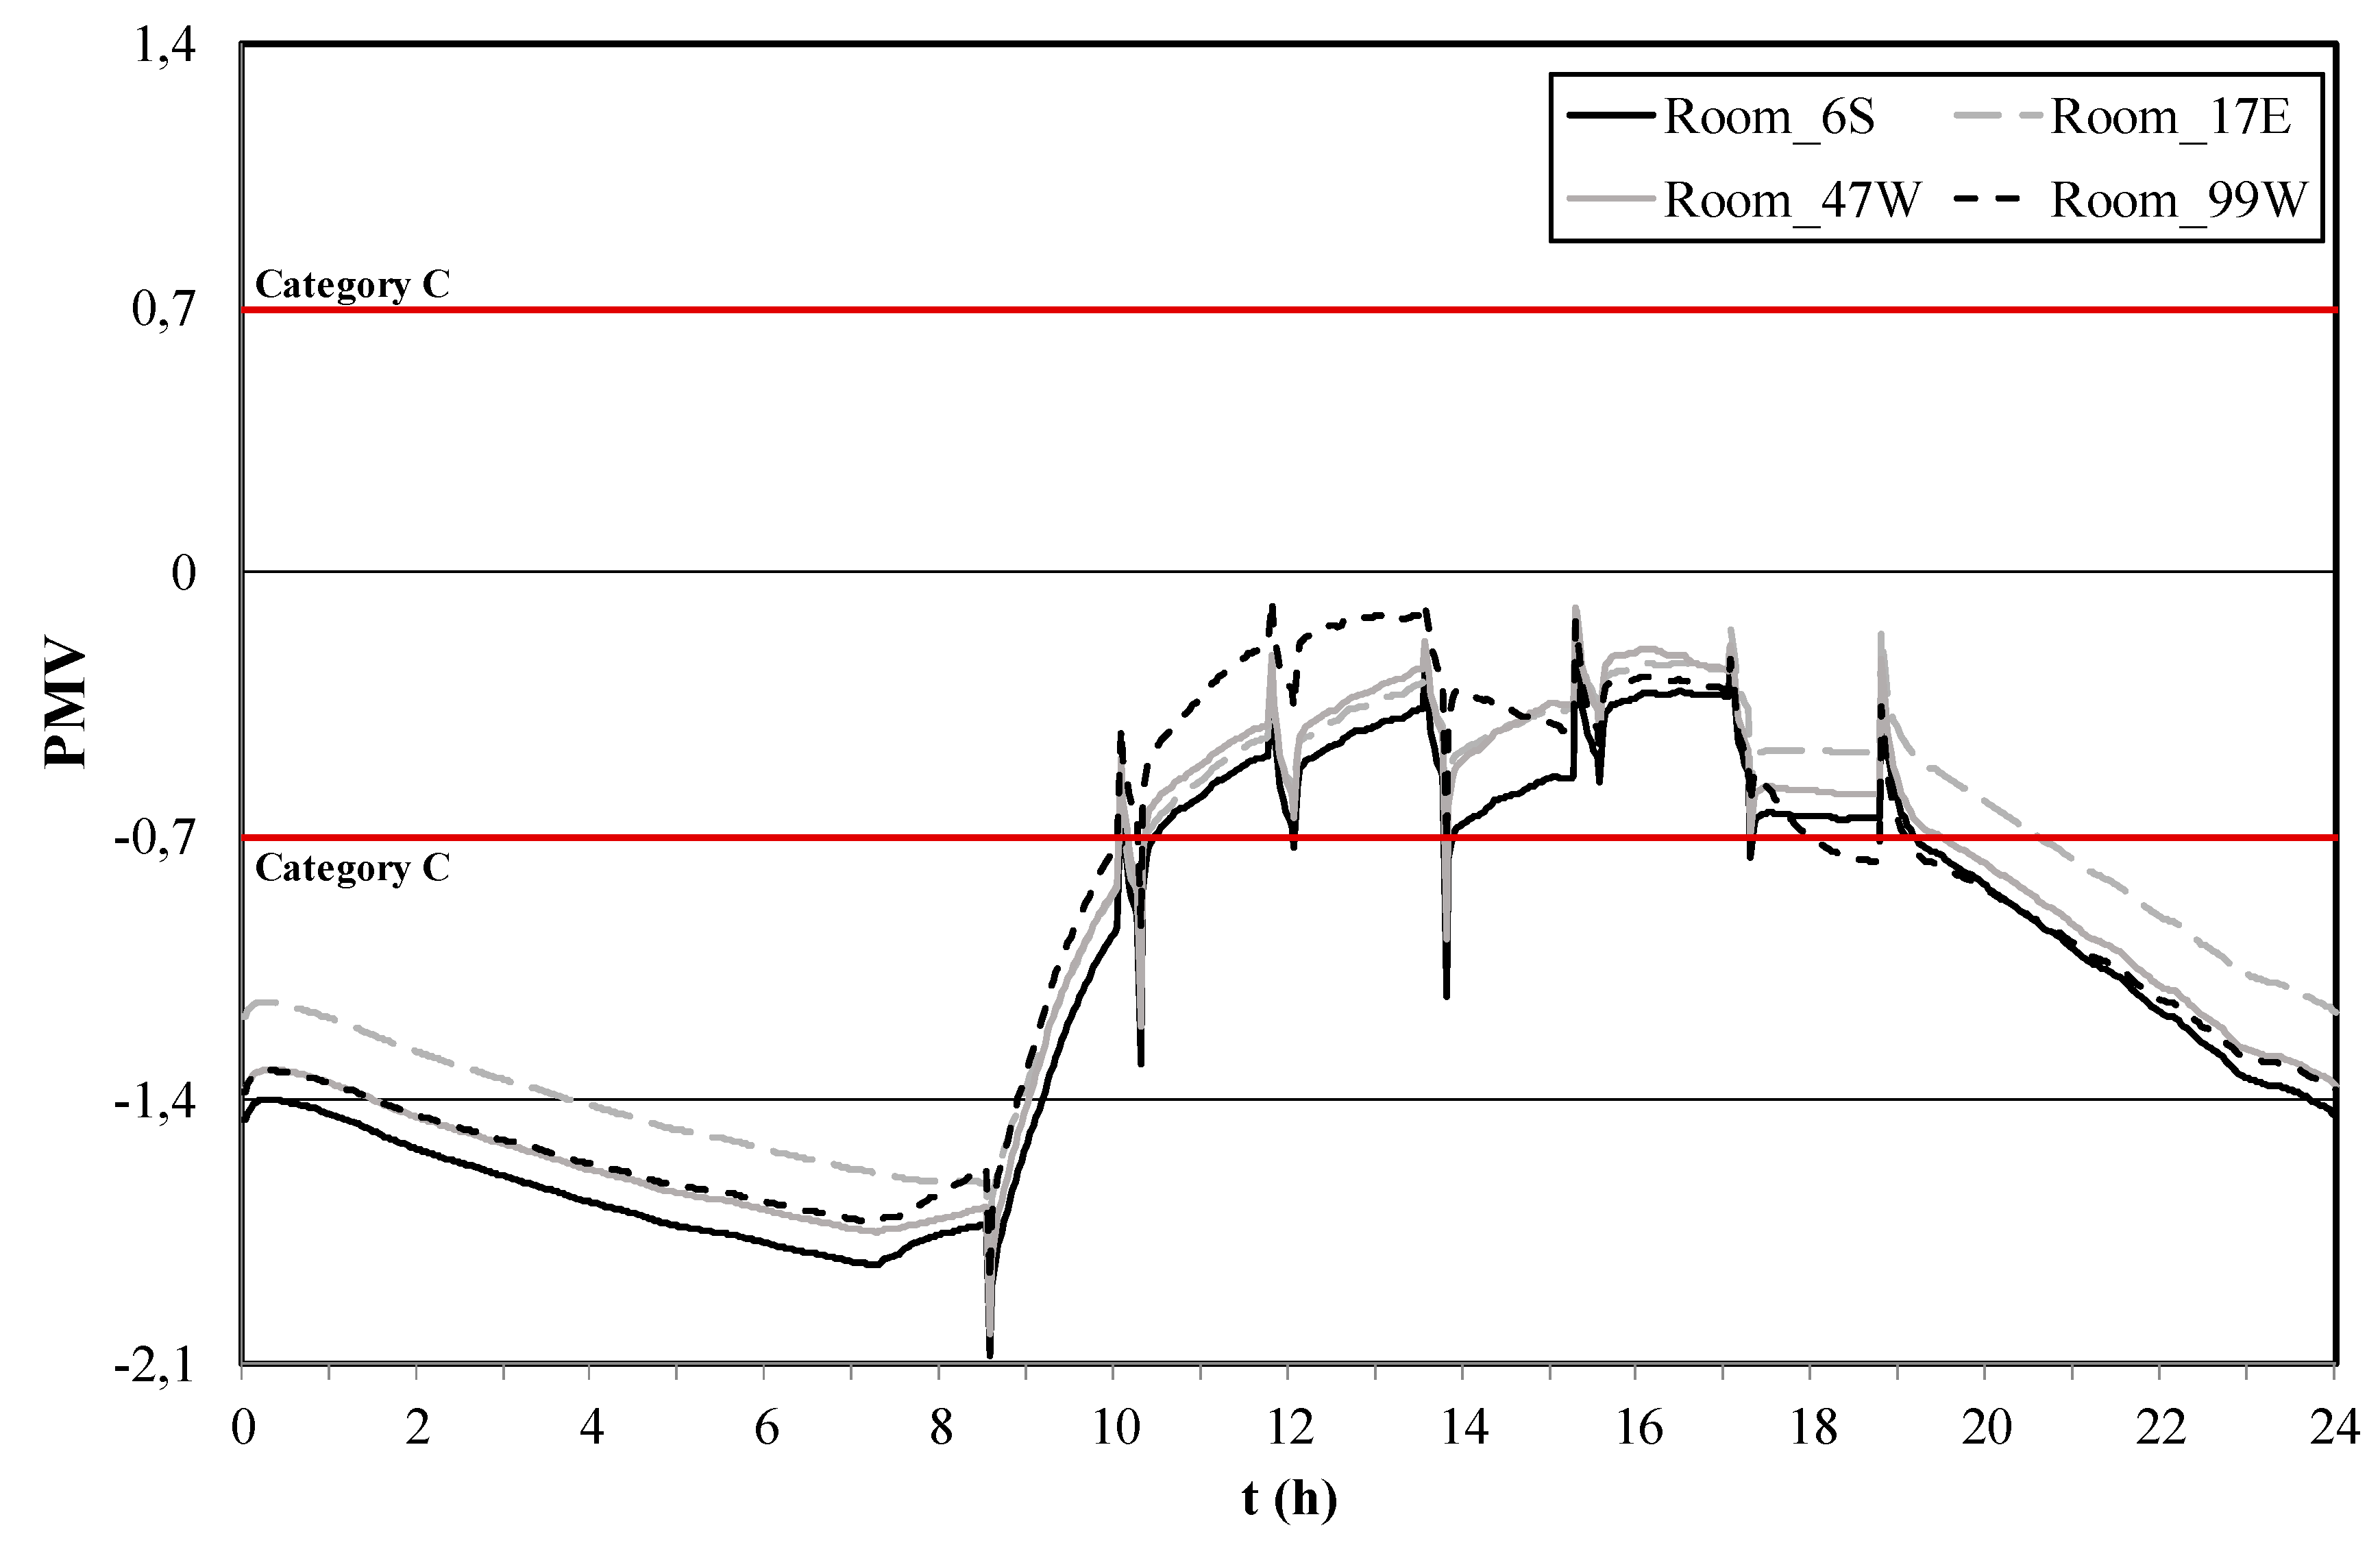
10]. The PMV index was adopted as a standard of thermal comfort by ASHRAE, which elaborated comfort requirements for the occupied spaces, creating three comfort categories, category A (−0.2 ≤ PMV ≤ +0.2), category B (−0.5 ≤ PMV ≤ +0.5) and category C(−0.7 ≤ PMV ≤ +0.7) [10,12].
The use of the PMV index in the study of human thermal comfort revealed some shortcomings in its practical application. The thermal balance model overestimates the occupants’ responses under high temperature conditions, and underestimates them in low temperatures [13]. Consequently, different thermal comfort models, named adaptive models, were developed. These adaptive models are based on field studies, while the thermal balance model was based on laboratory studies [14]. The concept of adaptive thermal comfort is based on the principle that when changes occur in environmental conditions that generate thermal discomfort, people react psychologically, physiologically or through behavioral changes in order to restore their comfort (please see [13,15,16,17]). In Yao et al. [18], the authors developed a theoretical model of thermal comfort, which they called the Adaptive Predicted Mean Vote (aPMV) model. This model is based simultaneously on non-psychological and psychological factors. They proposed an adaptive coefficient that reflects the psychological, physiological, and behavioral human adaptations to the individual perception of indoor thermal comfort evolution. The aPMV model and its development and theoretical foundation are presented in detail in Yao et al. [18].
Following this work, other approaches were developed where this model was applied in practical cases, or in which new adaptive coefficients were proposed. For example, in Singh et al. [19], an adaptive thermal comfort model that considers both the season and the climate zone where the building is built is developed. In Conceição et al. [20], an adaptive thermal comfort model is applied to evaluate the thermal comfort of classrooms in a school, in winter and summer conditions. This model was experimentally developed using simultaneous indoor and outdoor environmental parameter monitoring and a questionnaire survey during typical summer, mid-season and winter days of a year. The indoor environmental variables (air temperature, air relative humidity and mean radiant temperature) and the outdoor air temperature were measured by sensors. The questionnaire survey was used to obtain the thermal sensation responses of the occupants accordingly to climate variations and their adaptation to it. The difference between the thermal responses of the occupants and those obtained by the Fanger model can calculate the adaptive coefficient. The results obtained show a relation between the adaptive coefficient and the outdoor temperature, thus a dependence of the type of climate where this coefficient was experimentally obtained. Comparing the results obtained with the PMV index with the results obtained with the aPMV index, it is shown the aPMV extends the comfort range 9% on average. In Conceição et al. [14] another adaptive thermal comfort model is developed, where its adaptive coefficient also depends on outdoor temperature. The results obtained allow to conclude that the developed model ensures that the classrooms analyzed have good thermal comfort levels. Other researchers have also developed, analyzed, and applied this new adaptive thermal comfort concept. For more details, please see papers [21,22,23].
Current HVAC control systems can be divided into two types: air temperature regulator (ATR) and thermal comfort regulator (TCR). Most TCR controllers use as a performance criterion the PMV comfort index, or the effective temperature. When it is desired to simultaneously control energy consumption and maintain thermal comfort and indoor air quality within the values considered adequate by the standards, the operation of the HVAC system control becomes complex [24]. In the optimization of HVAC control systems, different strategies have been used. In Afroz et al. [25] a rather extensive review of the modeling techniques is presented, proposed in the last 10–15 years, used to improve the HVAC systems control strategies. In this study, the weaknesses, strengths, applications, and performances of these modeling techniques are discussed. During the last decade, HVAC control systems modeling techniques have become more complex, taking into account, simultaneously occupants’ thermal comfort, indoor air quality, regulatory requirements, and energy savings. This kind of research is not usually found in the literature, because developing an effective and accurate model to represent reality becomes a huge challenge for researchers [25]. Another perspective in the literature is the absence of rigorous simulation tools to perform complex topology buildings energy calculations, making it possible to design and compare several HVAC control strategies [26]. There is also a lack of information in literature on the simulation of the thermal behavior of complex buildings with a large number of air-conditioned spaces, as in the public building presented in this study. Homod et al. [6] proposed a HVAC control system based in a Takagi-Sugeno PMV fuzzy model which is tuned by Gauss-Newton nonlinear regression algorithm. Their main conclusions are the possibility of directly control the thermal sensation of the conditioned space, and indirectly control associated variables like air temperature and air relative humidity. Ferreira et al. [27] proposed an artificial neural network to estimate the PMV index more efficiently, used as a restriction in a predictive control scheme. The obtained models show good input variables estimation accuracy and ensure good levels of comfort in conditioned spaces with energy consumption savings. This approach was refined in [28], minimizing not the electricity but its price, employing schedules, and incorporating self-powered wireless sensors [29] and an intelligent weather station [30] in the hardware. In Ku et al. [31], a study with a wireless sensor network using PMV as a variable to be controlled is presented. The used control model is based on an adaptive neurofuzzy inference system and a particle swarm algorithm. The experimental results obtained in this study shows the effectiveness of the control methods used, while keeping the PMV value within the expected range, and energy savings of more than 30%. Xu et al. [32] developed a computationally efficient PMV model approximation and a “model-based periodic event-triggered mechanism (ETM)” in order to optimize the handling of the uncertainties of the building operation. In Conceição et al. [24], a numerical simulation of the performance of an HVAC system control based on the PMV index, applied in a building with complex topology is developed. In that study, the thermal comfort of the building’s occupants and the HVAC energy consumption are evaluated. The application of the proposed control technique guarantees, simultaneously, good thermal comfort performance and energy savings.
In recent years, research that intends to improve, simultaneously, the energy efficiency of HVAC systems, occupants’ thermal comfort and indoor air quality has been developed. In 2009, Guo and Zhou [33] found that the use of better system operation and control algorithms will allow HVAC systems to be operated in an energy saving mode, as well as providing good thermal comfort and air quality levels to occupants, according to standardization requirements. Moon and Jung [34] developed a control algorithm that consists of two artificial neural network based predictive and adaptive models, that shows an improvement in building thermal comfort and energy efficiency, in the cooling season. Homod [35] developed a novel control algorithm based on the Takagi-Sugeno-Kang Fuzzy inference strategy. Its performance was tested, and the obtained results showed an improvement in indoor thermal comfort, as well a significant energy consumption reduction. Schirrer et al. [36] presents a nonlinear modular model predictive optimal control that simultaneously controls the heating and cooling of the spaces in a low-energy office building. The results showed that thermal comfort for the user and building energy efficiency are achieved with excellent control performance and robustness.
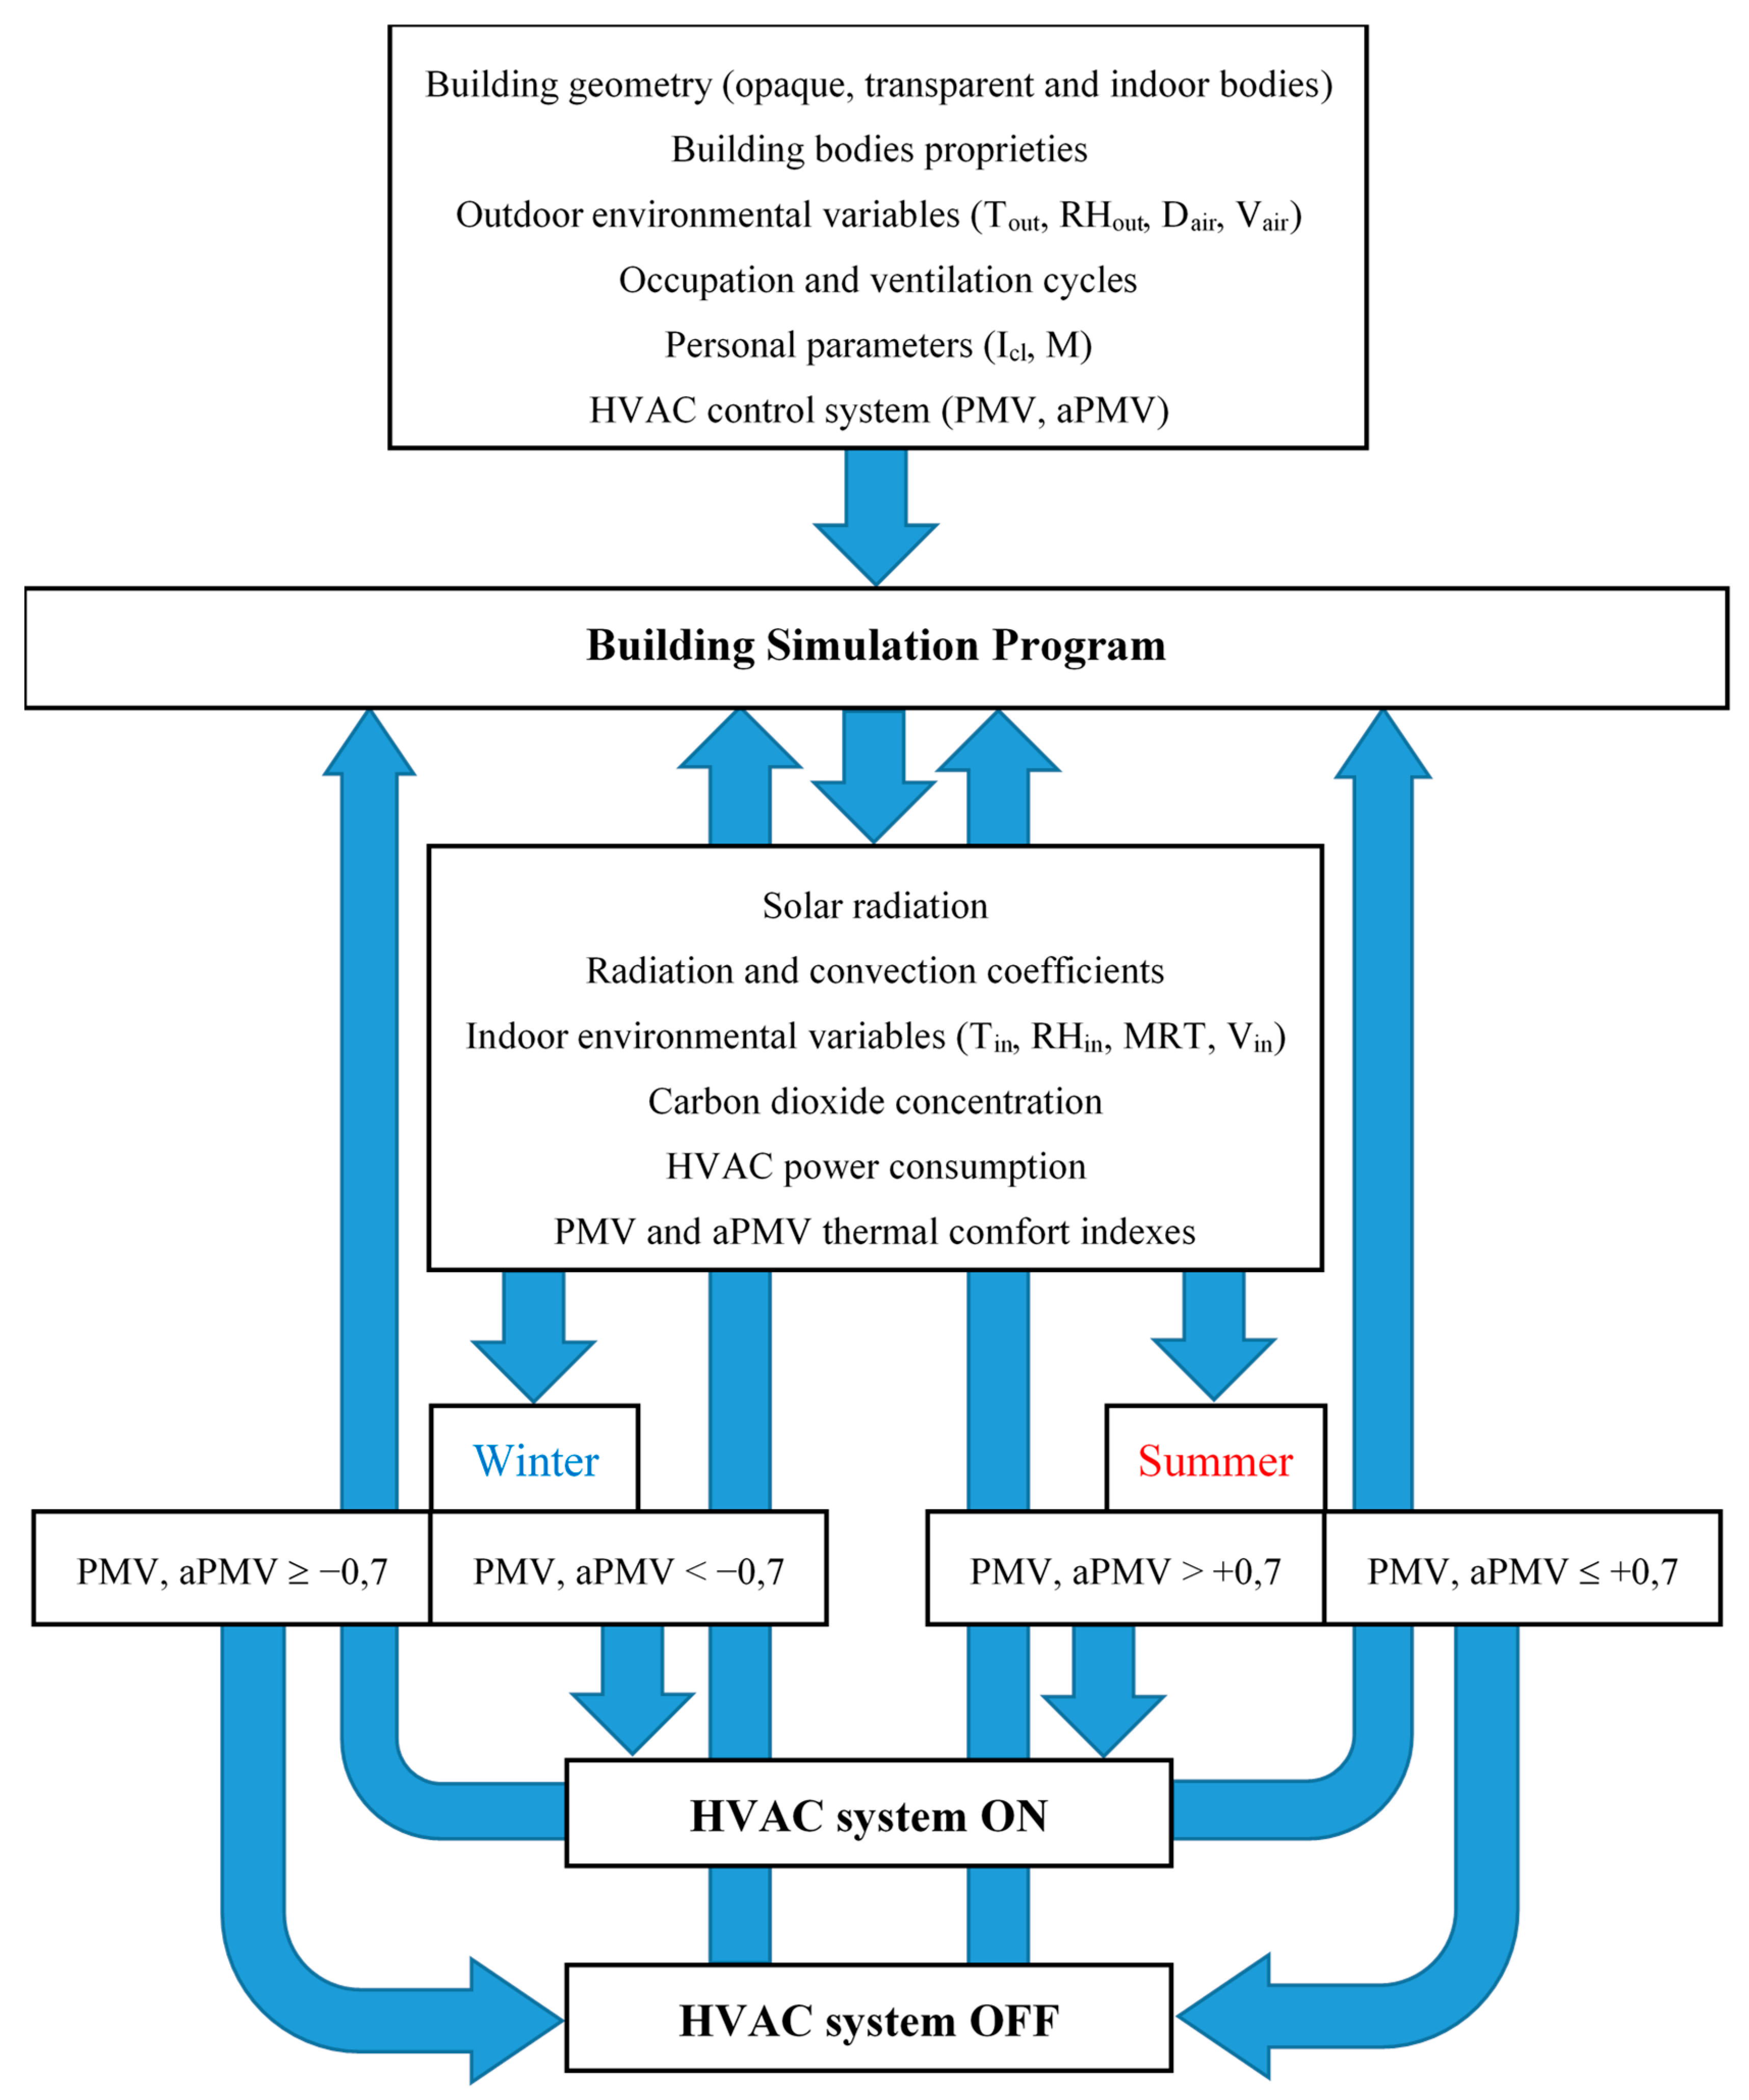
The aim of this work is to develop a new type of HVAC control system based on aPMV index and evaluate its performance numerically, by comparing it with the more usual HVAC control system based on PMV index. In this work, the comparison with the most widely used indoor air temperature control is not done, because thermal comfort also depends on other variables, rather than air temperature. The purpose of this new control system is to obtain simultaneously good human thermal comfort levels and energy savings, in a real public building. The inputs of this system are the indoor air temperature, indoor air relative humidity, mean radiant temperature, indoor air velocity, and outdoor air temperature, among other variables.
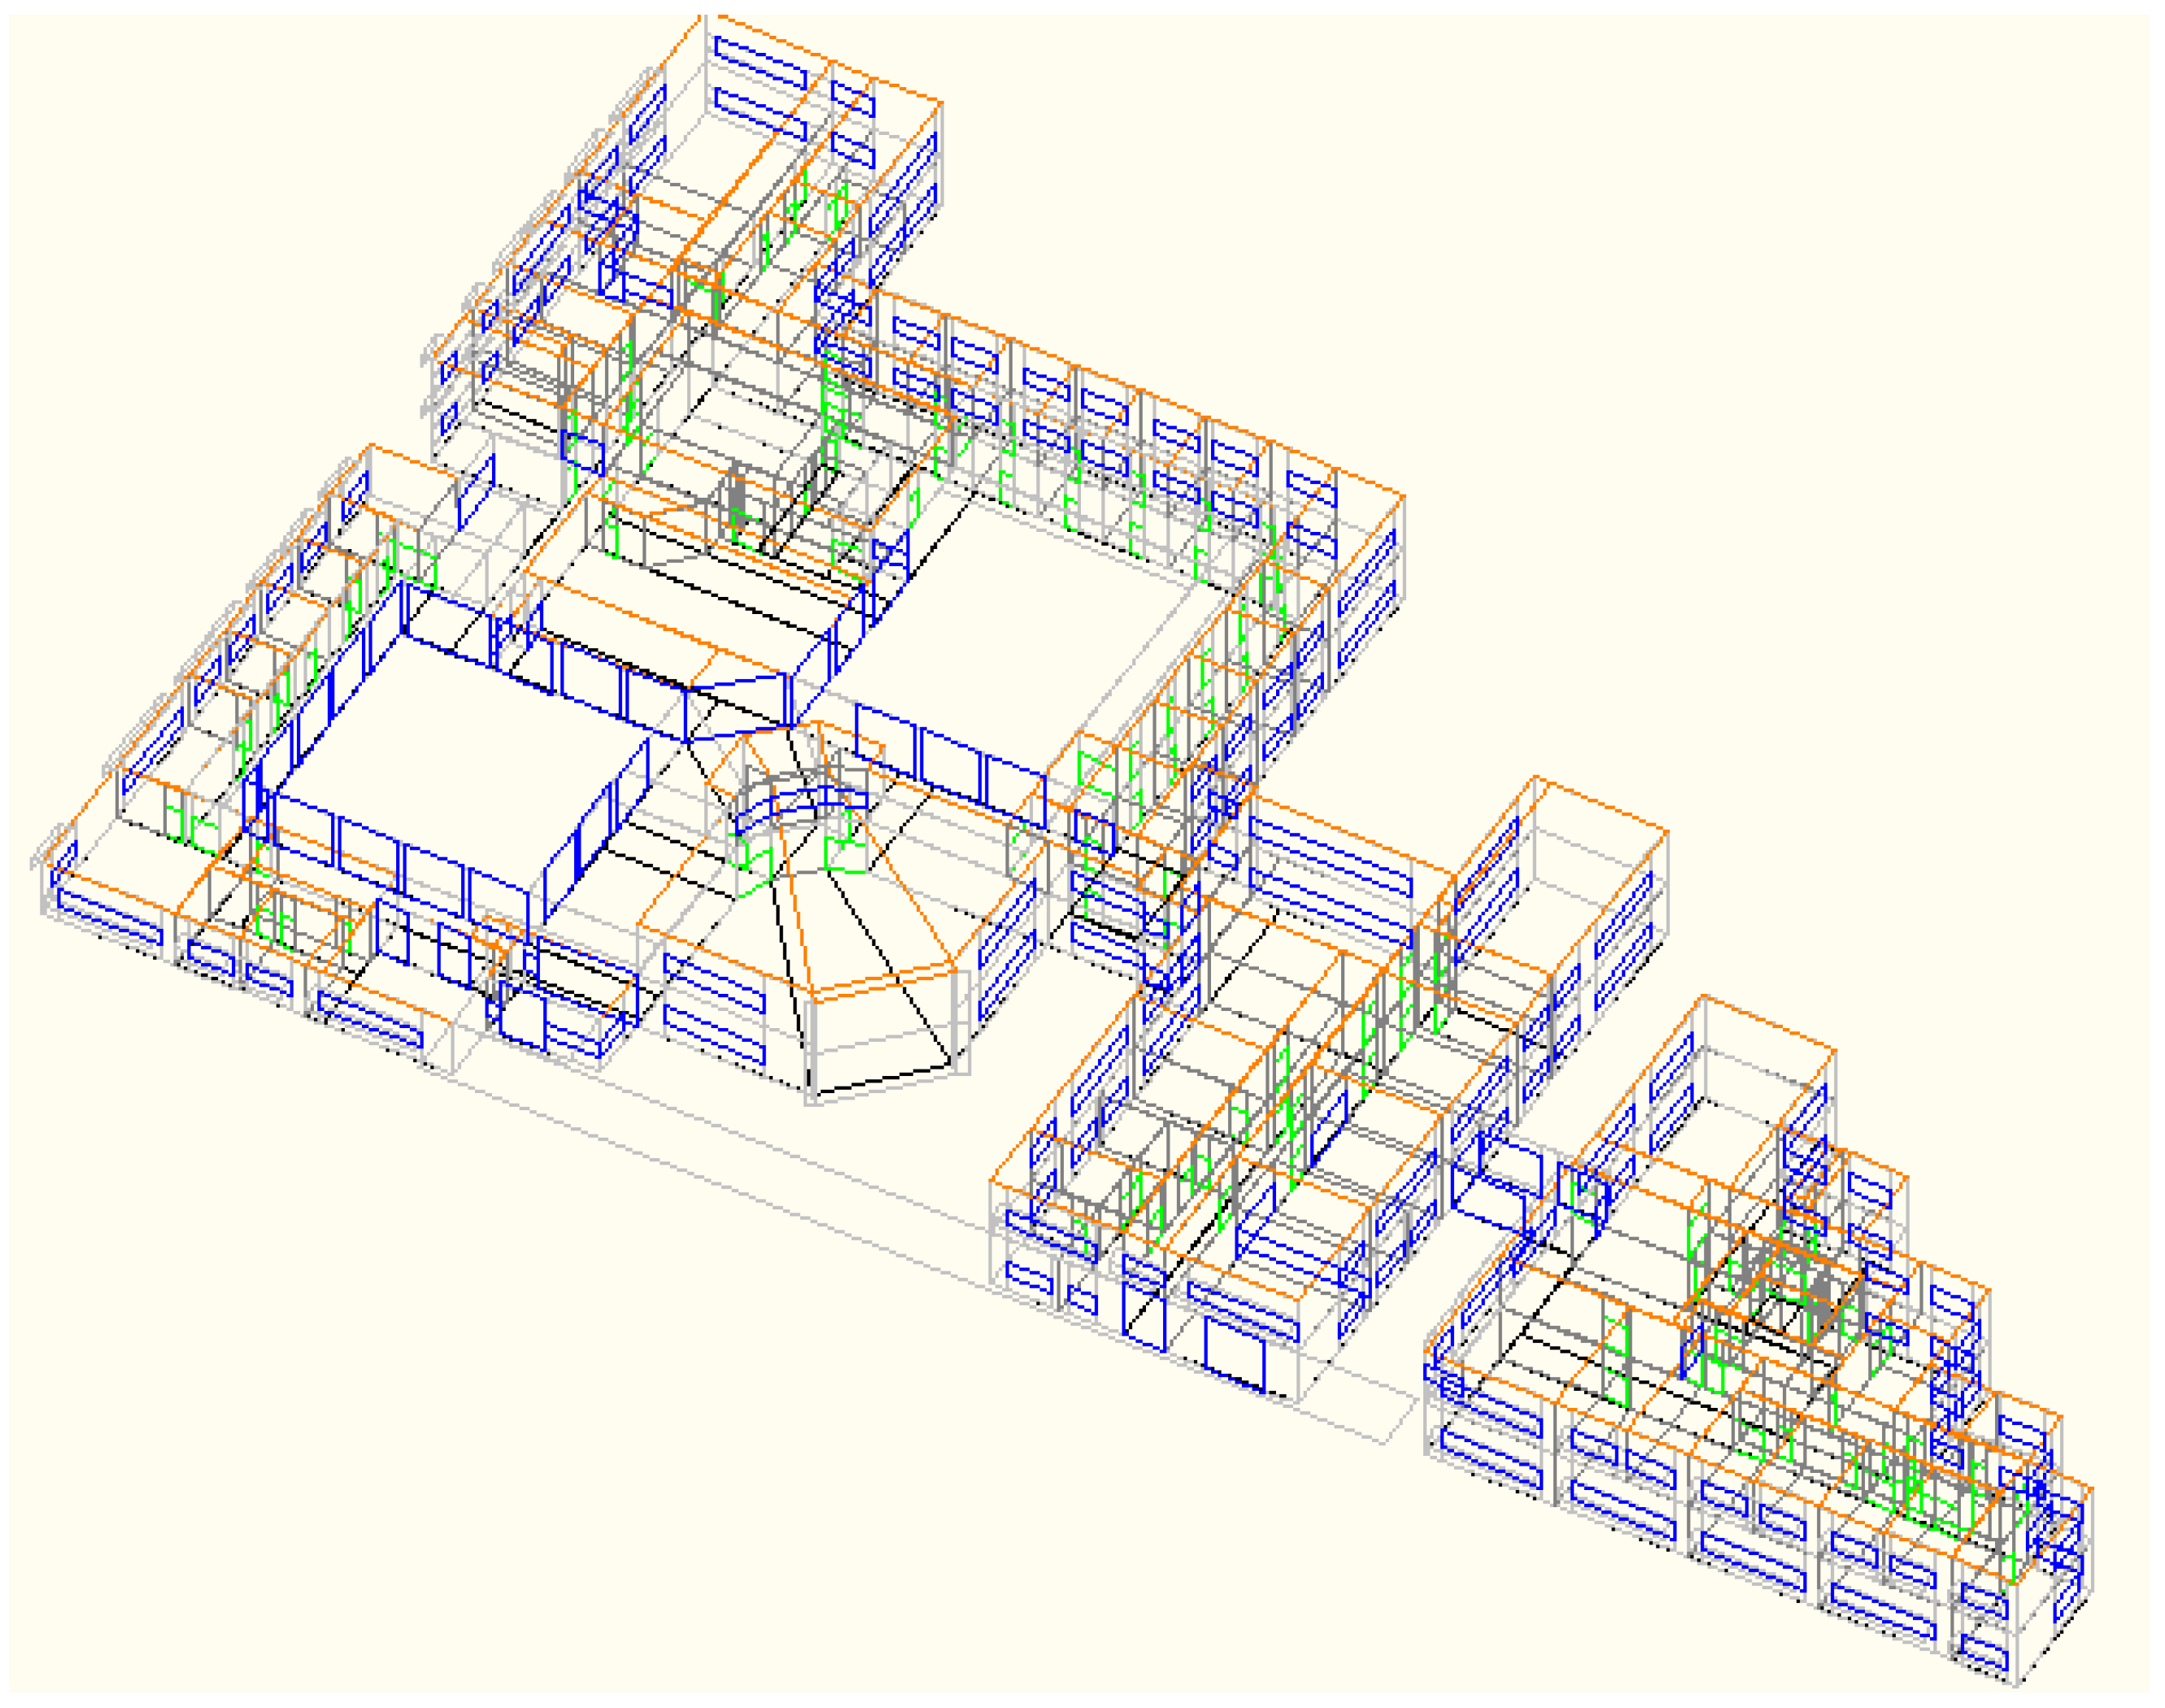
In this work, HVAC systems commonly applied in University buildings with control based on PMV and aPMV indexes are used. A numerical simulation is performed by software that simulates the building’s thermal behavior with complex topology, in transient thermal conditions, for summer and winter conditions. This is discussed in 
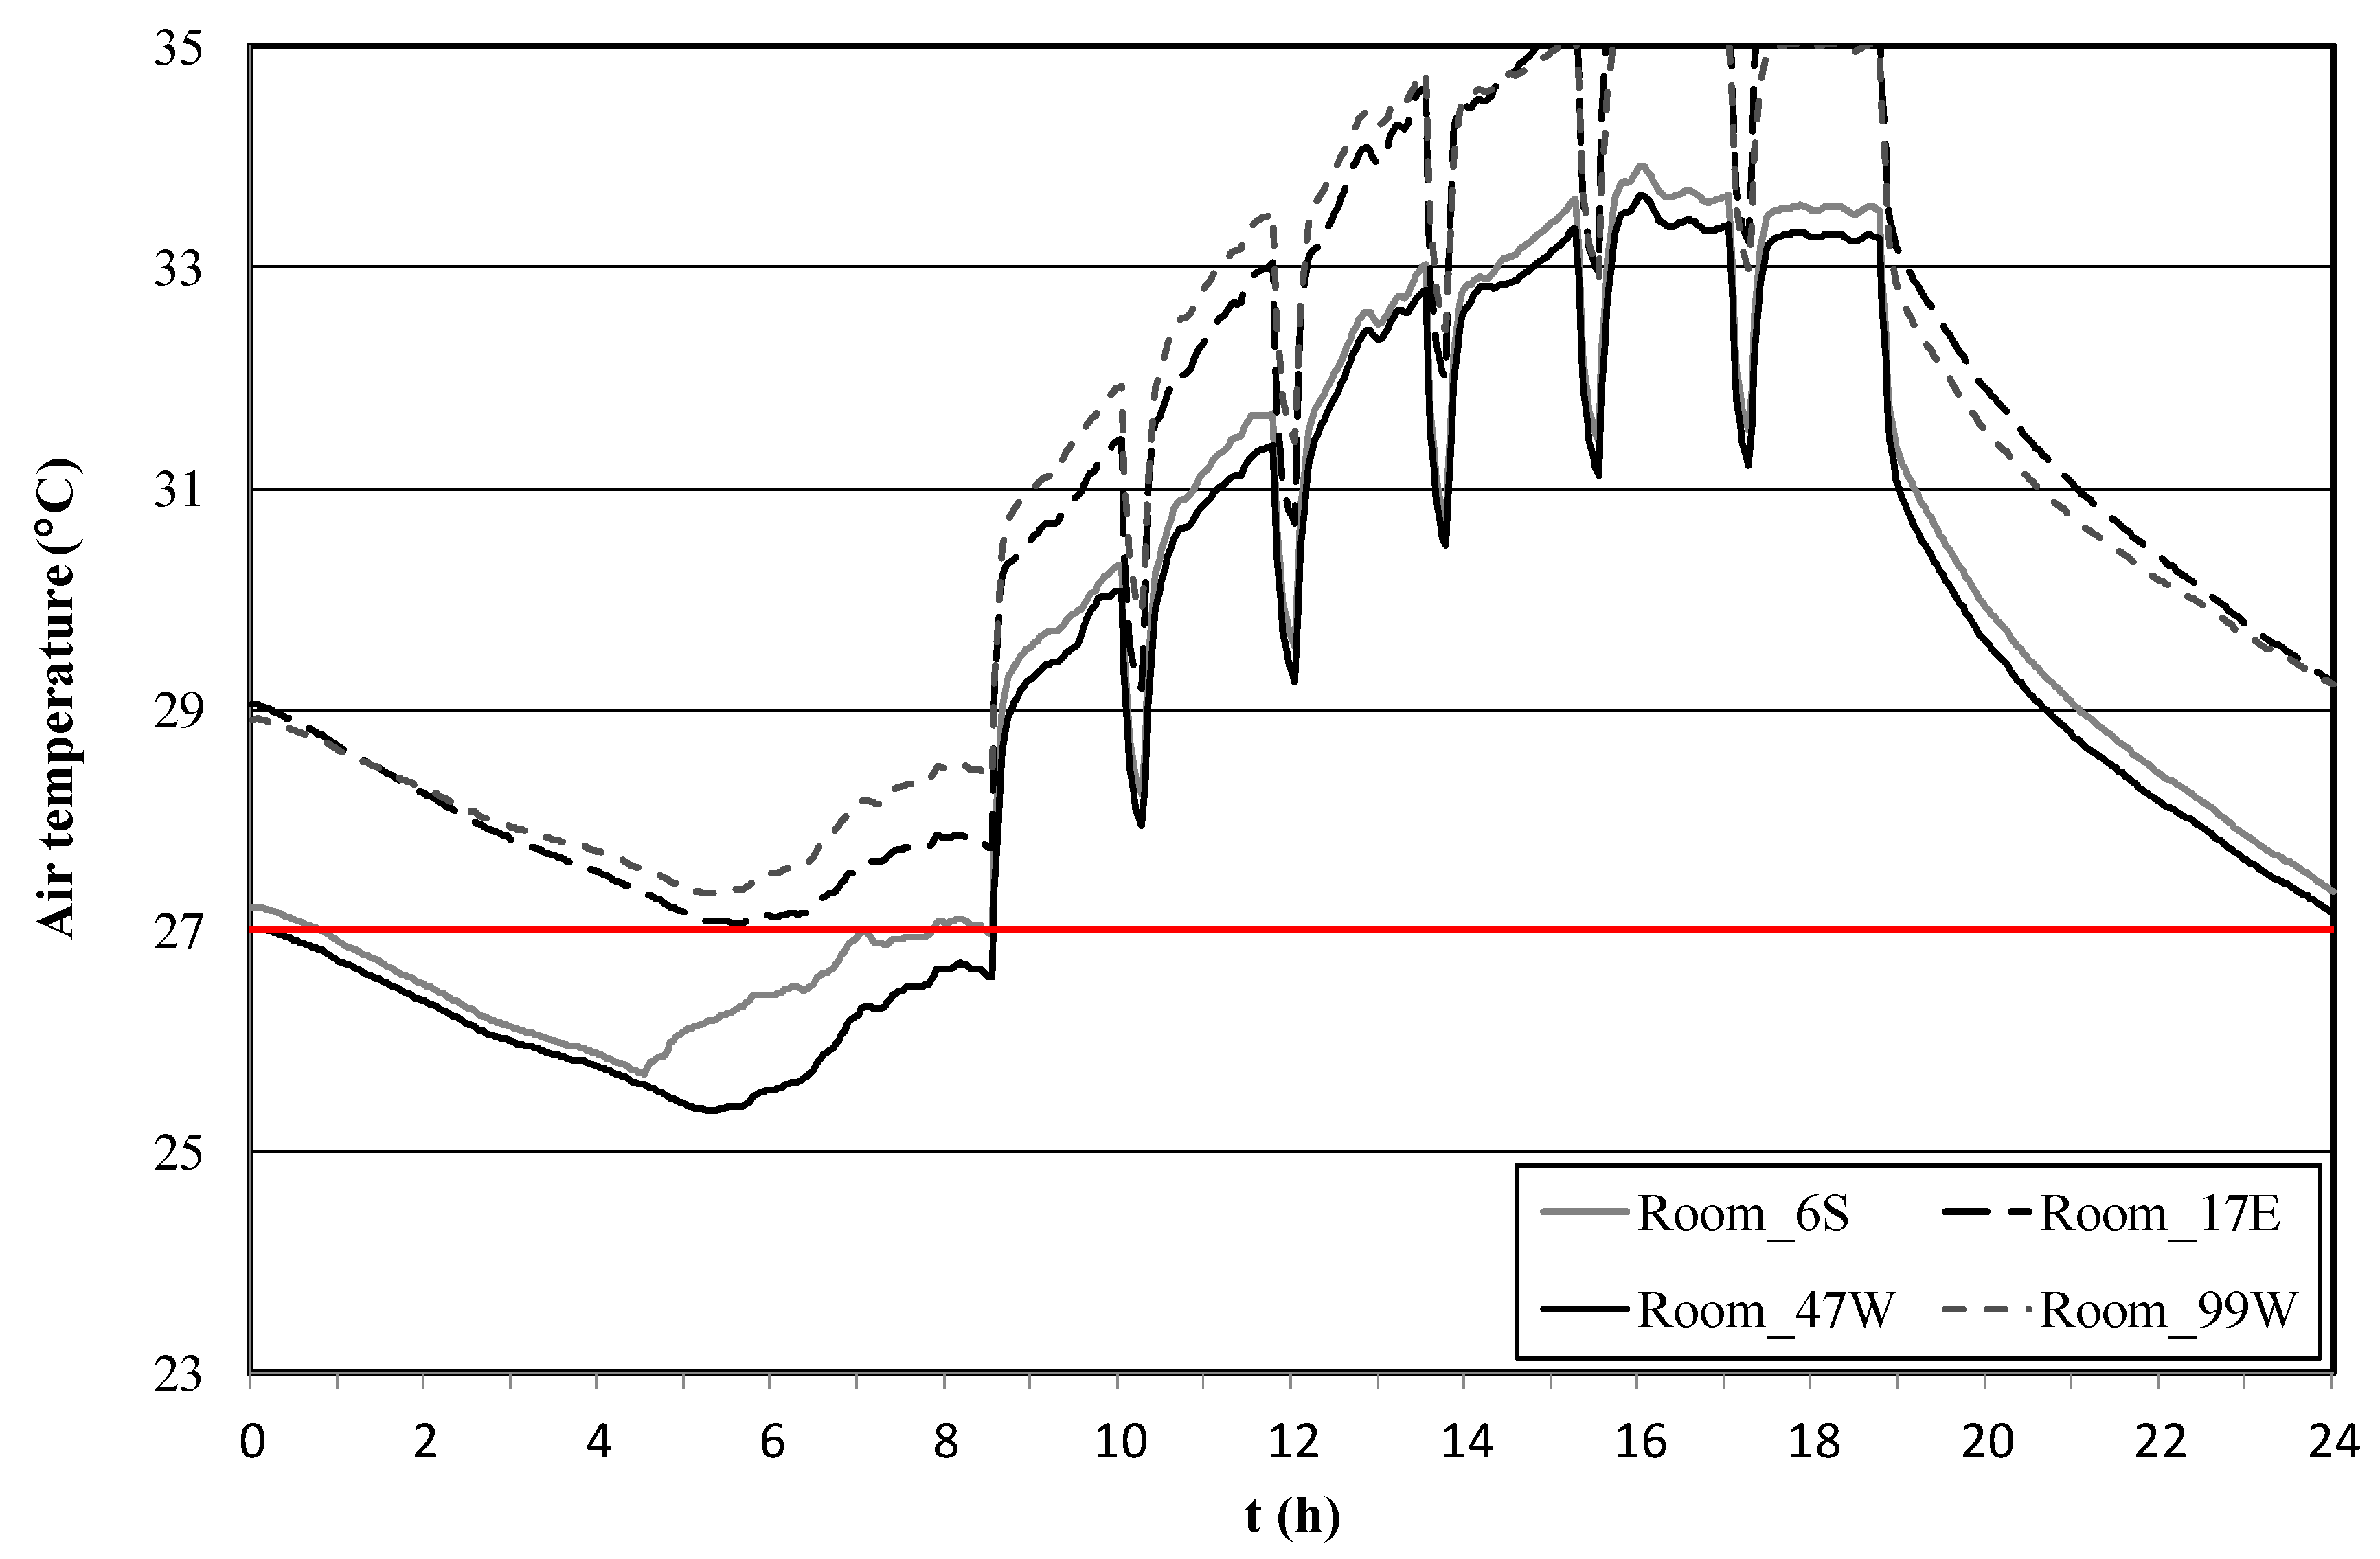
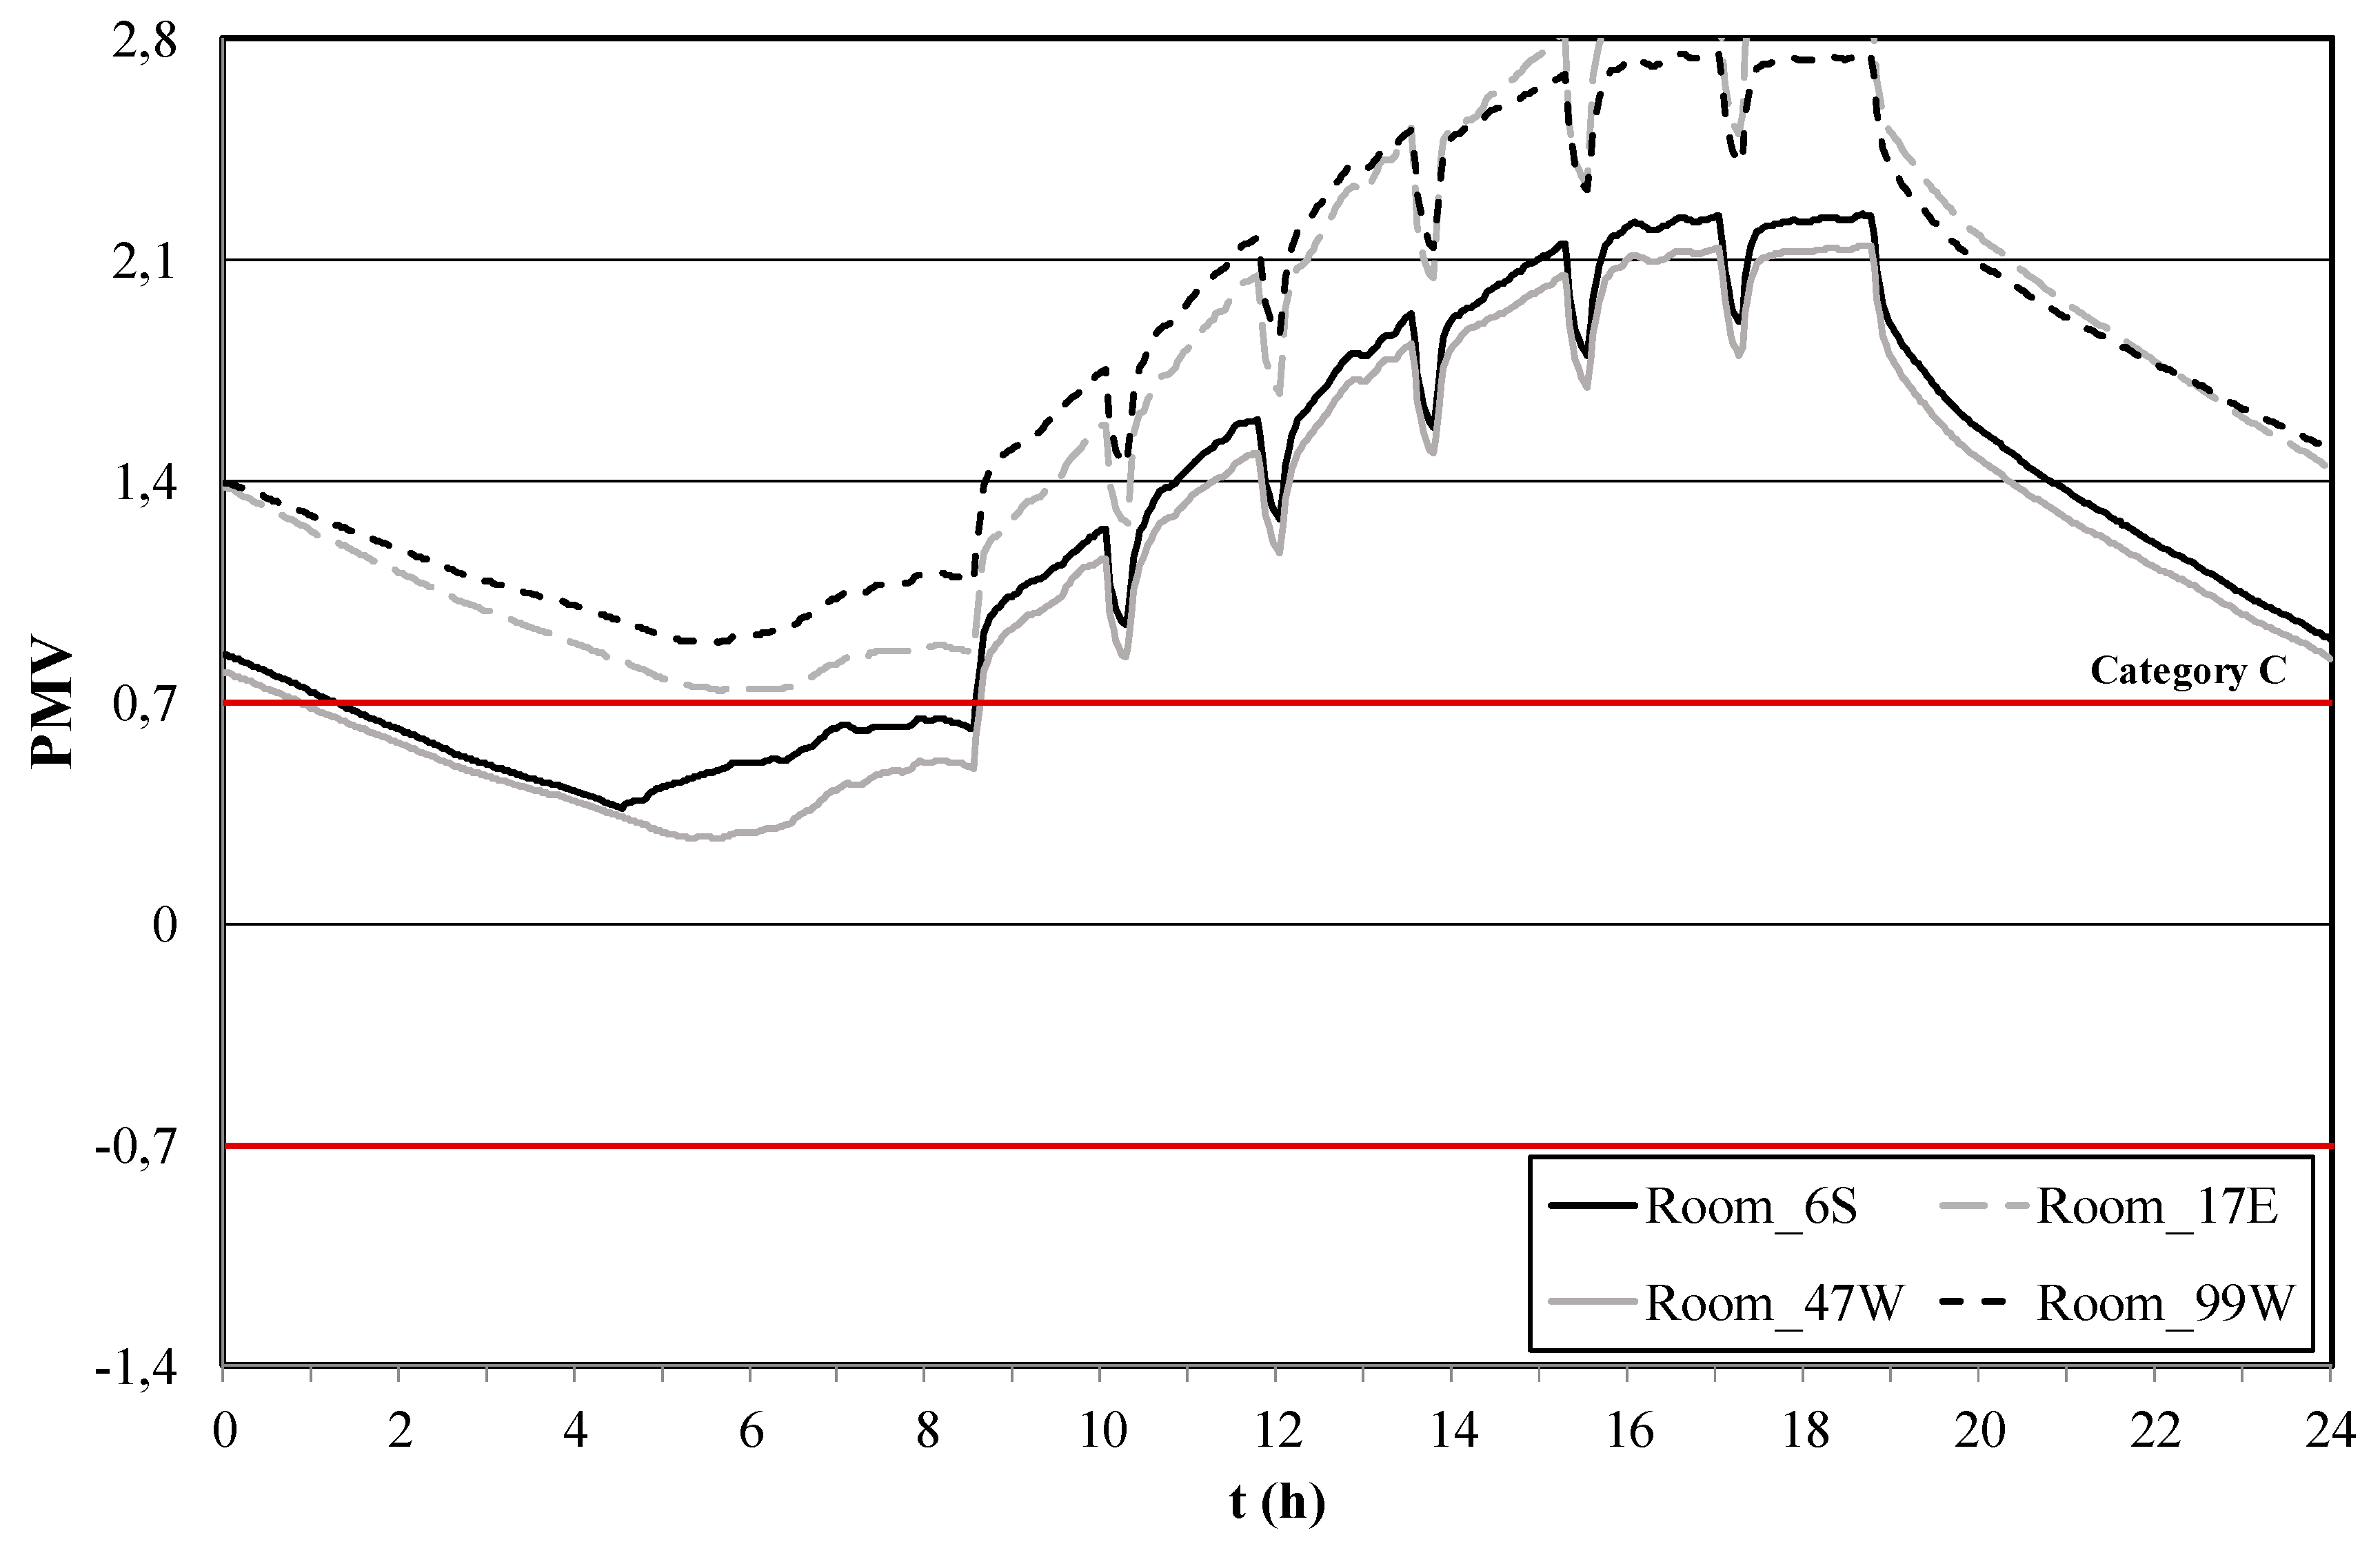
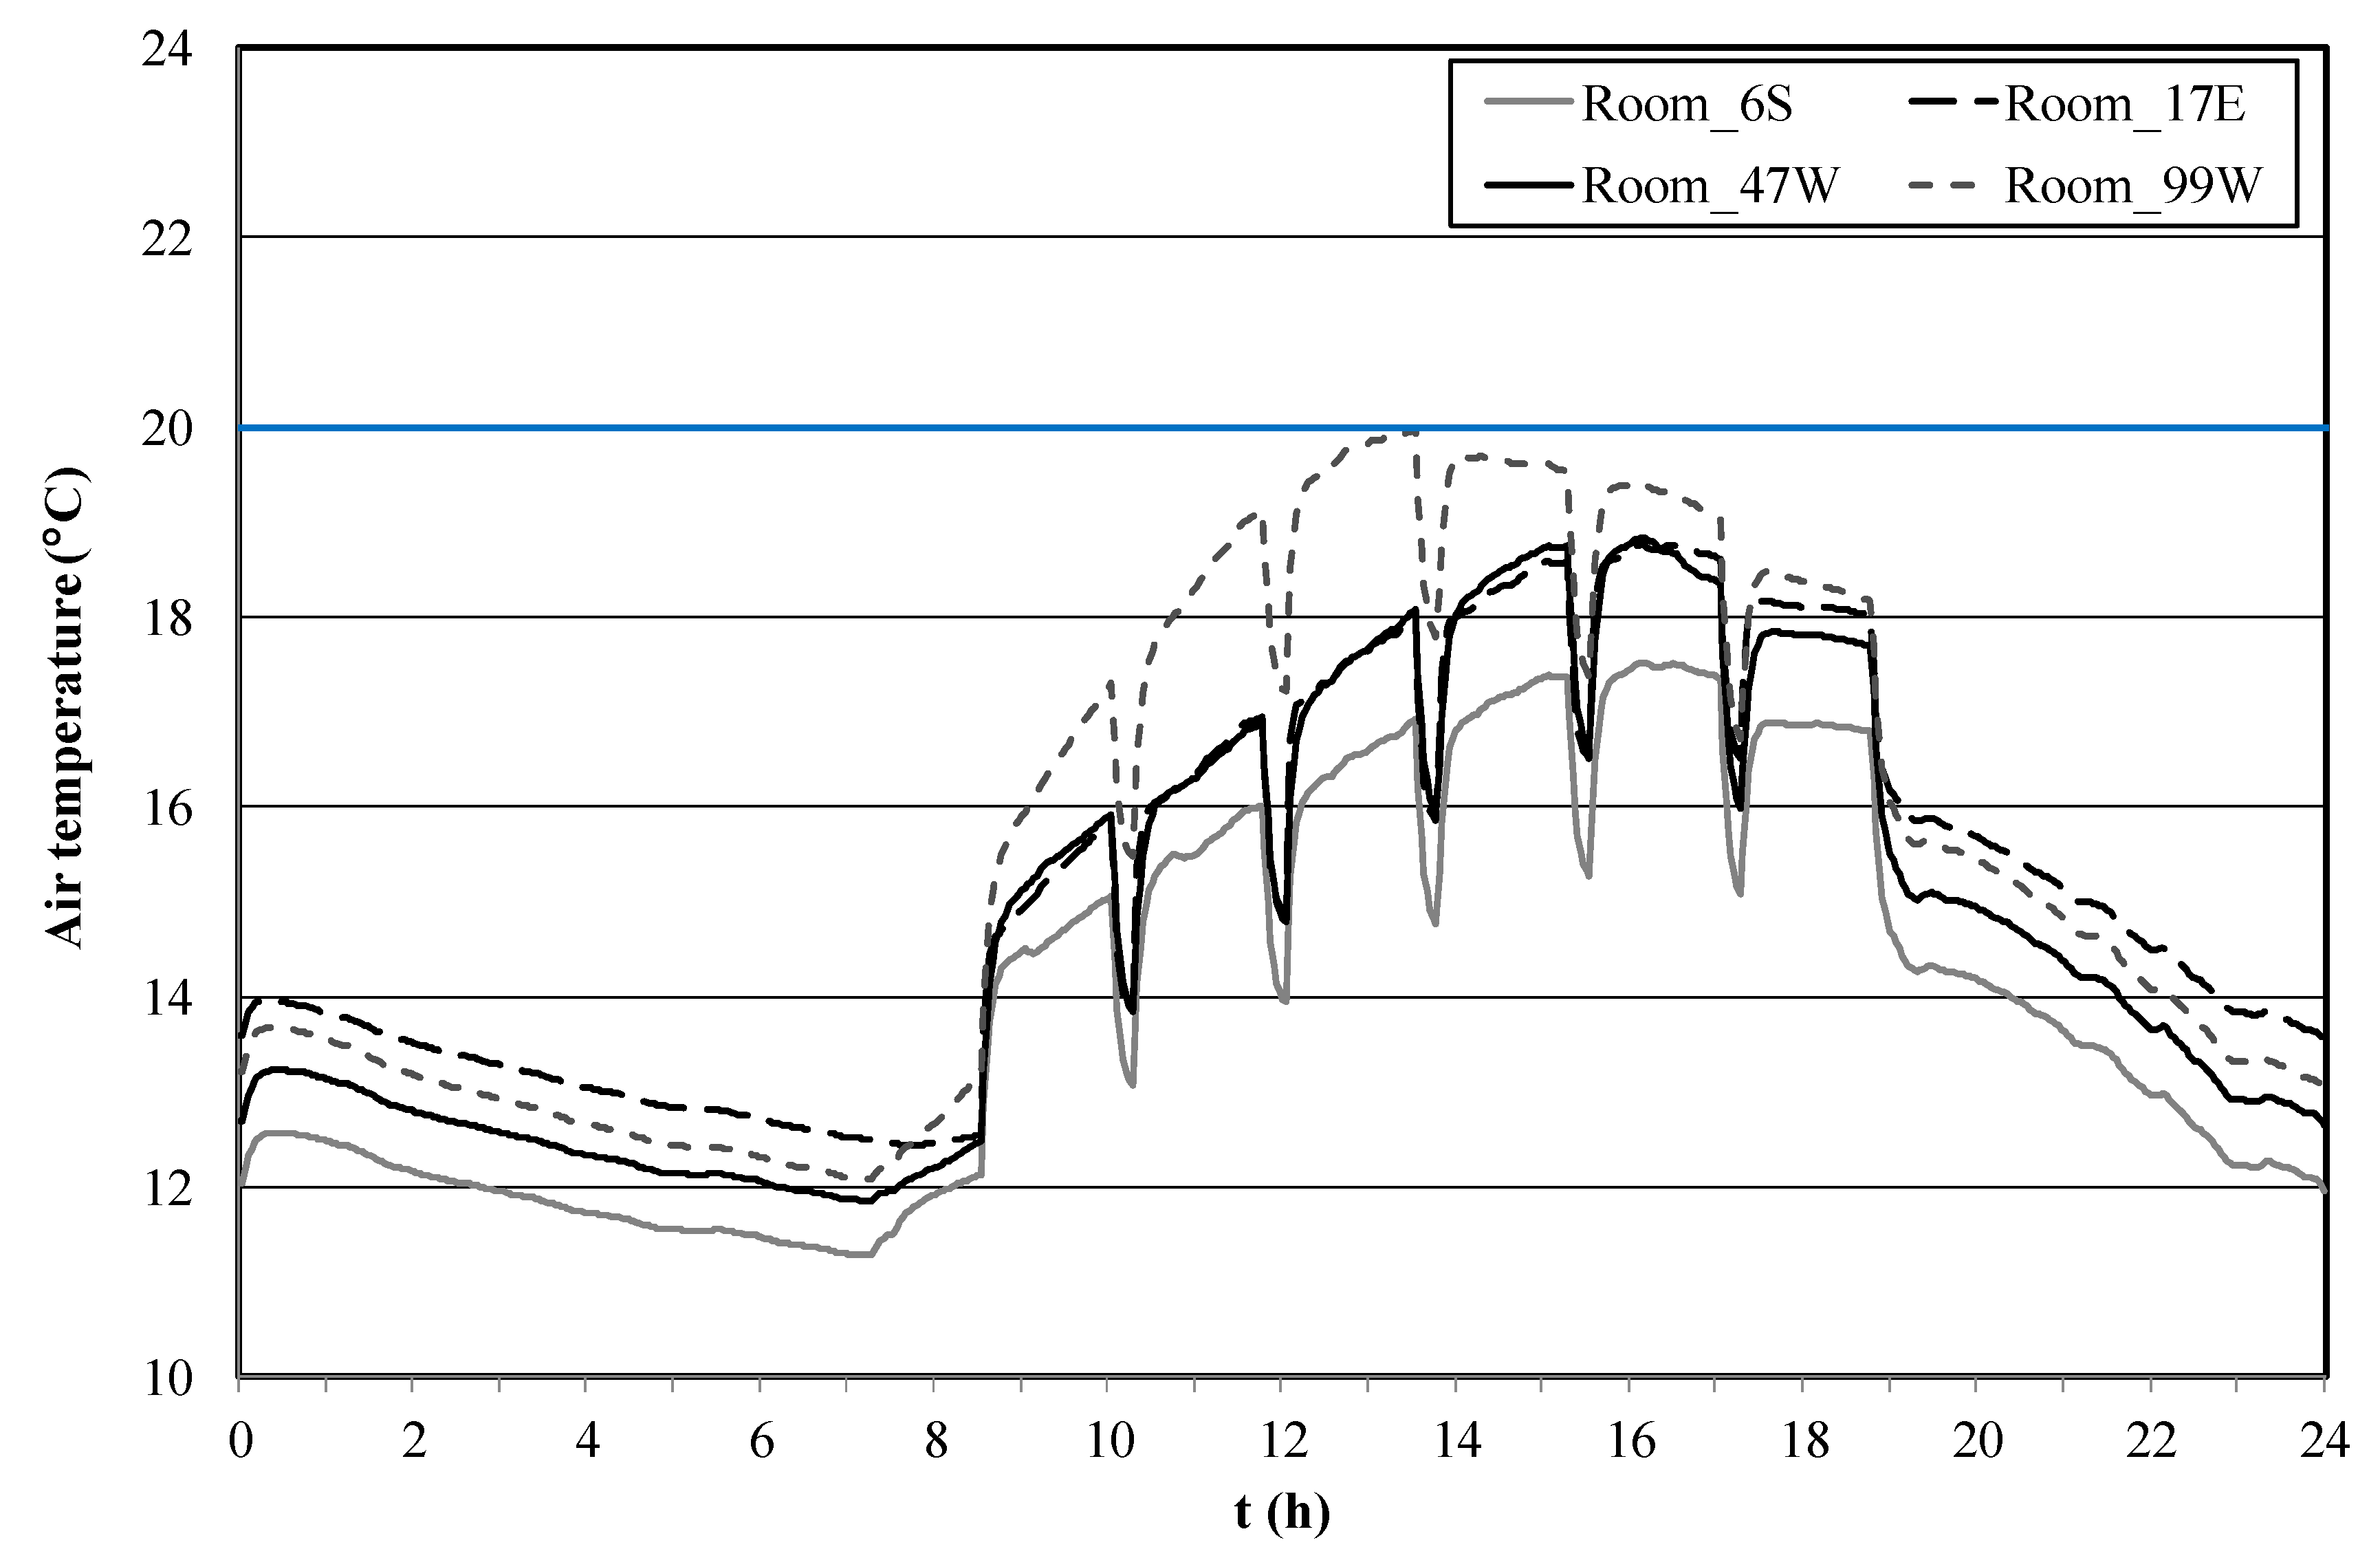
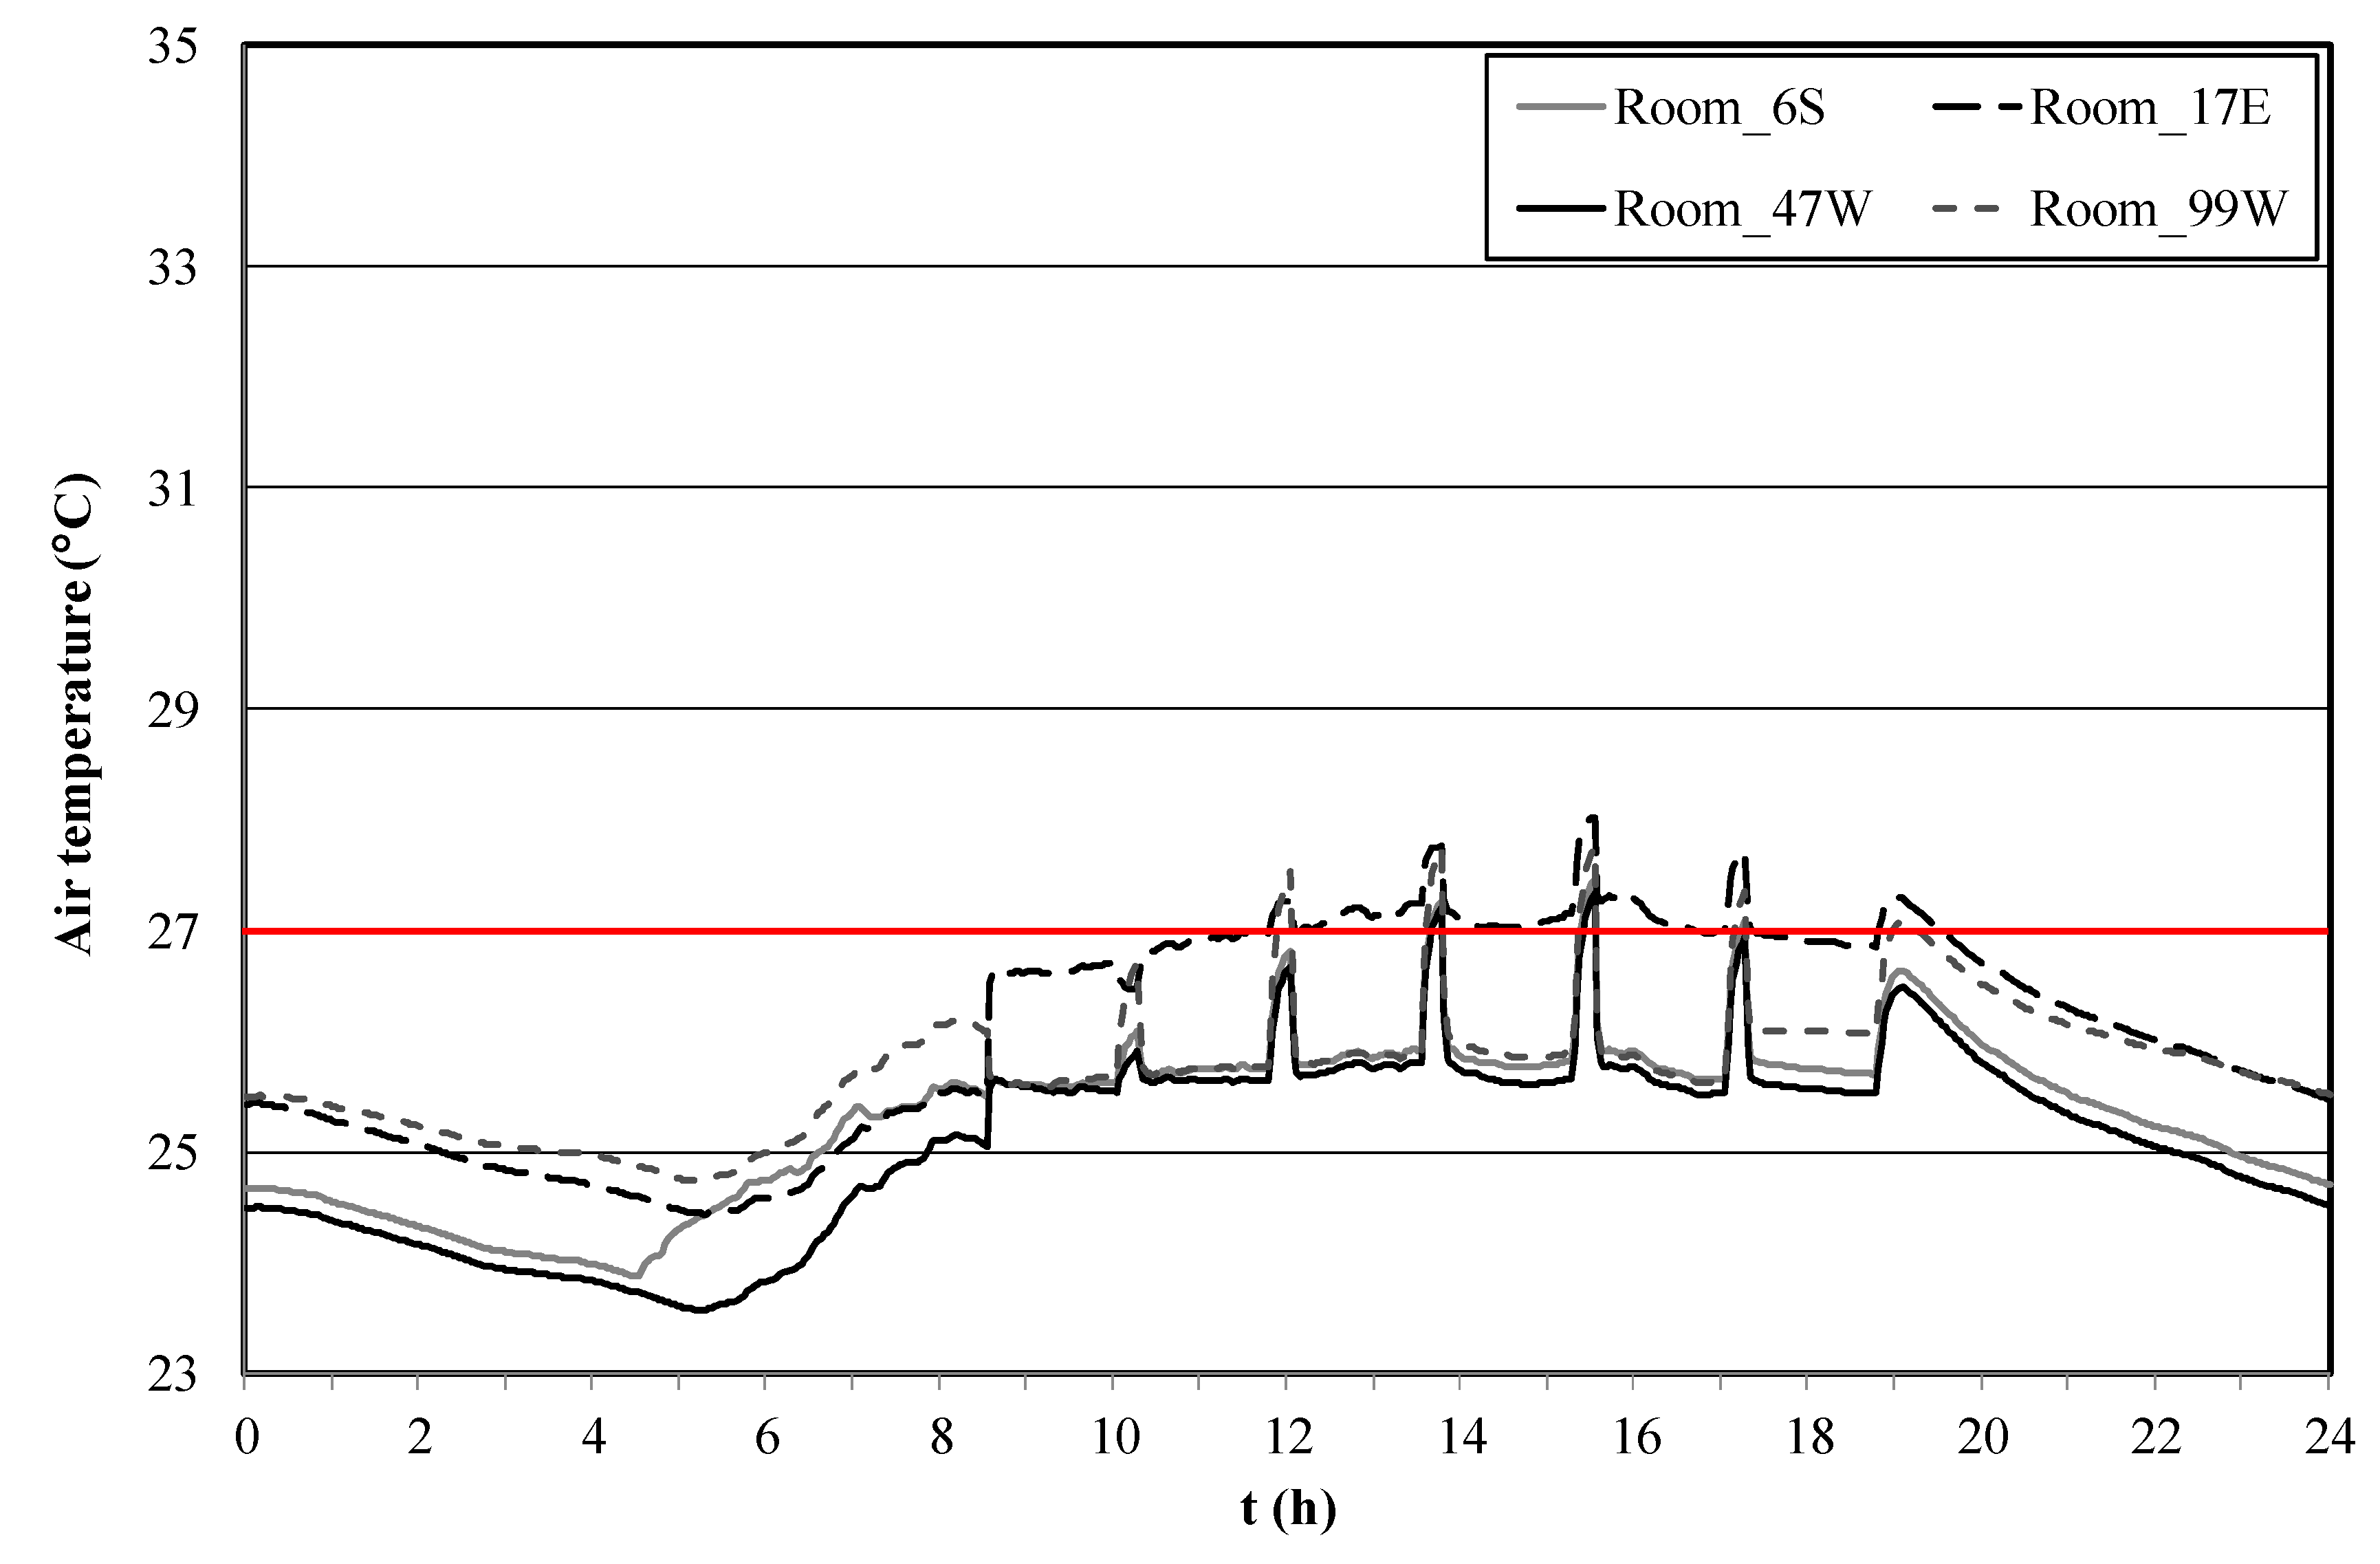
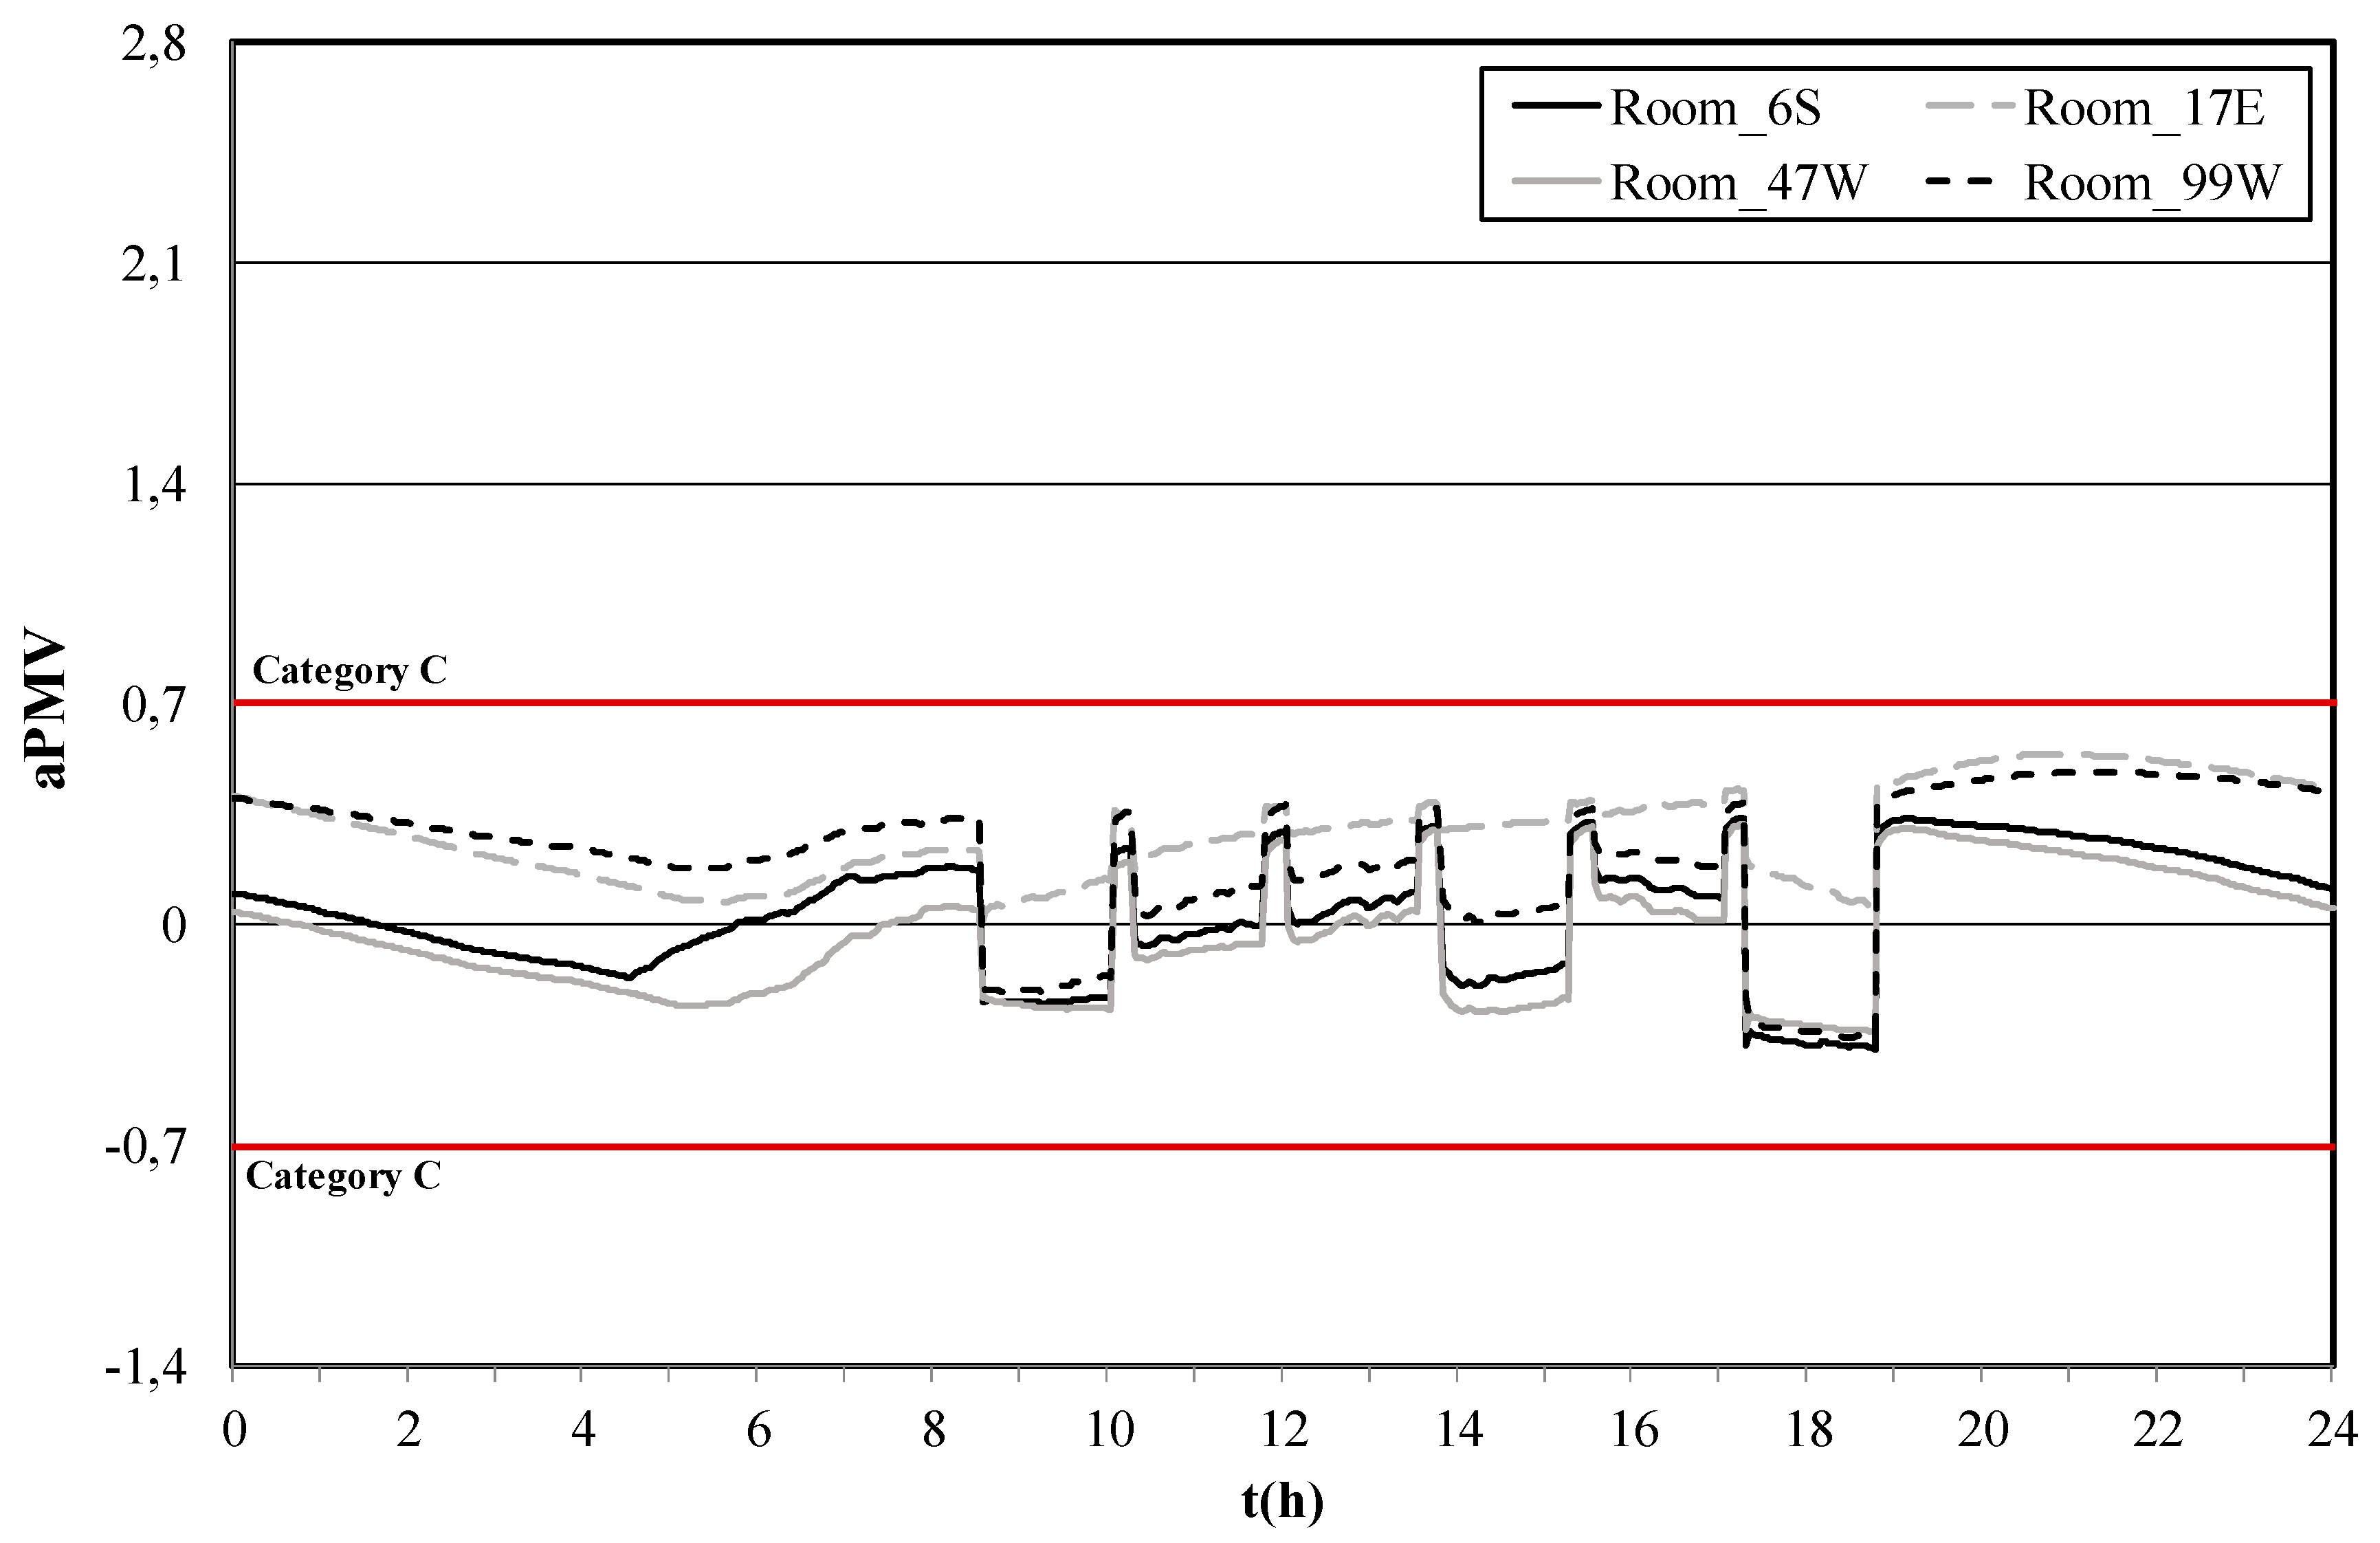
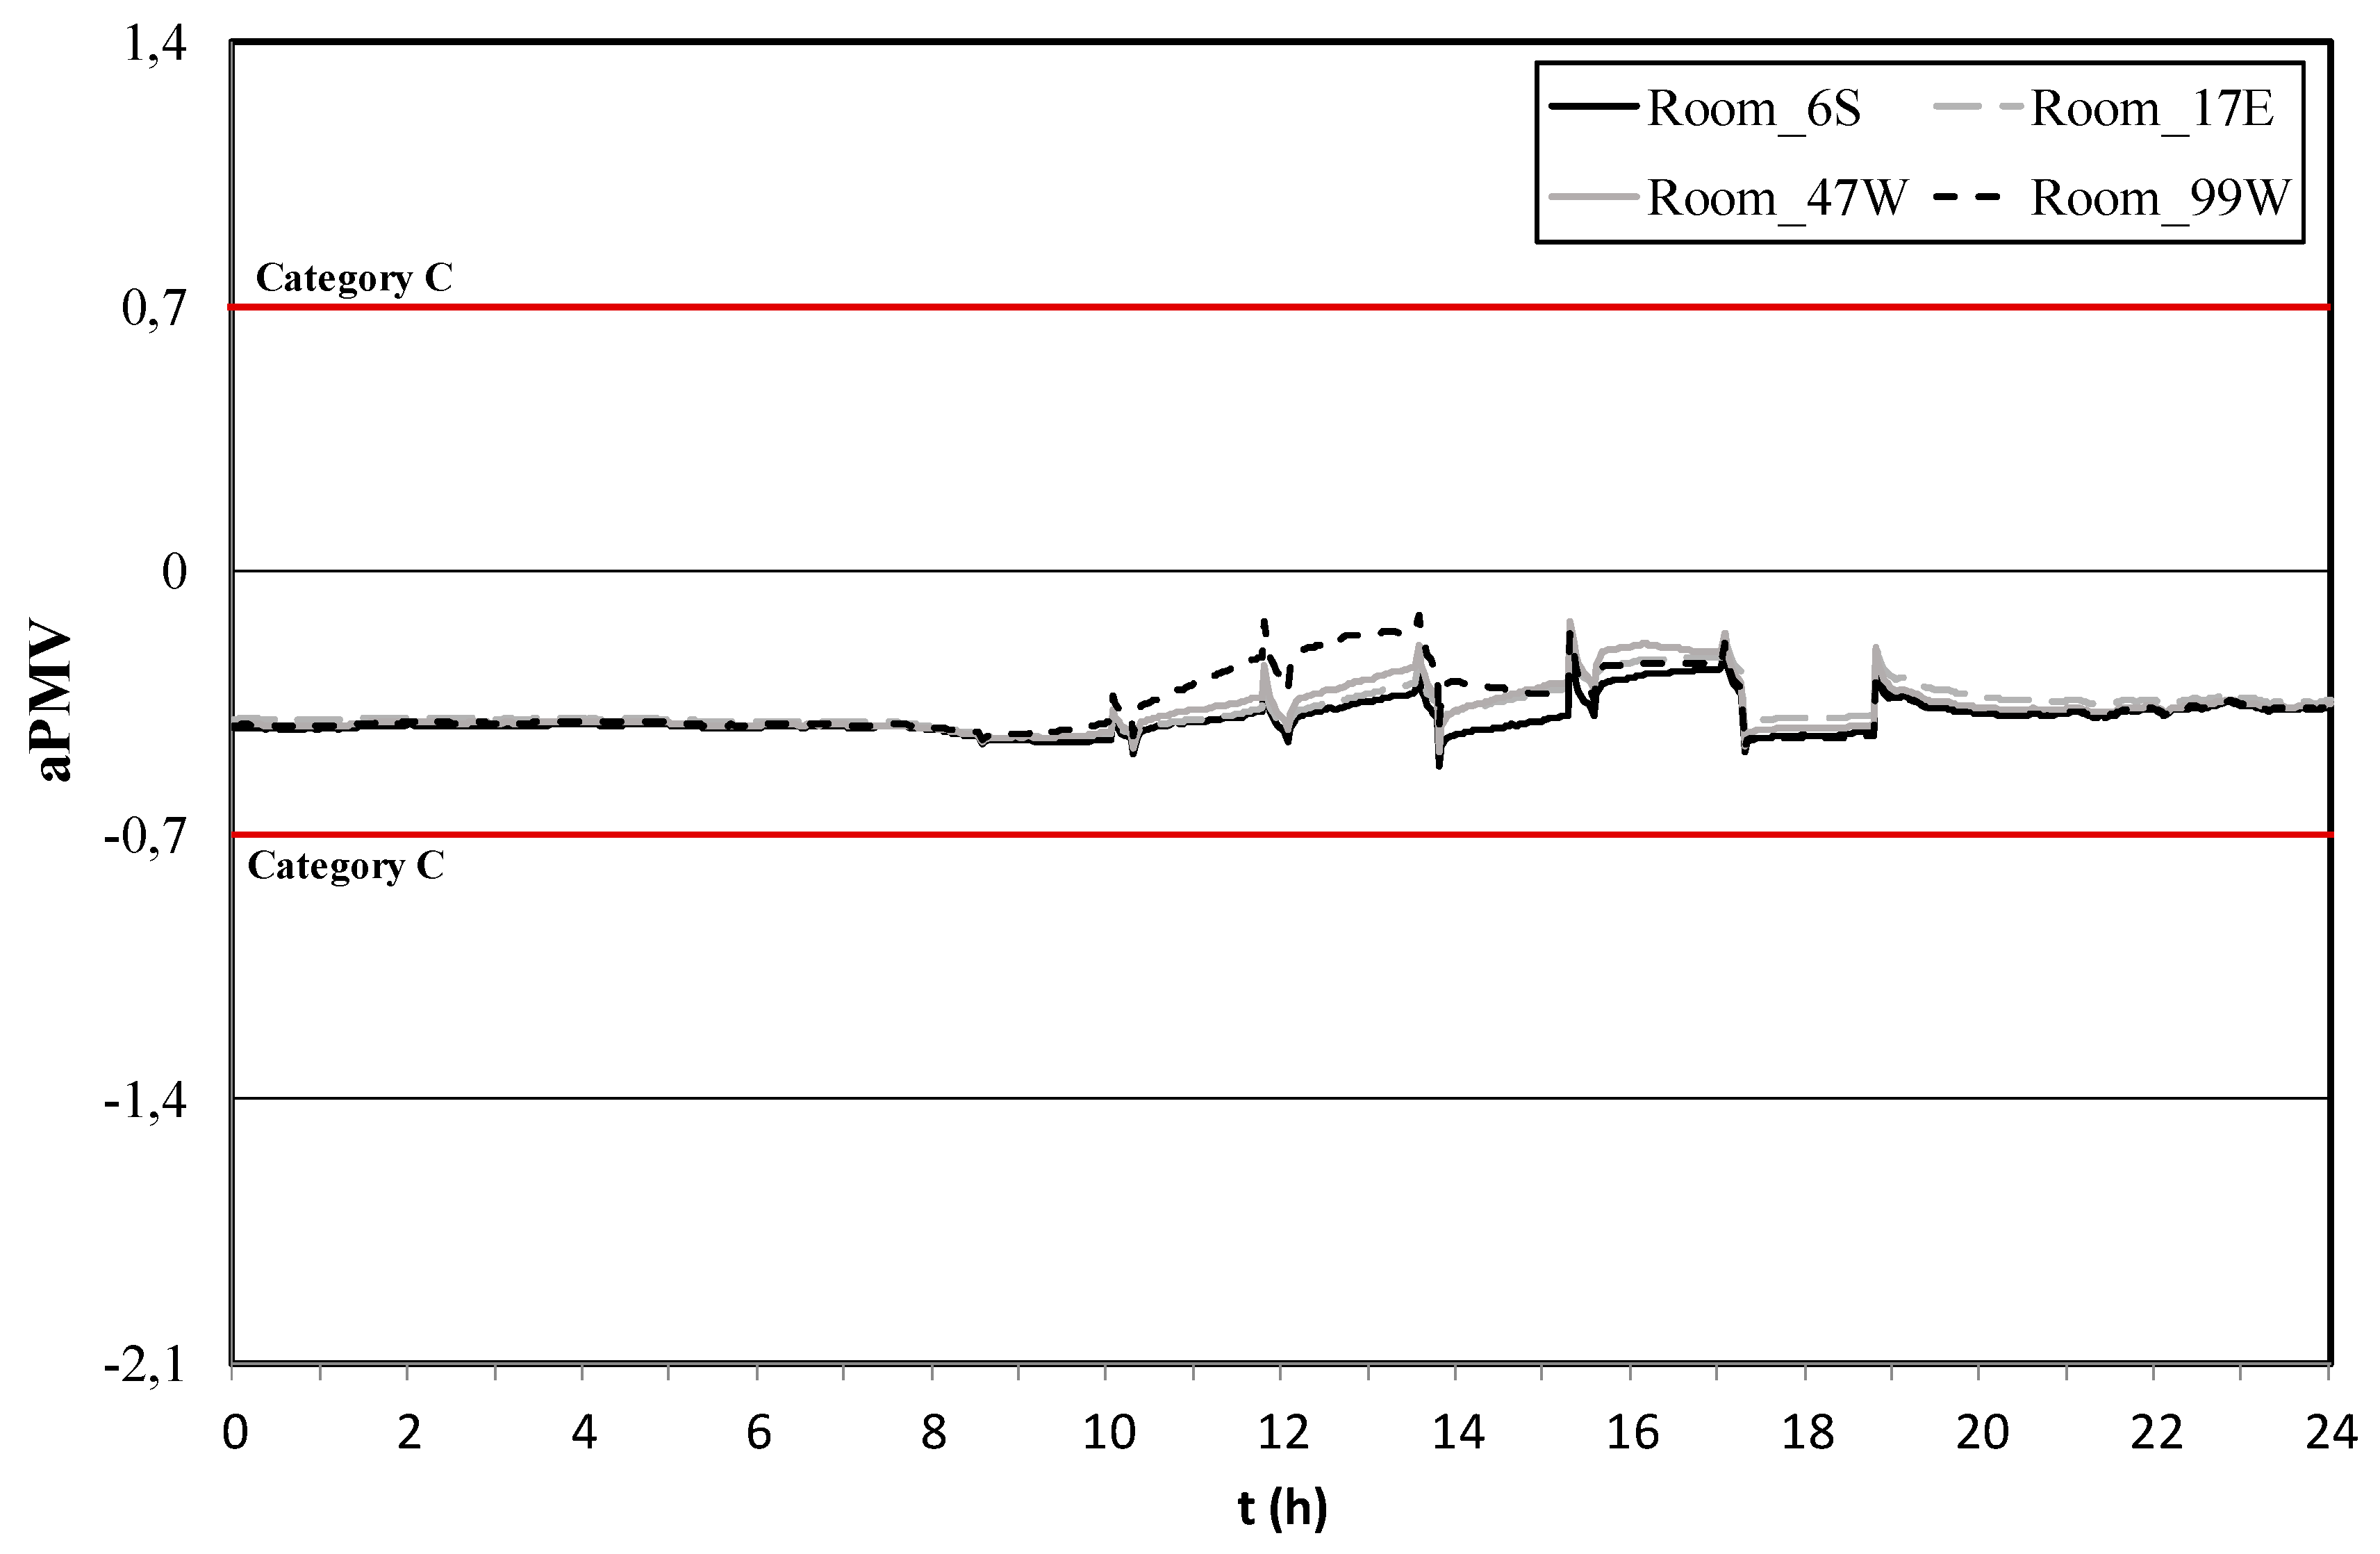
Section 2. The set point values for the PMV and aPMV HVAC control are −0.7 in winter conditions and +0.7 in summer conditions. The indoor air temperature, the PMV index and the aPMV values obtained in several compartments, representative of the building use, are presented and discussed in Section 3, as well as the HVAC systems total energy consumption. Conclusions are drawn in Section 4.

2. Methodology

2.1. Numerical Model

The numerical model used in this work simulates the thermal response of buildings with complex topology. The model is based on the balance integral equations of energy and mass and works in transient conditions (please see [37] for details). The mass balance integral equations, developed for the water vapor and the air contaminants, considers the accumulated mass and the mass flux due to the convection, diffusion, and others. The energy balance integral equations, developed for the air, the different transparent bodies, the interior bodies, and the opaque bodies of the building, consider the accumulated sensible heat and the heat flux due to the conduction, convection, radiation, evaporations and others. In the resolution of the equation system, the Runge–Kutta–Felberg method with error control is used.
The input data are the buildings geometry (introduced in a three-dimensional design software), the boundary conditions, the materials thermal proprieties, the outdoor environmental and geographical conditions, the initial conditions, the several heat and mass loads, the occupation cycle, the occupants’ clothing and activity levels, and the air ventilation topologies. More details on the numerical model are described in Conceição and Lúcio [5,38].
The model was validated for school buildings under winter conditions in Conceição et al. [39] and in summer conditions in Conceição and Lúcio [40]. The geometry of the building, that considers a school building with different levels and shading devices, used in both validation tests present similarities to the one used in the present study.
The validation tests consider a school building located in the Mediterranean region. In the modern school building analyzed, three floors, 97 compartments, 1277 building main bodies and 211 windows’ glasses were considered. The experimental external environmental variables (the external air temperature, air velocity and air relative humidity and the wind direction) were used as inputs in the numerical model, while the experimental internal environmental variables (air temperature), in some selected rooms, were used in the numerical model validation. All measured data were stored in dataloggers located in the school building. The validation showed a good match between numerical and experimental results.

2.2. Numerical Methodology

The numerical study was performed with a university building, mainly consisting of offices, classrooms and laboratories. The building is divided into 124 spaces, on two floors with an area of 5931 m2, and is composed of 201 transparent surfaces and 1740 opaque surfaces. There are 86 compartments equipped with HVAC systems in this building. The perspective of the building and its structure can be seen, respectively, in Figure 1 and Figure 2.
In Figure 3, a scheme of the implemented methodology in this work is presented. The building simulation has the following inputs:
  • Building geometry (opaque, transparent, and interior bodies);
  • Building bodies properties;
  • Outdoor environmental variables: air temperature (Tout), air relative humidity (RHout), wind direction (Dair), and wind velocity (Vair);
  • Occupation and ventilation cycles;
  • Personal parameters: clothing level (Icl) and activity level (M);
  • HVAC control type: PMV or aPMV control.
Each defined time interval, the building simulation program calculates the following:
  • Solar radiation;
  • Radiation and convection coefficients;
  • Indoor environmental variables: air temperature (Tin), air relative humidity (RHin), mean radiant temperature (MRT) and air velocity (Vin);
  • Carbon dioxide concentration;
  • PMV and aPMV thermal comfort indexes;
  • HVAC thermal power consumption.
According to the implemented HVAC control system and depending on the strategy used for winter and summer conditions, so the HVAC system will be switched on or off.
The external conditions, used in the numerical simulation, correspond to the usual values obtained for a typical summer day and for a typical winter day, in a Mediterranean climate. The direct and diffuse solar radiation distributions have been calculated numerically from a set of empirical equations [41].
In Table 1, the occupation cycle (number of occupants per room during each time period) for the analyzed spaces (4 classrooms) are presented. Classrooms are designated by the number assigned to the compartment and, in brackets, by the orientation of their glazed surfaces (S—South; E—East; W—West).
These compartments have the following characteristics:
  • Compartments 6, 17 and 47 are located on the ground floor, whereas compartment 99 is located on the first floor;
  • Compartment 17 is subject to partial shading by the structure of the building itself;
  • Compartment 47 is also subject to partial shading but by an adjacent building;
  • The ratio of the number of occupants to room volume for each selected compartment is: compartment 6, 0.079 occupants/m3; compartment 17, 0.162 occupants/m3; compartment 47, 0.074 occupants/m3; and compartment 99, 0.082 occupants/m3.
According to the expected activity to be developed in a typical classroom, the metabolic level considered was 1.2 met. The clothing level considered was 1 clo for a typical winter day, and 0.5 clo for a typical summer day.
Adequate airflow rates are absolutely essential to ensure indoor air quality by constant renewal and maintenance of low levels of pollutants. The occupation cycle data are used to calculate the ventilation flows necessary to maintain the indoor air quality. This is because the airflow renewal rates are proportional to the number of occupants, according to their metabolic rates, and the consequent emissions of carbon dioxide. In this study, the option was to use a single value (35 m3/(h∙person) of airflow renewal rate) that respects the Portuguese standard and that guarantees the dilution of the pollutant load according to the activity developed by the occupants [42]. When the space is occupied, the minimum airflow rate per room is calculated by the product of the number of occupants by the air renewal rate. When the rooms are not occupied, it was considered 1 renovation rate per hour, due to infiltration.
In this study, two types of HVAC control systems are implemented: PMV index control and aPMV index control. For both types of controls, whether in summer or winter conditions, the HVAC system only operates when spaces are occupied, and when the indoor environment is thermally uncomfortable. The objective of this control system is to maintain the comfort index within category C, with a maximum of 15% of people dissatisfied, that is, with a PPD (Percentage of People Dissatisfied) index of 15% [10]. There is a relationship between PPD and PMV indexes, which it is given by a Gaussian curve [10]. The operation of the HVAC control system used was presented in Conceição et al. [24], only for the PMV index control type. The HVAC system controlled by the aPMV index operates in a similar way. In winter conditions, the HVAC system is activated, turning on the heating system at its maximum power, when the PMV index or the aPMV index reaches values below −0.7 (PPD > 15%), and it is turned off when the PMV index or the aPMV index reaches values above −0.7. In summer conditions, the HVAC system is activated, turning on the cooling system, when the PMV index or the aPMV index reaches values above +0.7 (PPD > 15%), and turning it off when the PMV index or the aPMV index reaches values below +0.7. However, the HVAC system can continue to operate when the PMV index or the aPMV index reaches values slightly above −0.7 in winter conditions, or when the PMV index or the aPMV index reaches values slightly below +0.7 in summer conditions, due to the thermal inertia of the air-conditioned spaces.

3. Results and Discussion

The numerical simulation results are presented for a typical summer day and a typical winter day. However, in order to evaluate the real building thermal inertia, the previous five days were also simulated. Indoor air velocity, mean radiant temperature, indoor air relative humidity and other personal and building variables were calculated for every step of the numerical simulation. These values change during the simulation period and are used to evaluate the PMV and aPMV indexes.
These results refer to typical classrooms with windows facing south (6), east (17) and west (47 and 99). In the figure legends, “S” means South, “E” means East and “W” means West, that is, the orientation of the compartments’ windows. In Figures 4, 8 and 14, the red line establishes the upper limit temperature (27 °C) foreseen by the Portuguese standard [43] for summer conditions. In Figures 6, 11 and 17, the blue line establishes the lower limit temperature (20 °C) foreseen by the Portuguese standard [42] for winter conditions. The Portuguese standard [43] considers that the indoor air temperature must be in the range of 20 °C to 25 °C. However, in case of a hybrid building, such as the building under study in this work, the upper limit of indoor air temperature may be extended up to 27 °C.
In Figures 5, 7, 9, 12, 15 and 18, the brown lines delimit category C of thermal comfort according to ISO 7730 [10].

3.1. Case Study 1: HVAC System Off

This numerical case study was developed for the situation where the HVAC system is not actuated by any automatic control system. It will be used as a reference to evaluate the behavior of the two control systems proposed in this work.

3.1.1. Summer Conditions

For a typical summer day conditions, the air temperature and PMV index for the four selected compartments (6, 17, 47 e 99) are presented in Figure 4 and Figure 5, respectively.
The results show that, in summer conditions, during the occupation period, the indoor air temperatures calculated in each compartment are very high, between 30 and near 36 °C, much higher than 27 °C recommended by the Portuguese standard [43]. The highest indoor air temperature evolution during the occupation cycle is verified in compartment 99, because it is easily exposed to solar radiation, due to its location on the first floor. Compartment 17 also has high indoor air temperatures, because it has the highest thermal load, with an occupancy index of 0.162 occupants per m3 of room volume. Compartment 49 has the lowest indoor air temperature evolution during the occupation cycle, because it has the lowest thermal load, with a ratio of 0.074 occupants per m3 of room volume, and it is partially shaded by an adjacent building located East of its windows.
The results allow to conclude that, in summer conditions, all the evaluated compartments presented unacceptable thermal comfort conditions, during the occupation period, by positive values of the PMV index (above +0.7), according to category C of ISO 7730 [10].

3.1.2. Winter Conditions

For a typical winter day conditions, the air temperature and PMV index for the four selected compartments (6, 17, 47 e 99) are presented in Figure 6 and Figure 7, respectively.
In winter conditions, during the period of occupation, the indoor air temperatures calculated in each compartment are low, between 15 and 20 °C, below 20 °C, the value recommended by the Portuguese standard [43]. Compartment 99 is the one that presents an evolution of the indoor air temperature closer to 20 °C because it receives the highest solar radiation level.
It can be seen that all compartments present unacceptable thermal comfort conditions, during the occupation cycle, by negative values of the PMV index (below −0.7), according to category C of ISO 7730 [10].

3.2. Case Study 2: HVAC System Operation With PMV Index Control

This numerical case study was developed for the situation where the HVAC system is actuated by a simulated PMV index control system.

3.2.1. Summer Conditions

For a typical summer day conditions, the air temperature, the PMV index and the power consumption for the four selected compartments (6, 17, 47 e 99) are presented in Figure 8, Figure 9 and Figure 10, respectively. In Figure 10, the negative sign for power means that the power consumed is utilized to cool the indoor environment (summer conditions).
In Table 2, the daily energy consumption (E) and the energy consumption by room volume (E/V) are presented, for each compartment, in summer conditions, for PMV control.
According to the obtained results, in summer conditions, the indoor air temperature is around 27 °C, as recommended by the Portuguese standard [43]. During the period of occupation, the temperature in compartments 6, 47 and 99 is relatively constant at 26 °C and in compartment 17 oscillates slightly at around 27 °C.
In Figure 9 and Figure 10, it can be observed that HVAC system only operates when the compartments are occupied:
  • In the time period from 8:30 to 17:15 h, the control system operation keeps all compartments thermally comfortable within the limits of category B [10]: compartment 6 is thermally comfortable by positive PMV values; compartments 17, 47 and 99 are thermally comfortable by negative PMV values;
  • From 17:15 to 18:45 h, the control system operation keeps all compartments thermally comfortable by negative PMV values within the limits of category C [10].
The HVAC system cannot reduce the temperature to 25 °C since all the compartments have a good area of glazed surfaces and their orientation towards East, West or South allow them to receive good levels of incident solar radiation during long periods of the day. However, the HVAC system is able to maintain the indoor air temperature within the extended limit provided by the Portuguese standard [43]. The peaks of power consumption occur at the beginning of the periods of operation of the HVAC system. The cooling power varies between 2.7 and 4.6 kW in compartment 99 (which has the highest daily energy consumption: 34.77 kWh), and between 1 and 3 kW in compartment 17 (which has the daily energy lowest consumption: 20.76 kWh). The cooling power is higher in compartment 99 due to its good exposure to incident solar radiation. The lowest energy consumption by room volume is obtained in compartment 47: 0.123 kWh/m3.

3.2.2. Winter Conditions

For a typical winter day conditions, the air temperature, PMV index and power consumption for the four selected compartments (6, 17, 47 e 99) are presented in Figure 11, Figure 12 and Figure 13, respectively. In Figure 13, the power positive sign means that the power consumed is utilized to heat the indoor environment (winter conditions).
In Table 3, the daily energy consumption (E) and the energy consumption by room volume (E/V) are presented, for each compartment, in winter conditions, using PMV control.
In winter conditions, the indoor air temperature should be above 20 °C, as recommended by the Portuguese standard [43]. During the period of occupation, the temperature in all compartments is relatively constant between 22 and 23 °C.
In Figure 12 and Figure 13, it can be observed that the HVAC system only operates when the compartments are occupied:
  • From 10:00 to 18:45 h, the control system operation maintains all the compartments (except compartment 99, for a brief period of time) thermally comfortable, for some periods within the limits of category B, otherwise within the limits of category C [10], always by negative PMV values;
  • From 8:30 to 10:00 h and 17:15 to 18:45 h, the control system operation cannot keep the compartments thermally comfortable: they all are thermally uncomfortable by negative PMV values.
The heating power varies between 1.6 and 7.9 kW in compartment 6 (which has the highest daily energy consumption of 30.54 kWh; and between 1.2 and 3.8 kW in compartment 17, responsible for the lowest daily energy consumption, with 16.23 kWh. The highest heating power occurs in compartment 6. The lowest energy consumption by room volume is achieved for compartment 99, with 0.118 kWh/m3.
The total daily energy consumption (for the four studied compartments) is higher in summer conditions (107.3 kWh) than in winter conditions (93.6 kWh), as expected for a building located in a Mediterranean climate. However, compartments 6 and 47 have higher energy consumption in winter conditions than in summer conditions. This occurs because these compartments are partially shaded, thus reducing the needs for cooling power during the summer.
As expected, the use of this type of HVAC control system, compared to the reference situation (HVAC system off), makes the compartments thermally comfortable, both in summer and winter conditions, for most of their period of occupancy.

3.3. Case Study 3: HVAC System Operation With aPMV Index Control

This numerical case study was developed for the situation where the HVAC system is actuated by a simulated aPMV index control system.

3.3.1. Summer Conditions

For a typical summer day conditions, the air temperature, the aPMV index and the power consumption for the four selected compartments (7, 17, 47 e 99) are presented in Figure 14, Figure 15 and Figure 16, respectively. In Figure 16, the negative signs for power mean that the power consumed is utilized to cool the indoor environment (summer conditions).
In Table 4, the energy consumption (E) and the energy consumption by room volume (E/V) are presented, for each compartment, in summer conditions, using aPMV control.
According to the obtained results, in summer conditions, the indoor air temperature is around 27 °C (maximum value recommended by the Portuguese standard) [43]. During the occupation period, temperatures in compartments 6, 47 and 99 oscillate between 26 and 27 °C, and between 27 and 29 °C in compartment 17.
In the Figure 15 and Figure 16, it can be observed that the HVAC system only operates when the compartments are occupied:
  • From 8:30 to 17:15 h, the control system operates to keep all the compartments thermally comfortable within the limits of category B [10]: compartment 17 is thermally comfortable by positive aPMV values; compartments 6, 47, and 99 are thermally comfortable by negative or positive aPMV values, depending on the occupation period (please see Figure 15);
  • From 17:15 to 18:45 h, control system operation keeps all compartments thermally comfortable: compartment 17 is thermally comfortable by positive aPMV values, according to category B [5]; compartments 6, 47 and 99 are thermally comfortable by negative aPMV values, according to category B [10].
This type of HVAC control has no significant peaks of power consumption; the HVAC system start-up, in all compartments, is very smooth, as it can be observed in Figure 16. During normal operation, power consumption increases smoothly from 8:30 to 13:30 h in all compartments; during the remaining period of operation, it can be considered almost constant. The cooling power ranges from 3 to 4 kW in compartment 99 (the one with the highest energy consumption of 30.55 kWh), and between 1.2 and 2.2 kW in compartment 17 (which has the lowest energy consumption of 17.09 kWh). The cooling power is higher in compartment 99, due to its good exposure to incident solar radiation. The lowest energy consumption by room volume is achieved in compartment 47: 0.115 kWh/m3.

3.3.2. Winter Conditions

For a typical winter day conditions, the air temperature, the aPMV index and the power consumption for the four selected compartments (7, 17, 47 e 99) are presented in Figure 17, Figure 18 and Figure 19, respectively. In Figure 19, the power positive sign means that the power consumed is utilized to heat the indoor environment (winter conditions).
In Table 5, the daily energy consumption (E) and the energy consumption are presented by room volume (E/V), for each compartment, in winter conditions, for aPMV control.
In winter conditions, the indoor air temperature is above 20 °C, as recommended by the Portuguese standard [43]. During the period of occupation, the temperature in all compartments varies smoothly between 21 and 23 °C.
In Figure 18 and Figure 19, it can be observed that the HVAC system only operates when the compartments are occupied. During the occupation period, the control system operation keeps all the compartments thermally comfortable, varying within the limits of category B [10], all by negative aPMV values.
Small peaks of power consumption occur at the beginning of the HVAC system operation. During normal operation, power consumption decreases smoothly from 8:30 to 13:30 h in all compartments; the power consumption in all compartments during the remaining period of operation can be considered almost constant. The heating power is higher in compartment 47. Heating power ranges from 1.0 to 5.0 kW in compartment 47 and between 1.2 and 3.8 kW in compartment 17. The highest daily energy consumption is obtained in compartment 6 (26.95 kWh) and the lowest in compartment 17 (14.00 kWh). The lowest energy consumption by room volume occurs in compartment 99: 0.105 kWh/m3.
The total energy consumption of the four studied compartments is higher in summer conditions (95.5 kWh) than in winter conditions (83.0 kWh), as expected for the Mediterranean climate where the building under study is located. In compartments 17, 47 and 99, the results confirm this tendency; however, compartment 6 has higher consumption in winter conditions (26.95 kWh) than in summer conditions (24.56 kWh). This is explained by the partial shading of this compartment’s windows, reducing the need for cooling power during the summer.

3.4. Comparative Study

In this work, a numerical simulation is developed to evaluate the energy consumption of an HVAC system with two types of control: control by the PMV index and control by the aPMV index. Simultaneously, it also evaluates the thermal behavior of the compartments conditioned by these HVAC systems. Table 6 summarizes the simulation results for a typical summer day, and for a typical winter day. It presents the daily energy consumption in each compartment, and in all the four selected compartments, for the control methods used.
The use of the aPMV HVAC control, compared with the use PMV HVAC control presents relevant improvements, namely:
  • Lower total energy consumption, both in summer conditions (95.5 kWh vs. 107.3 kWh) and in winter conditions (83.0 kWh vs. 93.6 kWh);
  • It guarantees that during the period of occupation, both in summer conditions and in winter conditions, the studied compartments are always thermally comfortable within categories C, or even B [10].
Although aPMV HVAC control performs better than PMV HVAC control, it should only be applied in Mediterranean-type environments, because this aPMV model was only developed using experimental data from a Mediterranean environment. For other types of environments, the PMV HVAC control should be applied, because this model was developed for HVAC Systems environments.

4. Conclusions

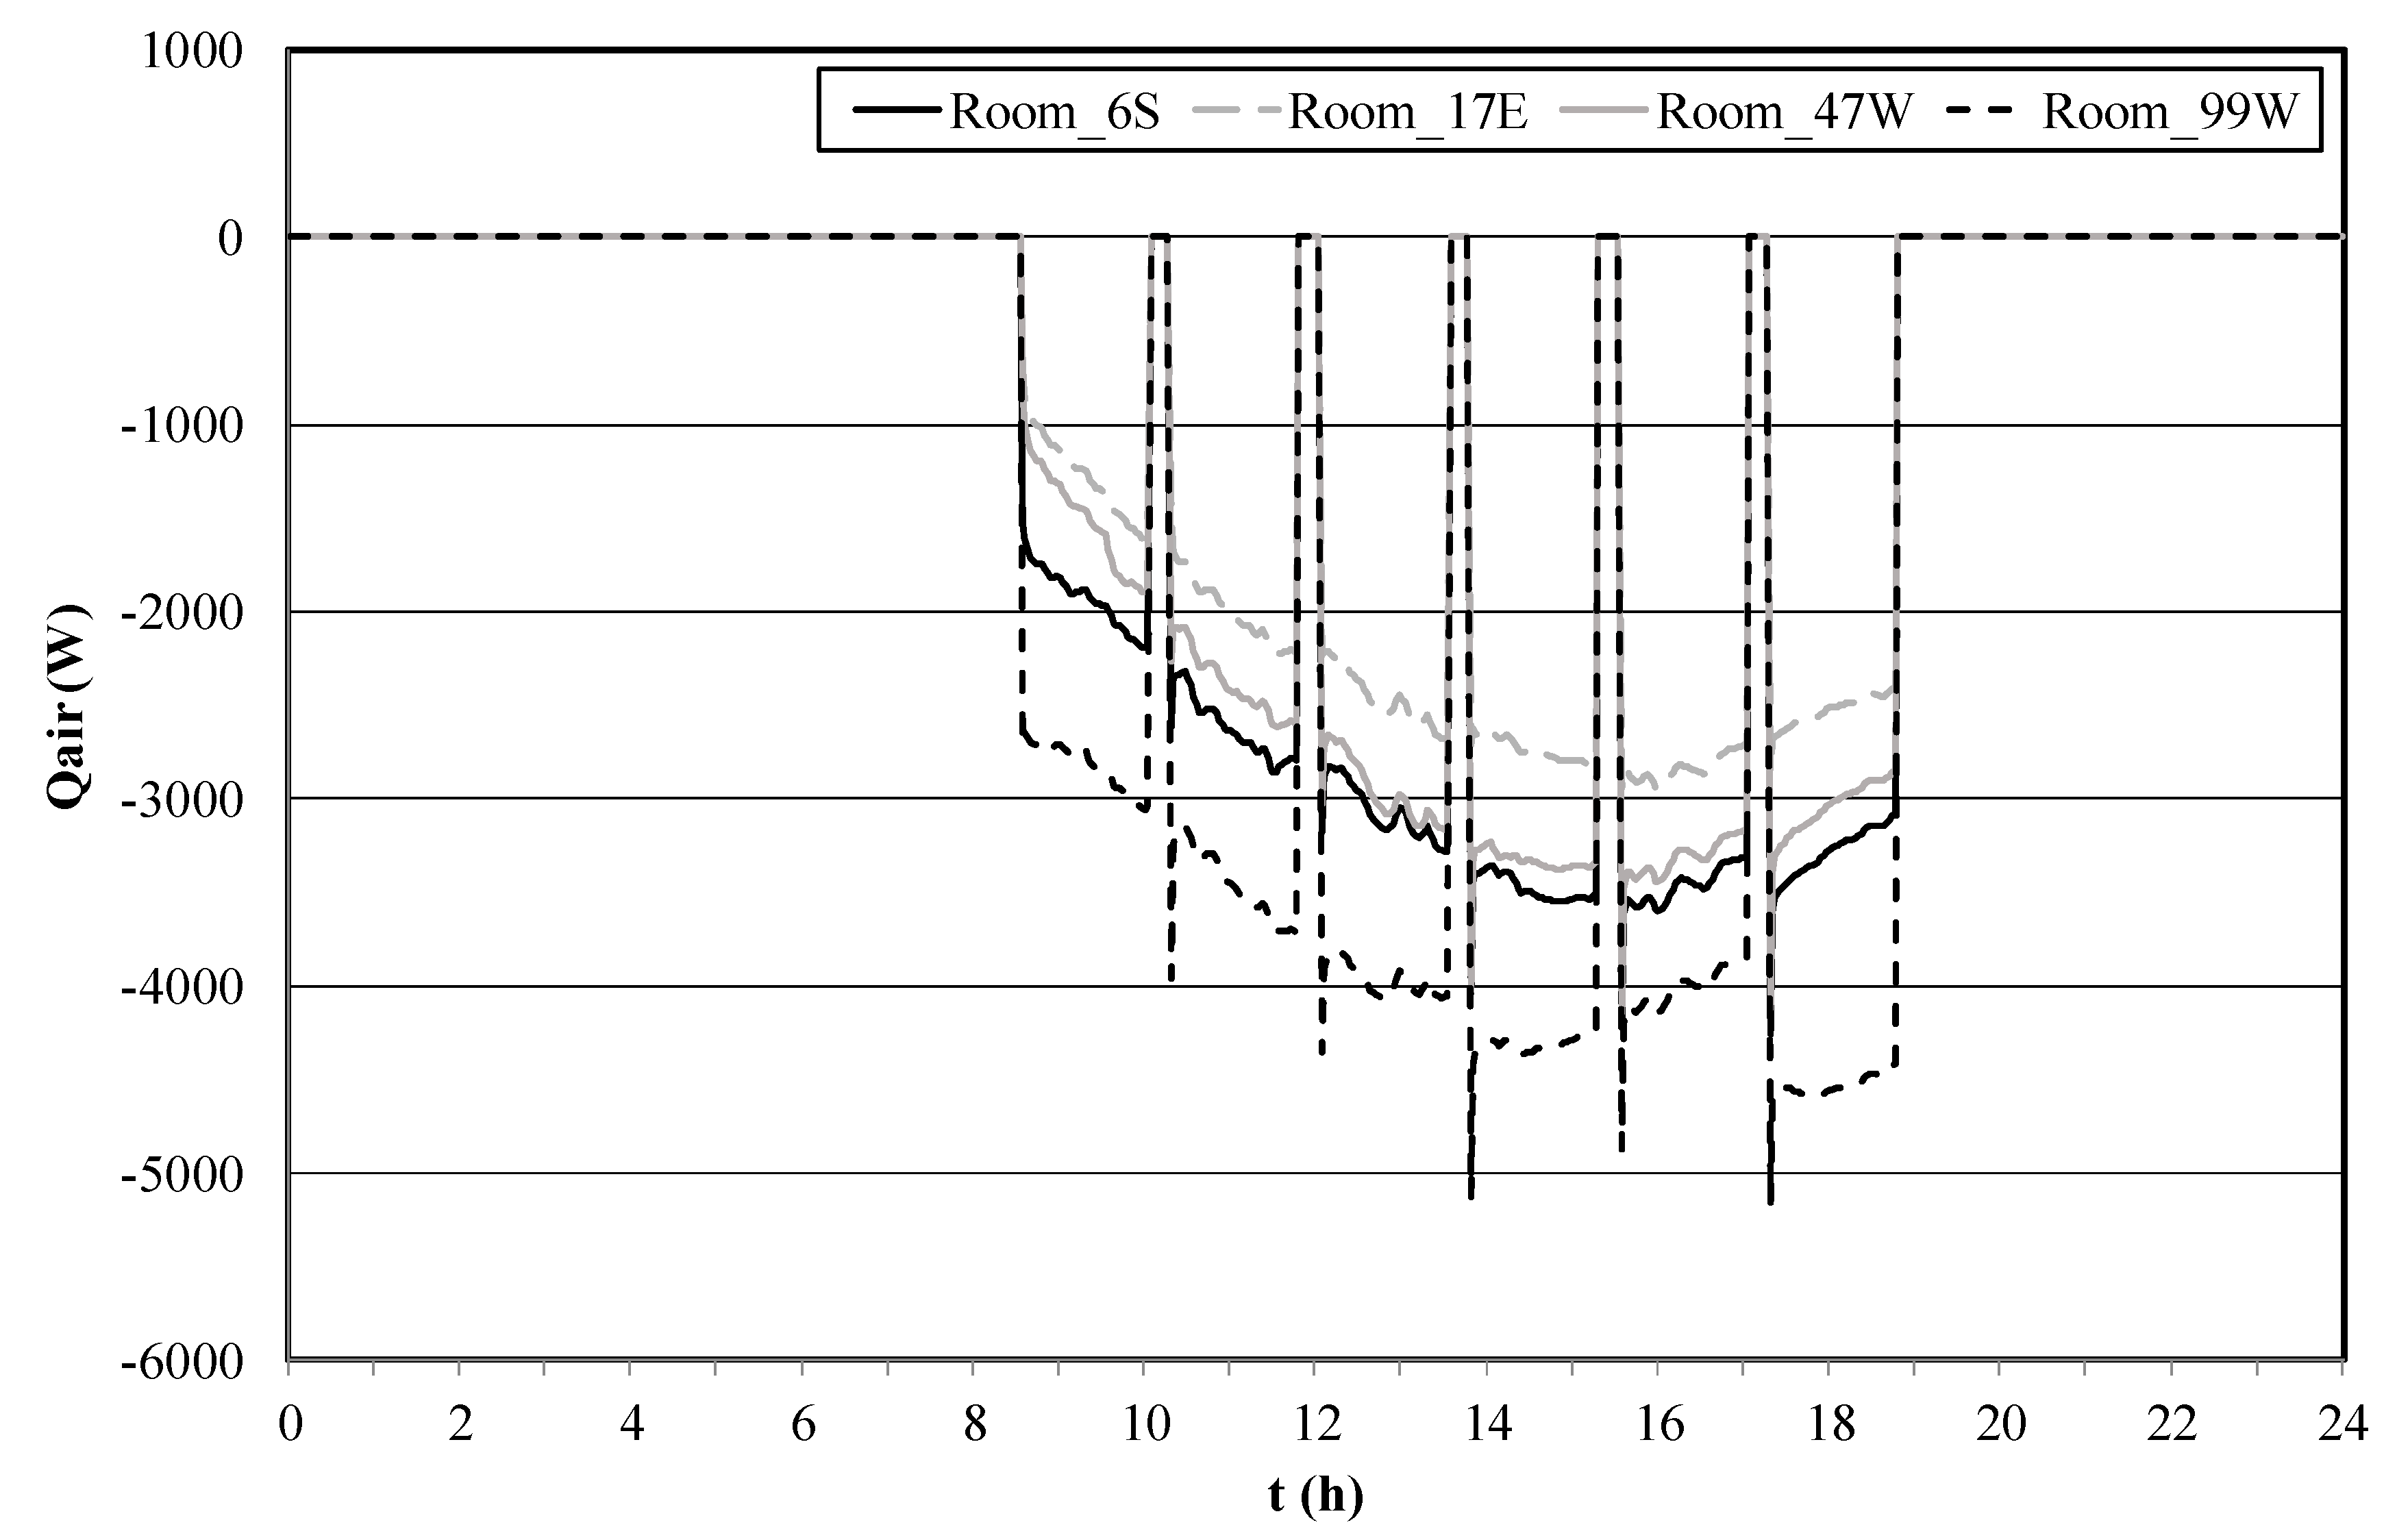
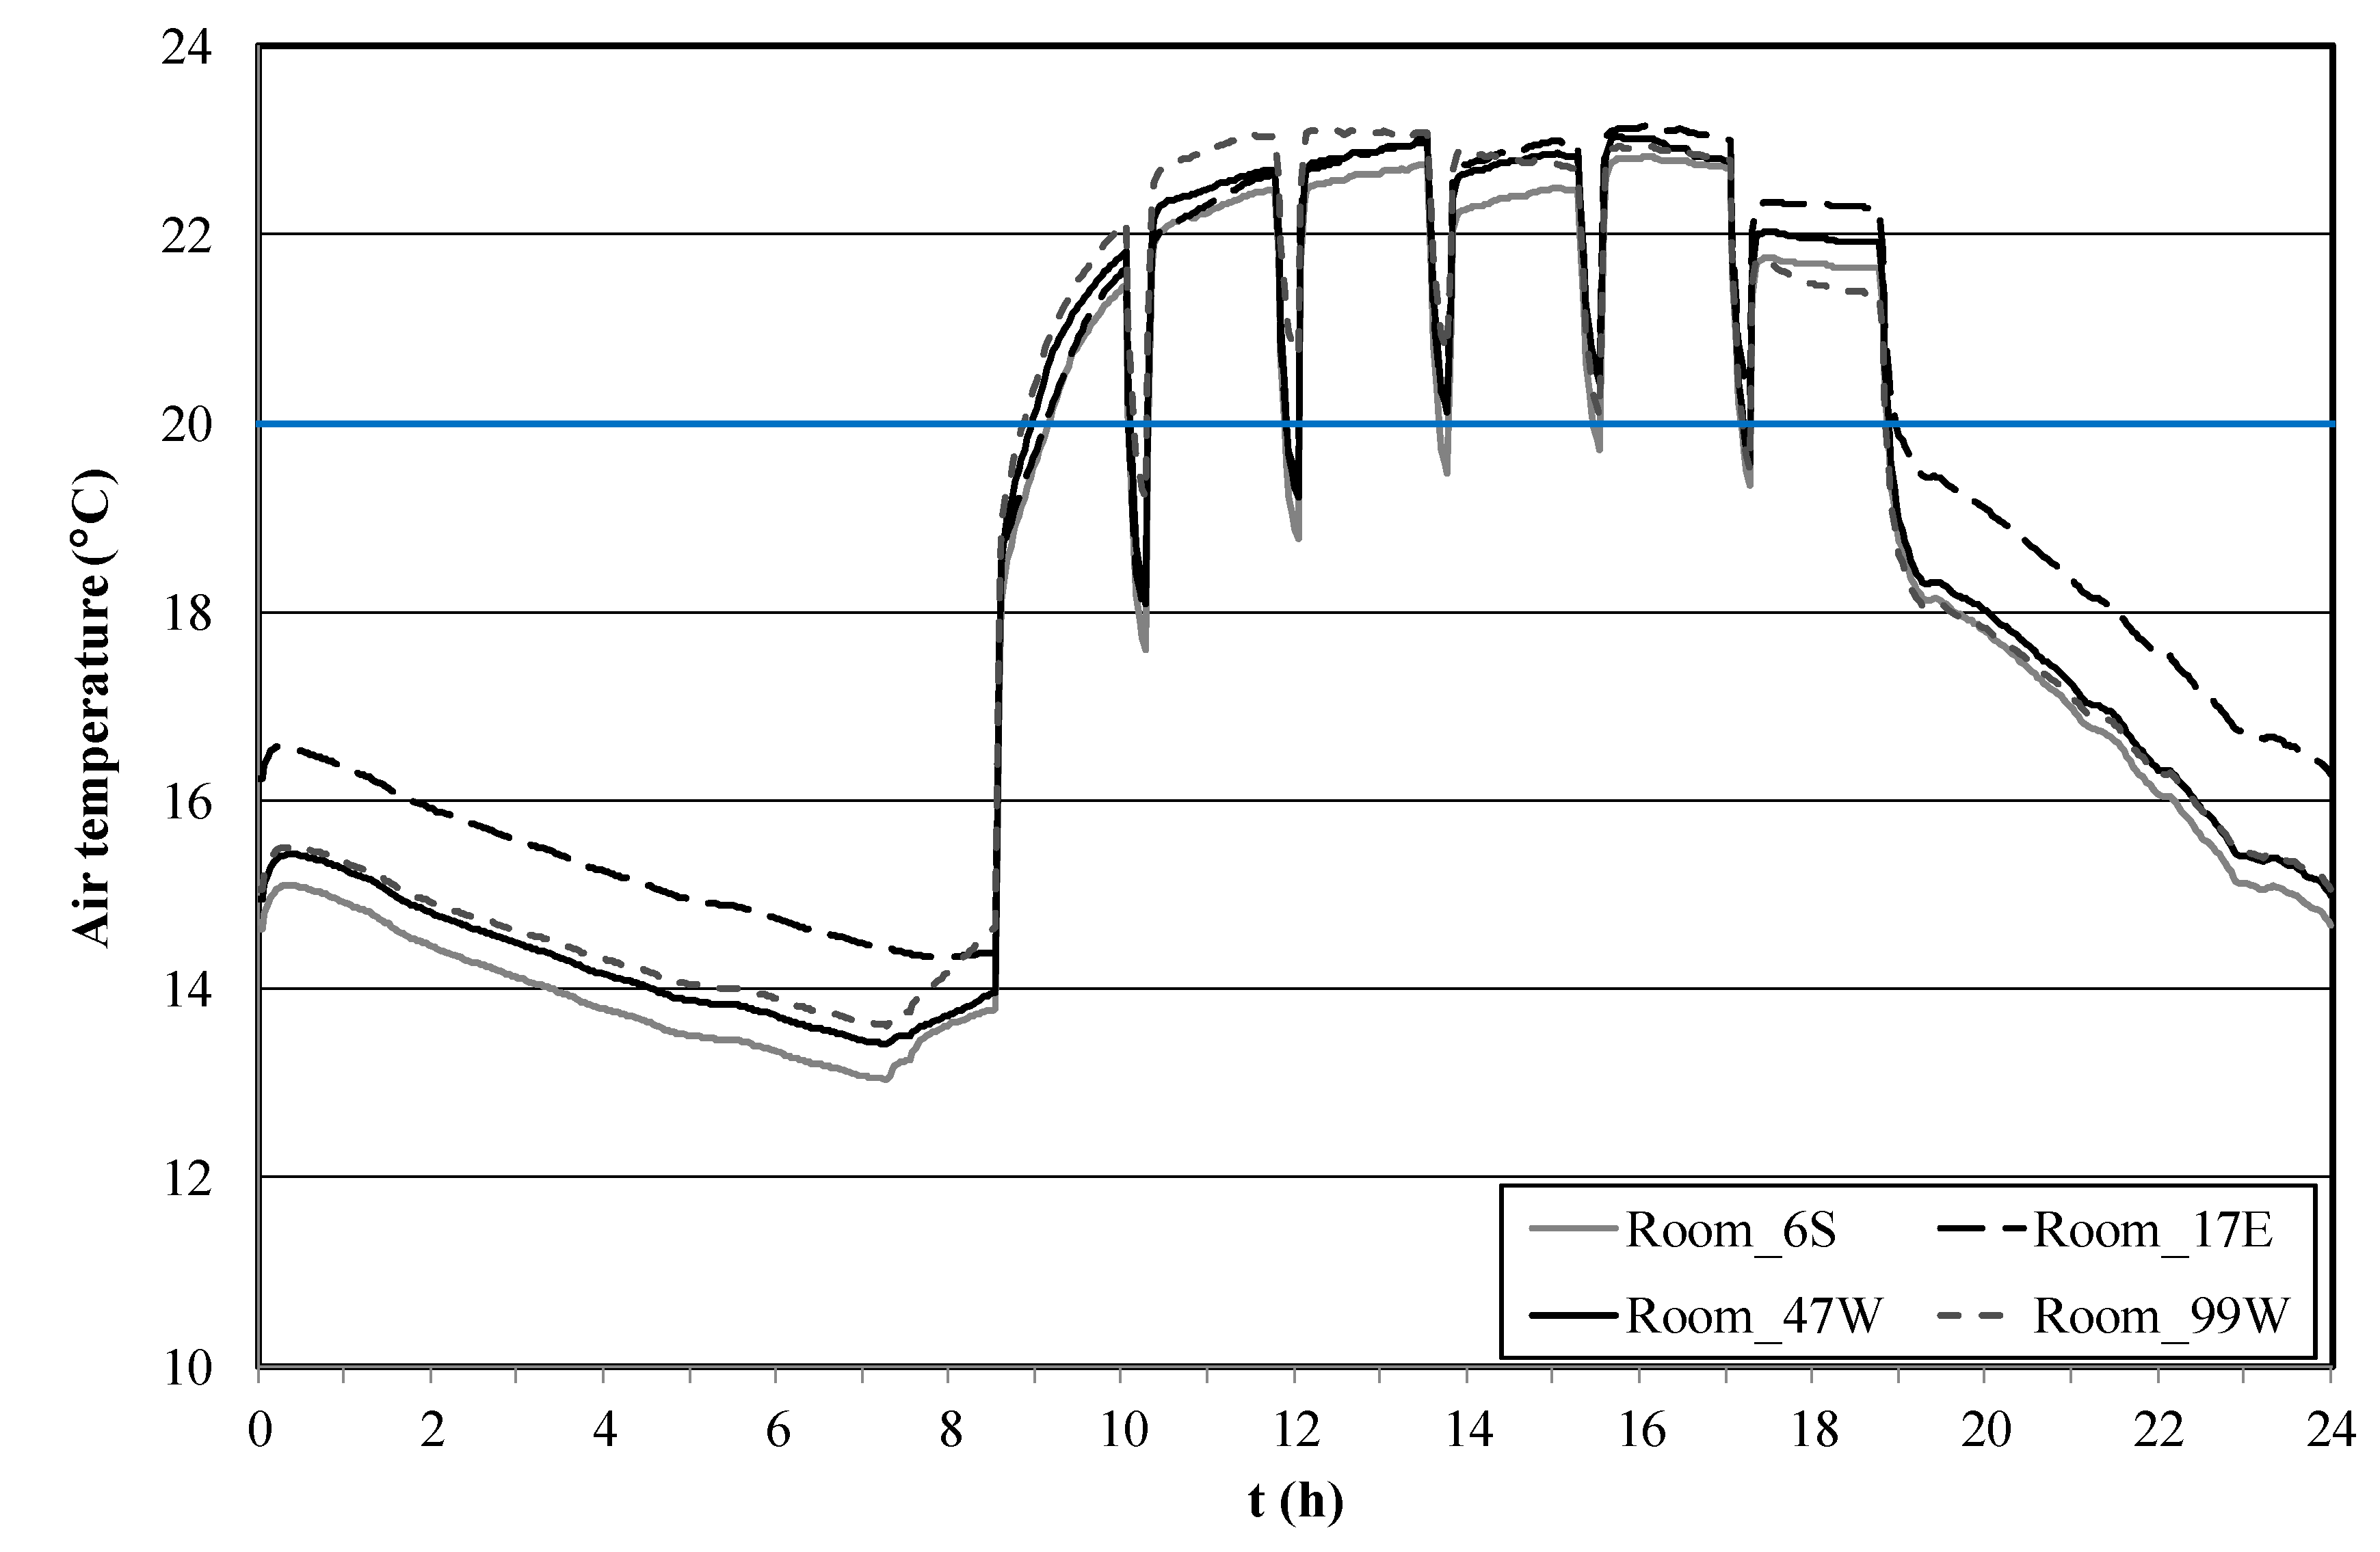
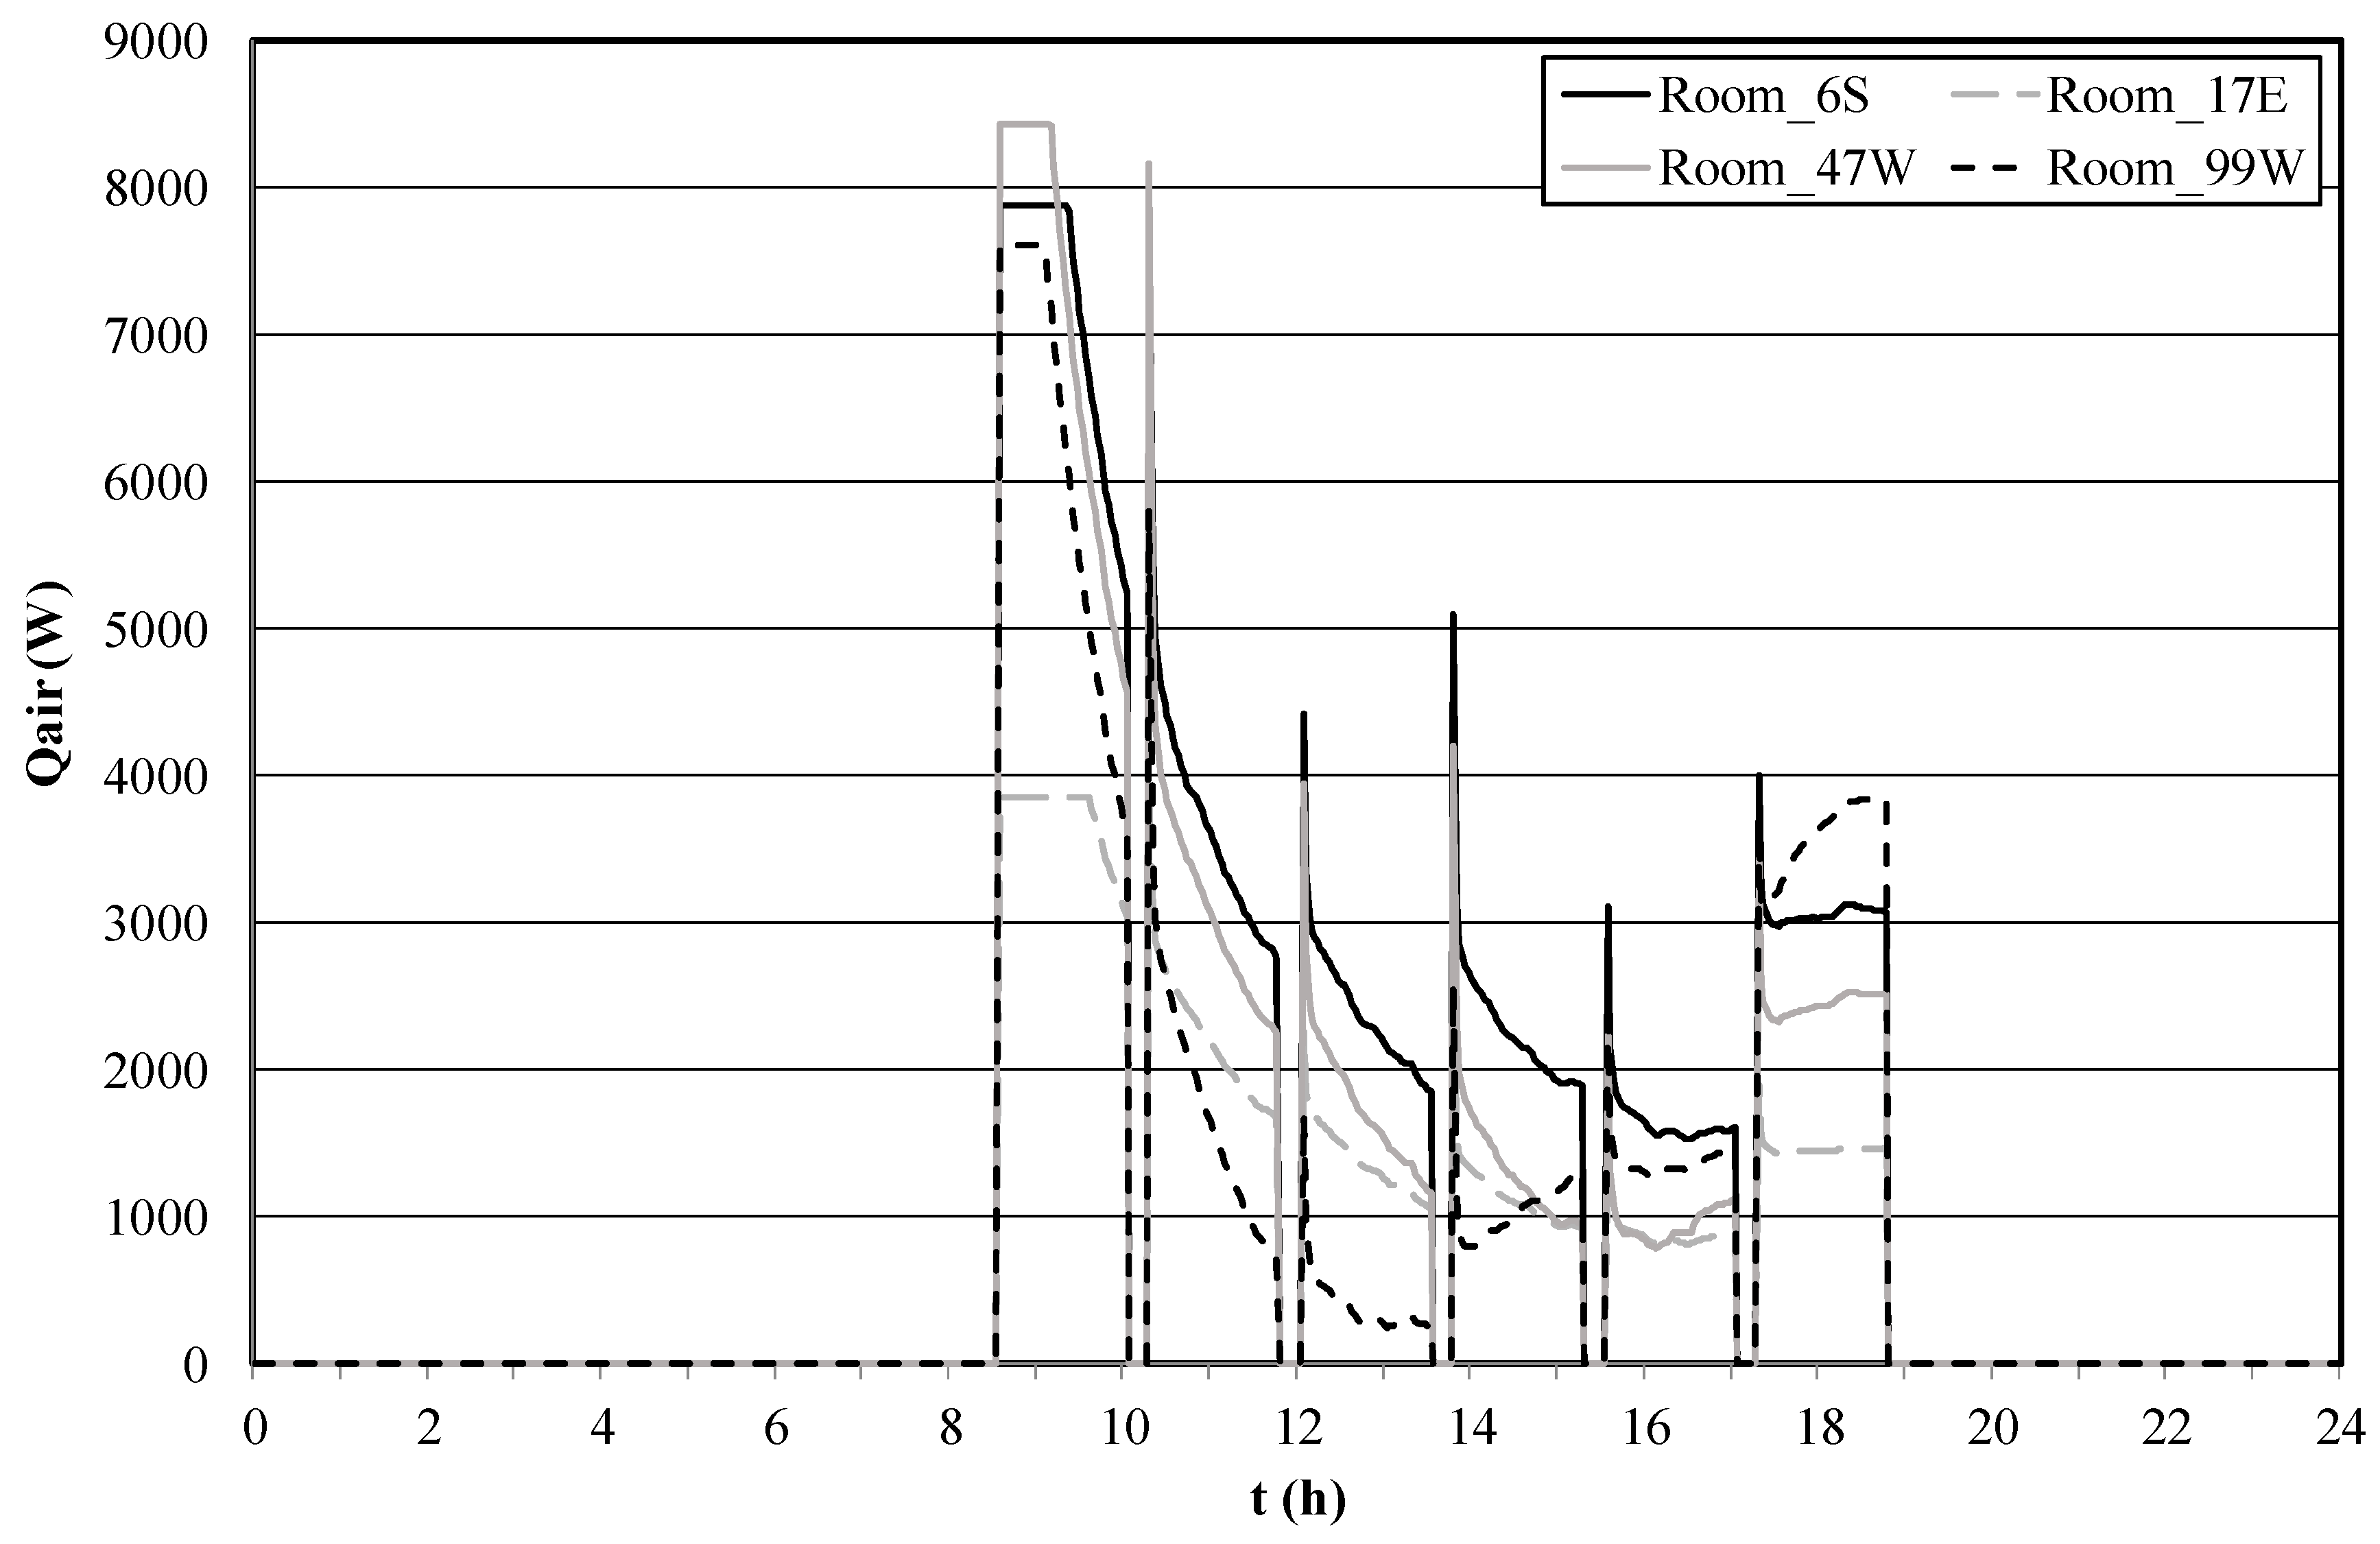
In this work, the performances of HVAC systems, controlled using the PMV and the aPMV indexes, are obtained for a University building, using a software that simulates the building thermal behavior, under transient conditions. In this evaluation, the indoor air temperature, the PMV and aPMV indexes, and the HVAC power consumption in all compartments of the building, are numerically obtained, for summer and winter conditions. The PMV index and aPMV index values for each compartment are obtained from the average values of the environmental variables previously calculated for them. This numerical simulation takes into account the influence of the surrounding buildings on the thermal behavior of the building under study. In this work, the results obtained for four selected compartments are presented, as representative of the study carried out.
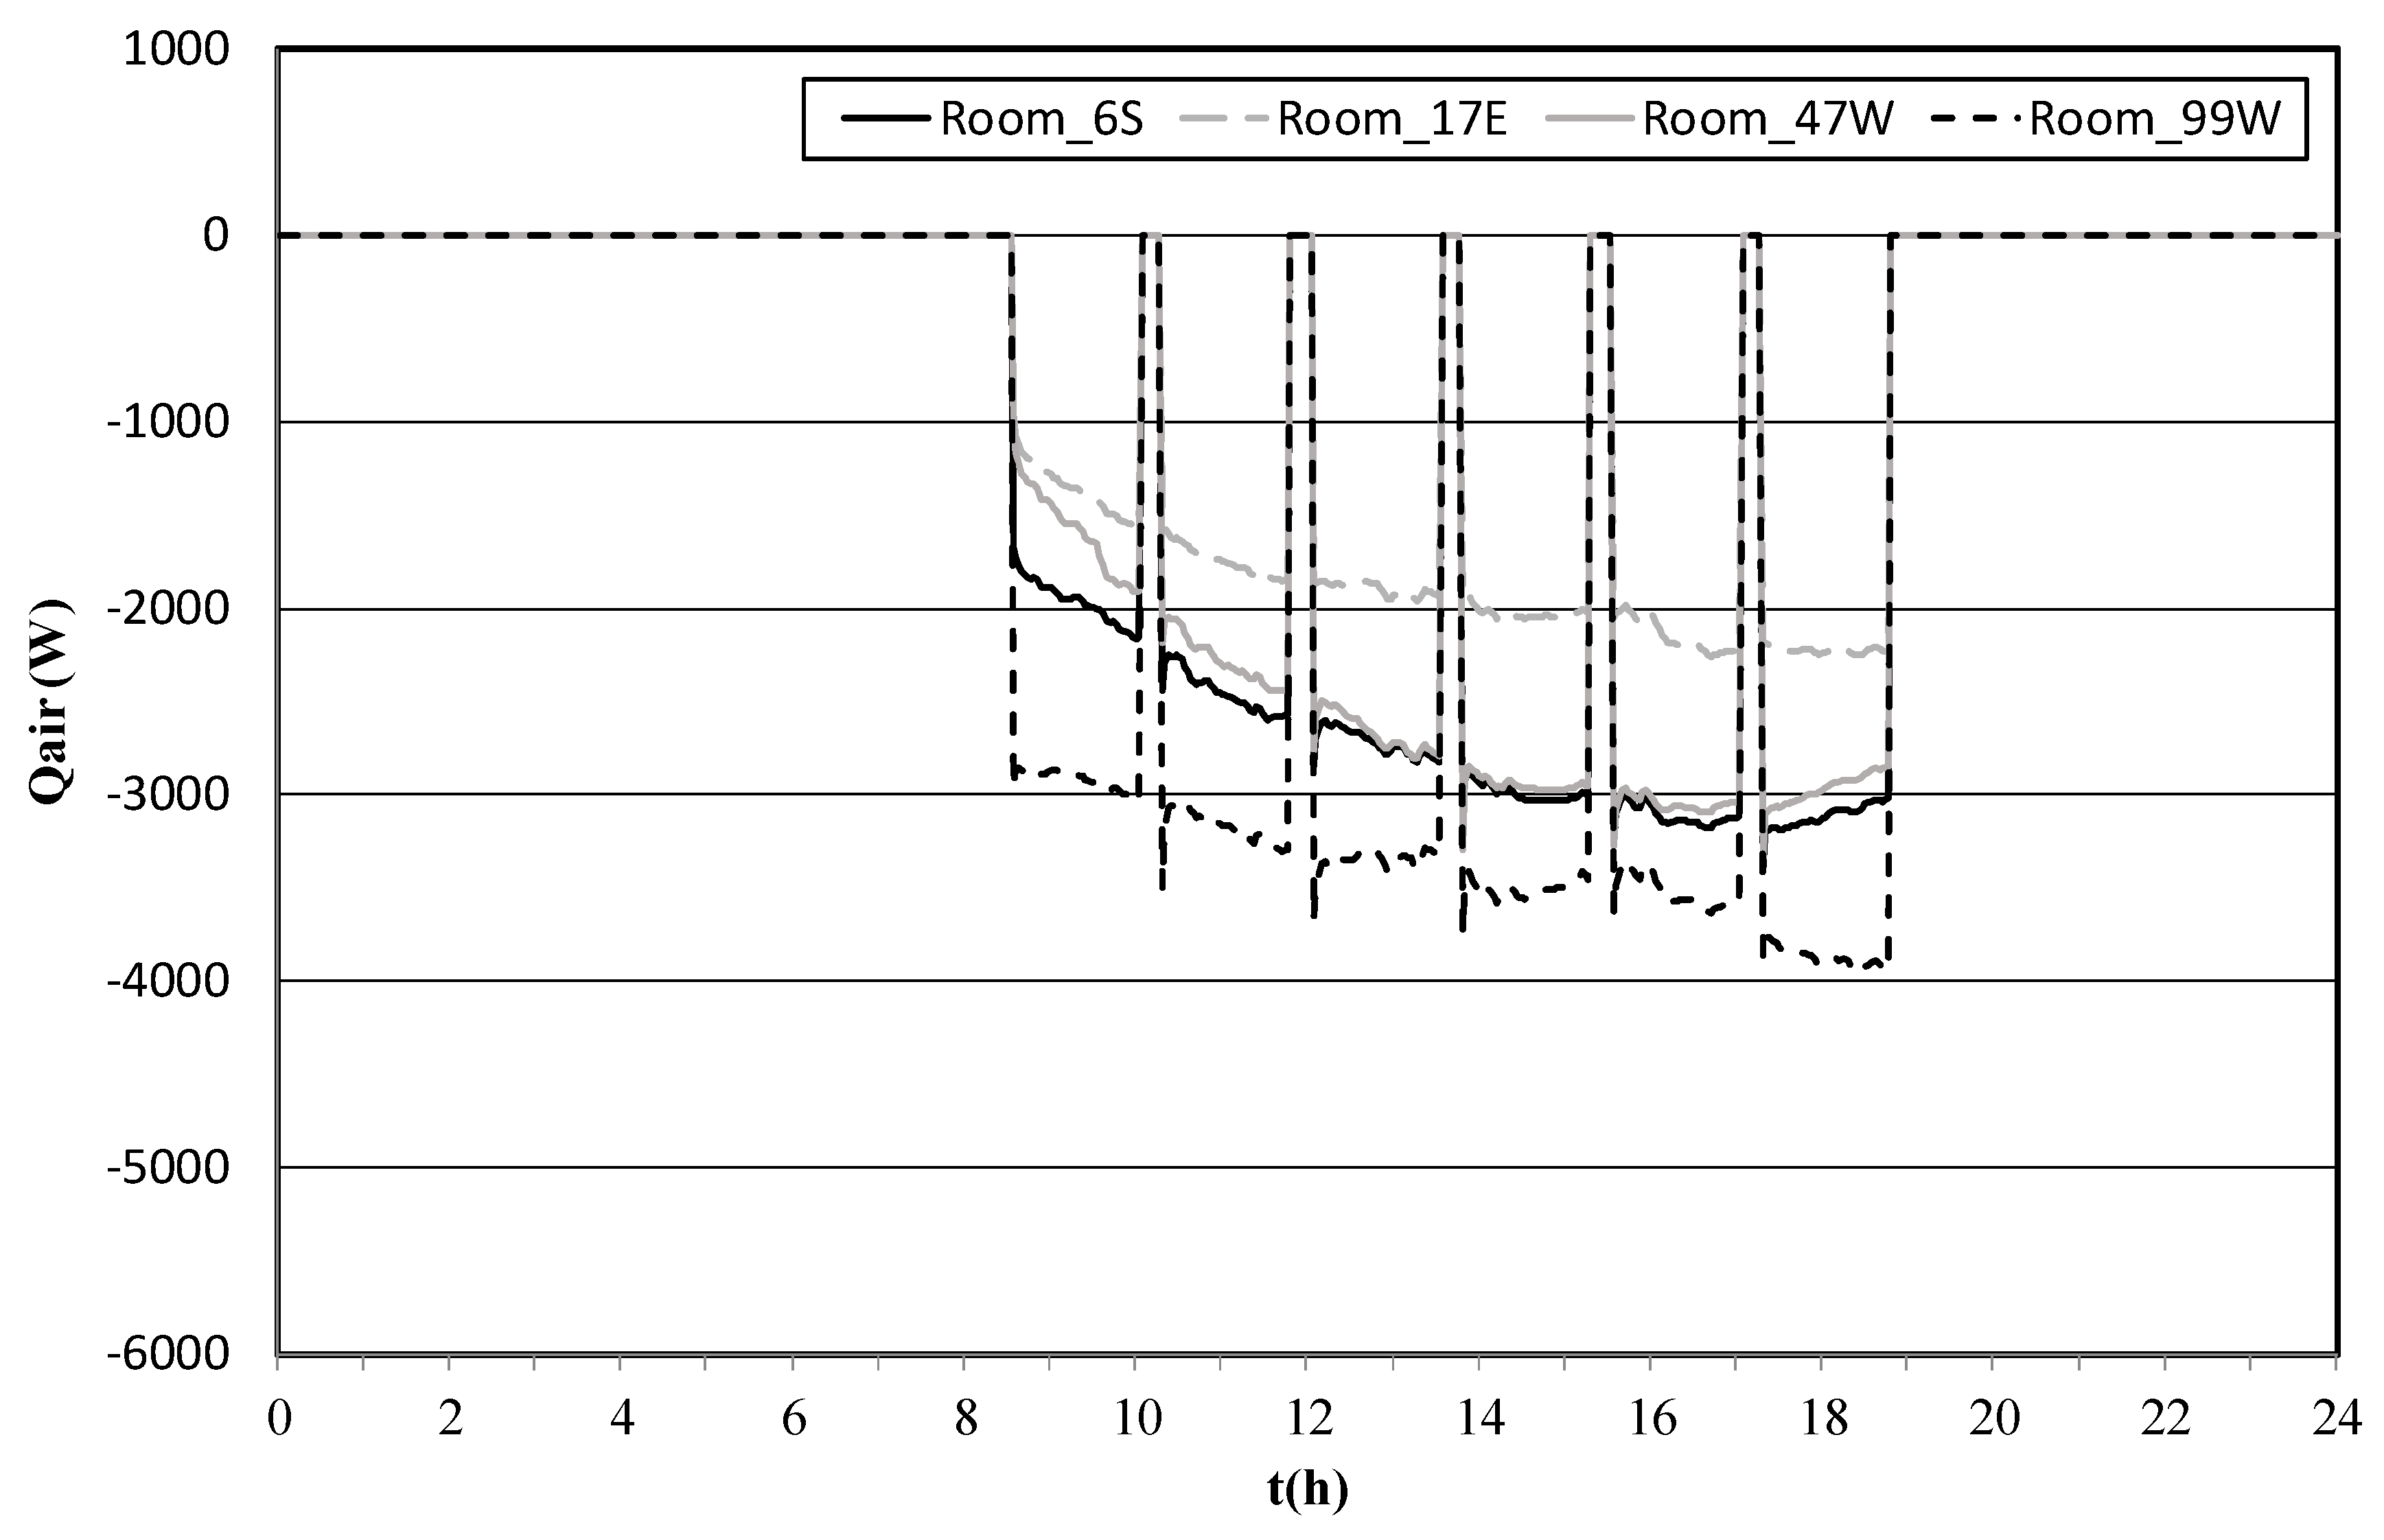
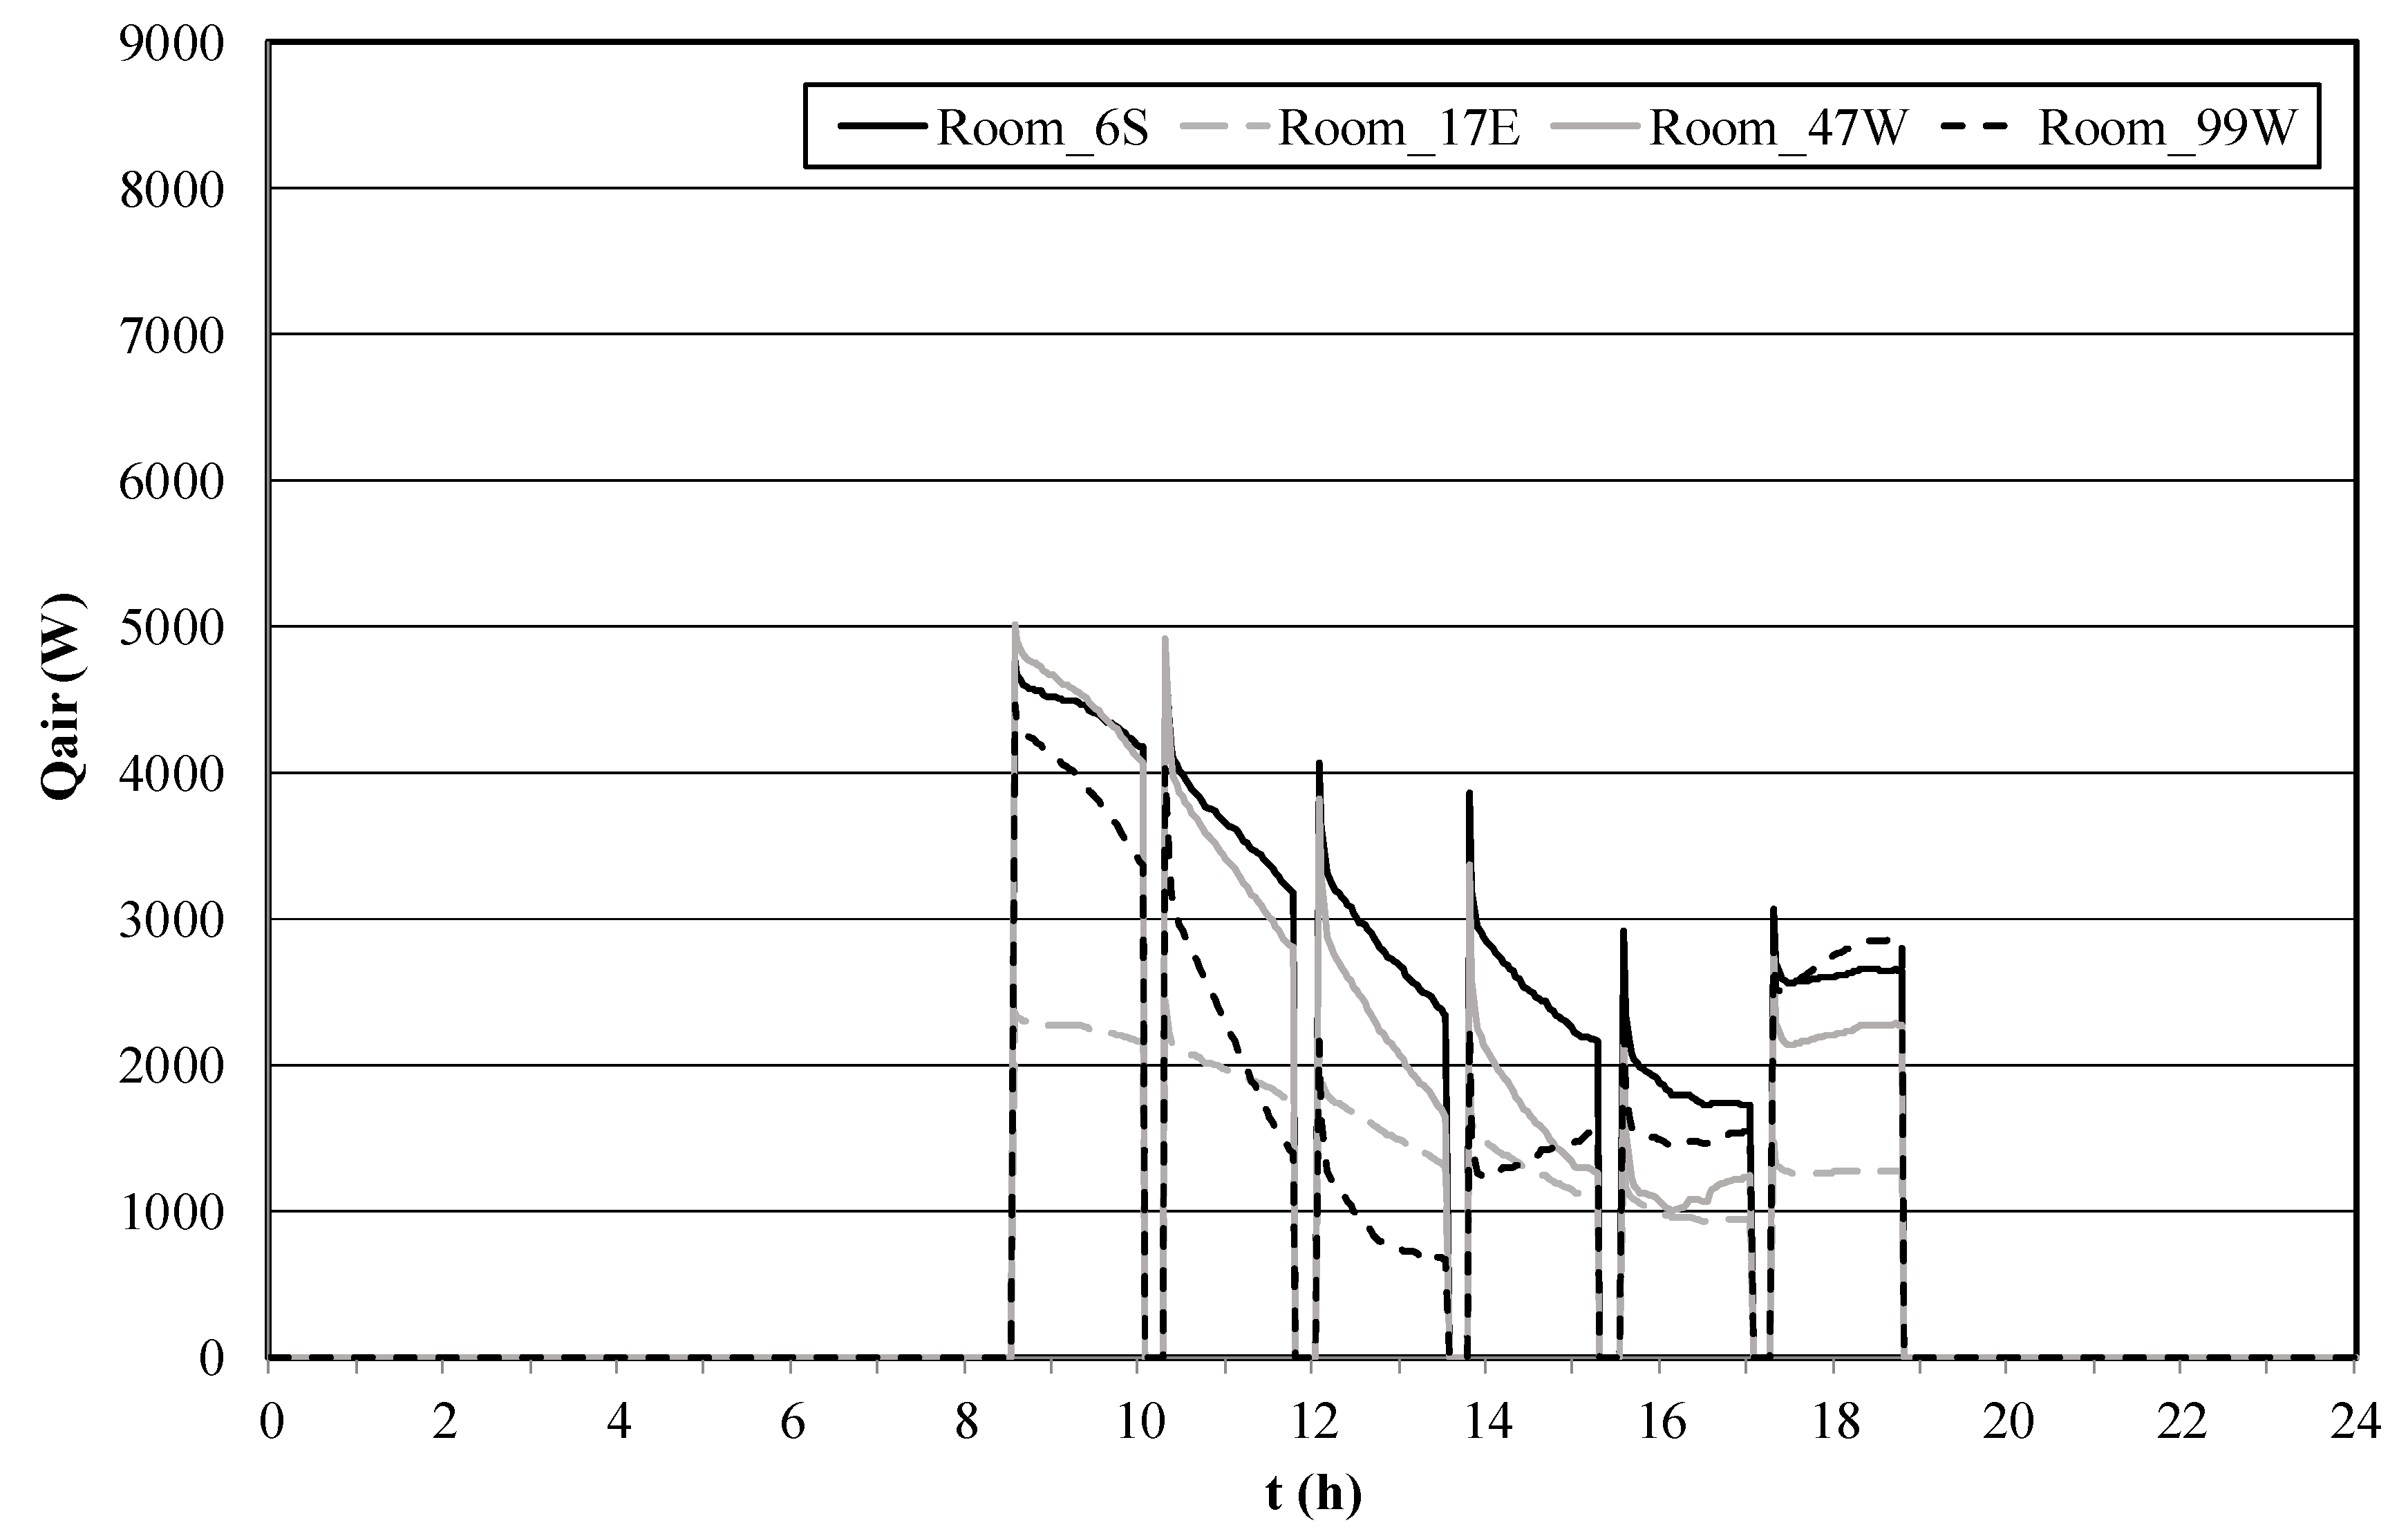
According with the obtained results, the performance of the HVAC system with aPMV control has lower total daily energy consumption than the HVAC system with PMV control, either in summer conditions or in winter conditions, for the selected compartments. The aPMV control system achieves the lowest total daily energy consumption of 95.5 kWh vs. 107.3 kWh, in summer conditions, and 83.0 kWh vs. 93.6 kWh in winter conditions. The energy consumption level is higher in winter conditions than in summer conditions for compartments with shading structures, and it is lower in winter conditions than in summer conditions for compartments exposed to direct solar radiation.
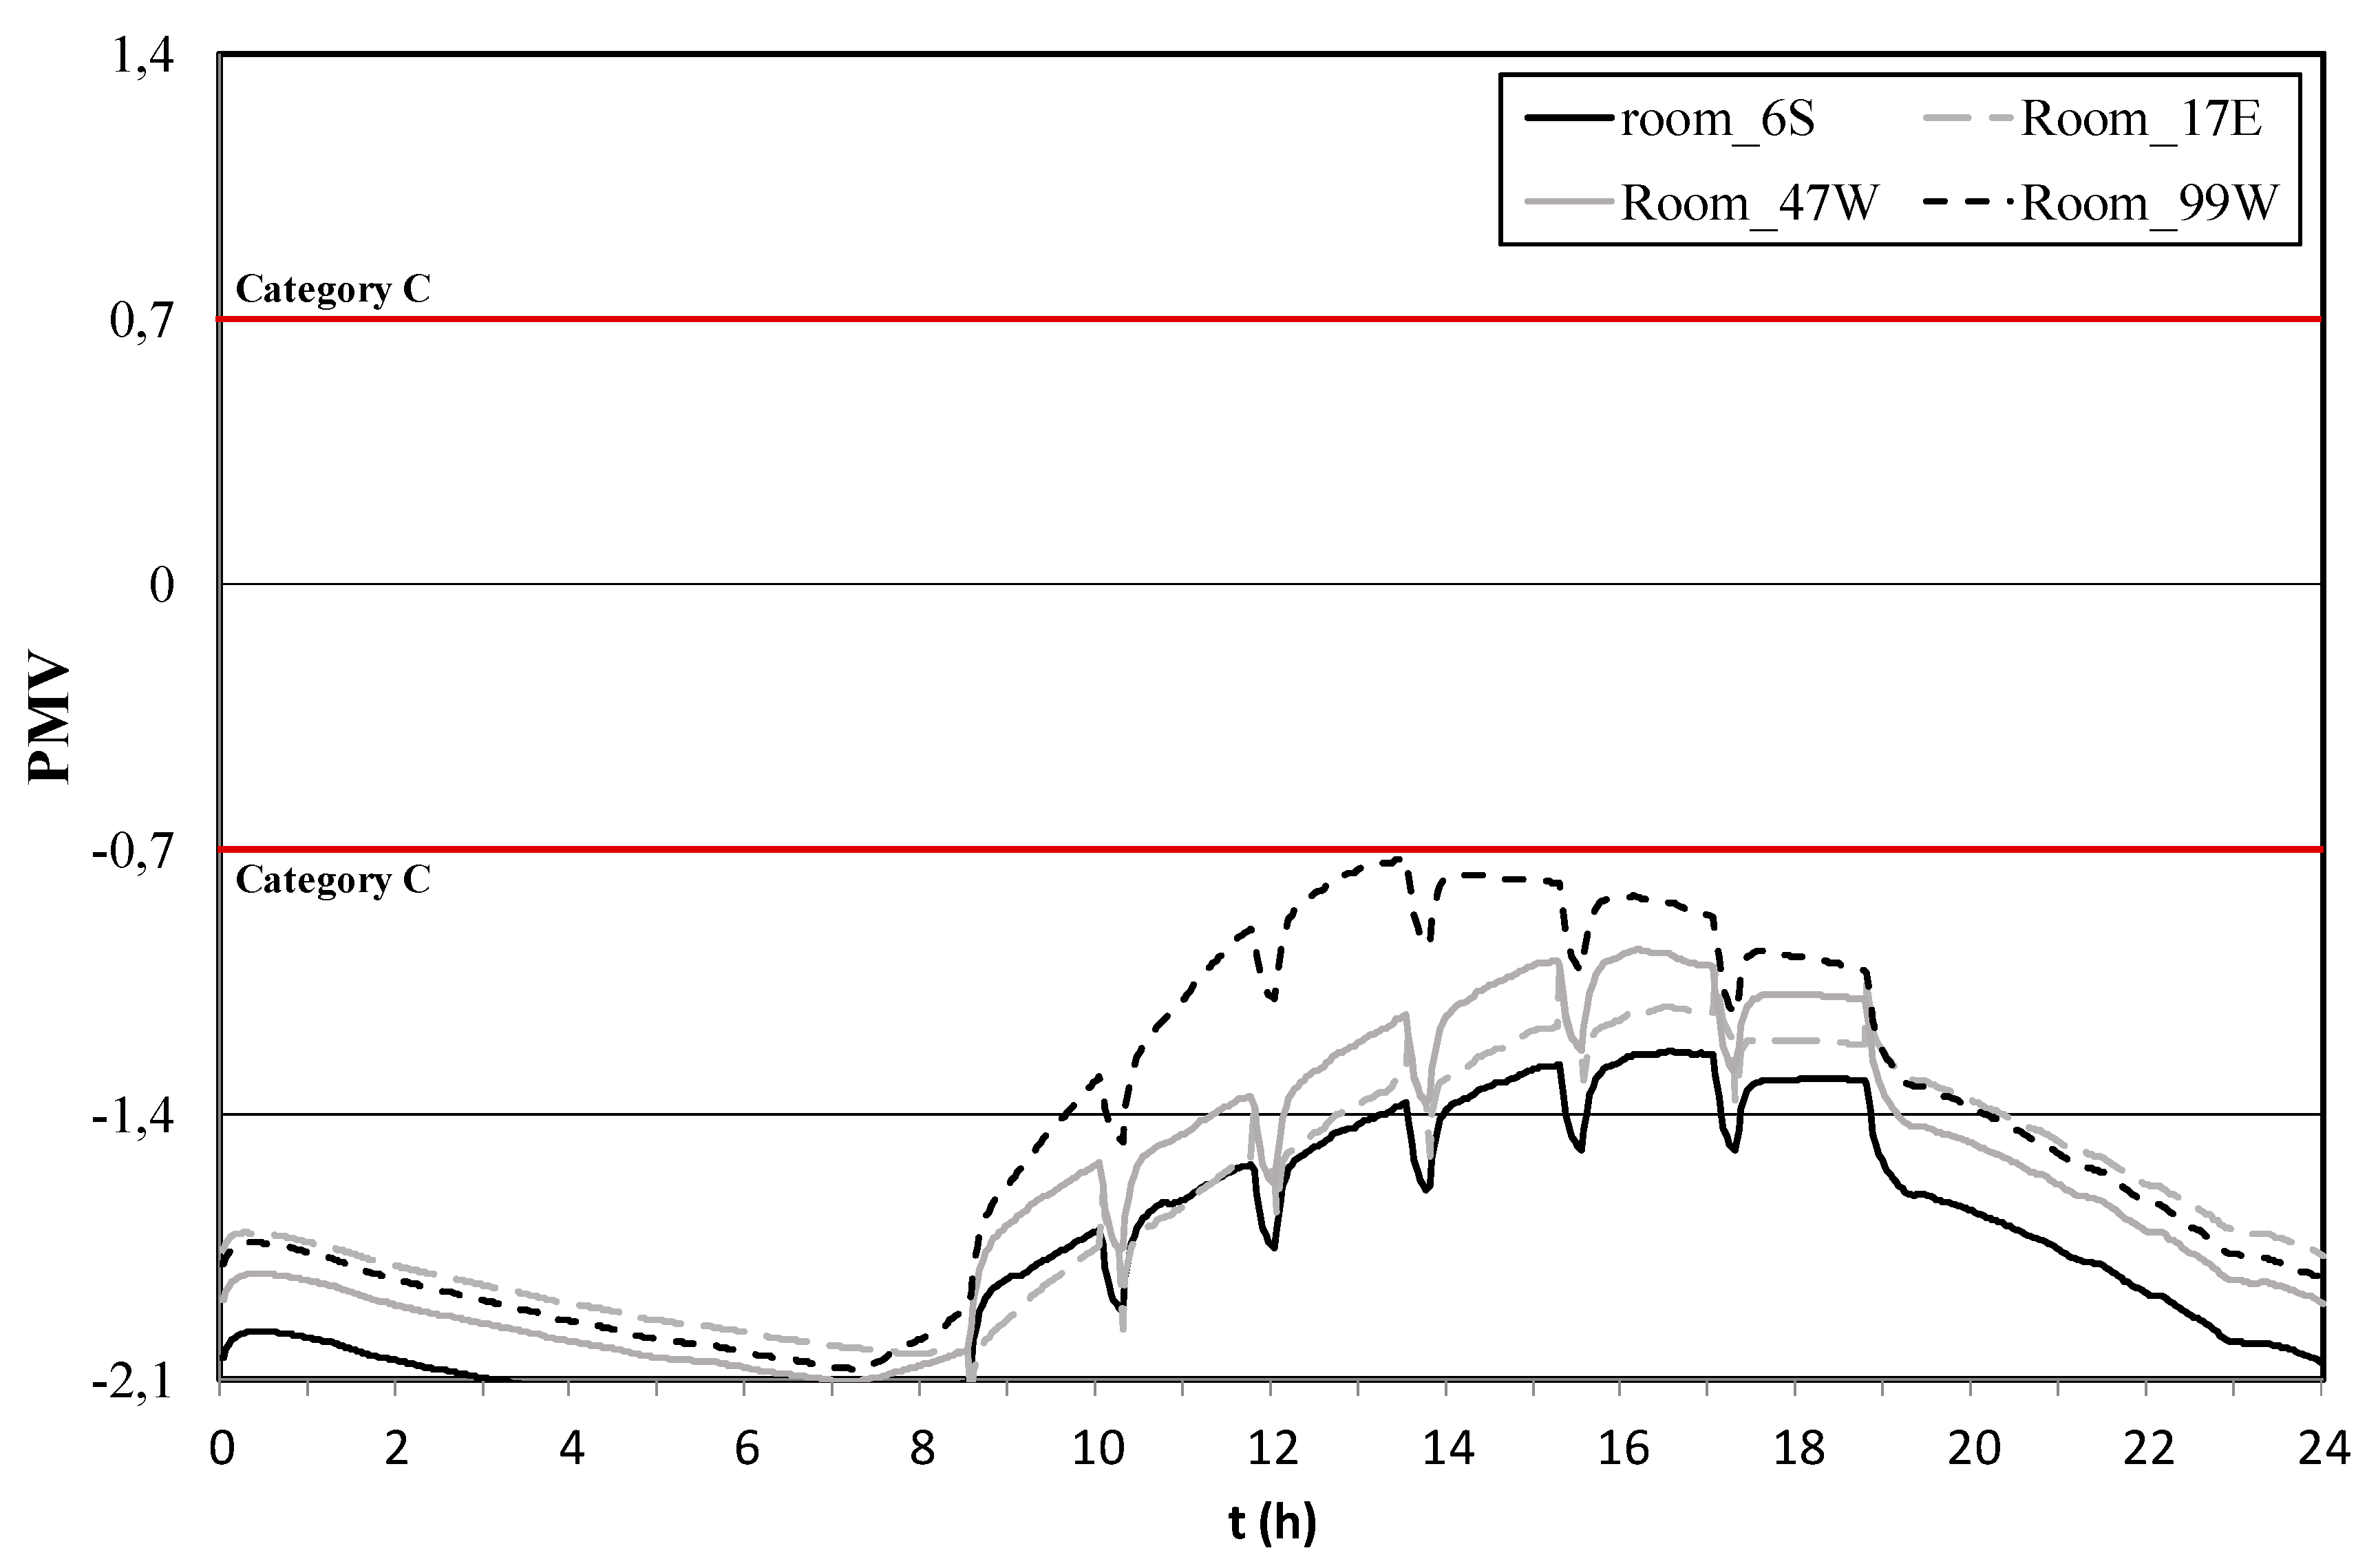
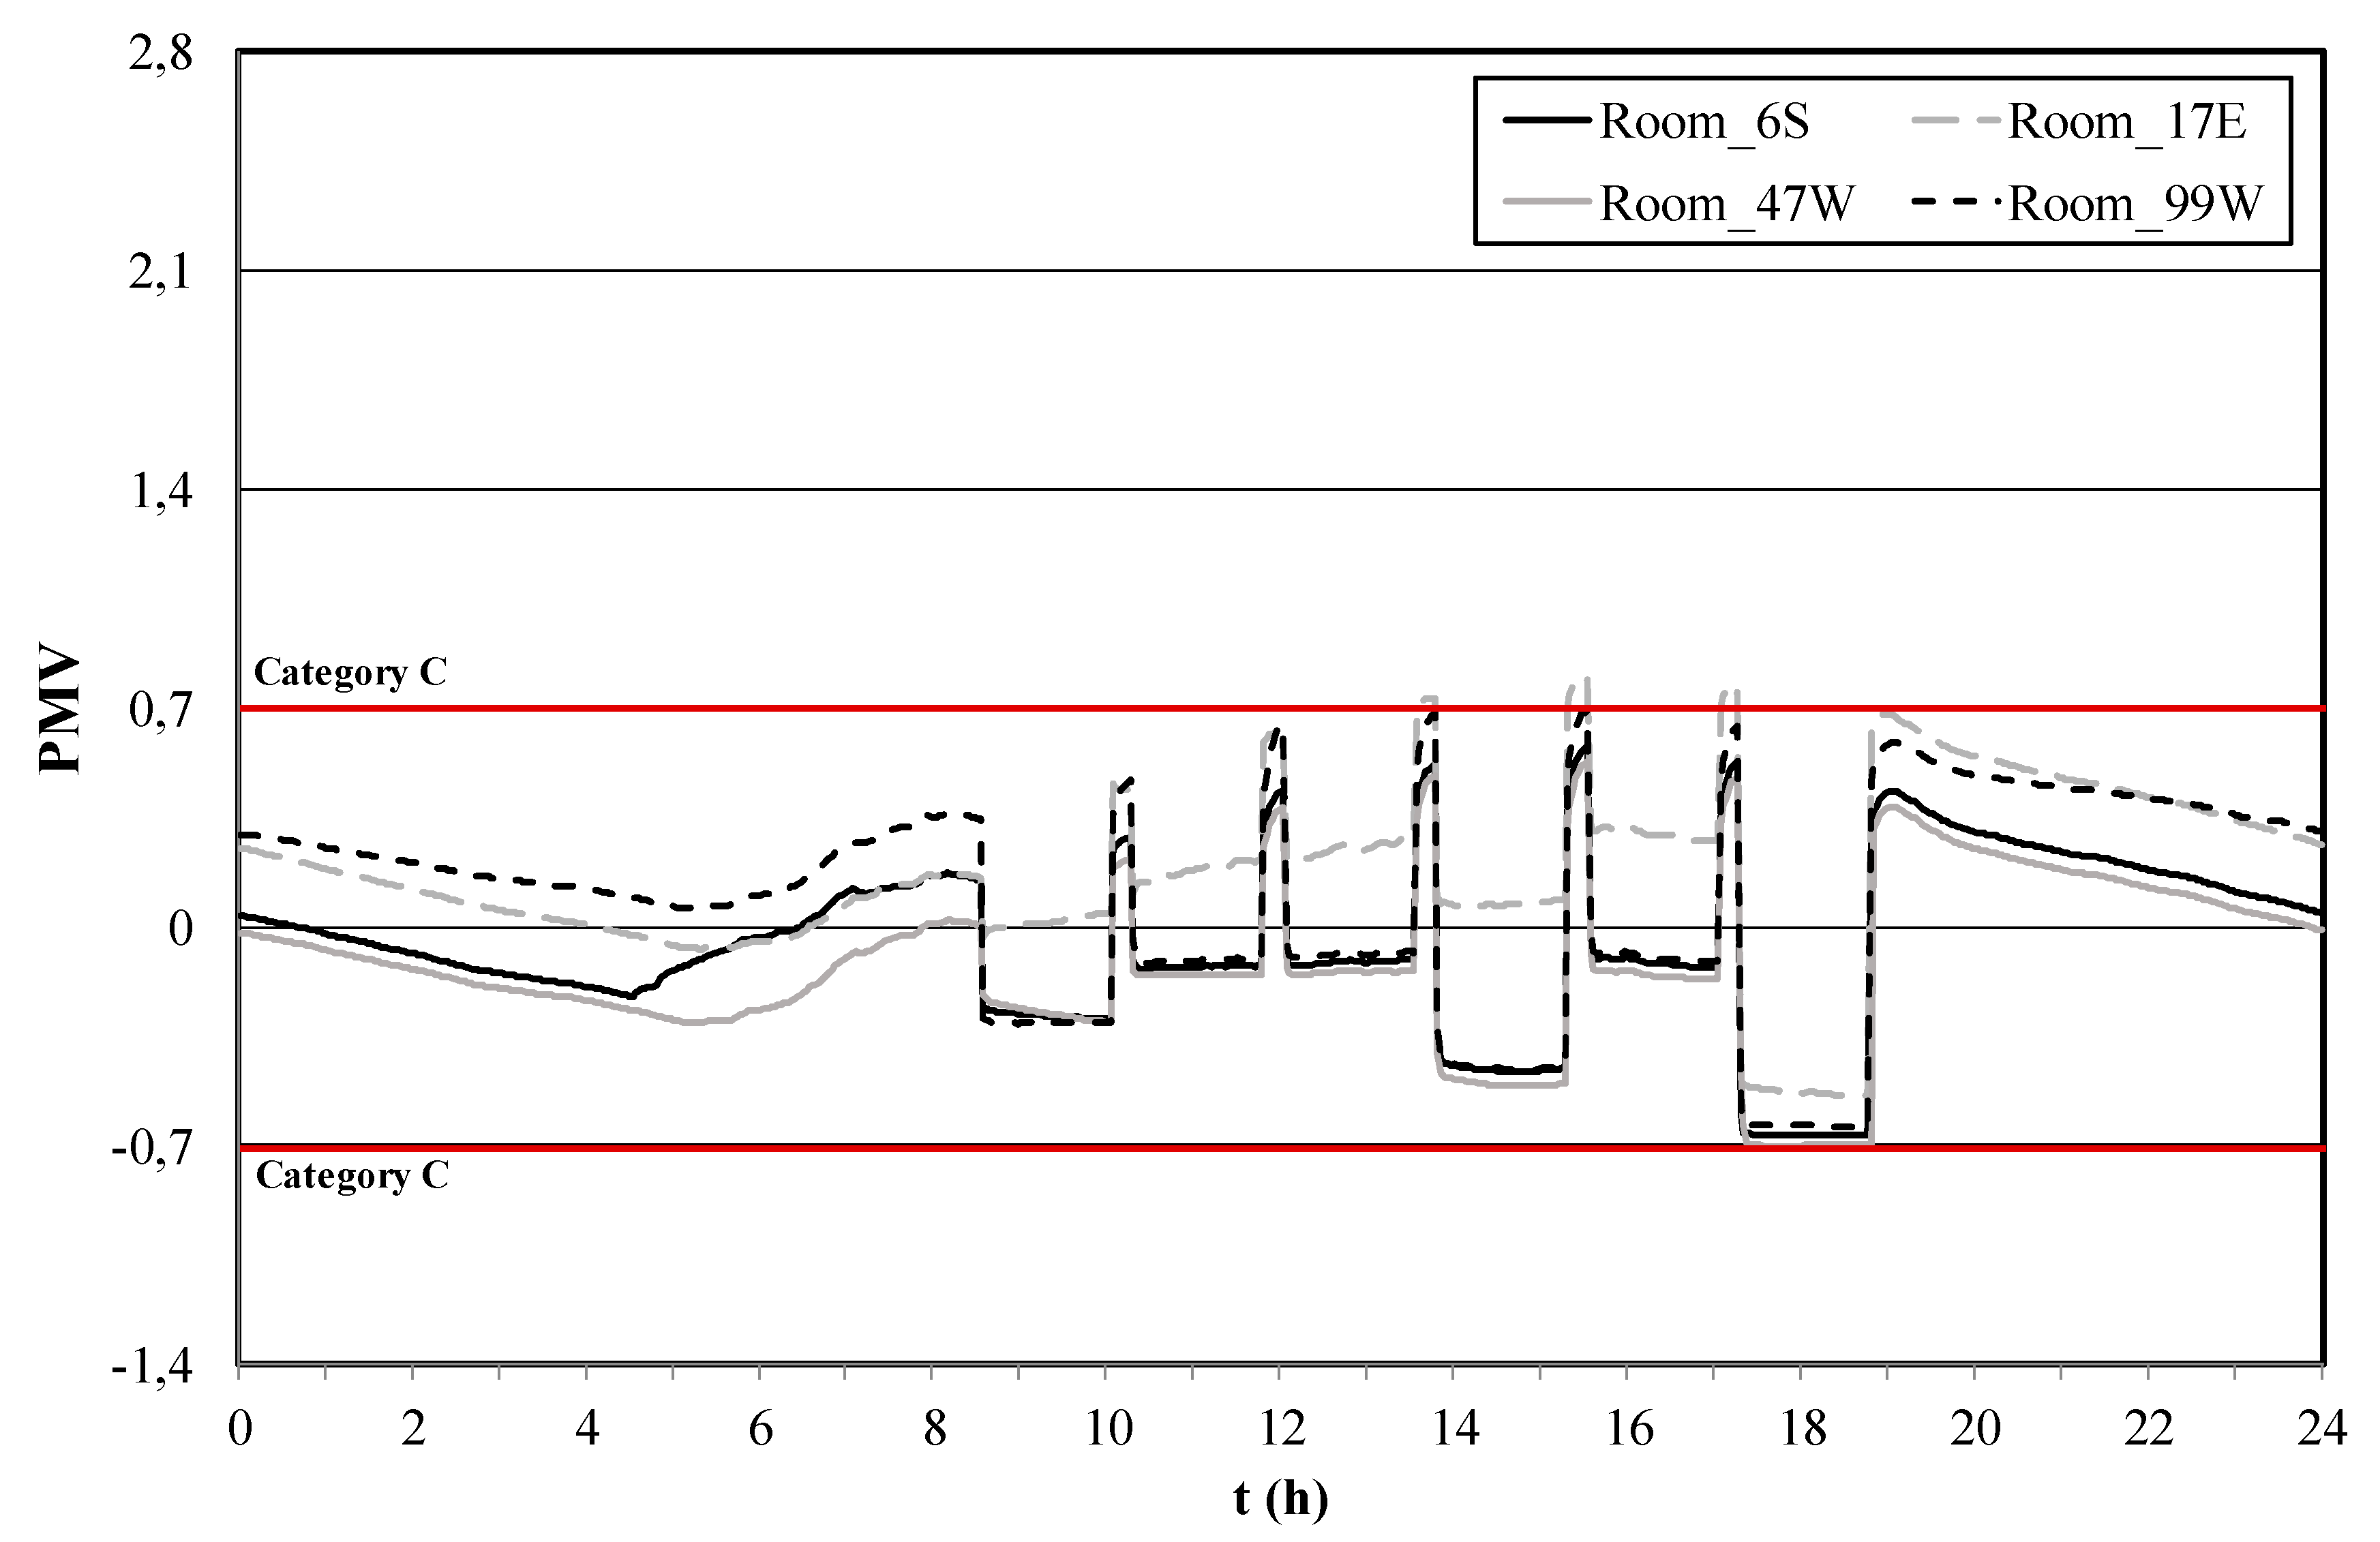
During the occupation period, the use of HVAC system with control by the aPMV index guarantees, both in summer conditions and in winter conditions, that the selected compartments are thermally comfortable, within categories C, or even B [10], by negative aPMV values in winter conditions, and, most of the time, by positive aPMV values in summer conditions. This is more difficult to achieve using PMV control.
Regardless of the control system used (the PMV index or the aPMV index) in the HVAC systems operation, the calculated indoor air temperature values are around 20 °C, in winter conditions, and around 27 °C, in summer conditions, as recommended by the Portuguese standard [43] as comfortably acceptable.
In conclusion, in Mediterranean climates, HVAC systems with aPMV control perform better than HVAC systems with PMV control, not only improving occupants’ thermal comfort levels, but also reducing energy consumption. However, aPMV control can only be used in this type of climate, because the aPMV model was specifically developed for a Mediterranean environment. For other environmental conditions, HVAC systems with PMV control, developed by Fanger for all HVAC systems, should be used.

Author Contributions

E.Z.E.C., A.F.M.S., J.M.M.G., and A.E.R. contributed equally in the preparation of this manuscript.

Funding

This research received no external funding.

Acknowledgments

The authors are grateful for the collaboration of the University Technical Services. The authors acknowledges the support of FCT, through IDMEC, under LAETA, project UID/EMS/50022/2019.

Conflicts of Interest

The authors declare no conflict of interest.

References

  1. Pérez-Lombard, L.; Ortiz, J.; Pout, C. A review on buildings energy consumption information. Energy Build. 2008, 40, 394–398. [Google Scholar] [CrossRef]
  2. Lin, H.-W.; Hong, T. On variations of space-heating energy use in office buildings. Appl. Energy 2014, 111, 515–528. [Google Scholar] [CrossRef]
  3. Nardi, I.; Lucchi, E.; Rubeis, T.; Ambrosini, D. Quantification of heat energy losses through the building envelope. Build. Environ. 2018, 146, 190–205. [Google Scholar] [CrossRef]
  4. Lucchi, E.; Becherini, F.; Di Tuccio, M.; Troi, A.; Frick, J.; Roberti, F.; Bernardi, A. Thermal performance evaluation and comfort assessment of advanced aerogel as blown-in insulation for historic buildings. Build. Environ. 2017, 122, 258–268. [Google Scholar] [CrossRef]
  5. Conceição, E.; Lúcio, M. Numerical study of the influence of opaque external trees with pyramidal shape in the thermal behaviour of a school building in summer conditions. Indoor Built Environ. 2010, 19, 657–667. [Google Scholar] [CrossRef]
  6. Homod, Z.; Sahari, K.; Almurib, H.; Nagi, F. RLF and TS fuzzy model identification of indoor thermal comfort based on PMV/PPD. Build. Environ. 2012, 49, 141–153. [Google Scholar] [CrossRef]
  7. Energias de Portugal. Energy Outlook 2017. Available online: https://www.edp.com/sites/default/files/portal.com/documents/energyoutlook2017_fevereiro2018.pdf (accessed on 15 October 2018). (In Portuguese).
  8. PORDATA. Consumo de Energia Eléctrica por Tipo de Consumo. Available online: https://www.pordata.pt/DB/Portugal/Ambiente+de+Consulta/Tabela (accessed on 16 October 2018). (In Portuguese).
  9. Liang, J.; Du, R. Design of intelligent comfort control system with human learning and minimum power control. Energy Convers. Manag. 2007, 49, 517–528. [Google Scholar] [CrossRef]
  10. ISO 7730. Ergonomics of the Thermal Environments—Analytical Determination and Interpretation of Thermal Comfort Using Calculation of the PMV and PPD Indices and Local Thermal Comfort Criteria; International Standard: Geneva, Switzerland, 2005. [Google Scholar]
  11. Fanger, P. Thermal Comfort; Danish Technical Press: Copenhagen, Denmark, 1970. [Google Scholar]
  12. ASHRAE Standard 55. Thermal Environmental Conditions for Human Occupancy; American Society of Heating, Refrigerating and Air-Conditioning Engineers: Atlanta, GA, USA, 2013. [Google Scholar]
  13. de Dear, R.; Brager, G. Developing an adaptive model of thermal comfort and preference. Ashrae Trans. 1998, 104, 145–167. [Google Scholar]
  14. Conceição, E.; Gomes, J.; Antão, N.; Lúcio, M. Application of a developed adaptive model in the evaluation of thermal comfort in ventilated kindergarten occupied spaces. Build. Environ. 2012, 50, 190–201. [Google Scholar] [CrossRef]
  15. de Dear, R.; Brager, G. The adaptive model of thermal comfort and energy conservation in the built environment. Int. J. Biometeorol. 2001, 45, 100–108. [Google Scholar] [CrossRef] [Green Version]
  16. Nicol, F. Adaptive thermal comfort standards in the hot-humid tropics. Energy Build. 2004, 36, 628–637. [Google Scholar] [CrossRef]
  17. Van der Linden, A.; Boerstra, A.; Raue, A.; Kurvers, S.; de Dear, R. Adaptive temperature limits: A new guideline in the Netherlands: A new approach for the assessment of building performance with respect to thermal indoor climate. Energy Build. 2006, 38, 8–17. [Google Scholar] [CrossRef]
  18. Yao, R.; Li, B.; Liu, J. A theoretical model of thermal comfort—Adaptive Predicted Mean Vote (aPMV). Build. Environ. 2009, 44, 2089–2096. [Google Scholar] [CrossRef]
  19. Singh, M.; Mahapatra, S.; Atreya, S. Adaptive thermal comfort model for different climatic zones of North-East India. Appl. Energy 2011, 88, 2420–2428. [Google Scholar] [CrossRef]
  20. Conceição, E.; Nunes, A.; Gomes, J.; Lúcio, M. Application of a school building thermal response numerical model in the evolution of the adaptive thermal comfort in the Mediterranean environment. Int. J. Vent. 2010, 9, 287–304. [Google Scholar] [CrossRef]
  21. Yao, R.; Li, B.; Liu, J. Occupants’ adaptive responses and perception of thermal environment in naturally conditioned university classrooms. Appl. Energy 2010, 87, 1015–1022. [Google Scholar] [CrossRef]
  22. Xu, W.; Chen, X.; Zhao, J. An adaptive Predicted Mean Vote (aPMV) model in office. In Proceedings of the International Conference on Mechanic Automation and Control Engineering (MACE 2010), Wuhan, China, 26–28 June 2010. [Google Scholar]
  23. Jung, G.; Song, S.; Ahn, Y.; Oh, G.; Im, Y. Experimental research on thermal comfort in the university classroom of regular semesters in Korea. J. Mech. Sci. Technol. 2011, 25, 503–512. [Google Scholar] [CrossRef]
  24. Conceição, E.; Gomes, J.; Ruano, A. Application of HVAC systems with control based on PMV index in university buildings with complex topology. In Proceedings of the 3rd IFAC Conference on Embedded Systems, Computational Intelligence and Telematics (CESCIT 2018), Faro, Portugal, 6–8 June 2018. [Google Scholar]
  25. Afroz, Z.; Shafiullah, G.; Urmee, T.; Higgins, G. Modeling techniques used in building control systems: A review. Renew. Sustain. Energy Rev. 2018, 83, 64–68. [Google Scholar] [CrossRef]
  26. Satyavada, H.; Baldi, S. An integrated control-oriented modelling for HVAC performance benchmarking. J. Build. Eng. 2016, 6, 262–273. [Google Scholar] [CrossRef] [Green Version]
  27. Ferreira, P.; Ruano, A.; Silva, S.; Conceição, E. Neural networks based predictive control for thermal comfort and energy saving in public buildings. Energy Build. 2012, 55, 238–251. [Google Scholar] [CrossRef]
  28. Ruano, A.E.; Pesteh, S.; Silva, S.; Duarte, H.; Mestre, G.; Ferreira, P.M.; Horta, R. The IMBPC HVAC system: A complete MBPC solution for existing HVAC systems. Energy Build. 2016, 120, 145–158. [Google Scholar] [CrossRef]
  29. Ruano, A.; Silva, S.; Duarte, H.; Ferreira, P. Wireless Sensors and IoT Platform for Intelligent HVAC Control. Appl. Sci. 2018, 8, 370. [Google Scholar] [CrossRef]
  30. Mestre, G.; Ruano, A.; Duarte, H.; Silva, S.; Khosravani, H.; Pesteh, S.; Horta, R. An Intelligent Weather Station. Sensors 2015, 15, 31005–31022. [Google Scholar] [CrossRef] [PubMed] [Green Version]
  31. Ku, K.; Liaw, J.; Tsiai, M.; Liu, T. Automatic control system for thermal comfort based on Predicted Mean Vote and energy saving. IEEE Trans. Autom. Sci. Eng. 2015, 12, 378–383. [Google Scholar] [CrossRef]
  32. Xu, Z.; Hu, G.; Spanos, C.; Schiavon, S. PMV-based event-triggered mechanism for building energy management under uncertainties. Energy Build. 2017, 152, 73–85. [Google Scholar] [CrossRef] [Green Version]
  33. Guo, W.; Zhou, M. Technologies toward thermal comfort-based and energy-efficient HVAC systems: A review. In Proceedings of the 2009 IEEE International Conference on Systems, Man, and Cybernetics, San Antonio, TX, USA, 11–14 October 2009. [Google Scholar]
  34. Moon, J.; Jung, S. Development of a thermal control algorithm using artificial neural network models for improved thermal comfort and energy efficiency in accommodation buildings. Appl. Therm. Eng. 2016, 103, 1135–1144. [Google Scholar] [CrossRef]
  35. Homod, R. Analysis and optimization of HVAC control systems based on energy and performance considerations for smart buildings. Renew. Energy 2018, 126, 49–64. [Google Scholar] [CrossRef]
  36. Schirrer, A.; Branstetter, M.; Leobner, I.; Hauer, S.; Kozek, M. Nonlinear model predictive control for a heating and cooling system of a low-energy office building. Energy Build. 2016, 125, 86–98. [Google Scholar] [CrossRef]
  37. Conceição, E. Numerical simulation of building thermal behavior and human thermal comfort multi-node models. In Proceedings of the 8th International IBPSA Conference Building Simulation (BS2003), Eindhoven, Netherlands, 11–14 August 2003. [Google Scholar]
  38. Conceição, E.; Lúcio, M. Numerical study of the thermal efficiency of a school building with complex topology for different orientations. Indoor Built Environ. 2009, 18, 41–51. [Google Scholar] [CrossRef]
  39. Conceição, E.; Silva, A.; Lúcio, M. Numerical study of thermal response of school buildings in winter conditions. In Proceedings of the 9th Conference on Air Distribution in Rooms (Roomvent 2004), Coimbra, Portugal, 5–8 September 2004. [Google Scholar]
  40. Conceição, E.; Lúcio, M. Numerical study of thermal response of school buildings in summer conditions. In Proceedings of the 8th International Conference and Exhibition on Healthy Buildings (HB 2006), Lisbon, Portugal, 4–8 June 2006. [Google Scholar]
  41. Iqbal, M. An Introduction to Solar Radiation; Academic Press: Toronto, ON, Canada, 1983. [Google Scholar]
  42. Portaria No. 353-A/2013. Requisitos de Ventilação e Qualidade do ar Interior; Diário da República No. 235/2013, 1° Suplemento, Série I de 2013-12-04; Portuguese Law: Lisboa, Portugal, 2013. (In Portuguese)
  43. Portaria No. 349-D/2013. Requisitos de Conceção Relativos à Qualidade Térmica da Envolvente e à Eficiência dos Sistemas Técnicos dos Edifícios Novos, dos Edifícios Sujeitos a Grande Intervenção e dos Edifícios Existentes; Diário da República No. 233/2013, 2° Suplemento, Série I de 2013-12-02; Portuguese Law: Lisboa, Portugal, 2013. (In Portuguese)
Figure 1. Perspective of the university building.
Inventions 04 00003 g001
Figure 2. Structure of the university building.
Inventions 04 00003 g002
Figure 3. Methodology implemented in this work.
Inventions 04 00003 g003
Figure 4. Heating, Ventilation and Air Conditioning (HVAC) system off: numerical indoor air temperature evolution obtained for a typical summer day.
Inventions 04 00003 g004
Figure 5. HVAC system off: Predicted Mean Vote (PMV) index evolution obtained for a typical summer day.
Inventions 04 00003 g005
Figure 6. HVAC system off: numerical indoor air temperature evolution obtained for a typical winter day.
Inventions 04 00003 g006
Figure 7. HVAC system off: PMV index evolution obtained for a typical winter day.
Inventions 04 00003 g007
Figure 8. HVAC system operation with PMV index control: numerical indoor air temperature evolution obtained for a typical summer day.
Inventions 04 00003 g008
Figure 9. HVAC system operation with PMV index control: PMV index evolution obtained for a typical summer day.
Inventions 04 00003 g009
Figure 10. HVAC system operation with PMV index control: power consumption evolution obtained for a typical summer day.
Inventions 04 00003 g010
Figure 11. HVAC system operation with PMV index control: numerical indoor air temperature evolution obtained for a typical winter day.
Inventions 04 00003 g011
Figure 12. HVAC system operation with PMV index control: PMV index evolution obtained for a typical winter day.
Inventions 04 00003 g012
Figure 13. HVAC system operation with PMV index control: power consumption evolution obtained for a typical winter day.
Inventions 04 00003 g013
Figure 14. HVAC system operation with aPMV index control: numerical indoor air temperature evolution obtained for a typical summer day.
Inventions 04 00003 g014
Figure 15. HVAC system operation with aPMV index control: aPMV index evolution obtained for a typical summer day.
Inventions 04 00003 g015
Figure 16. HVAC system operation with aPMV index control: power consumption evolution obtained for a typical summer day.
Inventions 04 00003 g016
Figure 17. HVAC system operation with aPMV index control: numerical indoor air temperature evolution obtained for a typical winter day.
Inventions 04 00003 g017
Figure 18. HVAC system operation with aPMV index control: aPMV index evolution obtained for a typical winter day.
Inventions 04 00003 g018
Figure 19. HVAC system operation with aPMV index control: power consumption evolution obtained for a typical winter day.
Inventions 04 00003 g019
Table 1. Occupation cycle of the building analyzed spaces.
Time (hours)0 to 8:308:30 to 1010 to 10:1510:15 to 11:4511:45 to 1212 to 13:3013:30 to 13:4513:45 to 15:15115:15 to 15:3015:30 to 1717 to 17:1517:15 to 18:4518:45 to 1919 to 20:3020:30 to 24
SpacesNumber of occupants
6(S)015015015015015015000
17(E)015015015015015015000
47(W)015015015015015015000
99(W)015015015015015015000
Table 2. Daily energy consumption (E) and the energy consumption by room volume (E/V) for each compartment, in summer conditions (PMV control).
CompartmentE (kWh)E/V (kWh/m3)
626.850.142
1720.760.225
4724.900.123
9934.770.191
Table 3. Daily energy consumption (E) and the energy consumption by room volume (E/V) for each compartment, in winter conditions (PMV control).
CompartmentE (kWh)E/V (kWh/m3)
630.540.162
1716.230.176
4725.320.125
9921.510.118
Table 4. Energy consumption (E) and the energy consumption by room volume (E/V) for each compartment, in summer conditions (aPMV control).
CompartmentE (kWh)E/V (kWh/m3)
624.560.130
1717.090.185
4723.280.115
9930.550.167
Table 5. Daily energy consumption (E) and the energy consumption by room volume (E/V) for each compartment, in winter conditions (aPMV control).
CompartmentE (kWh)E/V (kWh/m3)
626.950.143
1714.000.151
4722.960.113
9919.140.105
Table 6. Daily energy consumption (kWh) for each compartment and energy consumption totals (kWh), in summer and winter conditions, for control by PMV index and by aPMV index.
CompartmentPMV Index ControlaPMV Index Control
SummerWinterSummerWinter
626.8530.5424.5626.95
1720.7616.2317.0914.00
4724.9025.3223.2822.96
9934.7721.5130.5519.14
Total107.393.695.583.0

