Article

Improving Fabrication and Performance of Additively Manufactured RF Cavities by Employing Co-Printed Support Structures and Their Subsequent Removal

1
Institute for Applied Physics and Measurement Technology (LRT2), Universität der Bundeswehr München, Werner-Heisenberg-Weg 39, 85577 Neubiberg, Germany
2
Institute for Design and Production Engineering, Universität der Bundeswehr München, Werner-Heisenberg-Weg 39, 85577 Neubiberg, Germany
3
RENA Technologies Austria GmbH, Samuel-Morse-Straße 1, 2700 Wiener Neustadt, Austria
4
FKM Sintertechnik GmbH, Zum Musbach 6, 35216 Biedenkopf, Germany
*
Author to whom correspondence should be addressed.
Instruments 2024, 8(1), 18; https://doi.org/10.3390/instruments8010018
Submission received: 16 December 2023 / Revised: 21 February 2024 / Accepted: 23 February 2024 / Published: 1 March 2024

Abstract

:
The enormous potential of additive manufacturing (AM), particularly laser powder bed fusion (L-PBF), to produce radiofrequency cavities (cavities) has already been demonstrated. However, the required geometrical accuracy for GHz T M 010 cavities is currently only achieved by (a) avoiding downskin angles < 40 , which in turn leads to a cavity geometry with reduced performance, or (b) co-printed support structures, which are difficult to remove for small GHz cavities. We have developed an L-PBF-based manufacturing routine to overcome this limitation. To enable arbitrary geometries, co-printed support structures are used that are designed in such a way that they can be removed after printing by electrochemical post-processing, which simultaneously reduces the surface roughness and thus maximizes the quality factor Q 0 . The manufacturing approach is evaluated on two T M 010 single cavities printed entirely from high-purity copper. Both cavities achieve the desired resonance frequency and a Q 0 of approximately 8300.

1. Introduction

Around the world, 35,000 particle accelerators are used to propel charged particles (e.g., electrons, protons) to high energies [1,2]. They are indispensable for accelerator-based research, medical applications such as radiotherapy for cancer, or industrial applications like X-ray inspection [1,3,4,5,6]. The fundamental components of most linear particle accelerator (Linacs) are radiofrequency (RF) cavities made of conductive material like copper or niobium. To accelerate charged particles, a sinusoidal alternating signal (RF signal) with a frequency corresponding to the resonance frequency f R of the cavity is coupled into the cavity, resulting in a high-gradient electromagnetic (EM) field [1].
In conventional manufacturing, cavities are manufactured from numerous individual parts due to their complex internal geometry, essential for generating high E-field strengths or cooling. The individual parts must be joined through processes such as brazing, electron beam welding or similar methods to achieve vacuum tightness and maximum electrical conductivity. This multi-stage manufacturing process limits the freedom in design and thus new innovative cavity concepts required for linacs with, for example, lower energy consumption or longer operating times [2,7,8,9]. Moreover, the conventional manufacturing process is responsible for over 35% of the investment costs for Linacs [10,11,12], which can be significantly reduced through additive manufacturing.
In comparison to traditional manufacturing processes, additive manufacturing (AM, 3D printing) presents numerous advantages. The capability to fabricate intricate geometries in a single piece allows for performance optimization of components, eliminating the need for expensive tooling and minimizing material consumption. Additionally, AM enables repid prototyping and decentralized production which significantly expediting the product development process [13,14].
The latest research results obtained on various cavity prototypes indicate that additive manufacturing has the potential to overcome the limitations of the conventional manufacturing process [15,16,17,18,19,20,21,22,23]. For example, the laser powder bed fusion process (L-PBF, also known as PBF-LB) [13,24,25] makes it possible to manufacture cavities made of high-purity copper, including the internal geometry, in one piece [22,23]. Thereby, geometrical accuracy sufficient for resonance frequencies f R < 4 GHz and quality factors ( Q 0 ) comparable to conventionally manufactured structures is achieved [22,23]. As depicted in Figure 1, a limitation of L-PBF is the necessity for support structures to prevent overhangs, commonly referred to as downskin sections, from deforming as they are printed onto the loose powder bed. A downskin surface with an angle of approximately α > 40 between the building platform (black) and the downskin surface allows for high quality (Figure 1a). Without a support structure, a downskin angle α < 40 results in the irregular and rough production of the desired topology (Figure 1b).
The removal of support structures from centimeter-sized GHz cavities has always been considered a major challenge. Therefore, a design guide for self-supporting cavity geometries with the condition α > 40 was developed [26]. However, this condition results in a reduction in Q 0 by up to 18% in the case of T M 010 cavities and thus limits the potential of AM for cavity manufacturing [27].
Figure 1. Representation of four printed layers (brown) creating an overhang with an angle α relative to the building platform (black). (a) Optimal print quality is achievable with a larger α . (b) Layer deformation becomes more pronounced as α decreases. (c) The introduction of a support structure (blue) is necessary to maintain print quality when α < 40 . The graphic was adapted from [27].
Instruments 08 00018 g001
In this article, we present a manufacturing routine based on L-PBF and an electrochemical post-processing method that allows the realization of arbitrary cavity geometries with the assistance of co-printed support structures. However, the co-printed support structures are designed in such a way that subsequent removal is possible in the cavity with the electrochemical post-processing method (Hirtisation (R)) [28]. This approach is demonstrated using two identical T M 010 3 GHz single-cell cavities (SC), as commonly employed in, e.g., Drift Tube Linac (DTL) or Coupled Cavity Linac (CCL) structures [1]. Both SCs were manufactured from high-purity copper. Their performance is evaluated through RF measurements. Subsequently, the measurements are compared with CST Microwave Studio (R) (CST) simulations [29].

2. Materials and Methods

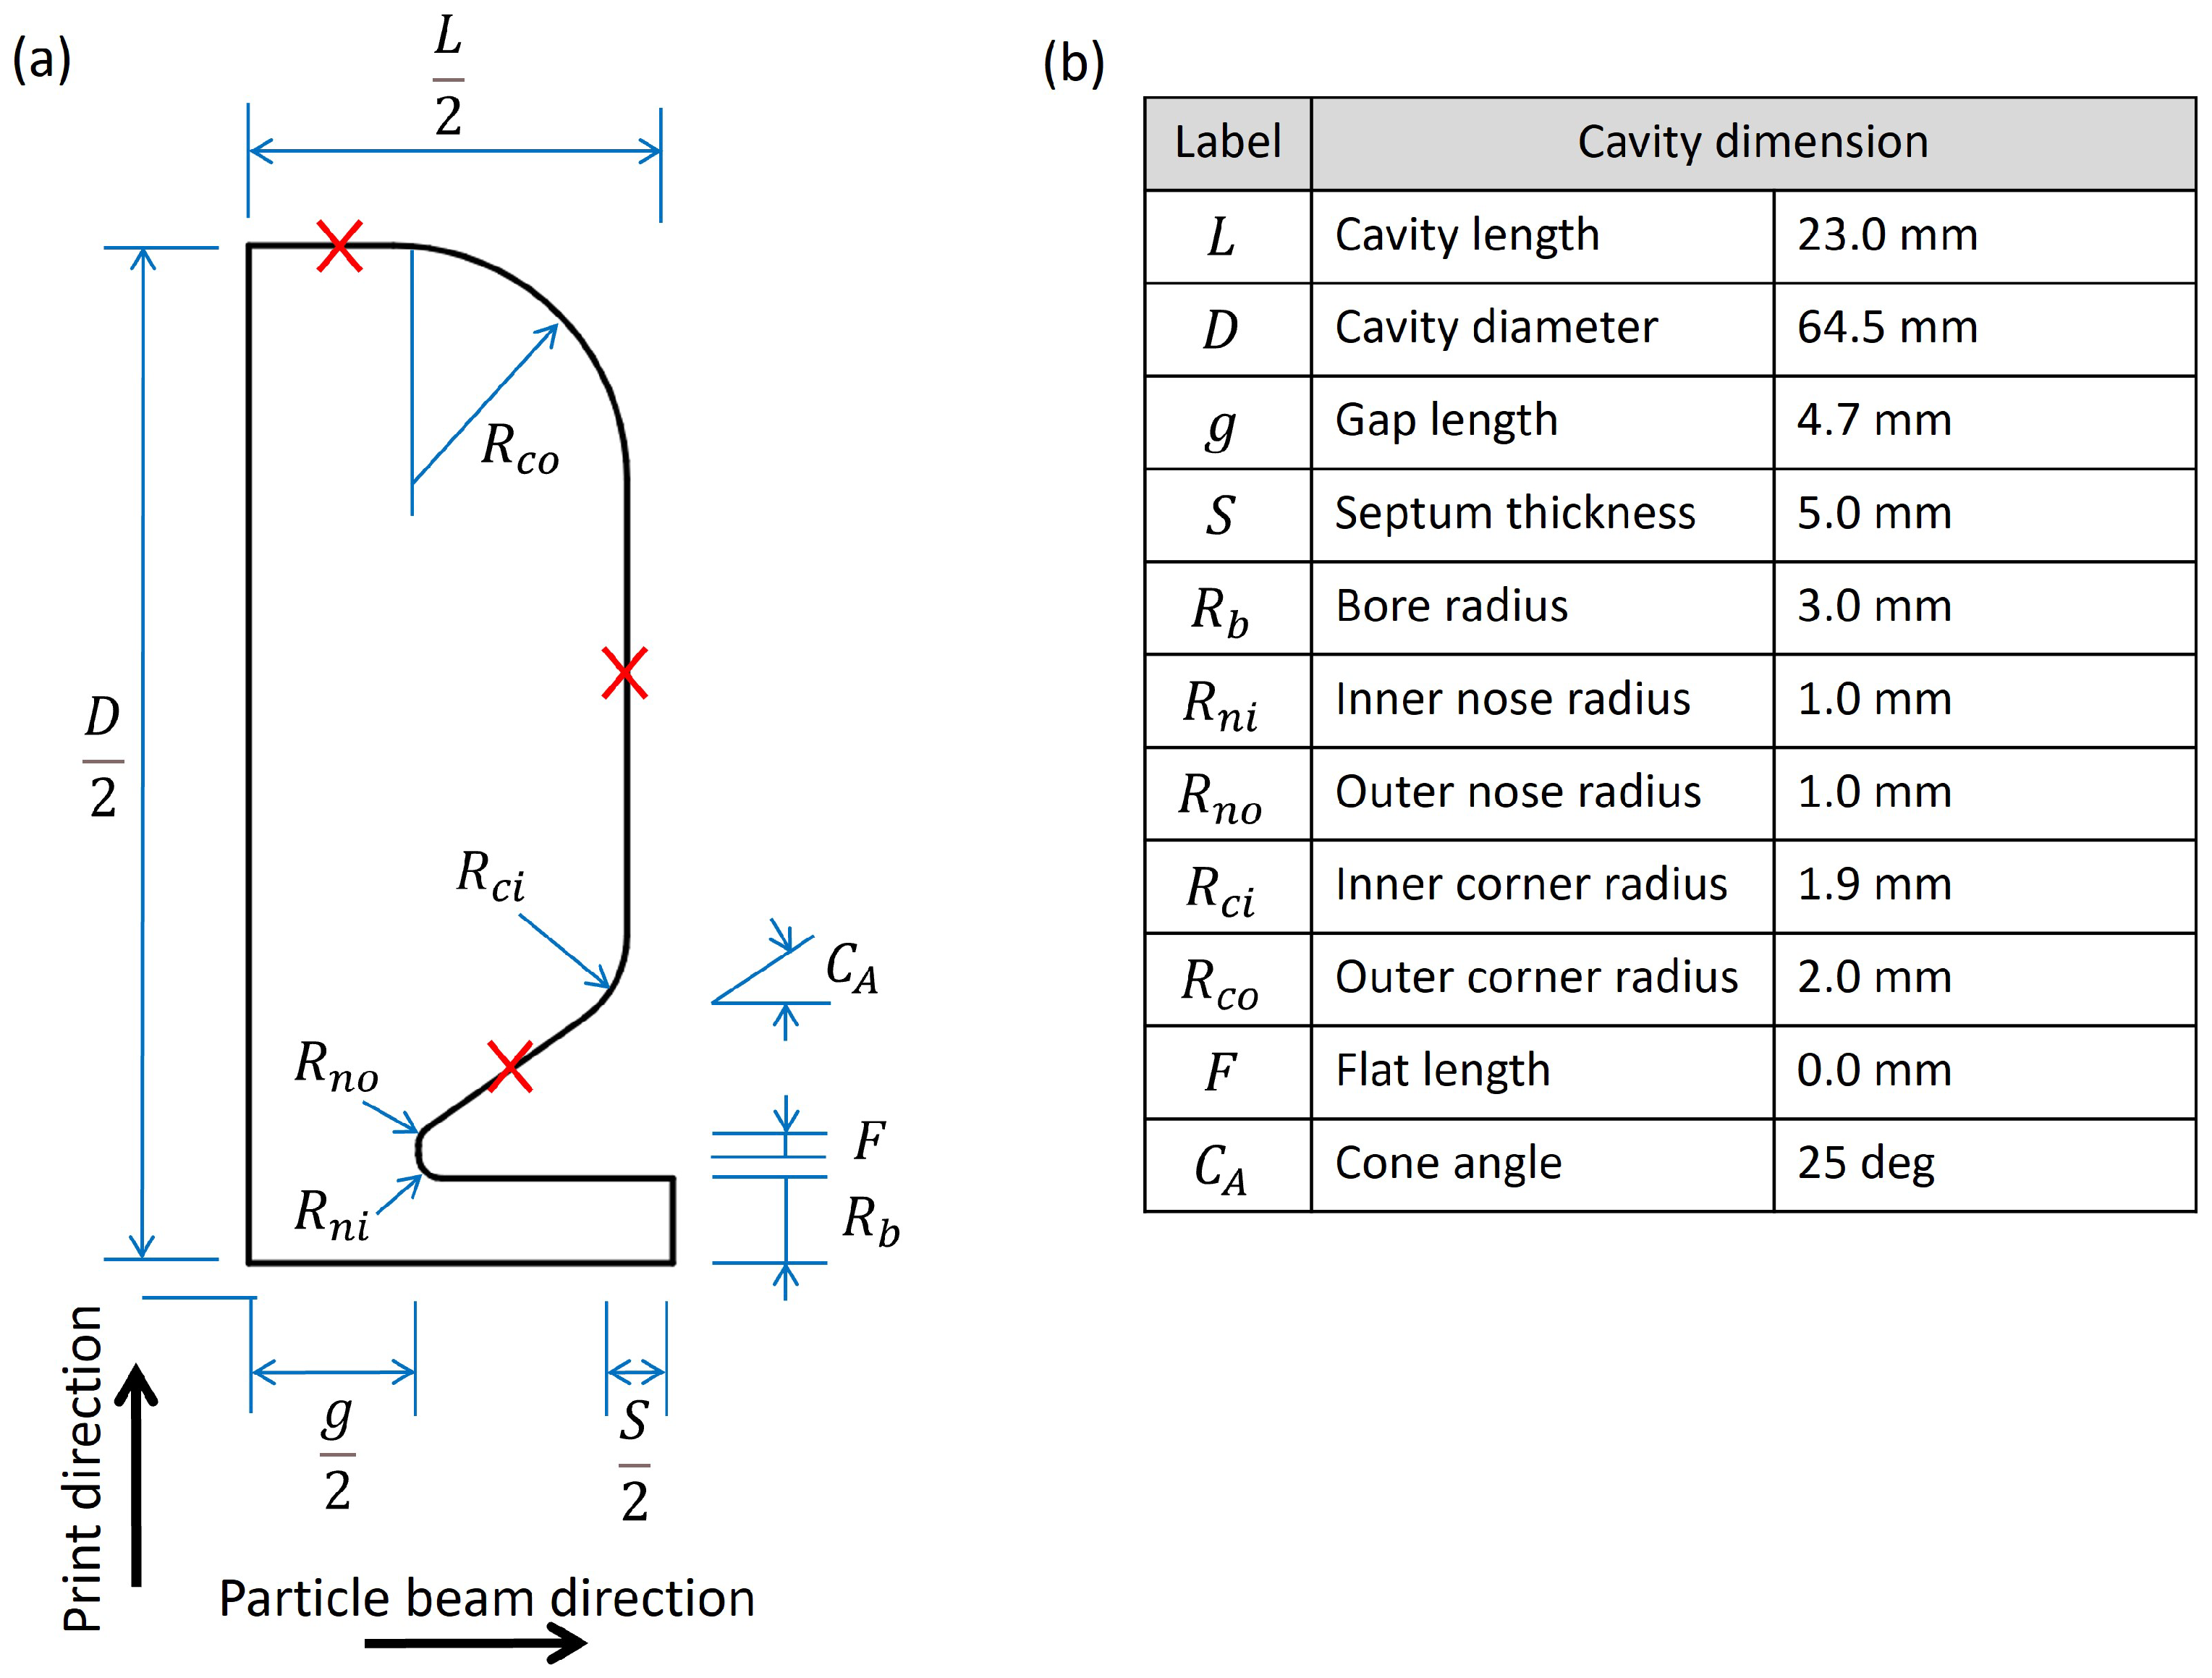
2.1. Cavity Design and Electromagnetic (EM) Simulation

The cavity design is based on a typical rudimentary geometry of a single T M 010 accelerator cell, as specified, for example, in the Poisson Superfish cavity design software [30] (see Figure 2a). All electromagnetic (EM) simulations for this work were conducted using the Eigenmode solver or frequency domain solver of the 3D EM analysis tool CST Microwave Studio (R).
We aimed to achieve an f R of 2997.9 MHz for the SCs, which corresponds to the operating frequency of ”3 GHz” Linac systems for medical radiotherapy [31,32]. However, in the case of the SCs, the goal is to attain this f R at normal pressure to simplify the RF measurements. f R is proportional to 1 L C , where L corresponds to the inductance and C to the capacitance of a cavity. The capacitance C is primarily influenced by the nose cone’s distance and shape, while the inductance L is mainly determined by the cavity’s diameter. Changes in L or C depend on relative alterations in the geometric dimensions. Consequently, an increase in f R is anticipated, given that the greatest impact is expected from the relative change in the geometric parameter g. Previous prototypes manufactured with the same post-processing method show a frequency shift in dependence on the material removal ( M R ) (by Hirtisation (R)) of approximately + 0.18 MHz μ m [22]. To provide enough material for the removal of the support structure and the reduction of the surface roughness, a f R reduced by 60 MHz to 2937.9 MHz was planned for printing.
The table in Figure 2b displays the geometry parameters of the SCs that CST simulated with f R = 2937.92 MHz. The parameters largely correspond to the single cavities used in 3 GHz side-coupled cavity Linacs (SCCL) as part of Linac-based proton therapy systems [31,32]. In terms of electromagnetic properties, it can therefore be assumed that the SC geometry is optimized. The cavity length L was set to 23 mm, corresponding to proton energy of about 26 MeV in a 2 π -mode Linac ( β p r o t o n 0.23 ). The printing direction was chosen perpendicular to the beam axis.

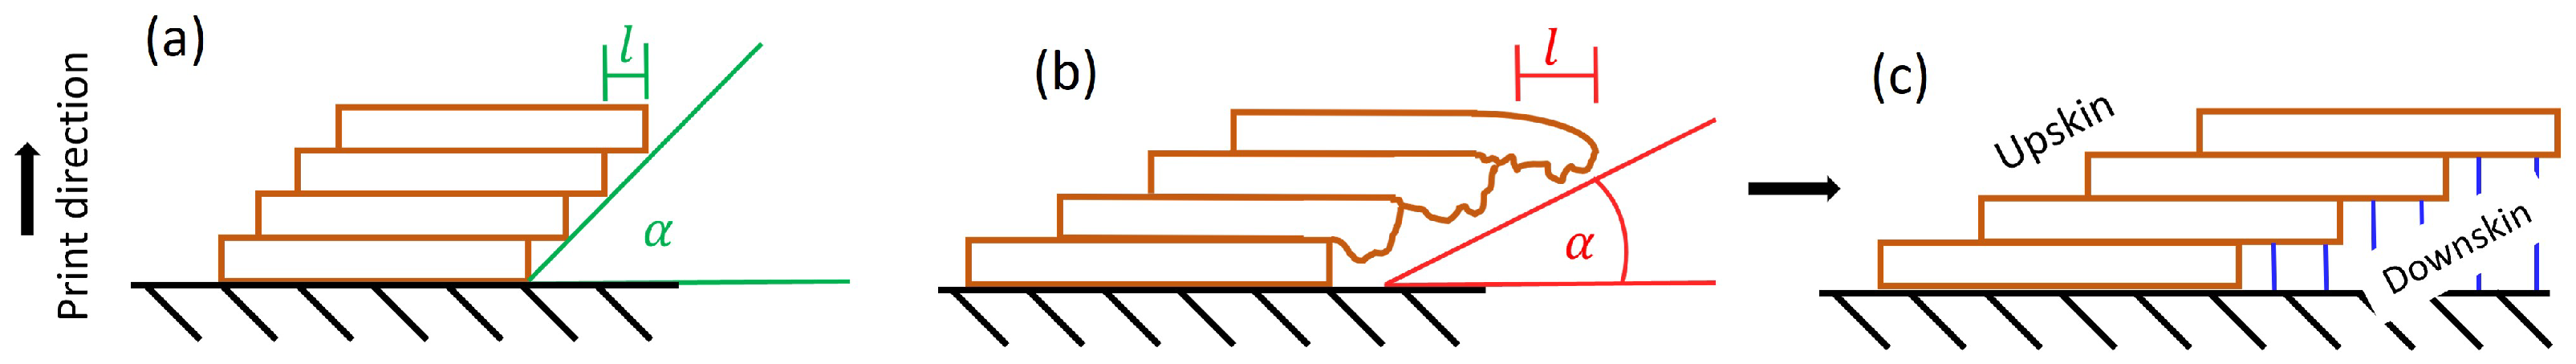
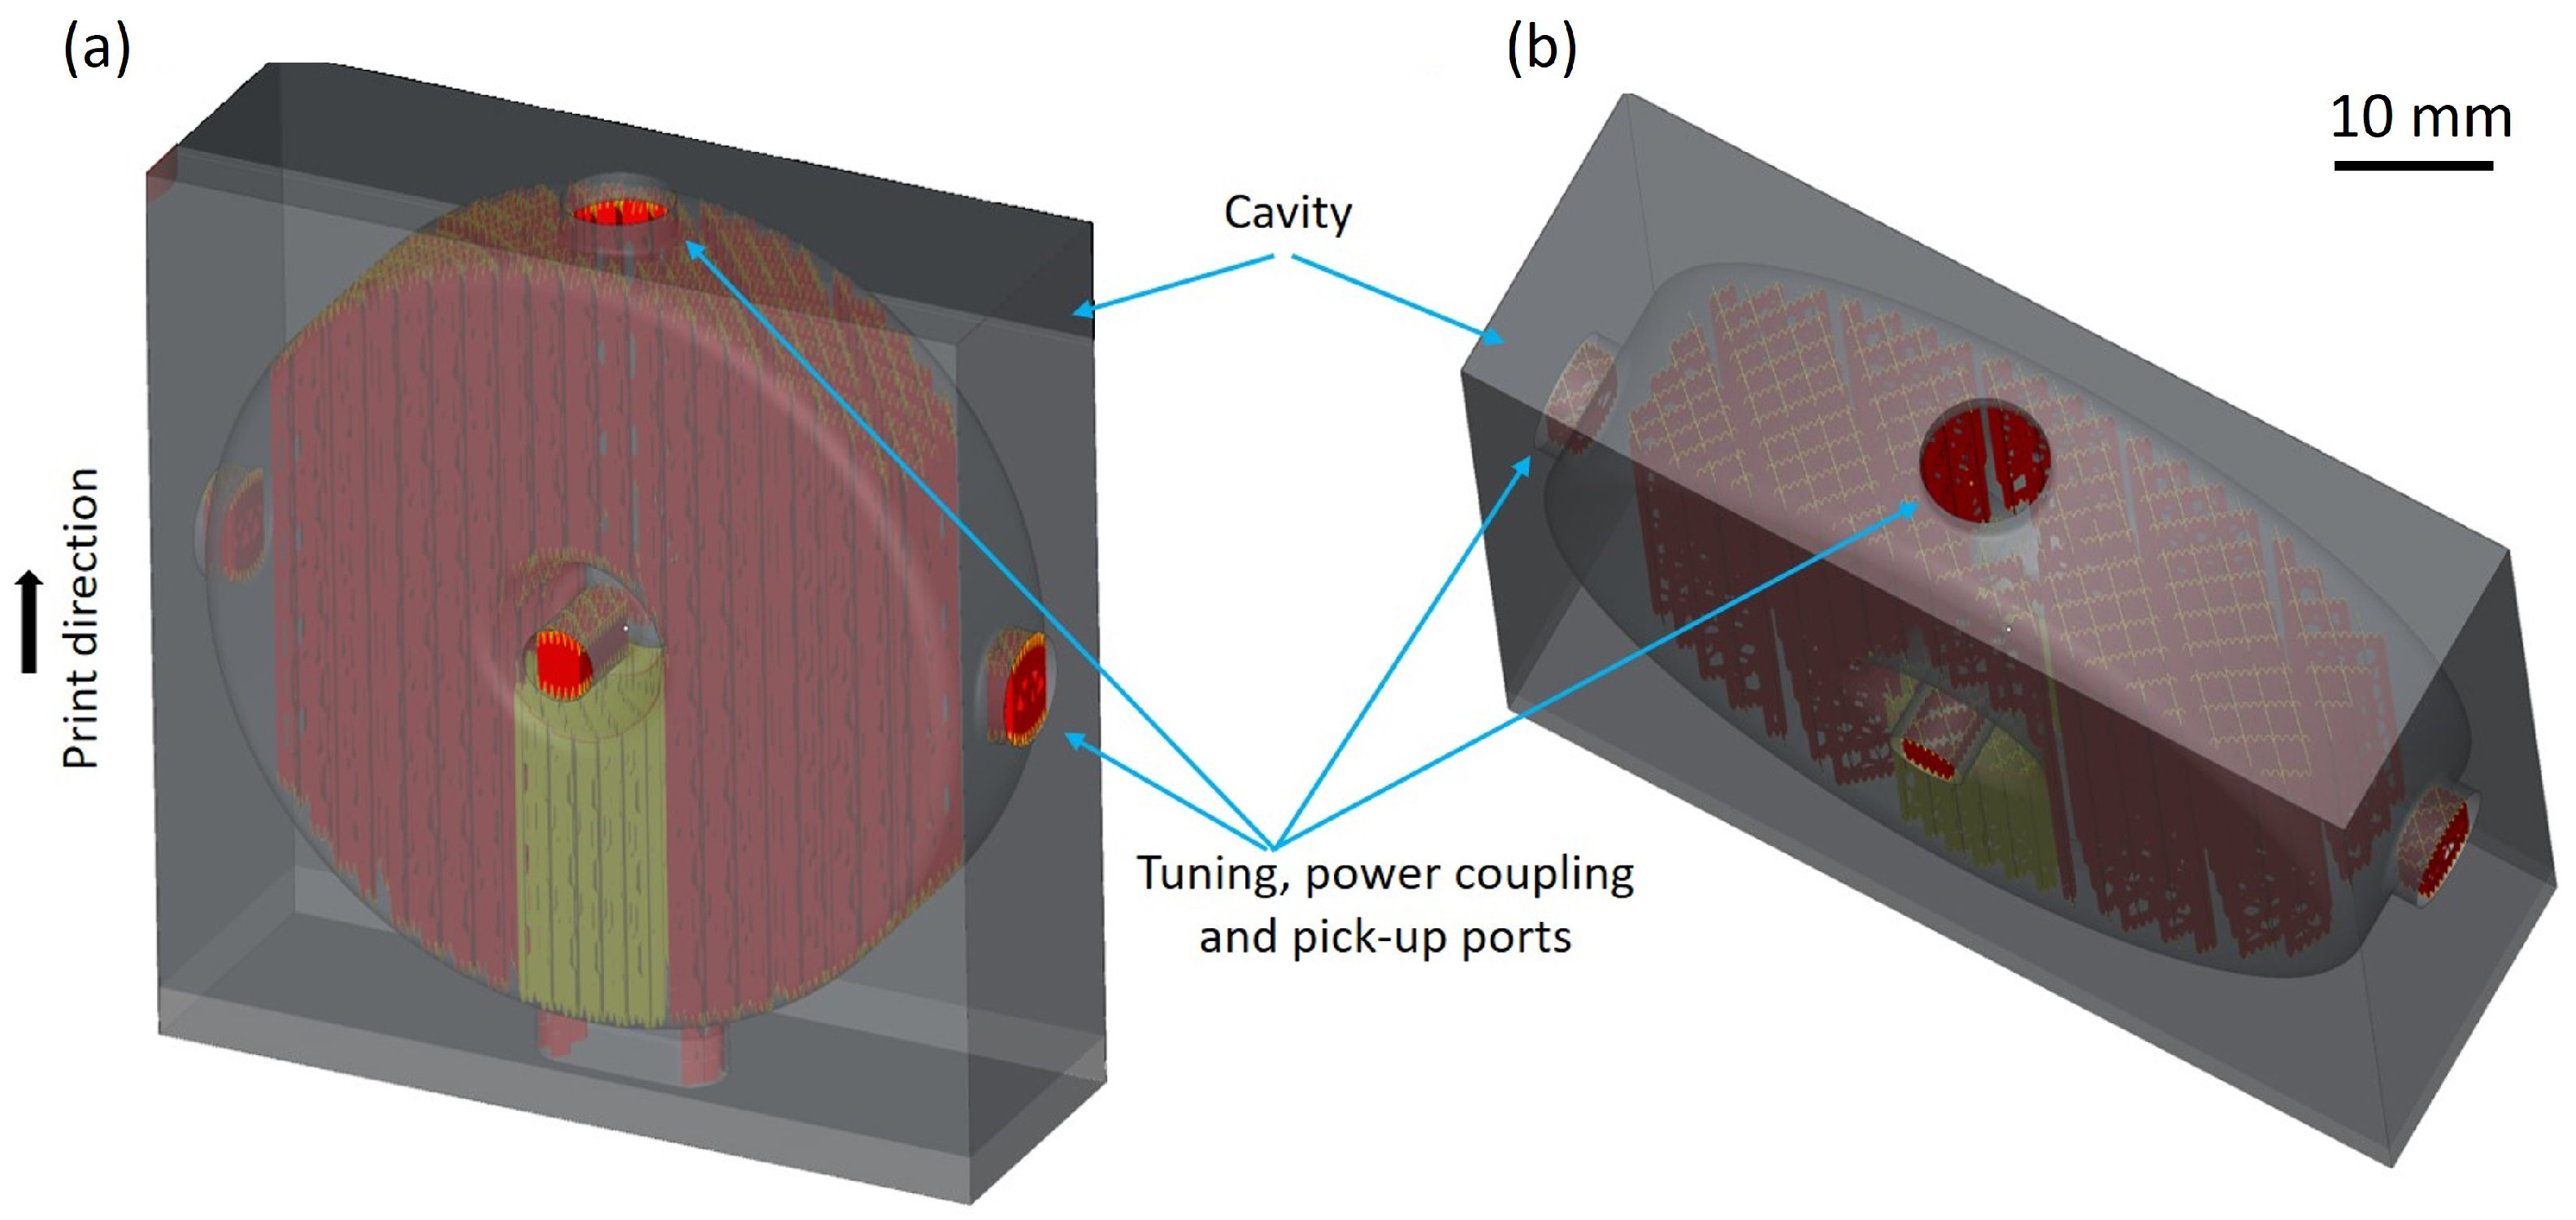
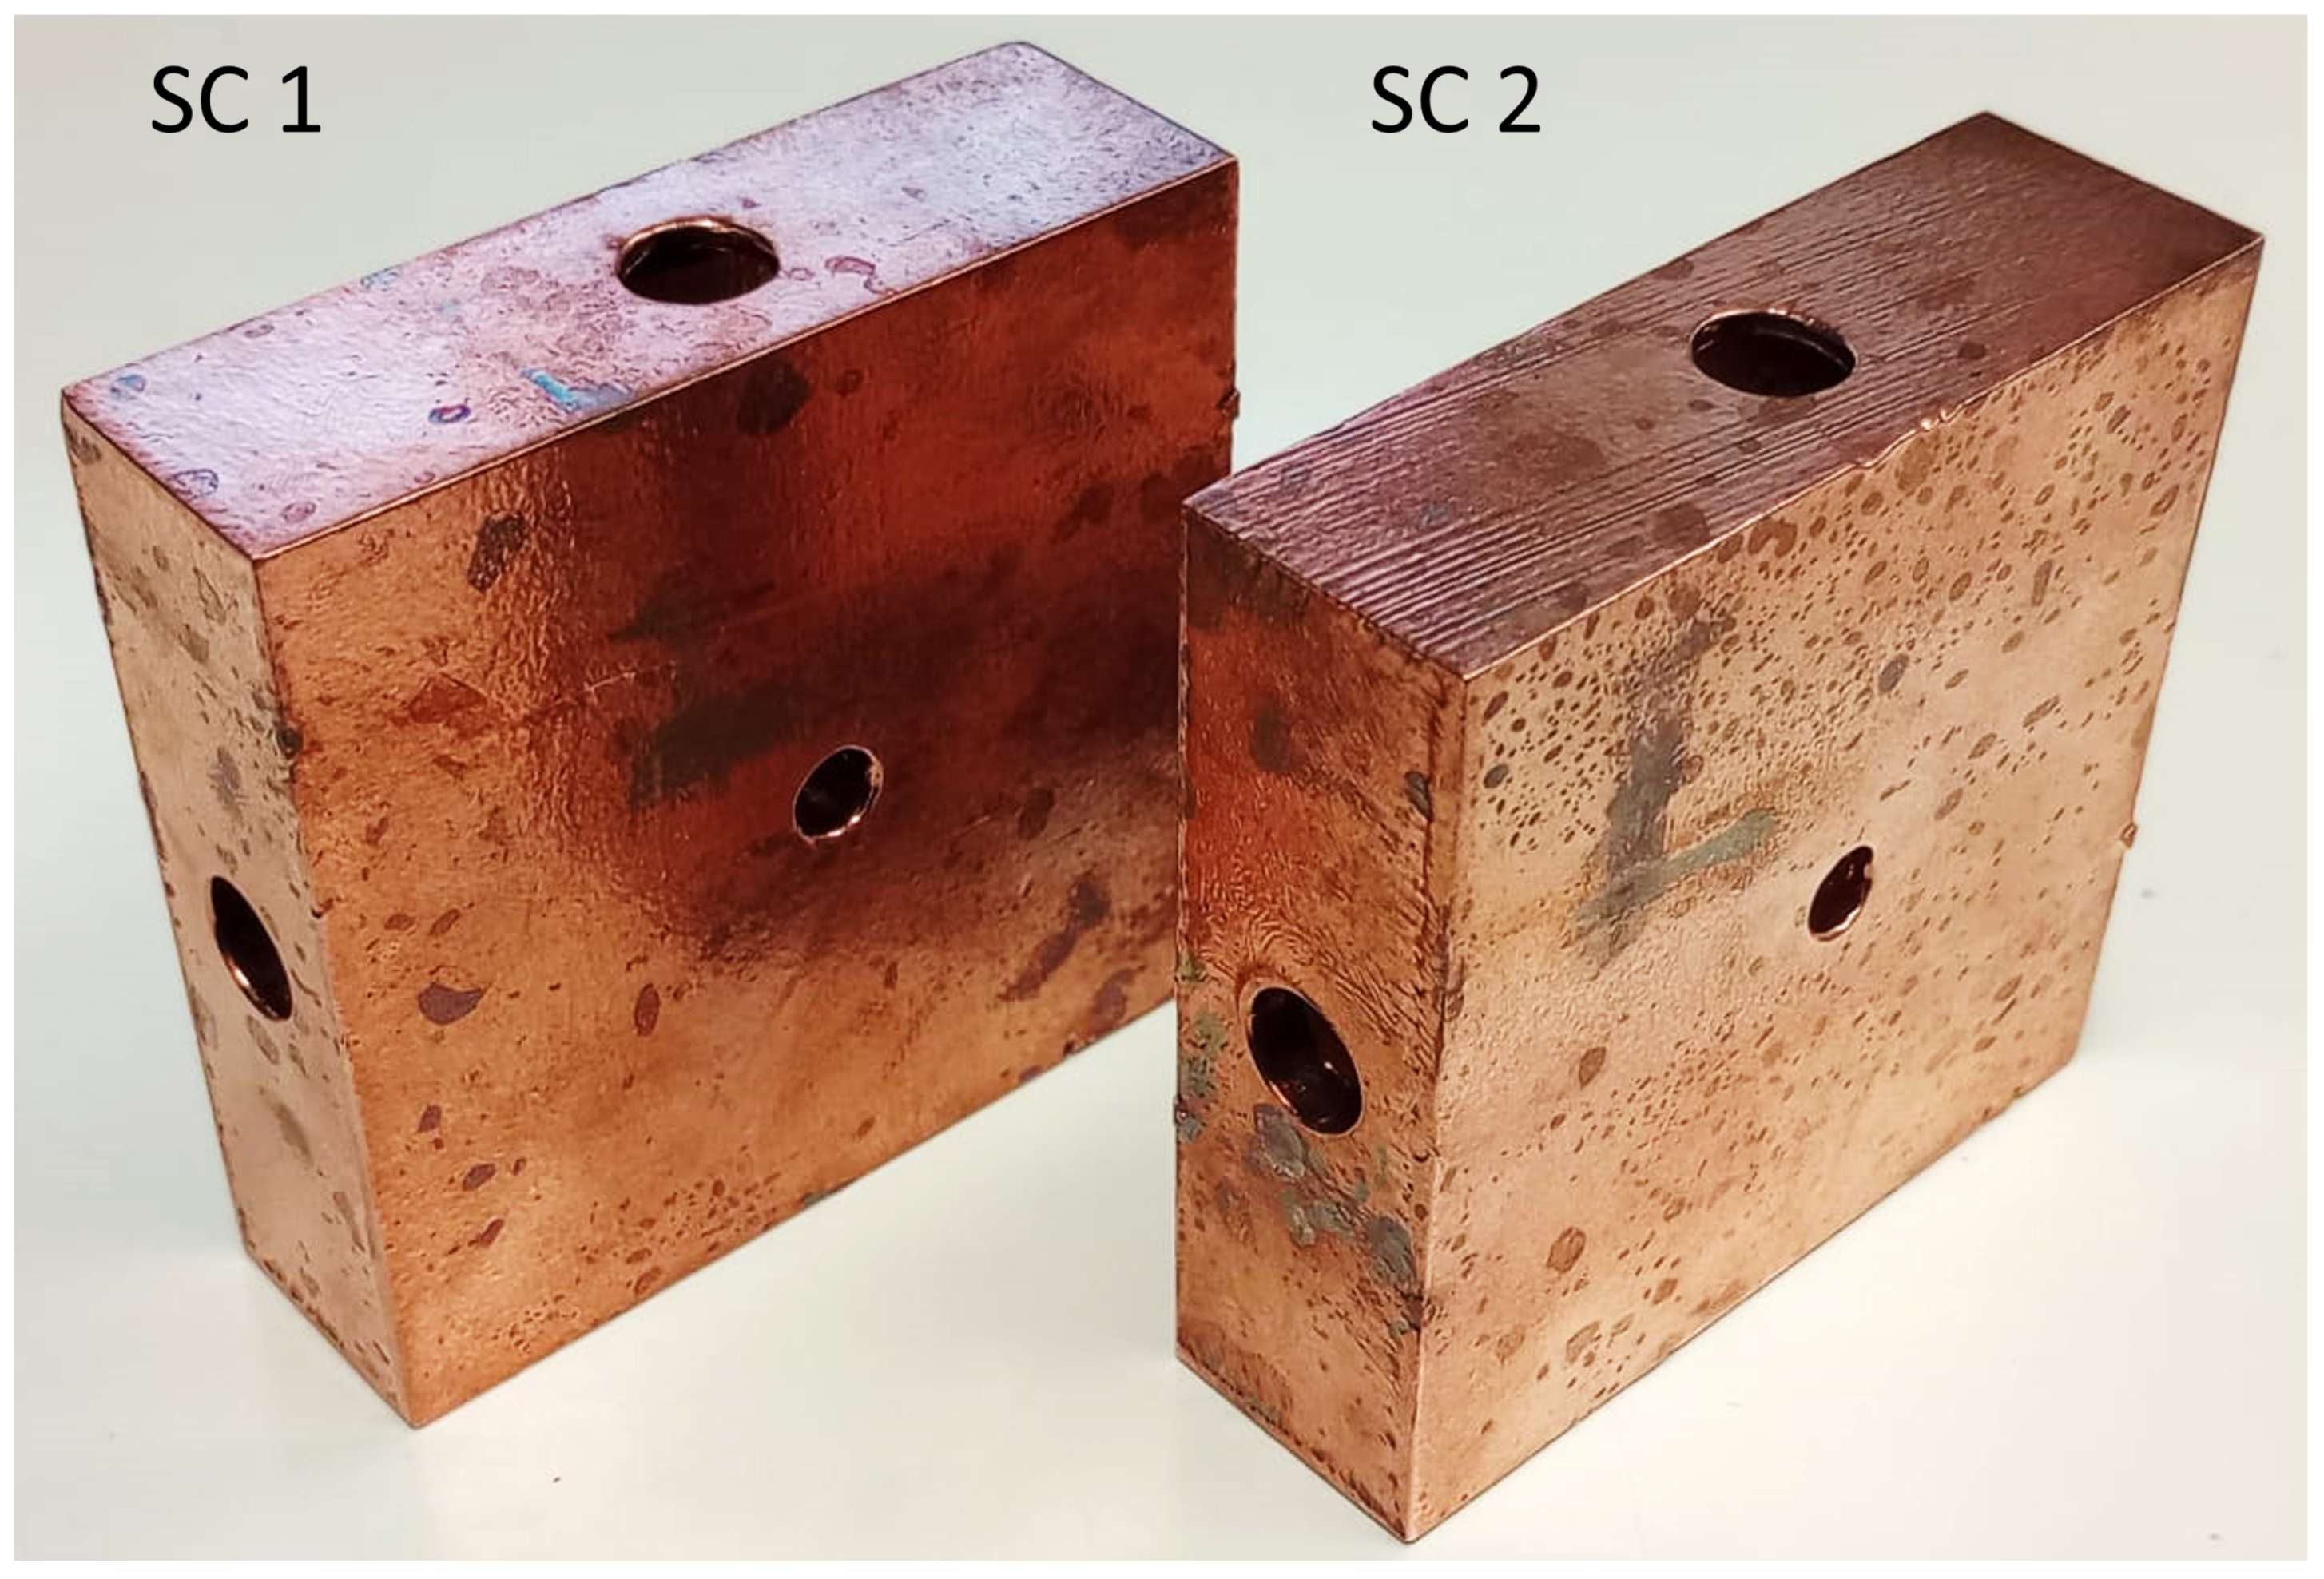
2.2. Additive Manufacturing

The SCs were manufactured using L-PBF. An EOS AMCM M290 with a maximum laser power of 1 kW, located at FKM Sintertechnik GmbH, was utilized. The dimensions of the build chamber are 250 × 250 × 310 mm. The raw material used is pure copper (CuCP) from the company EOS GmbH. The chemical composition of the powder is Cu (99.95%), O (0.04%) and a residue of various elements (0.01%). The general particle size distribution corresponds to D 10 = 19.4 µm, D 50 = 35.2 µm and D 90 = 48.5 µm [33]. The printed structures have relative densities of over 99.5%. Thus, electrical conductivity between 97.4 and 100.2% (IACS) can be achieved [34].
To ensure the necessary geometric accuracy for a f R of 3 GHz, the downskin surfaces were supported by co-printed structures. Figure 3 shows the support structure designed for this purpose (red and yellow) in an SC (grey). A block support design was employed to provide broad support for the downskin areas. A wide mesh (hatching distance 3 mm) and a special perforation pattern were utilized to achieve the best possible process media flow during post-processing. To minimize contact points with the cavity surface, the individual struts of the block support were gradually thinned towards the surface. The exact structure of the support is a trade secret of FKM Sintertechnik GmbH and will therefore not be disclosed in this paper.

2.3. Post-Processing Procedure

The post-processing is based on the process of Hirtisation (R) developed by RENA GmbH Hirtisation. Hirtisation (R) is a combination of different chemical/electrochemical processes. The aim of the process is to remove sintered-on particles as well as support structures and to smooth the component surface by removing the protruding parts of a surface profile faster than recesses. In contrast to processes like chemical mechanical planarization (CMP) or those using an abrasive fluidic medium, there are no mechanical processes included. The processing time depends on the component characteristics (alloy, heat treatment, printing parameters, etc.) and current process medium activity. The required material removal is achieved by measuring the material removal rate for the particular parts during the process. Material removal was measured with a micrometer caliper at the shortest dimension of the outer cuboid structure near the corners given the one-sided material removal by simple division by two. Positive results with regard to surface roughness and Q 0 have already been achieved with this method on earlier prototypes [23]. The post-processing is carried out in two steps (PPS 1 and PPS 2).
  • PPS 1: Co-printed support structures are completely dissolved in a first Hirtisation (R) step.
  • PPS 2: After step 1, f R is determined, allowing the calculation of how much material removal (MR) is still required to reach 2997.9 MHz. This MR is then realized by a second Hirtisation (R) step. In addition, PPS 2 further reduces the surface roughness and thus increases Q 0 .
The process media Cu-Auxilex and Cu-Delevatex are used in both steps, with Cu-Delevatex being used for the last 10 µm of fine adjustment. Like the Hirtisation process, Cu-Auxilex and Cu-Delevatex were also developed by RENA Technologies Austria GmbH [28].

2.4. RF Measurements

In this study, we evaluate the resonant frequency f R and the unloaded quality factor Q 0 of the cavities. Achieving the planned f R is crucial for stable cavity operation and to attain the highest possible particle acceleration. Even in conventional manufacturing, deviations from the planned geometry and thus the planned f R cannot be avoided. For successful frequency tuning after production, however, Δ f should be minimized. With conventional manufacturing methods, a Δ f of approximately 2 MHz is achieved for diamond-tooled 3 GHz T M 010 cavities [35]. The unloaded quality factor Q 0 = ω W P measures the cavity’s capacity to store energy and consequently reflects the attainable electric field strength. Here, ω is the angular frequency of the RF signal, W represents the stored energy and P denotes the power loss.
f R and Q 0 are determined using a Siglent SNA5012A vector network analyzer (VNA) and a coupling loop probe (CLP) via a reflection measurement (S11). The VNA was calibrated to the end of the CLP. All measurements refer to the T M 010 mode of the respective SCs.

2.5. Evaluation of Inner Geometry and Surface Roughness

To evaluate the inner geometry, the SCs are cut in half and examined using a Keyence VR-5000 3D wide-area 3D measurement system (Keyence, Osaka, Japan). This system utilizes the structured light method with 12× magnification and features an automatic stage. A false color plot is generated by comparing the resulting 3D data to the CAD data. The measurement accuracy is limited to ± 4 µm with image stitching.
As in our previous work, we utilize the parameter S λ q (adapted from the area root-mean-square average S q , ISO 25178) to describe the surface roughness [27]. The measured surface profile is recorded using a Keyence VK-X3000 laser scanning microscope. The feasible working distance to the cavity surface allows the use of the 50× objective at normal surfaces ( α = 90 ) and the use of the 20× objective in the version with an extra-long working distance at the downskin and upskin surfaces. Subsequently, the surface profiles undergo post-processing through the Keyence software functions Noise removal (set to “High”) and missing data removal. Additionally, a form correction operator (F-Operator) with a wavelength of λ f = 130 µm is applied. Surface variations characterized by a wavelength λ > > δ appear to have only a minor impact on the surface conductivity [23,27]; therefore, another high-pass filter ( λ c filter) is applied. Thereby, λ c is defined as the copper powder size D 50 , and λ c = D 50 = 35.2 µm.
S λ q is determined at six locations on the inner cavity surface. Three of these locations are shown in Figure 2 by a red cross in the first quadrant of the cell longitudinal section. The other three were measured at the corresponding locations in the third quadrant of the cell. The measuring locations are numbered in ascending order in the printing direction. An area of around 1 mm 2 was evaluated at every location.

3. Results

Two cavities (SC 1 and SC 2) were manufactured using the methods described in Section 2. To completely remove the support structure, material removal ( M R ) of 130 µm was required in PPS 1. In PPS 2, M R of 140 µm was processed to further increase Q 0 and reach the desired f R of 2997.9 MHz (compare Section 3.1 and Section 3.2). Figure 4 shows the additively manufactured cavities SC 1 and SC 2 after PPS 2.

3.1. Resonance Frequency f R and Tuning Process

Due to the printed support structure, f R was determined after each of the two post-processing steps, PPS 1 and PPS 2. Table 1 shows the measured f R of the two SCs after the respective post-processing step. The averaged resonance frequency f ¯ R of the two structures after M R of 130 µm by PPS 1 corresponds to 2970.4 MHz. The f R of SC 1 and SC 2 deviate from each other by 1.2 MHz. Compared to the simulated f R = 2937.9 MHz of the printed SCs, this corresponds to a material removal rate Δ f M R of approximately 0.26 MHz μ m .
The iterative tuning process ended after PPS 2 with the further removal of M R = 140 µm. After PPS 2, f ¯ R corresponds to 2997.3 MHz and thus deviates only by 0.6 MHz or 0.02 % from the planned f R . With respect to f R after PPS 1, this corresponds to a material removal rate Δ f M R of approximately 0.20 MHz μ m . Considered independently, SC 1 and SC 2 deviate from the planned f R by 0.2 MHz and 1.0 MHz, respectively.

3.2. Unloaded Quality Factor Q 0

As with f R , Q 0 was determined after the PPS 1 and PPS 2 treatments. Table 2 shows the measured Q 0 of the two SCs after the respective post-processing steps. After PPS 1, the SCs achieved an average quality factor Q ¯ 0 of 5305. The Q 0 of the two SCs are identical within the limits of the measurement uncertainties. Q ¯ 0 reaches 8285 after PPS 2. The Q 0 simulated by CST corresponds to 9170 ± 50 . For the simulation, M R of 270 µm (PPS 1 and PPS 2) was taken into account for the SC geometry. Therefore, after PPS 2, Q 0 corresponds to approximately 90% of the simulated Q 0 . The Q 0 values of the individual SCs differ slightly from each other, by approximately 3%.

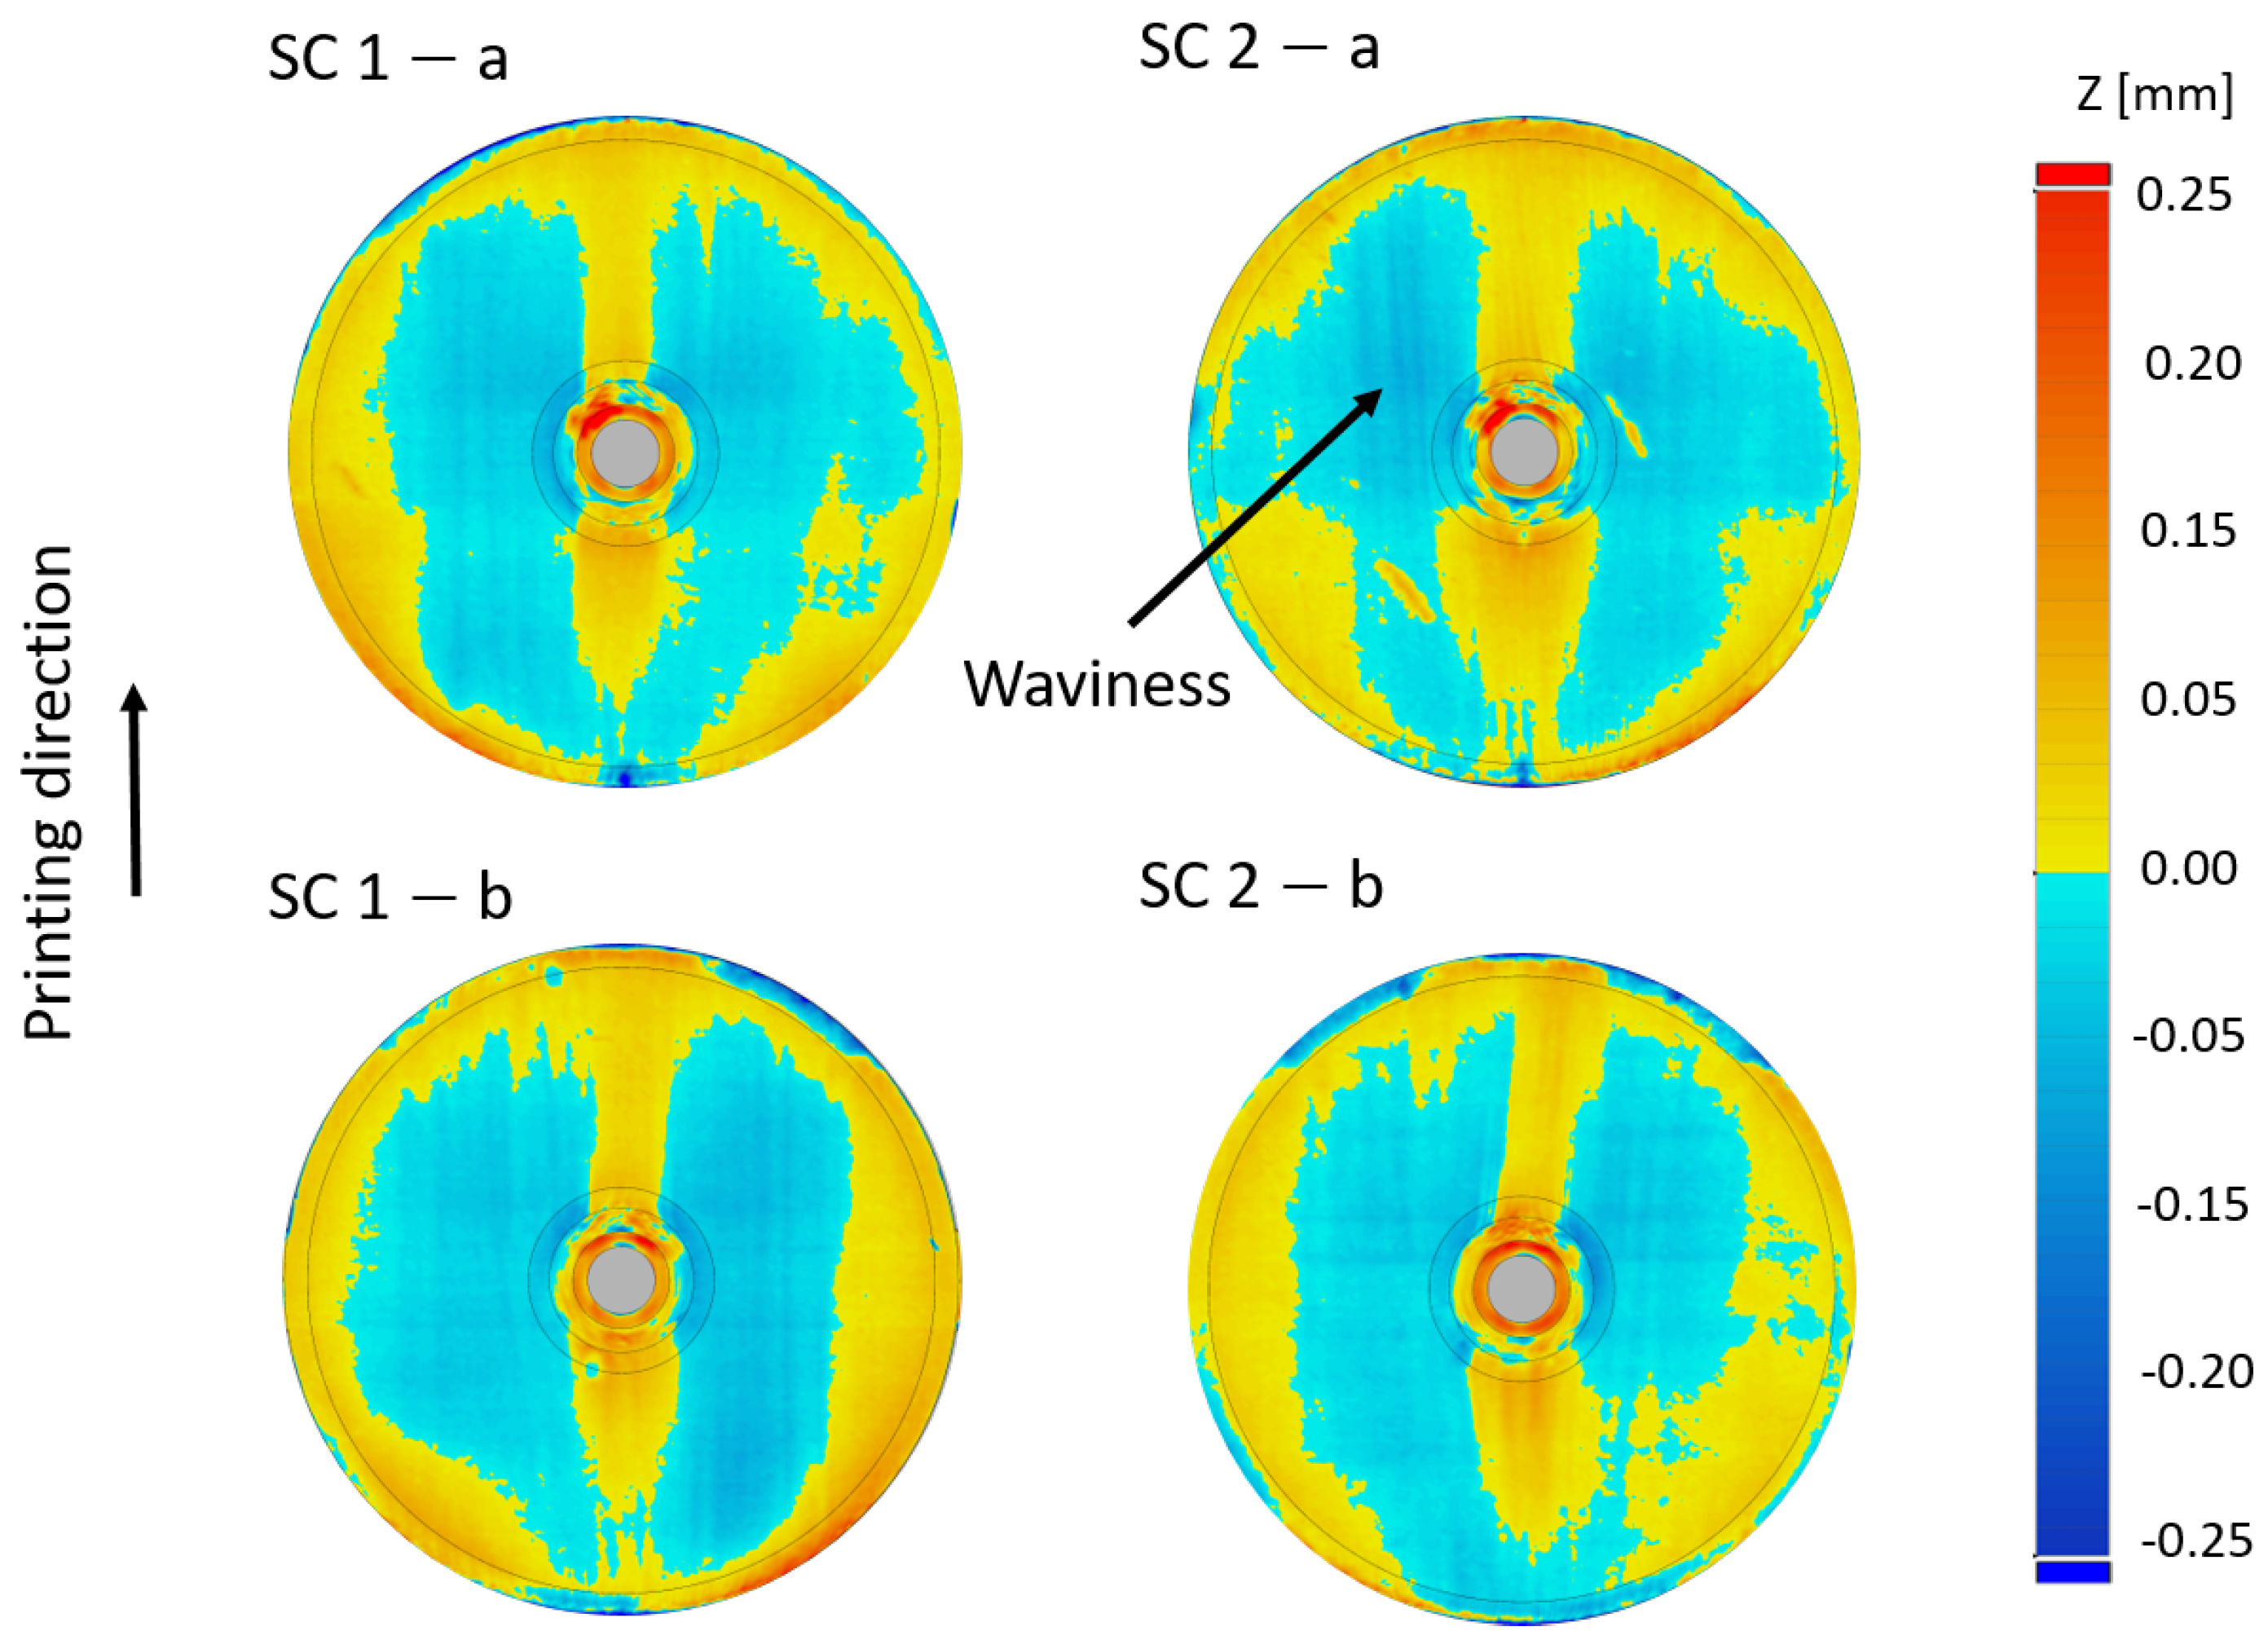
3.3. Inner Geometry and Surface Roughness

Figure 5 displays the color-coded geometric difference z between the planned SC geometry, reduced by 270 µm (CAD data), and the measured surface data for the two halves (a and b) of the two SCs. Positive and negative values indicate areas with higher or lower material thickness than aimed for, respectively. A maximum deviation in the order of 0.25 mm is observed at the nose cone. Moreover, all SC halves exhibit waviness where the crests (the troughs) run roughly parallel to the printing direction. This is exemplarily shown for SC 2—a. Additionally, it is noticeable that an above-average amount of material was removed above and below the nose cones.
Table 3 presents the measured surface roughness S λ q at the different measurement locations 1–6 of SC 1 and SC 2 after PPS 2 (see Section 2.5). The upskin surfaces of the cavities (locations 1 and 4) exhibit an average S λ q of approximately 0.46 µm. The surfaces parallel to the printing direction (locations 2 and 5) show an average S λ q of around 0.30 µm. The downskin surfaces (locations 3 and 6) show an average S λ q of approximately 0.54 µm. The mean value S ¯ λ q of all S λ q amounts to ( 0.43 ± 0.1 ) µm.

4. Discussion

4.1. Inner Geometry

The measurement uncertainty of the Keyence VR-5000 is ± 4 µm. Additionally, the uncertainty in material removal by Hirtisation (R) is approximately ± 10 µm. However, the CAD file used precisely corresponds to an SC geometry with removal of M R = 270 µm. From a geometric perspective, a gap length g deviation of about 1 µm corresponds to an Δ f R of about 0.2 MHz. The Z uncertainty thus results in uncertainty of approximately ± 2 MHz for f R . Nevertheless, Figure 5 allows for an evaluation of the general shape and quality of the manufacturing process.
The waviness on the inner cavity surface can likely be explained as follows: during post-processing, gas bubbles form due to the chemical reaction, and they can move along preferred paths, resulting in differences in material removal, which manifests as waviness (see Figure 5). The general geometrical asymmetry (see Figure 5) is probably attributed to maintaining the geometry orientation in the process medium throughout the process. Therefore, the asymmetry is likely influenced by the flow direction of the process medium. For low-gradient cavities with E-fields in the range of a few M V m , the geometry deviation resulting from the waviness and asymmetry might be tolerable as long as f R is reached (see Section 4.2). However, in high-gradient operation, typical for most Linacs, this could lead to EM field peaks and, consequently, to breakdown events.

4.2. Resonant Frequency f R and Tuning Process

The deviation Δ f R of the individual f R of SC 1 and SC 2, as well as their average f ¯ R , from the planned f R of 2997.9 MHz is always below 1.0 MHz. This is fully comparable to the Δ f R achieved in conventional manufacturing approaches. Such deviations can be easily corrected by standard frequency tuning devices (e.g., tuning rods), which are typically designed for 3 GHz Linacs to correct a Δ f R of a few MHz [35]. Therefore, our approach enables the manufacturing of T M 010 cavities with f R < 3   GHz in sufficiently high geometrical accuracy to reach the desired f R . Nevertheless, future studies should investigate in detail the influence of plastic deformation as the preferred tuning method for high-gradient applications on additively manufactured cavities.

4.3. Unloaded Quality Factor Q 0 and Surface Roughness

The unloaded quality factor Q ¯ 0 was increased by PPS 2 to approximately 90% of the simulated Q 0 . The simulated Q 0 corresponds to the best possible value for a flat ( S q λ = 0 ) and annealed ( σ = 5.8 · 10 7 S m , 100 % IACS) copper surface. As previously described by us in [27], the gradient model developed by Gold et al. [36] can be used to simulate the influence of surface roughness on the surface impedance and thus Q 0 with the help of the CST frequency domain solver. For the simulation, the surface roughness is assumed to be uniform over the entire cavity geometry. The assumed surface roughness S ¯ q λ is obtained by averaging the measured surface roughness values from Table 3 to 0.43 µm. This assumption was made because the surface roughness values of the upskin, downskin and normal surfaces are quite similar (standard deviation: σ S ¯ q λ = 0.1 µm). However, since the areas of the different surfaces (upskin, downskin and normal) are not the same size, and the current densities on the cavity surface vary, the CST simulation’s accuracy could be increased by assigning the individual cavity sections their exact surface roughness. However, since the surface roughness varies depending on α , the printing orientation, etc., and the geometry consists of transitions between the upper, lower and normal surfaces (e.g., nose cone), the exact assignment of the surface roughness requires considerable effort in terms of measurements and simulation.
The quality factor Q λ 0 corrected with S ¯ q λ is 8300 ± 50 , which corresponds to Q ¯ 0 = 8285 measured after PPS 2, considering measurement uncertainties. This implies that the gradient model is valid for the single cavities presented here and that the single cavities have the same surface conductivity as a perfect, conventionally manufactured cavity with the same roughness. A comparison with the SCs presented in a previous study [27] reveals an increase in Q λ 0 by 10–20%, indicating progress in the manufacturing process. However, it should be noted that the SCs presented in [27] were printed on an L-PBF system based on green laser technology, not red laser technology. Different L-PBF systems vary in terms of the process parameters, the atmosphere in the build space, etc. Therefore, the comparison between the SCs may not be entirely valid, as different process parameters lead to distinct material properties, such as grain sizes or impurity concentrations. Although the method of post-processing was not changed between [27] and the present work, the success of post-processing and, consequently, the increase in surface conductivity may vary due to the different material properties. These results motivate further research, including a comparison of different L-PBF technologies for the manufacturing of cavities.

5. Conclusions

A novel additive manufacturing approach for high-frequency cavities was developed employing co-printed support structures to provide increased design freedom in laser powder bed fusion (L-PBF) for the production of T M 010 cavities. The study demonstrated that electrochemical post-processing methods (Hirtisation (R)) can successfully remove co-printed support structures, even from small GHz cavities. The same post-processing procedure also serves to tune the cavities to the desired resonance frequency ( f R ). Simultaneously, the quality factor ( Q 0 ) of the cavities is enhanced by reducing the surface roughness. Consequently, the studies presented here show, for the first time, a GHz cavity printed entirely from pure copper that achieves both the simulated quality factor and resonant frequency simultaneously. Our manufacturing approach enables the production of small T M 010 cavities with an optimal geometry from an electromagnetic field perspective using L-PBF. It is reasonable to assume that the cavities manufactured in this way are at least as efficient as conventionally manufactured structures in terms of particle acceleration.
However, before AM cavities are used in Linac systems, their performance under high input power and, consequently, their breakdown resistance at high E-field strengths ( E z > 40 MeV) must be evaluated. A test bench based on a magnetron amplifier is currently being developed for these high-gradient tests.

Author Contributions

Conceptualization, M.M. and G.D.; Methodology, M.M., S.B., M.D. and L.C.; Software, M.M., S.B. and L.C.; Validation, M.M. and G.D.; Formal analysis, M.M., S.B. and S.G.; Investigation, M.M.; Resources, G.D., S.B., M.D., L.C. and V.N.-G.; Data curation, M.M.; Writing—original draft preparation, M.M. and G.D.; Writing—review and editing, M.M., S.B., M.D., L.C., S.G., V.N.-G. and G.D.; Visualization, M.M. and S.B.; Supervision, G.D.; Project administration, M.M.; Funding acquisition, G.D. All authors have read and agreed to the published version of the manuscript.

Funding

The study is partly funded by the Federal Ministry of Education and Research (BMBF) via ERUM-Pro and the EU project Radiate. In addition, the equipment used in this study from the FLAB-3Dprint research project is funded by dtec.bw—Forschungszentrum Digitalisierung und Technik der Bundeswehr, for which we would like to express our sincere thanks. dtec.bw is funded by the European Union—NextGenerationEU.

Data Availability Statement

The data presented in this study are available on request from the corresponding author.

Conflicts of Interest

Author Luis Catarino was employed by the company FKM Sintertechnik GmbH. Author Michael Doppler Catarino was employed by the company RENA Technologies Austria GmbH, Sa. The authors declare that the research was conducted in the absence of any commercial or financial relationships that could be construed as a potential conflict of interest. The companies FKM Sintertechnik GmbH and RENA Technologies Austria GmbH had no role in the design of the study; in the collection, analyses, or interpretation of data; in the writing of the manuscript, or in the decision to publish the results.

References

  1. Wangler, T.P. RF Linear Accelerators, 2nd ed.; John Wiley & Sons: Hoboken, NJ, USA, 2008; pp. 98–121. [Google Scholar]
  2. Witman, S. Ten Things You Might Not Know about Particle Accelerators. Symmetry Magazine, Fermi National Accelerator Laboratory. 2014. Available online: https://www.symmetrymagazine.org/article/april-2014/ten-things-you-might-not-know-about-particle-accelerators (accessed on 1 December 2023).
  3. Kutsaev, S.V. Advanced technologies for applied particle accelerators and examples of their use. Tech. Phys. 2021, 66, 161–195. [Google Scholar] [CrossRef]
  4. Lung, H.; Cheng, Y.C.; Chang, Y.H.; Huang, H.W.; Yang, B.B.; Wang, C.-Y. Microbial decontamination of food by electron beam irradiation. Trends Food Sci. Technol. 2015, 44, 66–78. [Google Scholar] [CrossRef]
  5. Do Huh, H.; Kim, S. History of radiation therapy technology. Korean Soc. Med. Phys. 2020, 31, 124–134. [Google Scholar]
  6. Amaldi, H.; Braccini, S.; Puggioni, P. High frequency linacs for hadrontherapy. Rev. Accel. Sci. Technol. 2009, 2, 111–131. [Google Scholar] [CrossRef]
  7. Wilson, I.H. Cavity construction techniques. Cern Accel. Sch. Eng. Part. Accel. 1991, 2, 92–103. [Google Scholar]
  8. Nassiri, A.; Chase, B.; Craievich, P.; Fabris, A.; Frischholz, H.; Jacob, J.; Jensen, E.; Jensen, M.; Kustom, R.; Pasquinelli, R. History and technology developments of radio frequency (RF) systems for particle accelerators. IEEE Trans. Nucl. Sci. Inst. Electr. Electron. Eng. 2016, 63, 707–750. [Google Scholar] [CrossRef]
  9. Ghodke, S.R.; Barnwal, R.; Mondal, J.; Dhavle, A.S.; Parashar, S.; Kumar, M.; Nayak, S.; Jayaprakash, D.; Sharma, V.; Acharya, S.; et al. Machining and brazing of accelerating RF cavity. In Proceedings of the 2014 International Symposium on Discharges and Electrical Insulation in Vacuum (ISDEIV), Mumbai, India, 28 September–3 October 2014; pp. 101–104. [Google Scholar]
  10. Pagani, C.; Bellomo, G.; Pierini, P. A high current proton linac with 352 MHz SC cavities. arXiv 1996, arXiv:acc-phys/9609004. [Google Scholar]
  11. Mickat, S.; Barth, W.; Clemente, G.; Groening, L.; Schlitt, B.; Ratzinger, U. The Status of the High-Energy Linac Project at GSI. GSI Sci. Rep. 2014, 306. [Google Scholar]
  12. Brinkmann, R.; Andruszkow, J.; Agababyan, A.; Ageyev, A.; Andruszkow, J.; Antoine, C.; Aseev, V.; Aune, B.; Ayvazyan, V.; Baboi, N.; et al. TESLA Technical Design Report—PART II The Accelerator; DESY: Hamburg, Germany, 2001; Available online: https://tesla.desy.de/ (accessed on 1 December 2023).
  13. Calignano, F.; Manfredi, D.; Ambrosio, E.P.; Biamino, S.; Lombardi, M.; Atzeni, E.; Salmi, A.; Minetola, P. Overview on Additive Manufacturing Technologies. Inst. Electr. Electron. Eng. IEEE 2017, 105, 101–104. [Google Scholar] [CrossRef]
  14. Attaran, M. The rise of 3-D printing: The advantages of additive manufacturing over traditional manufacturing. Bus. Horizons 2017, 60, 677–688. [Google Scholar] [CrossRef]
  15. Torims, T.; Cherif, A.; Delerue, N.; Pedretti, M.F.; Krogere, D.; Otto, T.; Pikurs, G.; Pozzi, M.; Tatkus, A. Evaluation of geometrical precision and surface roughness quality for the additively manufactured radio frequency quadrupole prototype. J. Phys. Conf. Ser. 2023, 2420, 012089. [Google Scholar] [CrossRef]
  16. Torims, T.; Pikurs, G.; Gruber, S.; Vretenar, M.; Ratkus, A.; Vedani, M.; Lopez, E.; Bruckner, F. First proof-of-concept prototype of an additive manufactured radio frequency quadrupole. Instruments 2021, 5, 35. [Google Scholar] [CrossRef]
  17. Hähnel, H. Update on the first 3D printed IH-type linac structure-proof-of-concept for additive manufacturing of linac RF cavities. Proc. LINAC 22 2022, 22, 170–173. [Google Scholar]
  18. Hähnel, H.; Ateş, A.; Dedić, B.; Ratzinger, U. Additive Manufacturing of an IH-Type Linac Structure from Stainless Steel and Pure Copper. Instruments 2023, 7, 22. [Google Scholar] [CrossRef]
  19. Frigola, P.; Agustsson, R.B.; Faillace, L.; Murokh, A.Y.; Gianluigi, C.; William, A.C.; Pashupati, D.; Frank, M.; Robert, A.; Joshua, K.S.; et al. Advance additive manufacturing method for SRF cavities of various geometries. In Proceedings of the Thomas Jefferson National Accelerator Facility (TJNAF), Newport News, Whistler, BC, Canada, 13–18 September 2015. [Google Scholar]
  20. Creedon, D.L.; Goryachev, M.; Kostylev, N.; Sercombe, T.B.; Tobar, M.E. A 3D printed superconducting aluminium microwave cavity. Appl. Phys. Lett. 2016, 109, 032601. [Google Scholar] [CrossRef]
  21. Riensche, A.; Carriere, P.; Smoqi, Z.; Menendez, A.; Frigola, P.; Kutsaev, S.; Araujo, A.; Matavalam, N.G.; Rao, P. Application of hybrid laser powder bed fusion additive manufacturing to microwave radio frequency quarter wave cavity resonators. Int. J. Adv. Manuf. Technol. 2023, 124, 619–632. [Google Scholar] [CrossRef]
  22. Mayerhofer, M.; Mitteneder, J.; Dollinger, G. A 3D printed pure copper drift tube linac prototype. Rev. Sci. Instrum. 2022, 93, 023304. [Google Scholar] [CrossRef] [PubMed]
  23. Mayerhofer, M.; Mittenender, J.; Wittig, C.; Prestes, I.; Jägle, E.; Dollinger, G. First High Quality Drift Tube Linac Cavity additively Manufactured from Pure Copper. In Proceedings of the 14th International Particle Accelerator Conference (IPAC23), Venicem, Italy, 7–12 May 2022; p. 43. [Google Scholar]
  24. Tran, T.Q.; Chinnappan, A.; Lee, J.K.Y.; Loc, N.H.; Tran, L.T.; Want, G.; Kumar, V.V.; Jayathilaka, W.A.D.M.; Ji, D.; Doddamani, M.; et al. 3D printing of highly pure copper. Metals 2019, 9, 756. [Google Scholar] [CrossRef]
  25. Gruber, S.; Stepien, L.; Lopez, E.; Brueckner, F.; Leyens, C. Physical and geometrical properties of additively manufactured pure copper samples using a green laser source. Materials 2021, 14, 3642. [Google Scholar] [CrossRef] [PubMed]
  26. Mayerhofer, M.; Dollinger, G. Manufacturing method for radio-frequency cavity resonators and corresponding resonator. Patent No. EP3944725A1, 2020. [Google Scholar]
  27. Mayerhofer, M.; Brenner, S.; Helm, R.; Gruber, S.; Lopez, E.; Stepien, L.; Gold, G.; Dollinger, G. Additive Manufacturing of Side Coupled Cavitiy Linac Structures from Pure Copper—A First Concept. Instruments 2023, 7, 56. [Google Scholar] [CrossRef]
  28. Rena Technologies GmbH. Surface Treatment of 3D-Printed Metal Parts. 2023. Available online: https://www.rena.com/en/technology/process-technology/hirtisation (accessed on 1 December 2023).
  29. Dassault Systèmes; CST Microwave Studio. 2023. Available online: https://www.3ds.com/de/produkte-und-services/simulia/produkte/cst-studio-suite/ (accessed on 1 December 2023).
  30. Menzel, M.T.; Stokes, H.K. Users Guide for the POISSON/SUPERFISH Group of Codes; Technical Report; Los Alamos National Lab.: Los Alamos, NM, USA, 1987. [Google Scholar] [CrossRef]
  31. Ronsivalle, C.; Picardi, L.; Ampollini, A.; Bazzano, G.; Marracino, F.; Nenzi, P.; Snels, C.; Surrenti, V.; Vadrucci, M.; Ambrosini, F. First acceleration of a proton beam in a Side Coupled Drift tube Linac. Europhys. Lett. 2015, 111, 14002. [Google Scholar] [CrossRef]
  32. Degiovanni, A.; Stabile, P.; Ungaro, D. LIGHT: A linear accelerator for proton therapy. In Proceedings of the NAPAC2016, Chicago, IL, USA, 9–14 October 2016; p. 32. [Google Scholar]
  33. Robinson, J.; Munagala, S.P.; Arjunan, A.; Simpson, N.; Jones, R.; Baroutaji, A.; Govindaraman, L.T.; Lyall, I. Electrical conductivity of additively manufactured copper and silver for electrical winding applications. Materials 2022, 15, 7563. [Google Scholar] [CrossRef] [PubMed]
  34. EOS GmbH. EOS Copper CuCP. In Material Datasheet; Electro Optical Systems (EOS GmbH): Munich, Germany, 2023. [Google Scholar]
  35. Verdú, A.S. High-Gradient Accelerating Structure Studies and Their Application in Hadrontherapy. Ph.D. Thesis, Universitat de Valencia, Valencia, Spain, 2013. [Google Scholar]
  36. Gold, G. A Physical Surface Roughness Model and Its Applications. IEEE Trans. Microw. Theory Tech. Inst. Electr. Electron. Eng. IEEE 2017, 65, 3720–3732. [Google Scholar] [CrossRef]
Figure 2. (a) First quadrant of the longitudinal section through a conventional T M 010 single cavity. The red crosses mark the locations of the surface roughness measurements. (b) Relevant geometric parameters of the printed SC.
Instruments 08 00018 g002
Figure 3. Front view (a) and top view (b) of the SC (grey) with co-printed support structure (red and yellow).
Instruments 08 00018 g003
Figure 4. SC 1 and SC 2 after PPS 2.
Instruments 08 00018 g004
Figure 5. Difference between measured surface and CAD data Z of the individual SCs after PPS 2.
Instruments 08 00018 g005
Table 1. f R of SC 1 and 2, after PPS 1 and PPS 2.
f R —SC 1 f R —SC 2
After PPS 1(2972.0 ± 0.2) MHz(2970.8 ± 0.2) MHz
After PPS 2(2997.7 ± 0.2) MHz(2996.9 ± 0.2) MHz
Table 2. Q 0 of SC 1 and 2, after PPS 1 and PPS 2.
Q 0 —SC 1 Q 0 —SC 2
After PPS 15340 ± 1005270 ± 100
After PPS 28410 ± 1008160 ± 100
Table 3. S λ q of SC 1 and SC 2 after PPS 2 at the defined measurement locations (see Figure 2 and compare Section 2.5).
Measurement Location S λ q —SC 1 S λ q —SC 2Orientation
10.49 µm0.44 µmupskin
20.31 µm0.36 µmparallel
30.57 µm0.50 µmdownskin
40.46 µm0.45 µmupskin
50.28 µm0.26 µmparallel
60.58 µm0.50 µmdownskin
Disclaimer/Publisher’s Note: The statements, opinions and data contained in all publications are solely those of the individual author(s) and contributor(s) and not of MDPI and/or the editor(s). MDPI and/or the editor(s) disclaim responsibility for any injury to people or property resulting from any ideas, methods, instructions or products referred to in the content.

