Article

The Identification of a Cell Cycle Regulation Gene Cyclin E from Hong Kong Oysters (Crassostrea hongkongensis) and Its Protein Expression in Response to Salinity Stress

1
Key Laboratory of Environment Change and Resources Use in Beibu Gulf, Ministry of Education, Nanning Normal University, Nanning 530100, China
2
Yellow Sea Fisheries Research Institute, Chinese Academy of Fishery Sciences, Qingdao 266071, China
*
Author to whom correspondence should be addressed.
Fishes 2024, 9(3), 102; https://doi.org/10.3390/fishes9030102
Submission received: 31 January 2024 / Revised: 1 March 2024 / Accepted: 5 March 2024 / Published: 6 March 2024
(This article belongs to the Special Issue Genetic Breeding and Developmental Biology of Aquaculture Animals)

Abstract

:
Hong Kong oysters (Crassostrea hongkongensis) are an important marine bivalve with nutritional and commercial value. The expanded off-bottom farming scale in recent years makes the oysters more susceptible to exposure to abiotic stresses, such as salinity stress, an important environmental factor that has been proven to have significant effects on oyster growth and development. However, the molecular mechanism is still unclear. Cyclin E is an important protein in the process of cell cycle regulation that is indispensable for propelling G1/S phase transition in a dose-dependent manner. In order to investigate whether the salinity stress affects cyclin E expression in oysters, the cDNA sequence of C. hongkongensis cyclin E (Ch-CCNE) was isolated from a gill cDNA library, and the 2.8 kbp length cDNA fragment contained a complete open reading frame (ORF) encoding 440 amino acid residues. Ch-CCNE mRNA was highly expressed in the gonad and low in the adductor mussel, mantle, gill, labial palp, and digestive gland. The recombinant CCNE protein was expressed and purified in a pET32a(+)-CCNE/Escherichia coli BL21(DE3) system via IPTG induction and was used for generating mice anti-Ch-CCNE antiserums. Western blot analysis showed that the CCNE protein in the gill was maintained at low expression levels under either hypo- (5 ppt) or hyper- (35 ppt) salinity, and could be produced at high levels under appropriate salinity during a 10-day exposure period. The immuno-localization indicated that the Ch-CCNE protein was distributed in the nucleus. These results suggested that either hypo- or hyper-salinity stress could inhibit the CCNE expression of Hong Kong oysters and their negative impact on cell division and proliferation.
Key Contribution: The main finding of this study is that salinity stress, a significant environmental factor in off-bottom oyster farming, adversely affects CCNE expression. This suggests that both hypo- and hyper-salinity conditions inhibit CCNE expression, potentially negatively impacting cell division and proliferation in oysters.

1. Introduction

The Hong Kong oyster Crassostrea hongkongensis is an endemic and commercially valuable aquaculture species that thrives along the southern coast of China [1], occupying an important position in the Chinese oyster aquaculture industry [2]. As a typical bivalve that lives in marine intertidal zones and estuaries, the Hong Kong oyster is known to have strong adaptations to large fluctuations in environments [3]. The Hong Kong oyster typically thrives within a salinity range of 5–30 parts per thousand (ppt) and a temperature range of 10–30 °C, with an optimal salinity of about 15–20 ppt [4] and an optical temperature range of approximately 15–25 °C [5]. However, a concerning event has emerged in the Maowei Sea, China, in particular. Large-scale mortality events among Hong Kong oysters have occurred due to prolonged exposure to high salinity stress [6]. The severity of the situation is evident in the mortality rates, which exceed 60%, affecting 36% and 81% of oyster stocks in Qinzhou Port and Dafeng River, respectively [6]. This alarming trend has raised questions about the oysters’ resilience over extended periods of high salinity stress. Indeed, the effects of long-term salinity stress on Hong Kong oysters have rarely been studied to date.
Salinity is a critical abiotic-limiting factor that significantly influences the distribution and survival of benthic sessile organisms, including oysters, due to their lack of ability to actively regulate the osmotic pressure of the internal medium [7,8]. The adverse effects of salinization for aquatic species include physiological process impairment, such as osmotic homeostasis maintenance and community composition changes [9], which may induce cell growth arrest via proteasome activation and cyclin/cyclin-dependent kinase degradation [10]. However, the specific molecular mechanism of this process in oysters is still unclear. In recent years, off-bottom farming scale has become a popular Hong Kong oyster aquaculture type due to improved growth rate and flesh quality, but it may place the oysters in an unsuitable growth environment at certain times, especially in terms of long-term salinity stress [11,12]. Therefore, it is necessary to evaluate the effects of salinity stress on the mitotic activity and cell growth of oysters, thereby enhancing our understanding of oysters’ molecular responses to environmental stress.
Cyclins are a group of proteins that play important roles in cell division and are periodically synthesized and degraded during the cell cycle [13]. Cyclin was first discovered in sea urchin embryos in 1983 [14]. Cyclins were named with alphabetical letters following their discovery date, and the E-type cyclins were originally identified in a yeast G1 cyclin mutant [15,16]. Cyclin E protein accumulates sharply at the G1/S-phase boundary and is degraded after S-phase entry [17]. The oscillation in the cyclin E protein level determines fluctuations in the activity of its catalytic partner Cyclin-dependent kinase 2 (CDK2), as the Cyclin E/CDK2 complex exerts regulatory functions by phosphorylating target proteins to promote the G1/S transition [18]. Although cyclin E has been well investigated in mammals and other model organisms, only a few studies have been carried out on aquatic animals. Cyclin E mRNA or protein exhibits high expression levels in the gonads of Penaeus monodon and Hyriopsis cumingii [19,20] and in the early stages of embryonic development in zebrafish and sea urchin [21,22]. Cyclin E expressions in the gill and tail fin tissues of triploid Far Eastern Catfish Silurus asotus were higher than those of diploid [23]. Cyclin E contributes to growth, development, and reproduction. Aquatic animals may adapt to hyper- and hypo-salinity via cell cycle arrest according to transcriptome profiles. However, the effects of salinity stress on cyclin E expression and cell mitosis still need further investigation.
The off-bottom culture method introduced oyster aquaculture from tidelands into offshore areas, where oysters suffer inevitable abiotic stresses, such as long-term hyper-salinity stress. As a result, it would be necessary to investigate whether salinity stress hinders oyster growth and development. However, at this point, there is still a lack of sufficient empirical evidence. In the present study, a cell cycle regulation gene, cyclin E, was isolated from Hong Kong oysters and its protein expression was analyzed under different salinity treatments. Our results showed that unsuitable salinity could repress the CCNE protein expression of Hong Kong oysters and further negatively affect cell division and proliferation. This study will provide a reference for the healthy culture of Hong Kong oysters.

2. Materials and Methods

2.1. Experimental Shellfish

Diploid Hong Kong oysters (1.5 years old, average wet weight 110 ± 15 g) used in this study were purchased from a commercial oyster farm in Longmen Town, Qingzhou City, Guangxi Province, China. The oysters were bred in plastic tanks with aeration. The seawater in the tanks was renewed twice a day, followed by feeding with Cholrella pyrenoidosa and Platymonas subcordiformis mixture. All experiment protocols were approved by the Institute of Animal Care and Use Committee of Nanning Normal University (Permission No. NNNU-2022-12).

2.2. cDNA Cloning

Before conducting cDNA cloning, the oysters were bred in seawater in plastic tanks at a water temperature of 26 °C and with a salinity of 15 ppt with aeration for 3 days. The FASTA format of whole genome shotgun sequences of C. hongkongensis (genome assembly accession no. GCA_015776775.1) was downloaded from NCBI, and a local nucleotide blast database was created with BioEdit 7.0 [24]. The CCNE cDNA sequence of C. gigas (accession No. XM_011434848.3) was used to search for the reference sequences from the local blast database by BioEdit 7.0 based on the conserved cDNA sequence. The start and stop codons of CCNE from C. hongkongensis were predicted by BLASTP searches (NCBI), and specific primers were designed to amplify the ORF of CCNE gene. Total RNA was extracted from the gill using the RNAiso Plus (TaKaRa, Dalian, China) and treated with RNase-free DNase I (Fermentas, Waltham, MA, USA) to eliminate contaminated genomic DNA. Total RNA in the amount of 1.5 µg was used for the synthesis of the first strand cDNAs using the RevertAid first stand cDNA synthesis kit (Thermo Scientific, Waltham, MA, USA) following the manufacturer’s instructions. The CCNE transcript was amplified by Nested PCR, using primer CCNE outer F with outer R (Table 1) for the primary amplification and CCNE inner F with inner R (Table 1) for the secondary amplification. The annealing temperature was 58 °C and the elongation time was 3 min. Nested PCR products were electrophoresed on a 1.0% agarose gel and cloned into pMD19-T simple vector (TaKaRa, Dalian, China) for sequencing validation.

2.3. Phylogenetic Analyses

The deduced amino acid sequence of the CCNE gene was obtained using the ExPASy Translate Tool (https://web.expasy.org/translate/, accessed on 1 December 2022). A homology search was performed using the BLAST tool at NCBI (http://www.ncbi.nlm.nih.gov/BLAST/, accessed on 1 December 2022). The phylogenetic reconstruction was performed using MEGA software 7.0 [25] by the neighbor-joining method, and a bootstrap consensus tree was inferred from 1000 replicates. GenBank accession numbers of CCNE used for alignment of amino acids and phylogenetic tree construction are as follows: Crassostrea gigas (XP_011433151.1); Crassostrea virginica (XP_022336414.1); Penaeus monodon (AGW23550.1); Homo sapiens (AAM54043.1); Danio rerio (CAA58574.1); Xenopus laevis (CAA78370.1); Gallus gallus (AAA74981.1); Caenorhabditis elegans (AAM78547.1); Mus musculus (CAA53482.1); Rattus rattus (BAA03116.1); Mizuhopecten yessoensis (OWF54564.1); Acanthaster planci (XP_022092193.1).

2.4. Multiple Sequence Alignment

The deduced amino acid sequences of Ch-CCNE (this study) together with five other CCNE genes, XP_011433151.1 from Crassostrea gigas, XP_022336414.1 from Crassostrea virginica, AGW23550.1 from Penaeus monodon, CAA58574.1 from Danio rerio, and AAM54043.1 from Homo sapiens, were aligned to compare their sequence characteristics using the Bioedit ClustalW Alignment program. The nuclear localization sequence of Ch-CCNE sequence was predicted using the cNLS Mapper (https://nls-mapper.iab.keio.ac.jp/cgi-bin/NLS_Mapper_form.cgi, accessed on 1 December 2022). The secondary structure of CCNE protein was predicted by employing NetSurfP 2.0 (http://www.cbs.dtu.dk/services/NetSurfP-2.0/, accessed on 1 December 2022).

2.5. Expression of CCNE mRNA in Different Tissues

Before conducting the mRNA tissue distribution experiment, the oysters were bred in seawater in plastic tanks at a water temperature of 26 °C and a salinity of 15 ppt with aeration for 3 days. To further explore the tissue distribution of CCNE in C. hongkongensis, the basal expression levels of the gene in different tissues were quantified using reverse transcriptase qPCR (RT-qPCR). Tissues, including adductor mussel, mantle, gonad, gill, labial palp, and digestive gland, were collected separately from 6 C. hongkongensis individuals. All the samples were snap-frozen in liquid nitrogen and stored at −80 °C until analyses. Total RNA was extracted from tissues using the RNAiso Plus (TaKaRa, Dalian, China) and treated with RNase-free DNase I (Fermentas, Waltham, MA, USA) to eliminate contaminated genomic DNA. An amount of 1.5 µg total RNA was used for the synthesis of the first strand cDNAs using the RevertAid first stand cDNA synthesis kit (Thermo Scientific, Waltham, MA, USA). The CCNE and housekeeping gene β actin specific primers used for RT-qPCR analysis are listed in Table 1. The amplification products of CCNE and β actin were 248 bp and 188 bp in length, respectively. Amplification was conducted on a qTOWER 2.2 Real-Time PCR (Analytik Jena AG, Jena, Germany) using the PowerUp SYBR Green Real-time PCR Master Mix kit (Thermo Scientific, Waltham, MA, USA). Each 20 µL reaction contained 10 µL of PowerUp SYBR Green Real-time PCR Master Mix, 2 µL of cDNA template, 1 µL of each primer (10 µM), and 6 µL of water. Sterilized water was substituted for the cDNA in negative control samples. The amplification program was performed as follows: pre-denaturation at 95 °C for 2 min followed by 40 cycles at 95 °C for 15 s, 60 °C for 30 s, and 72 °C for 30 s. Each sample was analyzed in triplicate.

2.6. Protein Expression and Purification

The complete ORF of ChCCNE cDNA was PCR amplified from pMD-19T simple-ChCCNE vector using the specific primers CCNE PE F and CCNE PE R (Table 1). The PCR products were digested via EcoR I and Sal I overnight, followed by overhang ligation with the same sites of prokaryotic expression vector pET32a(+) (Invitrogen, Carlsbad, CA, USA). The recombinant plasmid pET32a(+)-ChCCNE was sequenced and then transformed into E. coli BL21 (DE3) competent cells. Once the OD600 value of the bacterial cultures reached about 0.4, isopropyl-β-D-thiogalactopyranoside (IPTG) was added at a final concentration of 1.0 mM. The expression of recombinant protein was induced for 4 h at 37 °C with shaking at 200 rpm. Then the cells were centrifuged at 6000× g for 10 min and sonicated on ice. The rChCCNE protein was found mainly distributed in the inclusion bodies. The recombinant protein with an N-terminal His(6) tag was purified by nickel-chelating agarose gel (Ni2+-NTA) affinity chromatography (Ni-NTA agarose) (QIAGEN, Valencia, CA, USA) under 8 M urea denature conditions. The samples were analyzed using 12% sodium dodecyl sulfate-polyacrylamide gel electrophoresis (SDS-PAGE).

2.7. Polyclonal Antibody Generation

For generating the polyclonal antibody, 100 μg of purified rChCCNE mixed with Freund’s complete adjuvant (Sigma, St. Louis, MO, USA) was injected intraperitoneally into a BALB/c mouse. After 2 weeks, the mouse was boosted with 100 μg of antigen in Freud incomplete adjuvant by the same route. After three additional boosters, the titers of antiserums were determined by indirect enzyme-linked immunosorbent assay (ELISA). Blood samples from 6 immunized mice were collected, and the serum was stored at −20 °C. Mice were housed in an animal room according to guidelines of the Laboratory Animal Care. To assess immune titer, the rChCCNE protein antigen was diluted to 2 µg/mL in carbonate buffer and incubated on the wells of ELISA plate at 4 °C overnight. Blocking buffer (PBS with 5% milk) in the amount of 200 µL was added into each well, and the plate was incubated at room temperature (RT) for 2 h. Antiserum samples measuring 100 µL (1:2000, 1:4000, 1:8000, 1:16,000, 1:32,000, and 1:64,000, diluted in blocking buffer) and the control (pre-immune serum 1:1000, diluted in blocking buffer; blank blocking buffer) were added to the wells and kept at RT for 60 min. HRP-labeled goat anti-mouse IgG in the amount of 100 µL (1:5000, diluted in blocking buffer) was added into each well and kept at 37 °C for 45 min. TMB substrate in the amount of 100 µL was added into each well and kept in the dark at RT for 10 min. Optical density at 450 nm (OD450) was measured on the microplate reader.

2.8. Western Blotting

To avoid rapid and massive deaths of the oysters caused by sudden changes in salinity under high temperature, the oysters were acclimated in seawater in plastic tanks at a water temperature of 20 °C and a salinity of 15 ppt with aeration for 3 days. To evaluate the expression of CCNE in the gills of C. hongkongensis under different salinity, 80 C. hongkongensis individuals were randomly assigned to 4 groups, i.e., to 5 ppt, 15 ppt, 25 ppt, and 35 ppt groups; then the seawater temperature in the tanks was raised to 26 °C within 24 h. The gills were sampled at 0, 2, 4, 6, 8, and 10 days post salinity treatment, respectively, and snap-frozen in liquid nitrogen and stored at −80 °C until being subjected to Western blot analysis. The gill lysates were separated on 12% SDS-PAGE gel and transferred to nitrocellulose membrane, then blocked in 5% milk in PBST for 1 h at room temperature. The membrane was probed with anti-CCNE polyclonal mouse antiserums (1:1000 dilutions) overnight at 4 °C, and mouse anti-α-tubulin (Beyotime Institute of Biotechnology, Haimen, China, AF2827, 1:1000 dilutions) was used as a control screen to normalize protein loading. HRP-conjugated goat anti-mouse IgG (H + L) (Beyotime Institute of Biotechnology, Haimen, China, A0216, 1:1000 dilutions) was used as the secondary antibody for DAB (Solarbio, Beijing, China) visualization. The intensity of the immunostaining (DAB) was measured with ImageJ v. 154 Software. Briefly, images were changed to 8-bit gray-scale type, and the cumulative gray-scale values for an entire lane were measured. Then the gray-scale values for each particular band were recorded respectively. CCNE protein concentrations were normalized to α-tubulin.

2.9. Immunofluorescence Staining

Hong Kong oysters were bred in seawater in plastic tanks at a water temperature of 26 °C and a salinity of 15 ppt with aeration for 10 days for acclimation, and their gills were subjected to immunofluorescence staining analysis. Paraffin-embedded gill sections were dewaxed in three changes of xylene, followed by three changes of pure ethanol for deparaffinize and rehydrate. After immersion in a citric acid antigen repair solution at a pH of 6.0, 3% BSA solution was added onto slices to block non-specific binding at room temperature for 30 min. The blocking solution was gently shaken off, and the slices were incubated with CCNE antiserum (1:500 dilutions in PBS) overnight at 4 °C. Cy3-labeled goat anti-mouse IgG antibody (Servicebio GB21301, 1:300 dilution in PBS) was dripped onto the tissue and incubated at room temperature for 50 min in dark. Then, the DAPI solution was dripped onto the slices, which were subsequently incubated at room temperature for 10 min in dark. The slices were washed three times with PBS (pH 7.4) in a decoloring shaker for 5 min each time. After each slice was slightly air dried, it was then covered with a coverslip after the addition of a drop of anti-fade mounting medium. Microscopy detection and image collection were conducted with ortho-fluorescent microscopy (NIKON ECLIPSE C1, Nikon, Tokyo, Japan) and an imaging system (NIKON DS-U3, Nikon, Tokyo, Japan).

2.10. Statistical Analysis

Statistical analysis was performed using Graphpad Prism 5 (GraphPad Software Inc.; San Diego, CA, USA) and the relative abundance of mRNA for target genes was calculated using the 2−ΔΔCt method [26] with the β actin as the reference. Data are presented as mean ± standard error of the mean (SEM). The Student’s t-test was used to assess statistical differences of expression levels between groups. For multiple group comparison, one-way ANOVA followed by Tukey’s test was used for statistical analysis. Differences were considered to be of statistical significance when p < 0.05.

3. Results

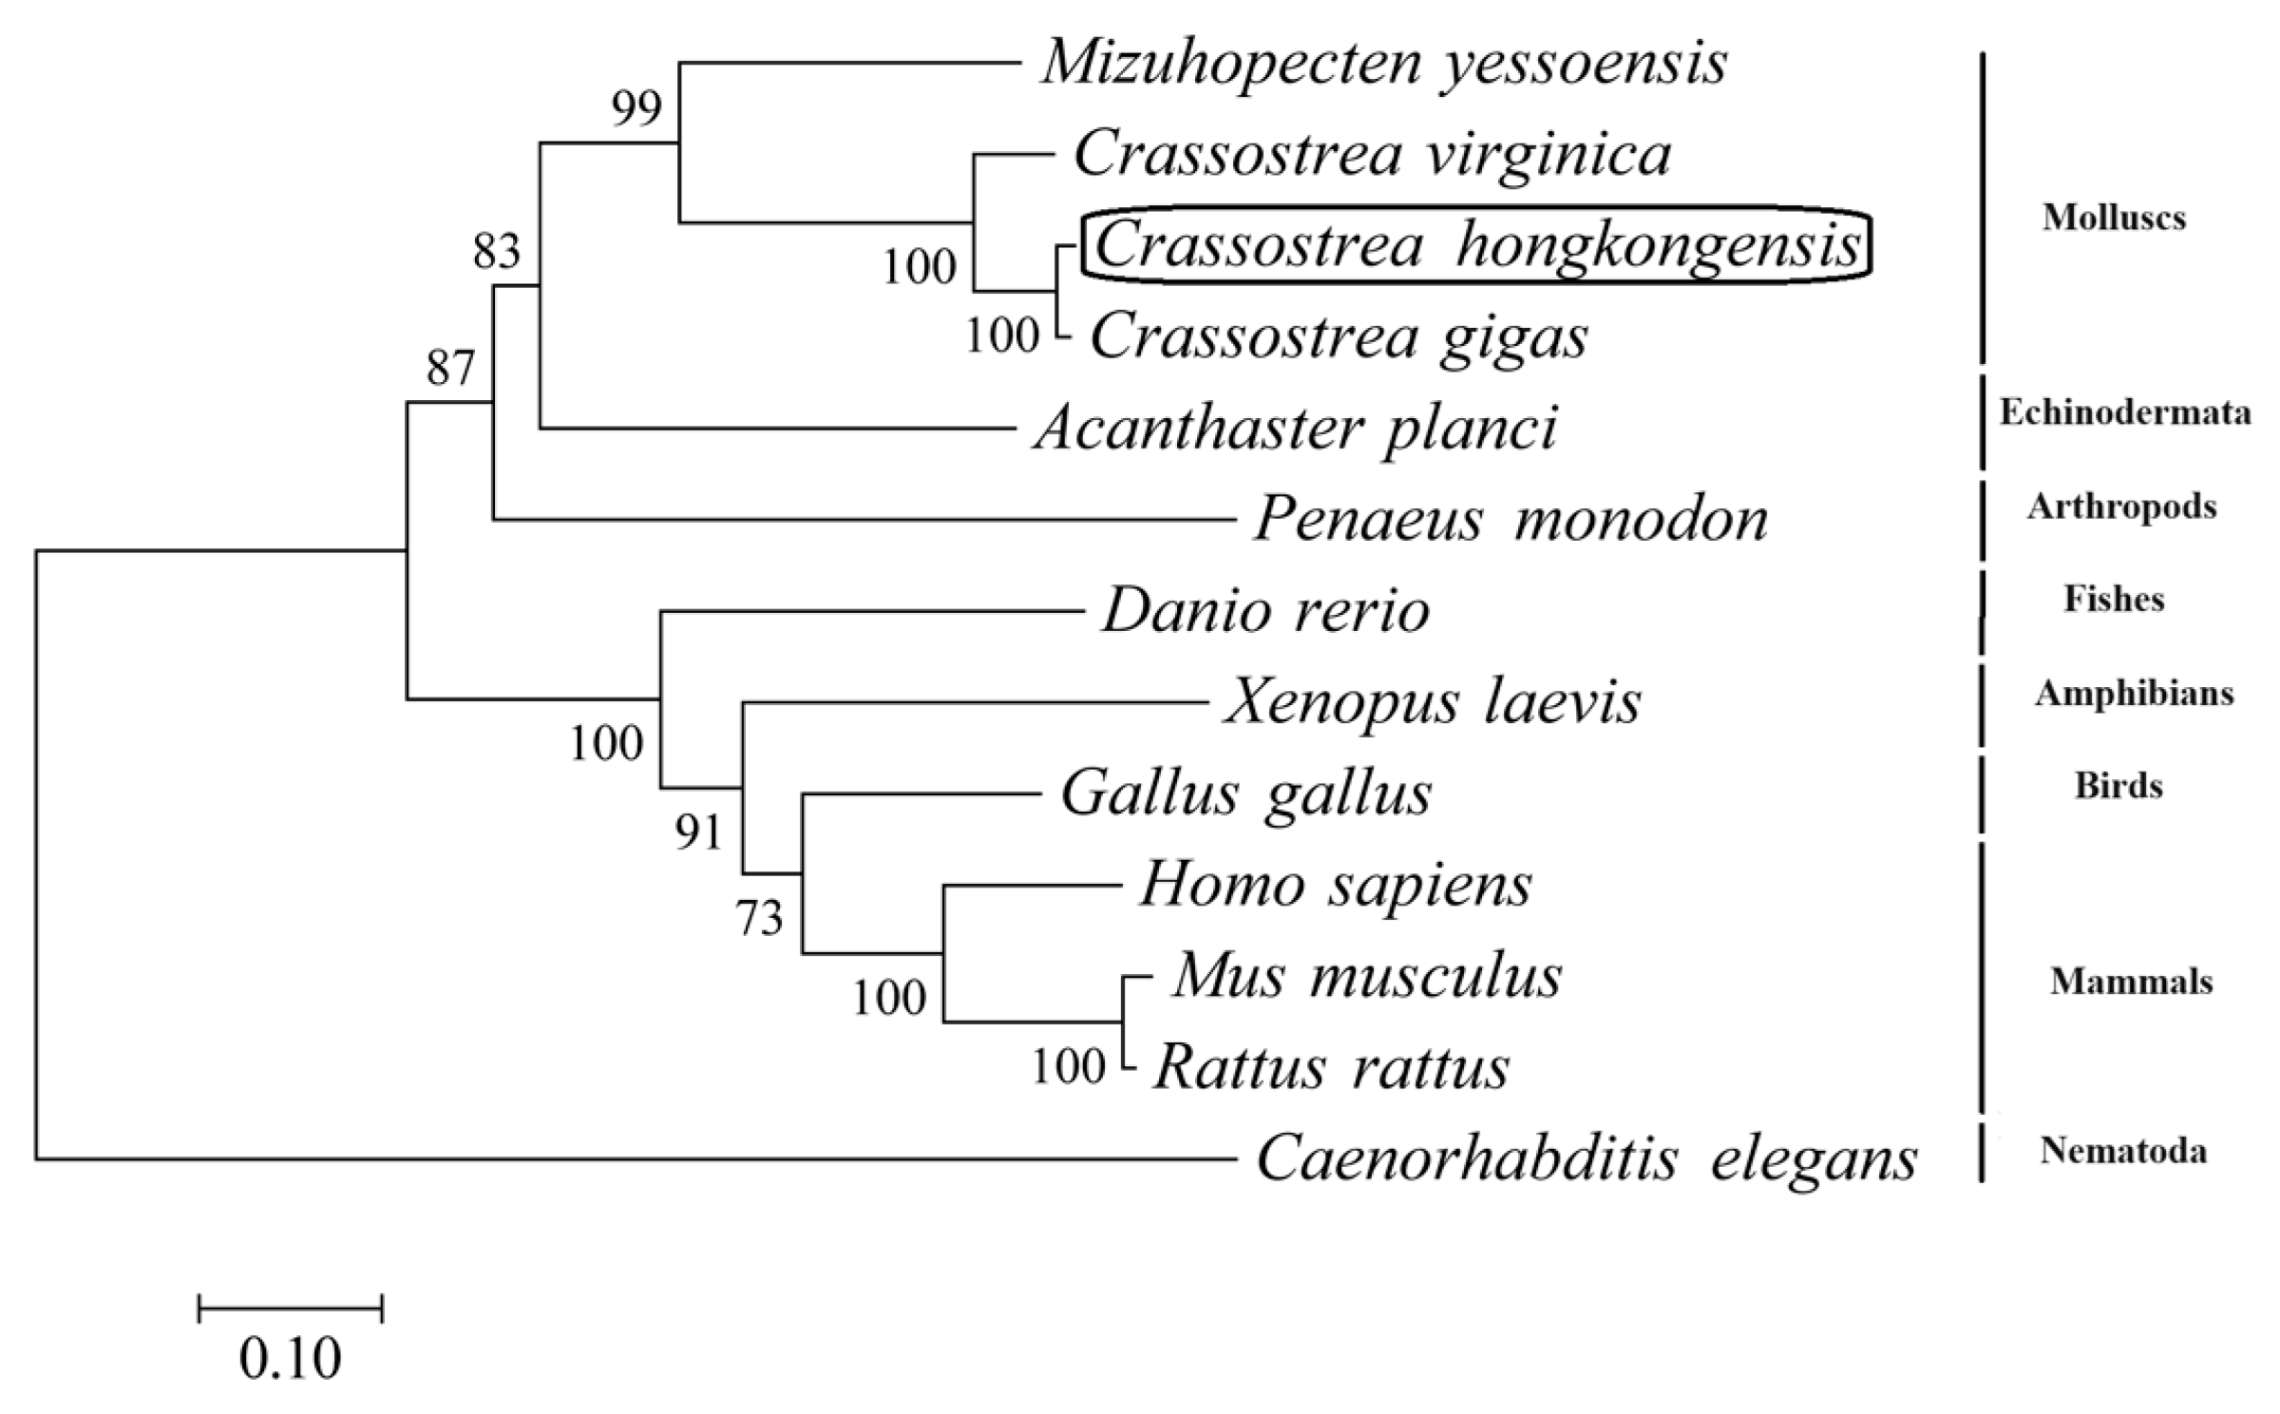
3.1. Sequence and Phylogenetic Analyses

A CCNE cDNA sequence was isolated from a gill cDNA library from C. hongkongensis. The cDNA (Genbank accession No. OR905614) is 2808 bp in length, including a 5′-UTR of 139 bp, a 3′-UTR of 1346 bp, and an ORF of 1323 bp encoding a 440 amino acid protein with a calculated molecular mass of 50.85 kDa and a theoretical pI of 5.25. The CCNEs of 13 species with full-length amino acid sequences available in GenBank was used to construct the phylogenetic tree (Figure 1) via the neighbor-joining method. C. hongkongensis was clustered into one clade with molluscs, and then grouped with Acanthaster planci (echinodermata) and Penaeus monodon (arthropods). The other branch comprises Danio rerio (fishes), Xenopus laevis (amphibians), Gallus gallus (birds), and mammals, while Caenorhabditis elegans (nematoda) formed a side branch in the phylogenetic tree.

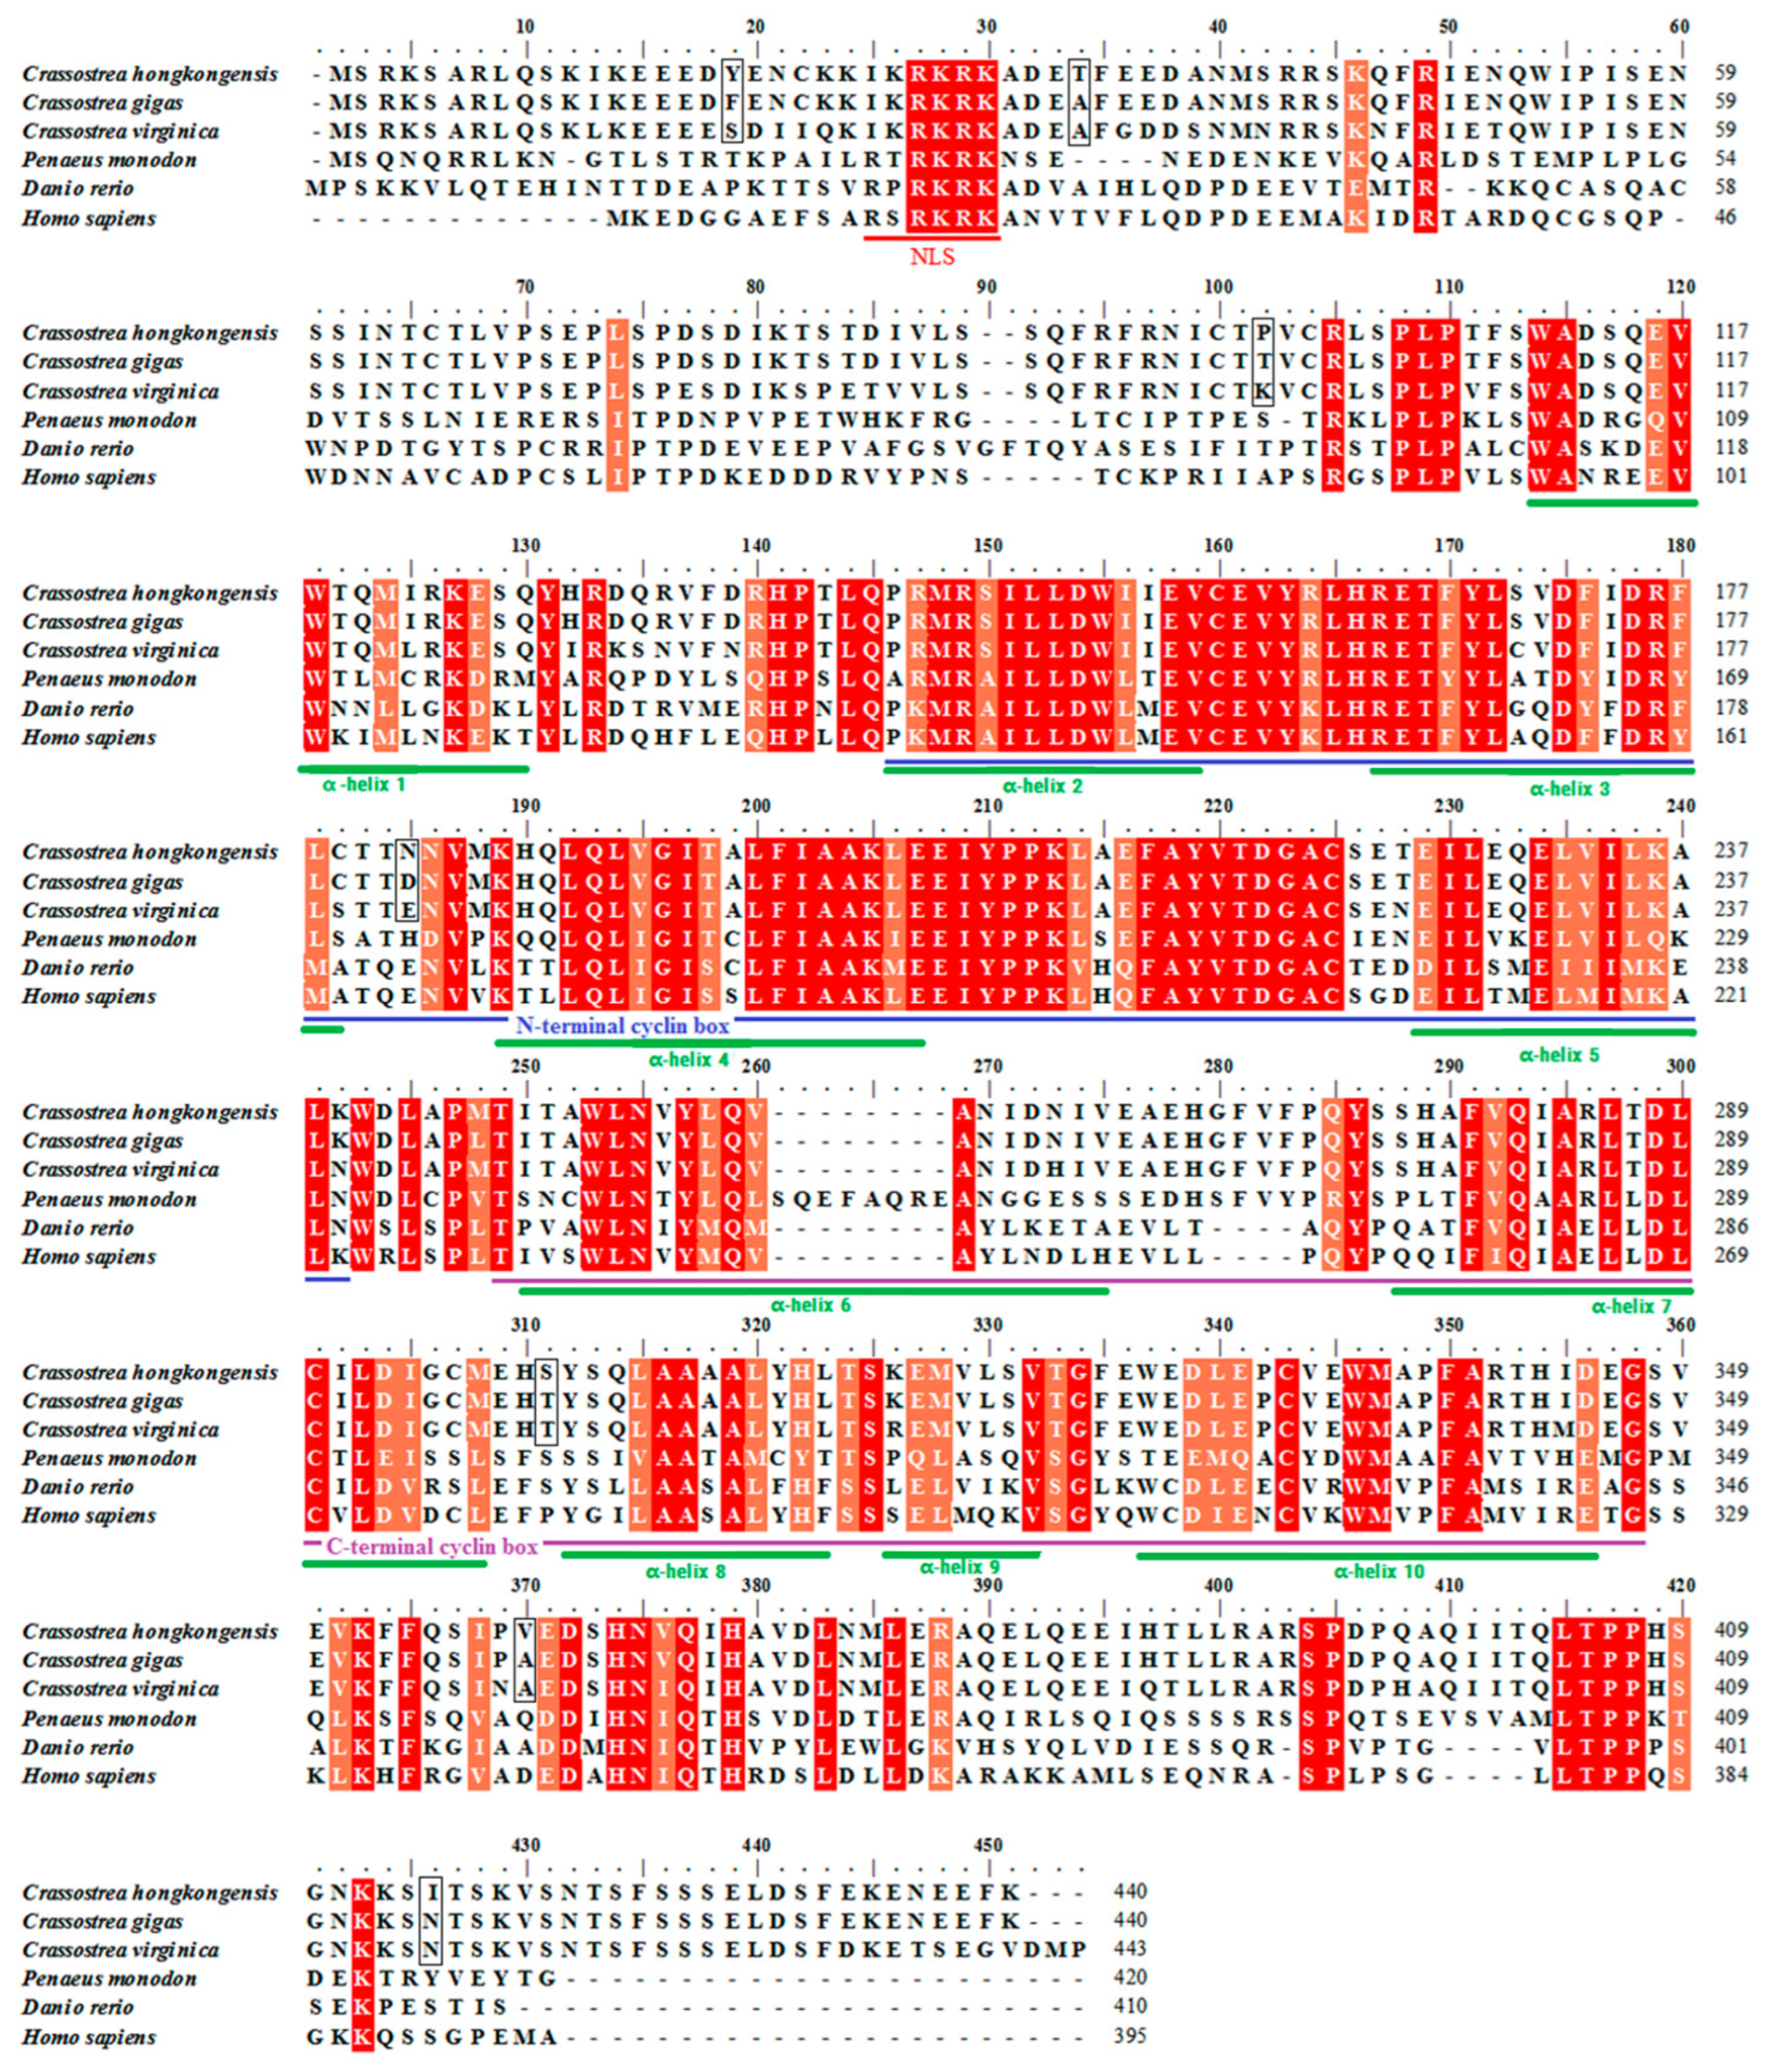
3.2. Multiple Sequence Alignment

Multiple sequence alignment revealed that the deduced amino acid sequence of the Ch-CCNE was highly conserved and shared homology with amino acid sequences of the species from the genera Crassostrea, Penaeus, Danio, and Homo (Figure 2). In detail, an NLS ‘IKRKRK’ was identified at the amino acid residue positions 65–70 in the CCNE of Hong Kong oysters. And two cyclin boxes, i.e., N-terminal and C-terminal cyclin boxes were discovered in Ch-CCNE protein sequence through homologous sequence alignment. In addition, a total of ten conserved α-helices were predicted in CCNEs of the species from Crassostrea. Only one α-helix domain was located between the NLS and the N-terminal cyclin box. Four and five α-helices were found in the N-terminal cyclin box and C-terminal cyclin box, respectively. Additionally, there were seven unique amino acids in the CCNE of Hong Kong oysters in comparison with those in Crassostrea gigas and Crassostrea virginica.

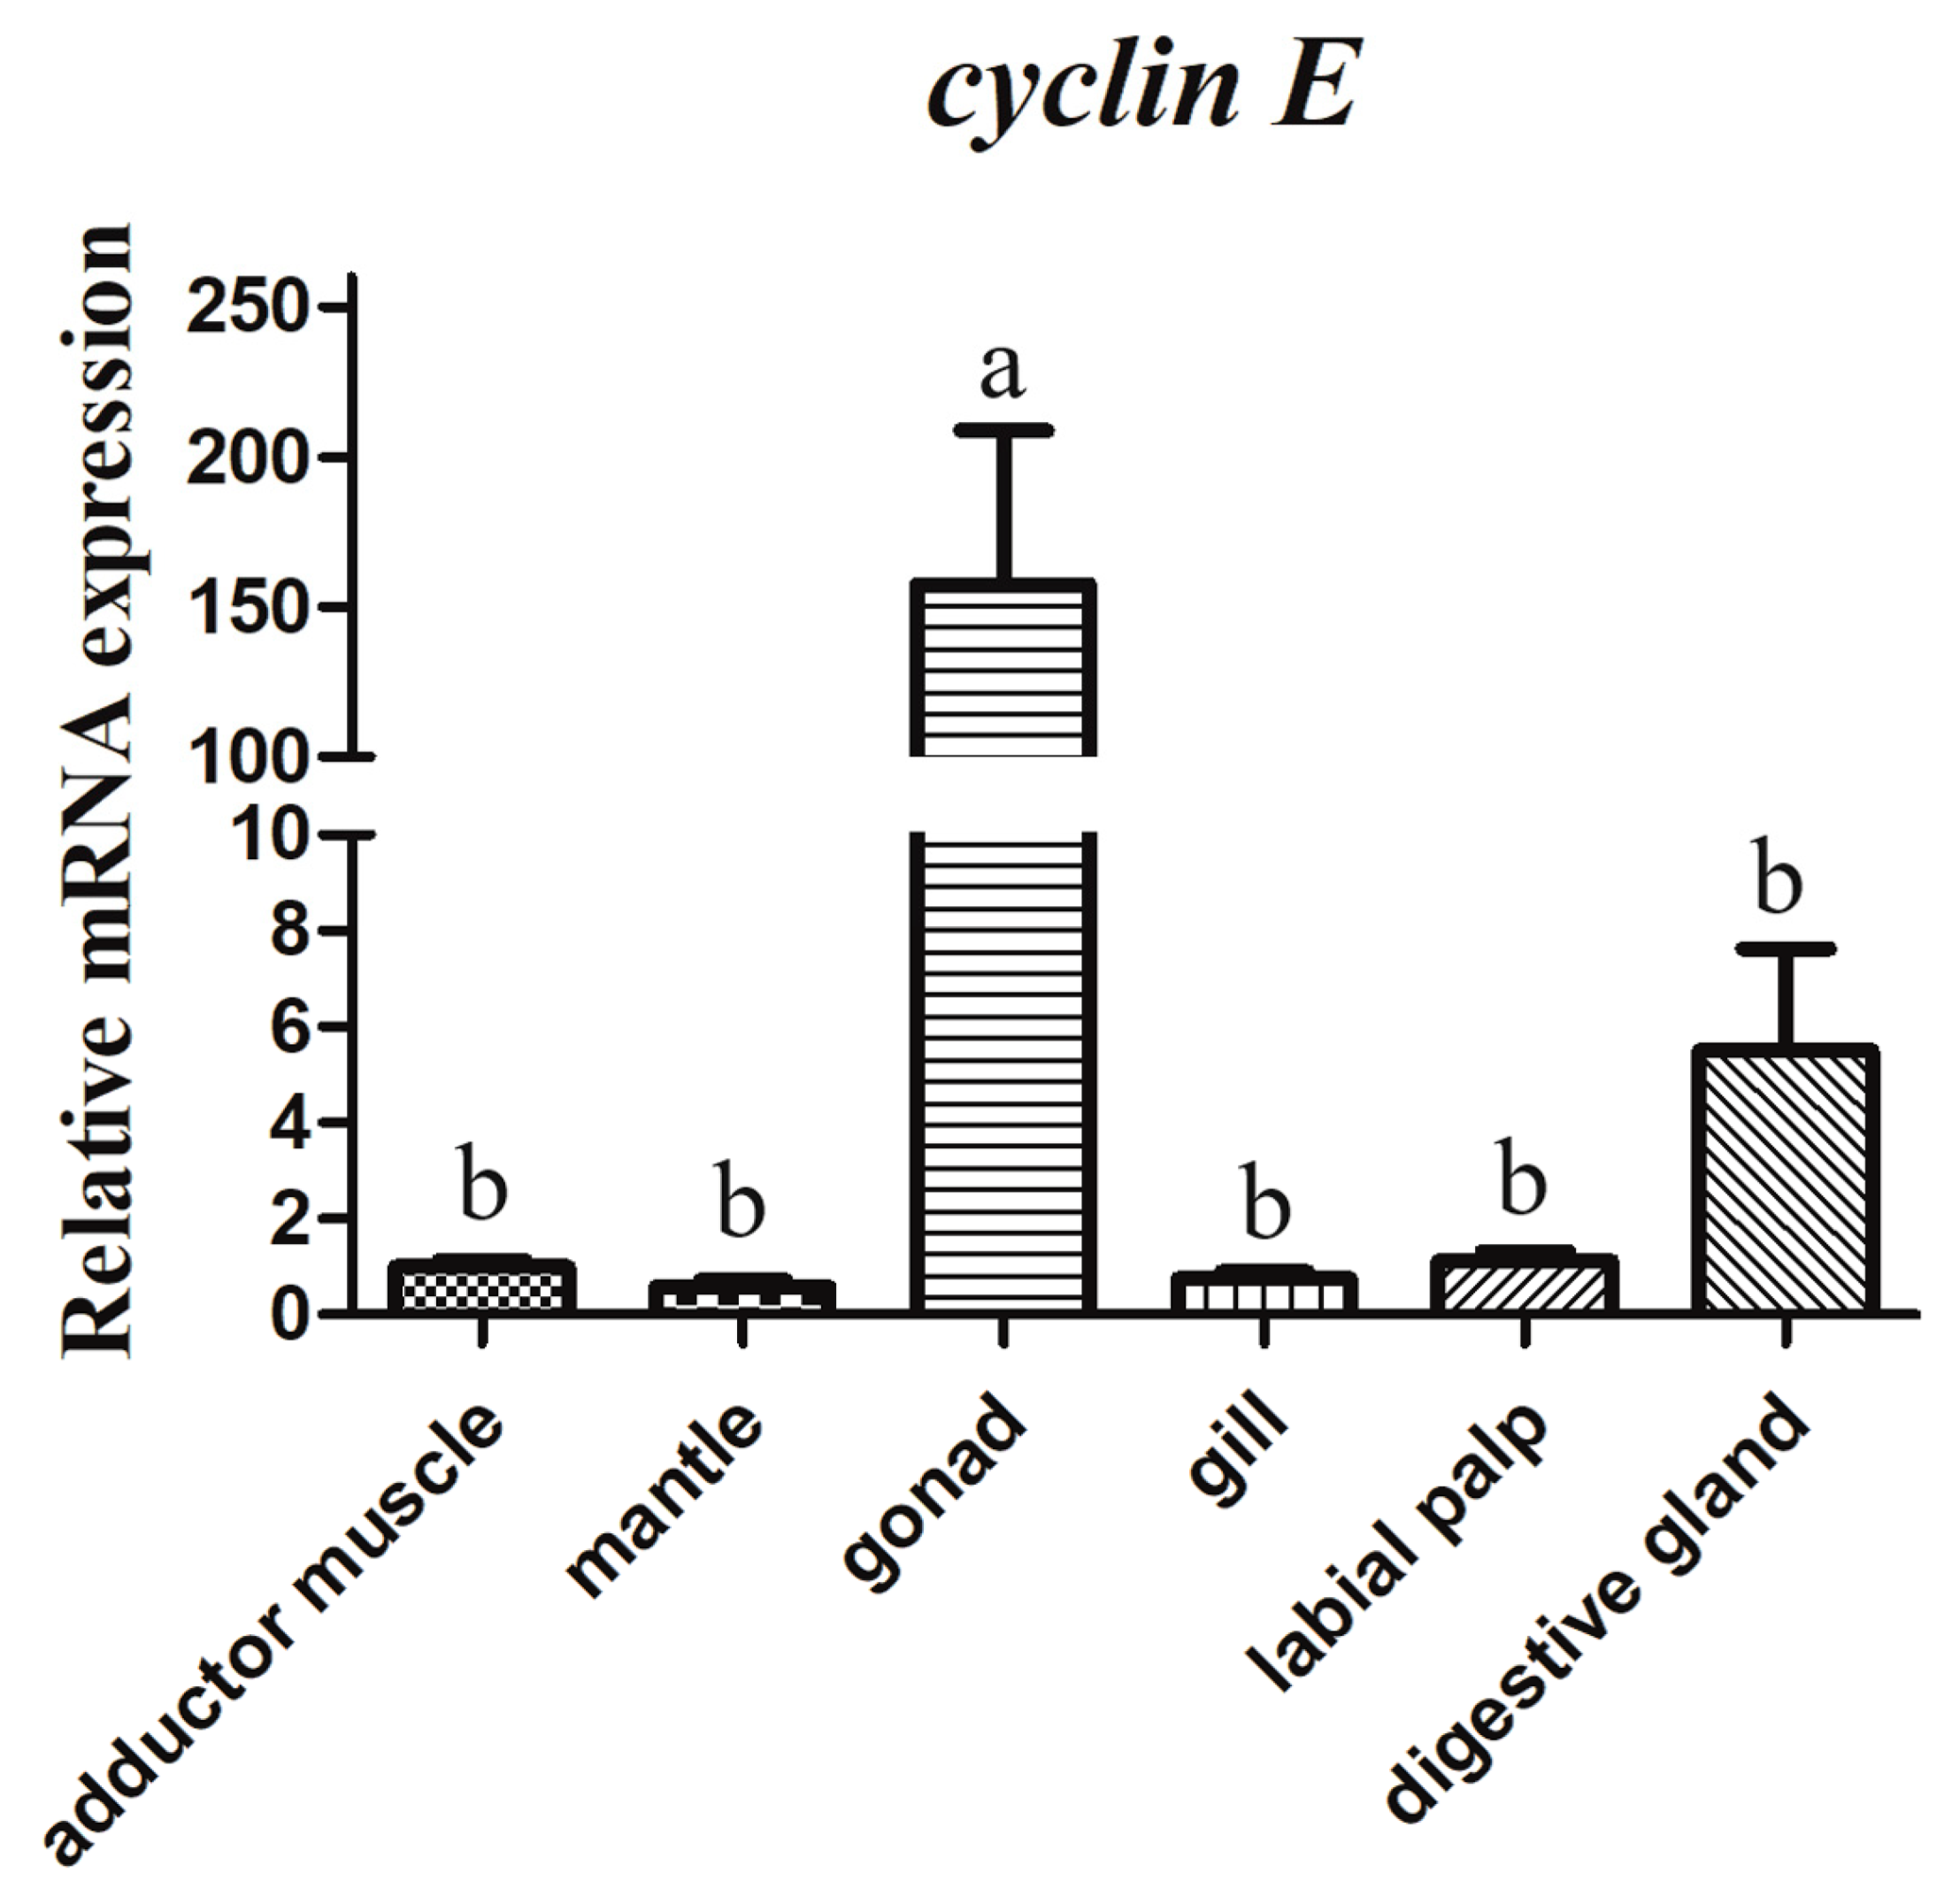
3.3. mRNA Tissue Distribution

The expression levels of Ch-CCNE mRNA in different tissues were determined using RT-qPCR and normalized to the internal housekeeping gene, β actin. According to the RT-qPCR results (Figure 3), Ch-CCNE was widely distributed in the six different tissues examined. Ch-CCNE was predominantly expressed in the gonad and showed a significant difference with the gene expression in the adductor muscle, mantle, gill, labial palp, and digestive gland, and the expression of Ch-CCNE in the adductor muscle, mantle, gill, and labial palp was of a lower level.

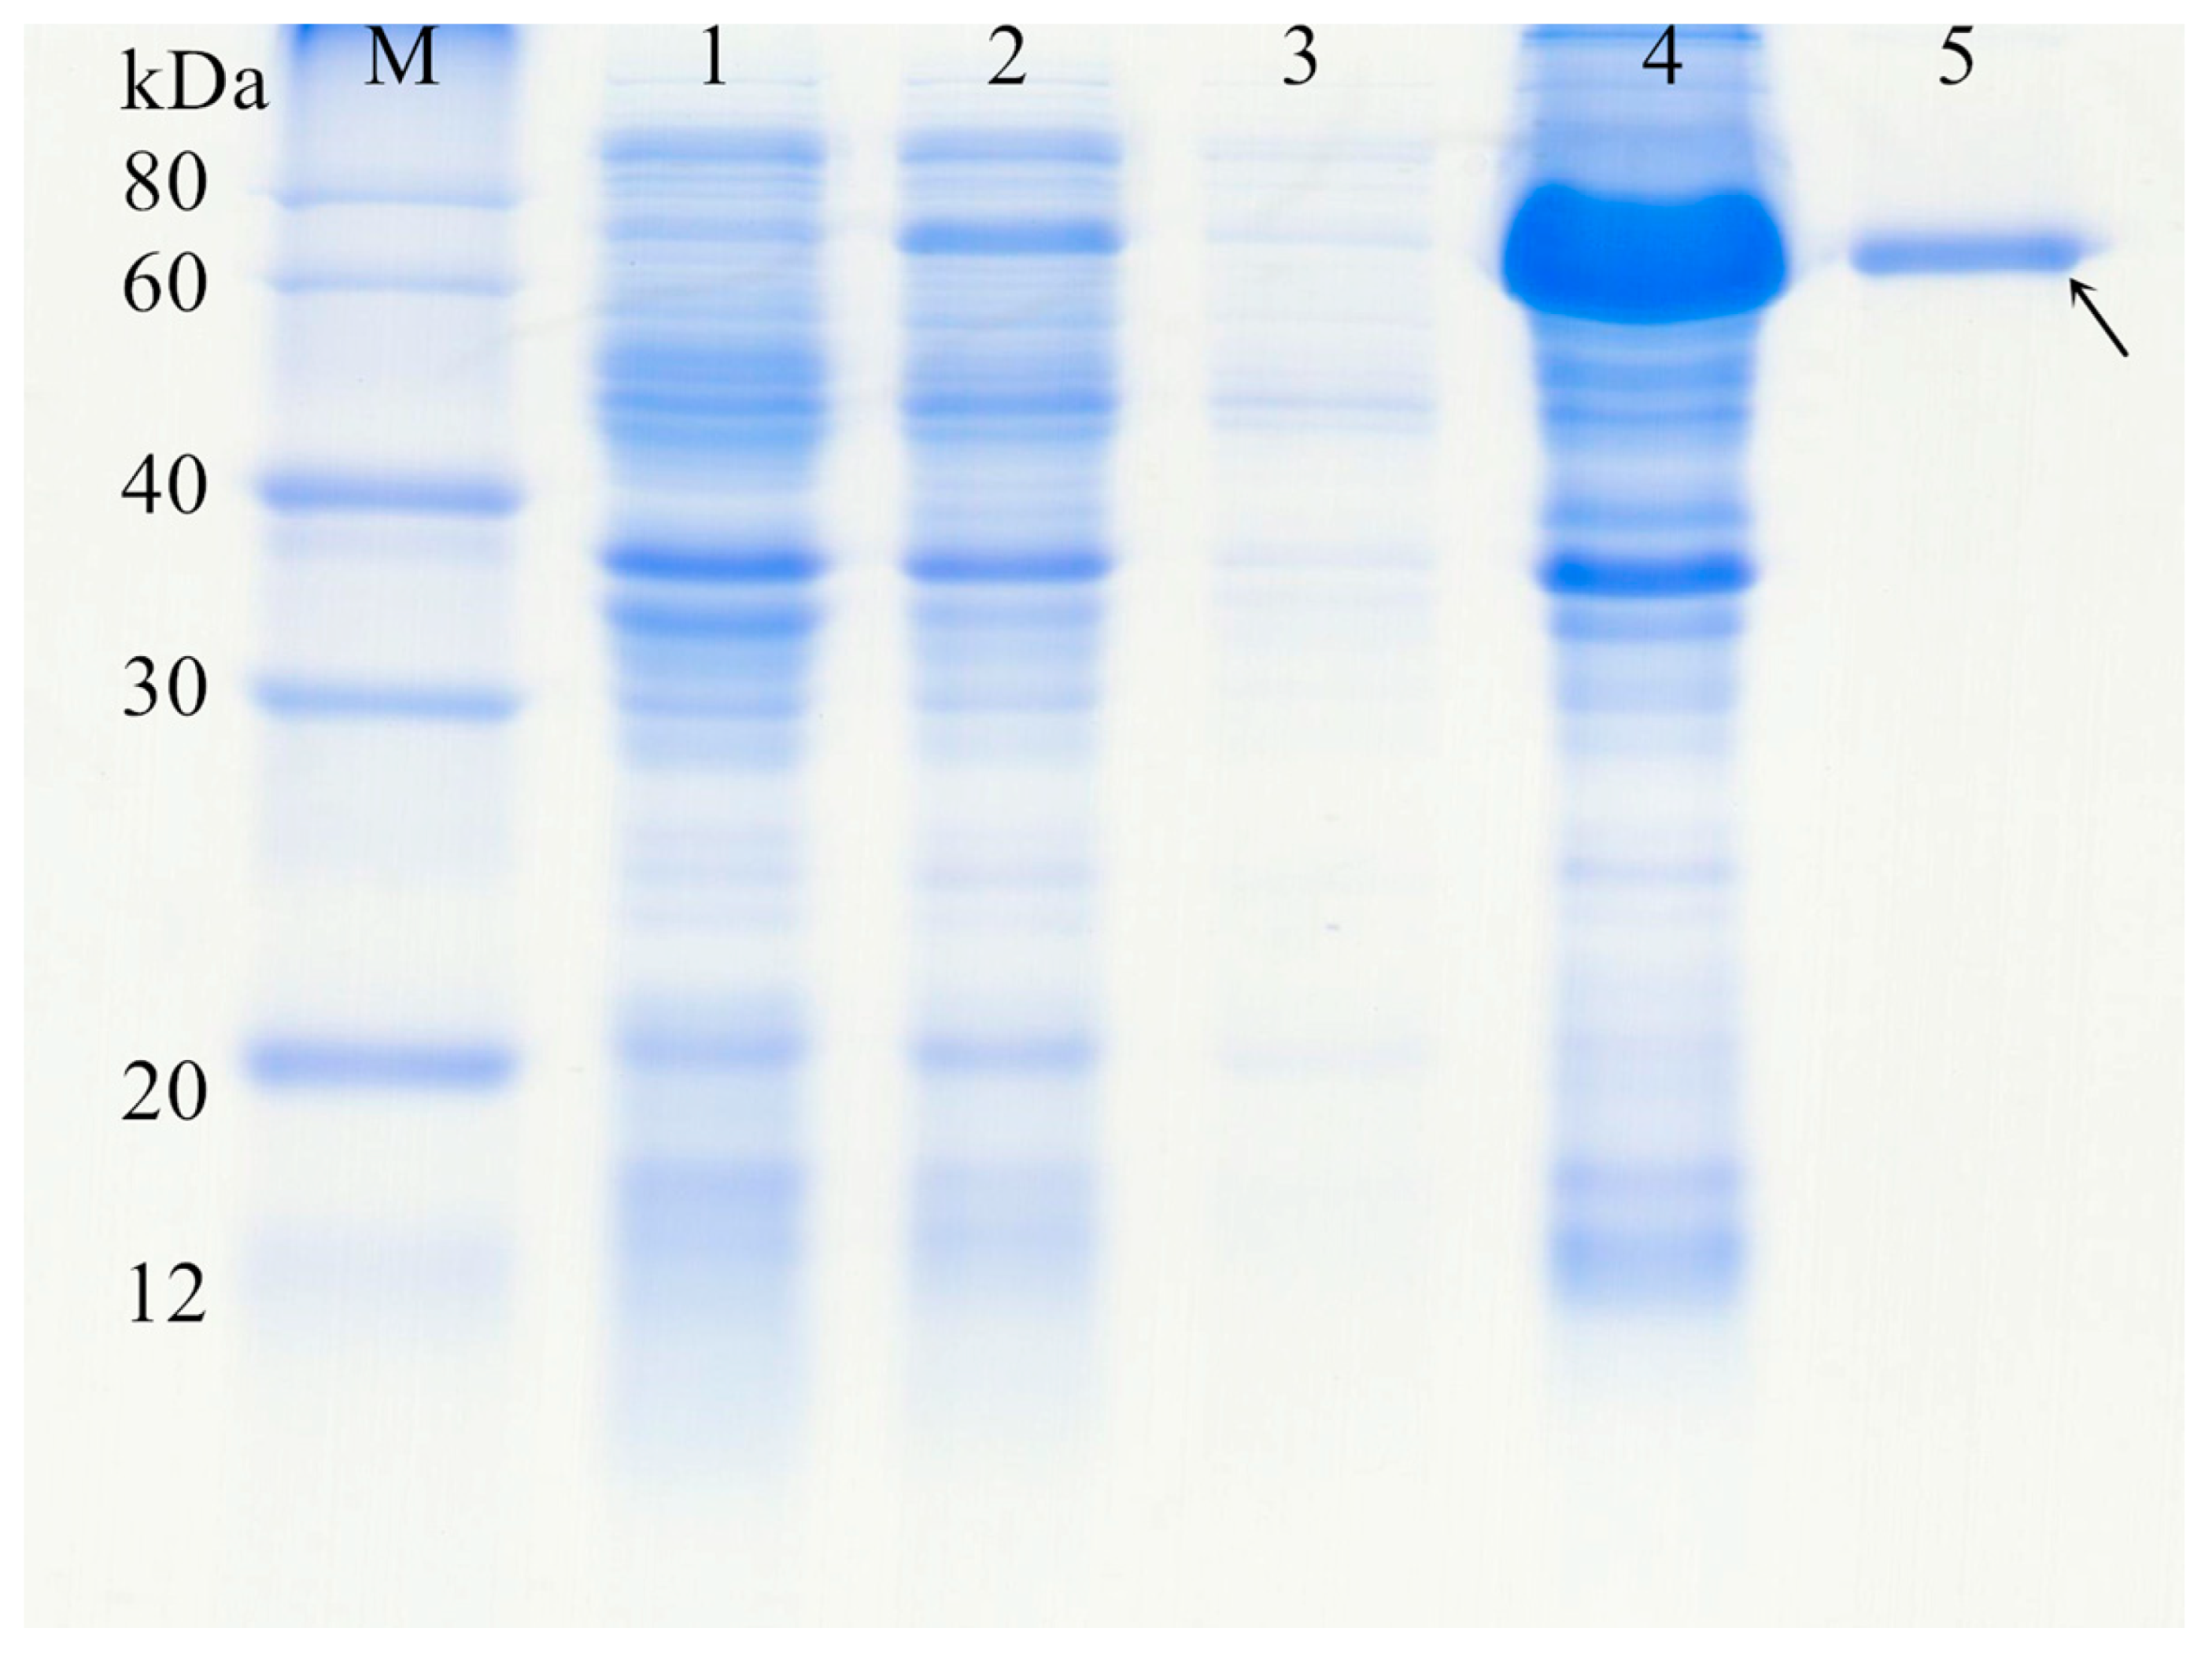
3.4. Protein Expression and Purification

The Ch-CCNE ORF sequence was amplified from the plasmid of the pMD-19T simple recombinant vector using PCR and then sub-cloned into the prokaryotic expression plasmid vector of pET32a(+) via EcoR I and Sal I synchronous enzyme digestion and DNA ligation. The rChCCNE protein was successfully induced using IPTG at a dosage of 1.0 mM in E. coli BL21 (DE3), and the expressed protein mainly existed in the form of an inclusion body. The 6× His tagged fusion protein was purified on Ni-NTA resin under denaturing conditions and showed a relative molecular mass of about 68 kDa in SDS-PAGE analysis (Figure 4).

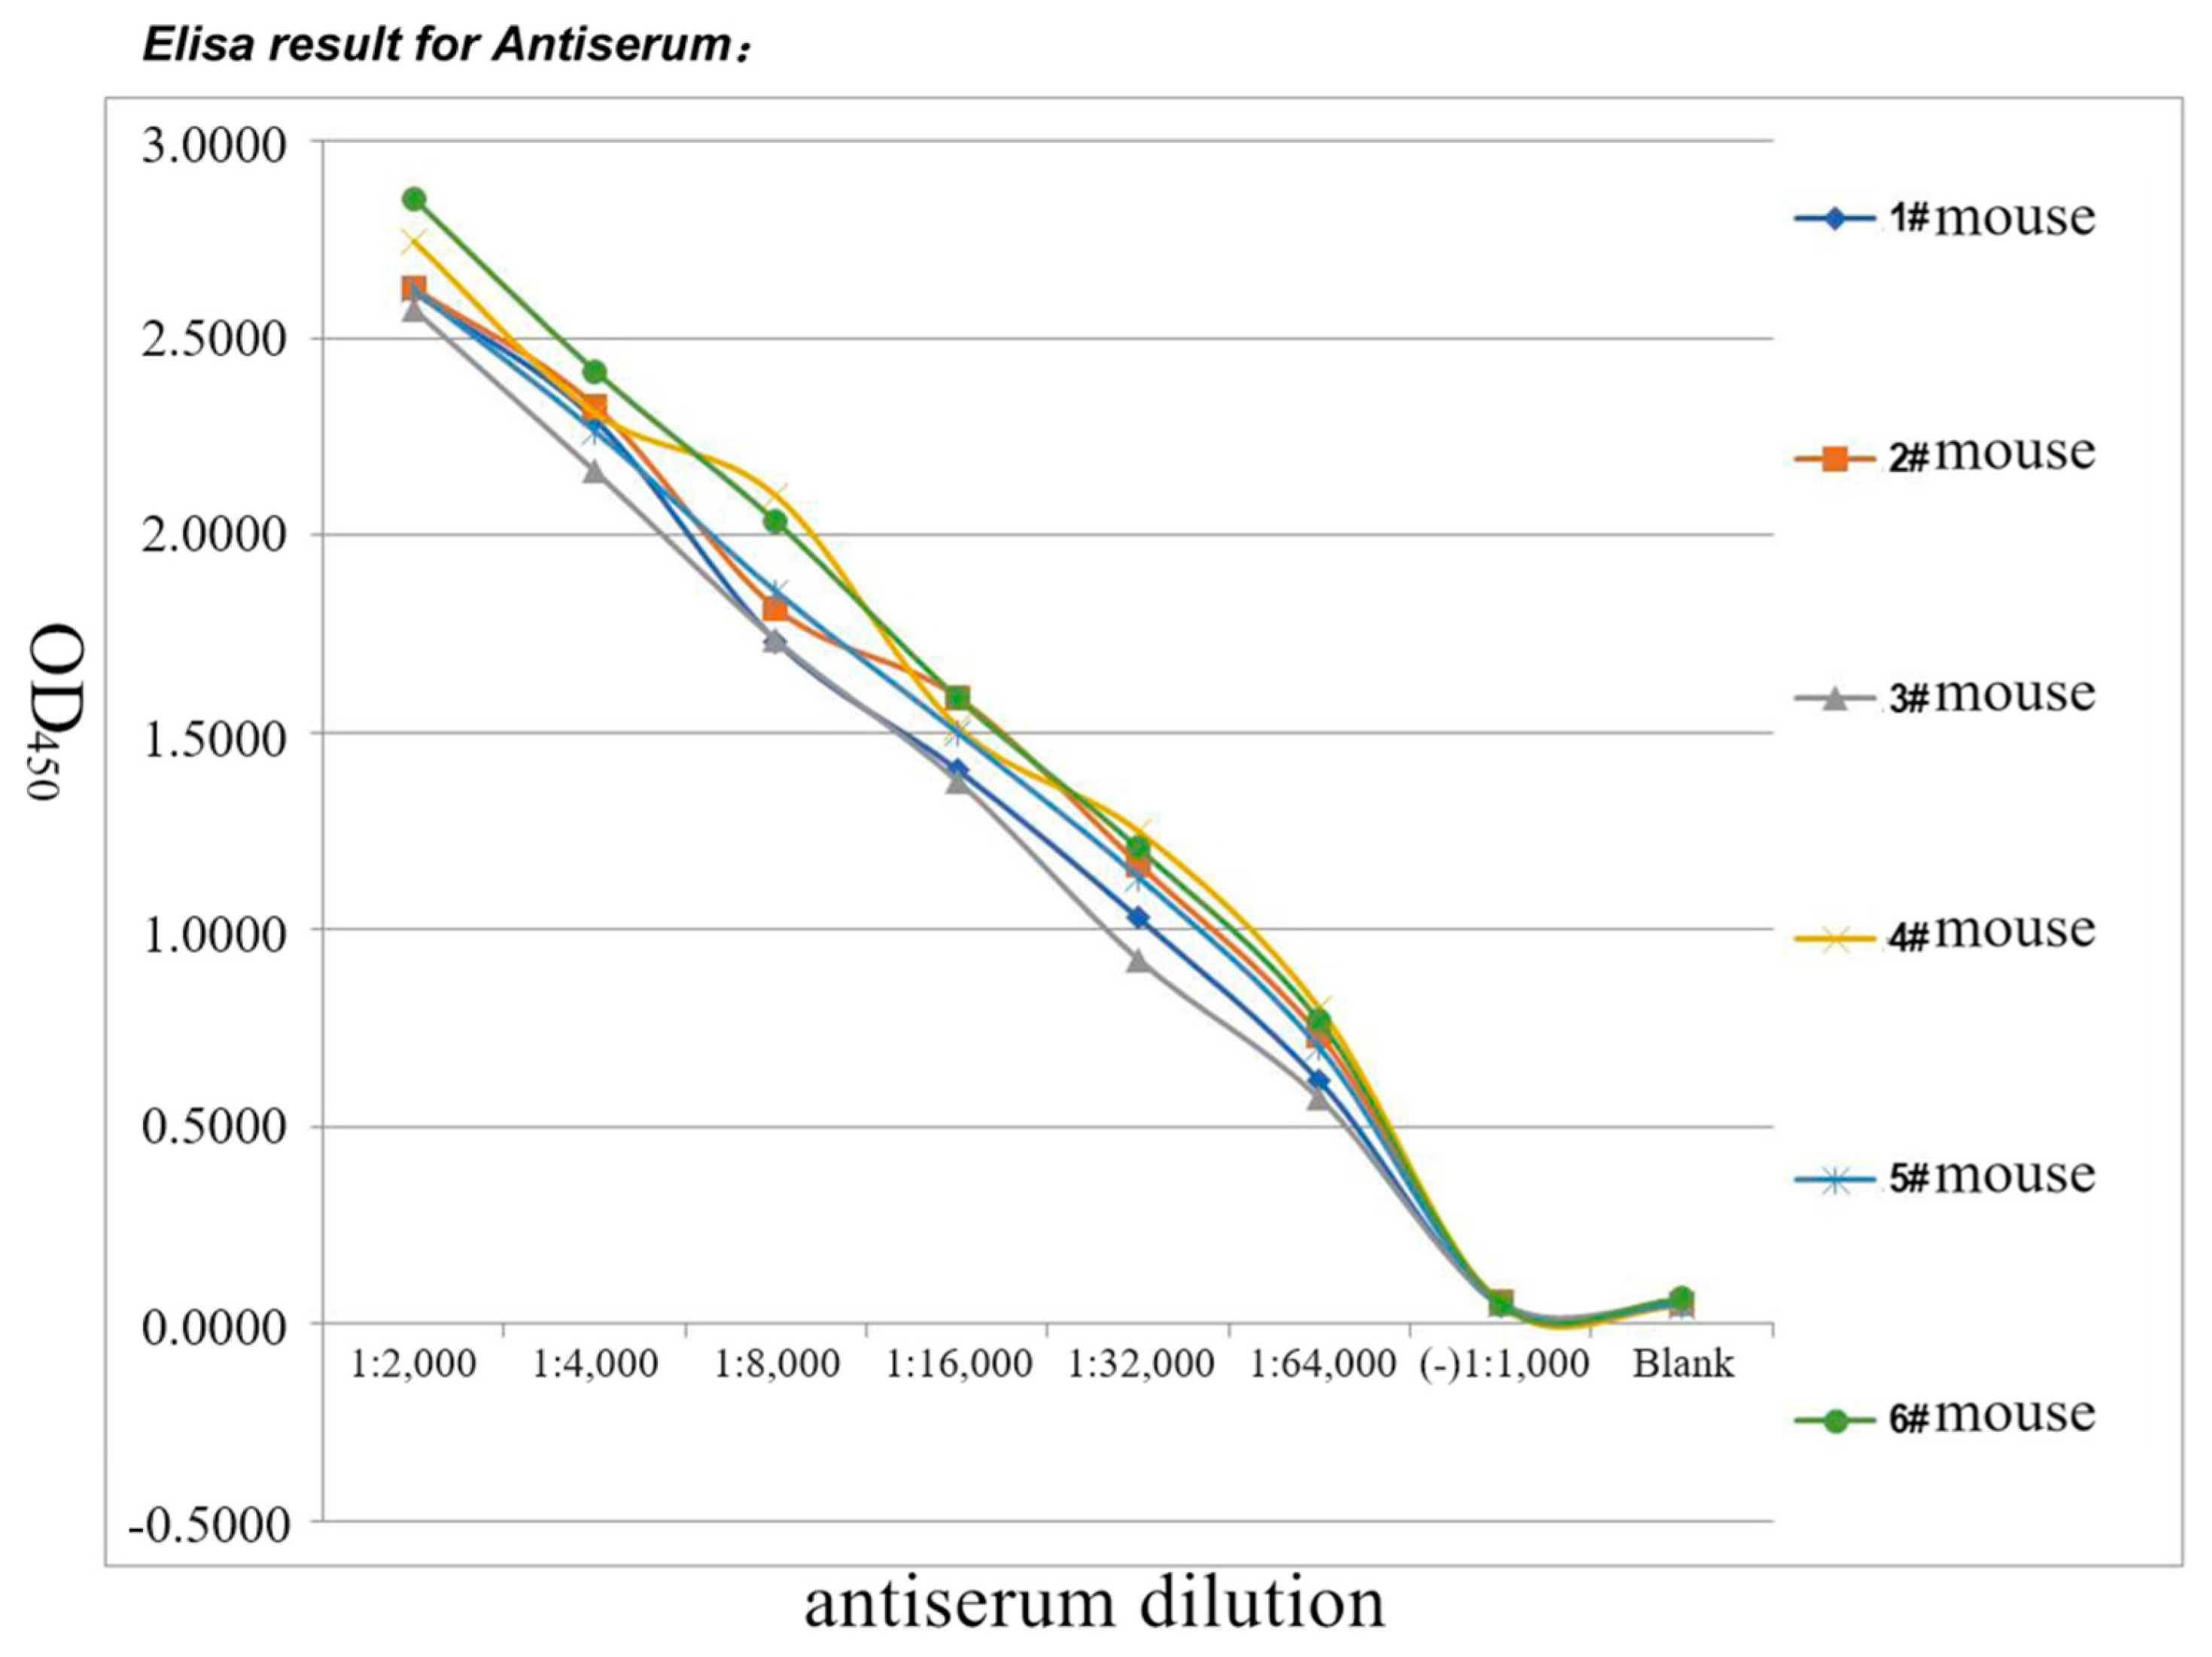
3.5. Polyclonal Antibody Generation

Antiserums were collected from six immunized mice after the fifth immunization, and their titers were determined with ELISA. A positive/negative value higher than 2.0 and an OD450 value over 0.2 were determined to constitute the comprehensive positive standard for ELISA. As shown in Figure 5, the antiserums of these six immunized mice exhibited similar OD450 absorption curves. The OD450 values decreased from 2.67 ± 0.11 to 0.70 ± 0.09 as the antiserum dilution ratio increased from 1:2000 to 1:64,000, and the 1:64,000 diluted antiserums of all six immunized BALB/c mice also showed positive values. The 1:1000 diluted pre-immune serum (negative serum) and blocking buffer (blank) were set as the negative control.

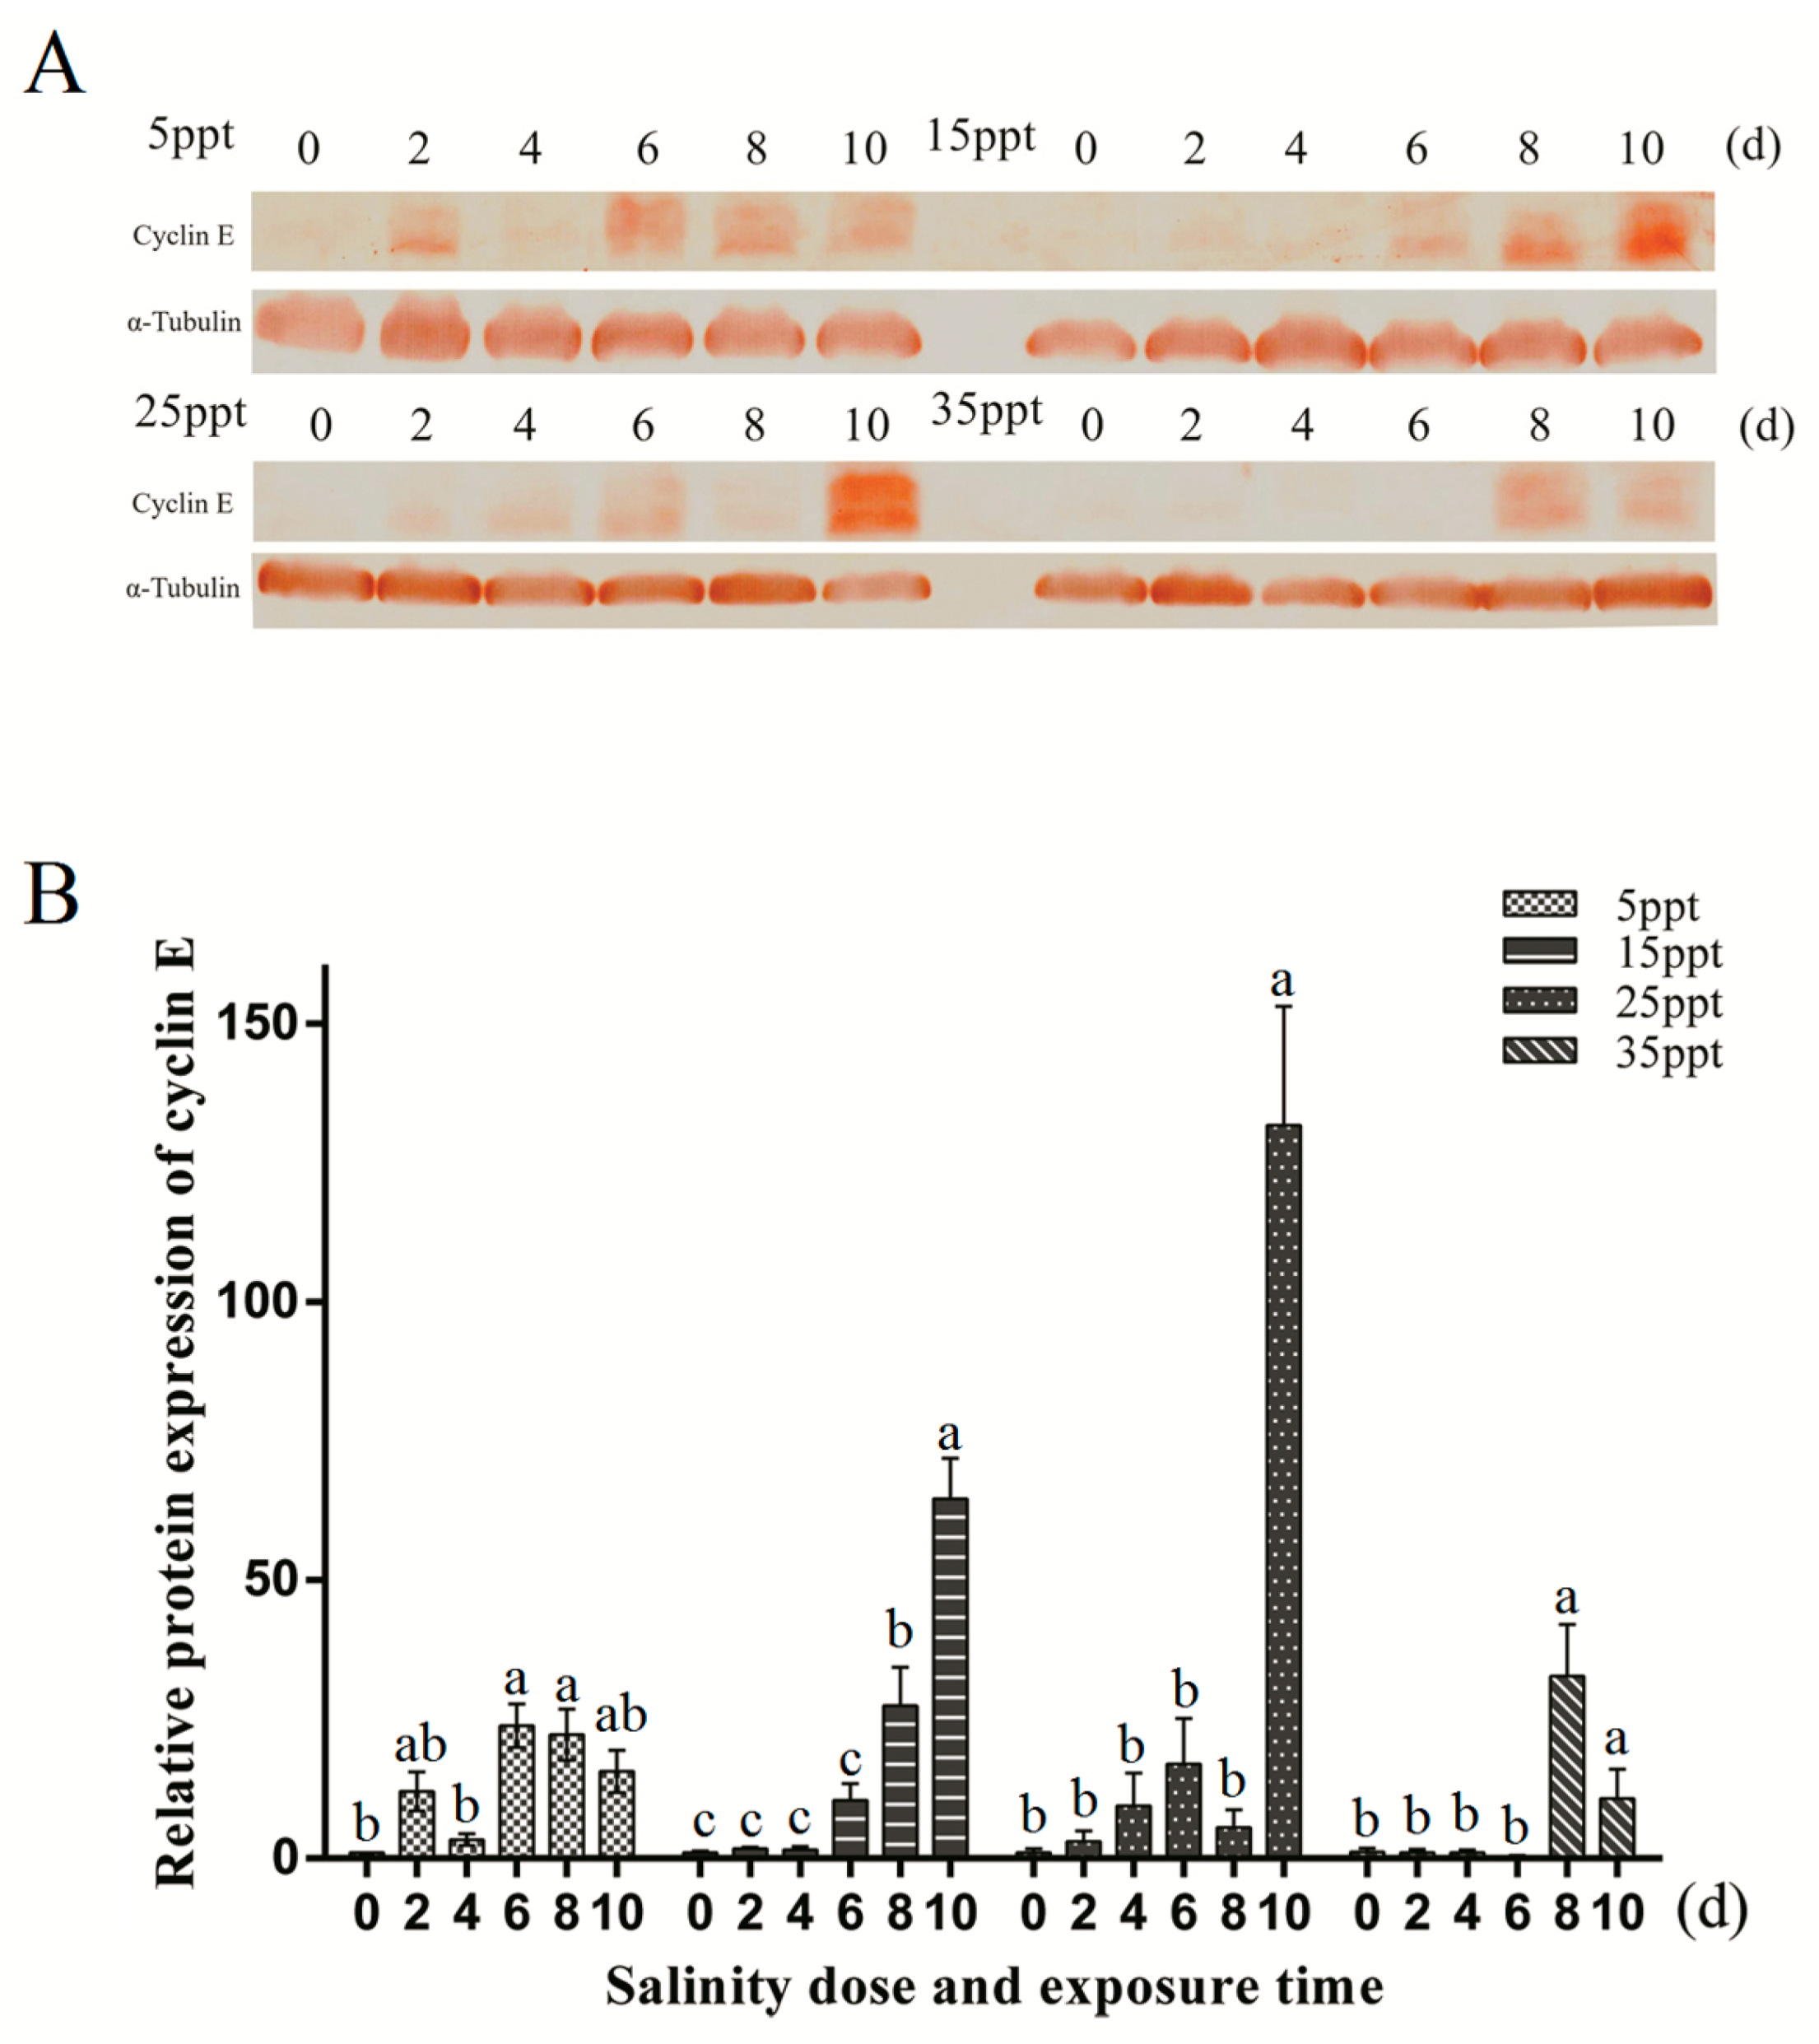
3.6. Protein Expression Level Detection

According to the results of Western blotting (Figure 6A,B), the expression levels of the CCNE protein were very low at the initial salinity administration. In the 5 ppt salinity treatment group, CCNE was significantly upregulated on day 2 but showed significant downregulation on day 4, then was significantly upregulated and reached similar expression levels on days 6, 8, and 10. In the 15 ppt salinity treatment group, CCNE was upregulated slightly at the first 6 days and significantly upregulated at days 8 and 10. In response to 25 ppt salinity administration, CCNE was slightly upregulated from day 2 to day 6 but did not show significant differences, and a short-term downregulation was found on day 8, which was then followed by marked up-regulation at day 10. CCNE was quite low for the first 6 administration days at 35 ppt, and was then significantly upregulated on days 8 and 10 in the 35 ppt salinity treatment. The highest CCNE protein levels in each group were found on day 6, 8, and 10 under different salinity treatments, respectively, and both hypo- and hyper-salinity stresses were unfavorable to CCNE expression in Hong Kong oysters. The CCNE of Hong Kong oysters was found to be about 50 kDa, using the method of referring to the protein marker and containing it in two isoforms.

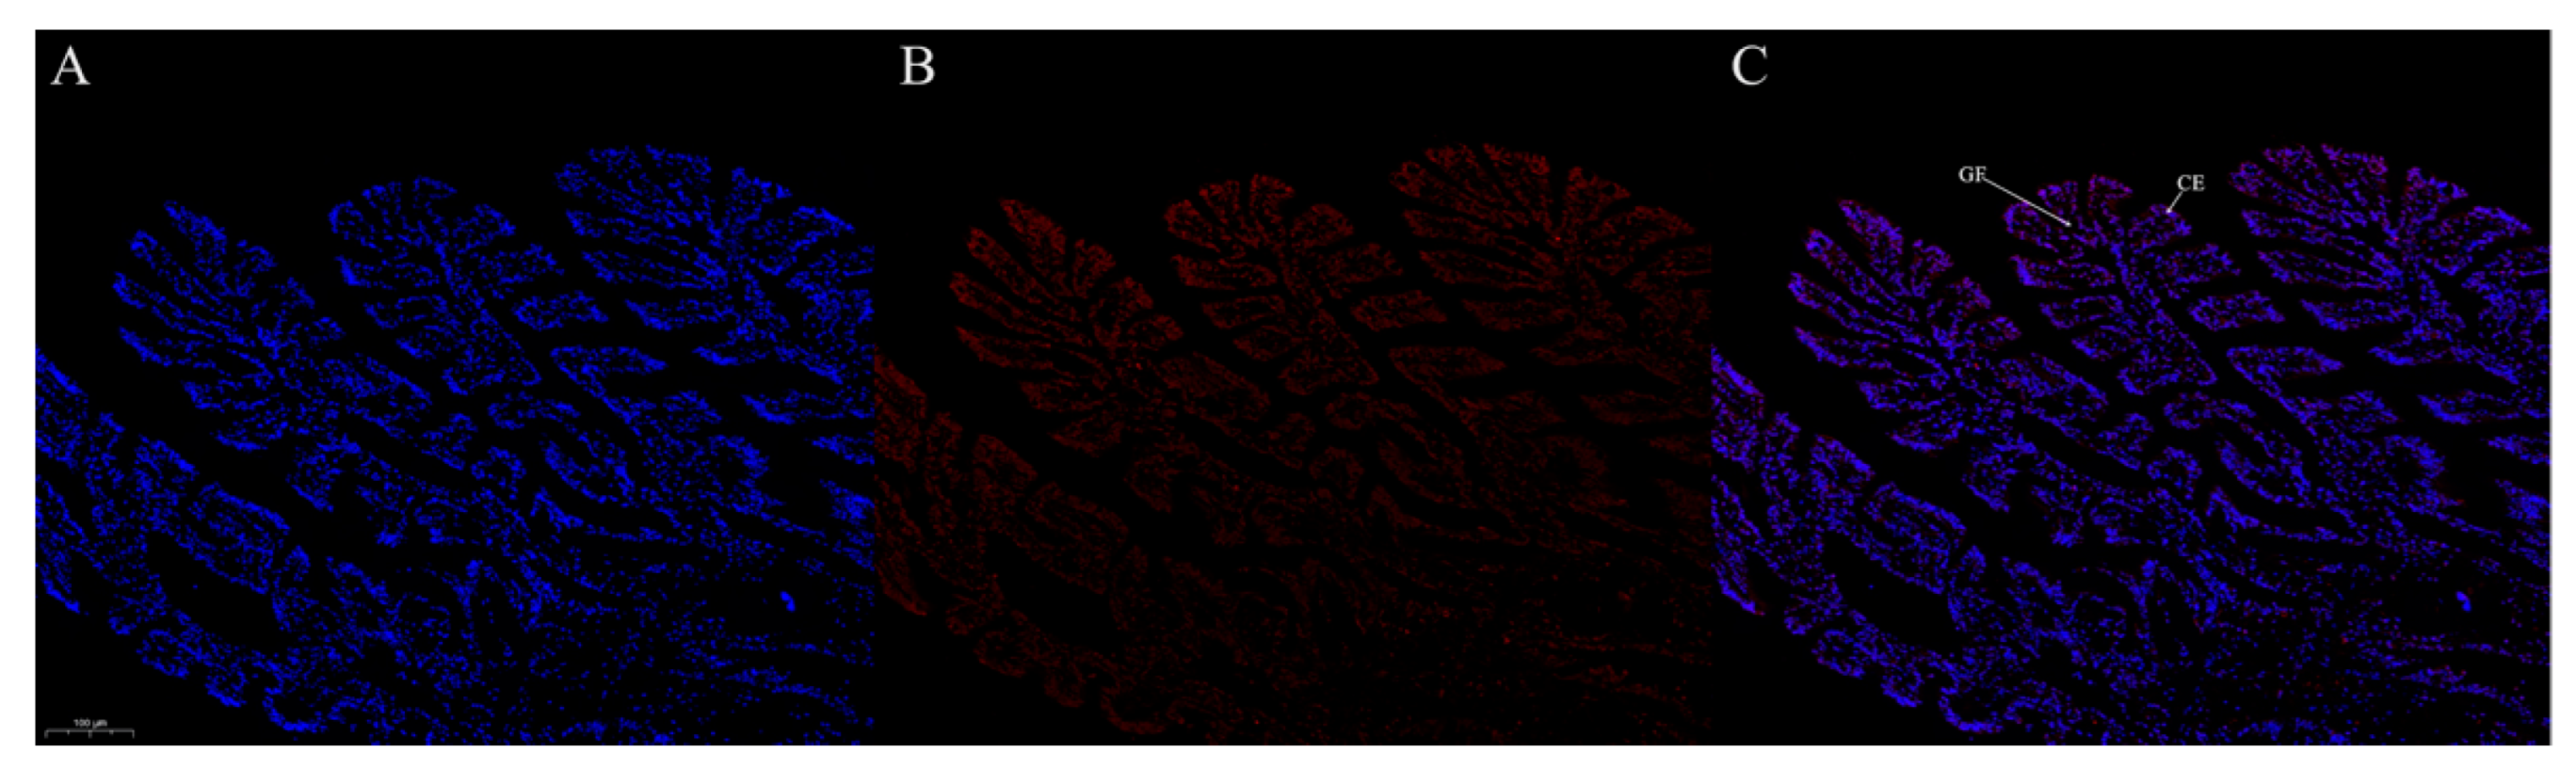
3.7. Protein Localization

The immunolocalization of CCNE in the gill of C. hongkongensis was detected using an anti-rCCNE antibody (Figure 7). The immunostaining was widely distributed in gill filaments, especially in the cylindrical epithelium cells. The fluorescence signal was higher in the cylindrical cells near the frontal cilia area than in the cylindrical cells near the lateral cilia area. The CCNE protein was observed in the nucleus.

4. Discussion

The goal of this study was to evaluate the effects of salinity stress on the mitotic activity of Hong Kong oysters by detecting CCNE protein expression levels under different salinity treatments. We isolated the CCNE sequence from a gill cDNA library and then detected the gene expression in different tissues. The recombinant CCNE protein was purified from a pET32a(+)-CCNE/Escherichia coli BL21(DE3) system and immunized mice were used for generating antiserums. We further examined the CCNE protein expression pattern in response to four salinity treatments (i.e., 5 ppt, 15 ppt, 25 ppt, and 35 ppt). The CCNE protein expression in the oyster gills was maintained at a low expression level under hypo- (5 ppt) and hyper- (35 ppt) salinity stresses during the 10-day exposure period. We proposed that the reason both hypo- and hyper-salinity seawater could repress the mitotic activity of Hong Kong oysters may be due to the lack of CCNE protein participation.
According to the results of the phylogenetic tree in the present study, the CCNE protein from Hong Kong oysters showed closer kinship with the CCNEs from C. gigas, C. virginica, and other invertebrates, implying that Ch-CCNE exhibits relatively high conservation as a cell cycle regulation-related protein. The NLS ‘IKRKRK’, which showed a high correlation with the NLS of CCNE in humans [27], was also identified at the amino acid residue positions 65–70 in the CCNE of Hong Kong oysters. There were also two cyclin boxes in human CCNE protein, i.e., the N-terminal and C-terminal cyclin boxes, which consisted of five α-helices, respectively [28]. Intensive α-helix domains were also predicted in the cyclin boxes of Ch-CCNE by NetSurfP-2.0. Such a complex structure of CCNE cyclin boxes contributes to the binding with CDK2 and may easily lead to misfolding and further result in an inclusion body when induced in a prokaryotic expression system.
CCNE is expressed at supra-physiological levels in many human tumors, which make it a potential anti-tumor target [29]. Similarly to the aquatic animals P. monodon and H. cumingii [19,20], high CCNE mRNA transcript levels have also been examined in the gonads of Hong Kong oysters. Such high levels of CCNE mRNA in gonads may be preserved via sex hormones [30]. CCNE is expressed at the highest level in stage III during ovarian development and induced yolk protein vitellogenin expression [31], but is not involved in the initiation of oocyte maturation [32]. In addition, cyclin E degradation results in reduced sperm motility duration in the frozen-thawed spermatozoa of sea bass [33], suggesting that cyclin E may play important roles in stem cell maintenance and gamete survival. It has been reported that unsuitable salinity delayed ovary maturation in aquatic animals [34,35], and that cyclin E controlled female germline stem cell maintenance independent of its role in proliferation [36]. Therefore, it would be necessary to investigate the roles and regulation mechanisms of cyclin E during gonadal development in future studies.
Environmental stresses, such as hypo-osmotic stress [37], hyperosmotic stress [38], and air and cold exposure [39], have been reported to induce cell cycle arrest in clams and oysters. It has been proposed that several iono-transporting proteins, such as Na+/K+-ATPase and Ca2+/Mg2+-ATPase, are involved in the regulation of osmotic pressure in cuttlefish (Sepia pharaonis) [40]. Mitotic cell decline lessens to conserve energy in the channel to meet the energetic demands of iono-osmoregulation [41]. In recent studies, cyclin E expression was downregulated via the upregulation of p53/p21 genes and the activation of the p53 signaling pathway [42,43], and the activation of p53/p21 could be stimulated by cell stress [44]. miR-16 has been identified as a key effector of the p53 pathway in response to genotoxic stress and is reported to target several cell cycle regulators, including cyclin E, Chk1, cyclin D1, and Cdk6 in mammals [45]. In the present study, the cyclin E protein of Hong Kong oysters was at low expression levels under hypo- and hyper-salinity conditions, which may have been due to the upregulation of p53/p21 genes and some microRNA elements. The accumulation of plasma growth-related hormones may contribute to the upregulation of cyclin E protein in salinity administrations [46,47], especially in the 15 ppt and 25 ppt salinity treatment groups. Cyclin E protein in Hong Kong oysters is expressed as two isoforms, which may be derived by alternate RNA splicing [48] or post-translational modifications, such as phosphorylation [49]. Cyclin E is strongly concentrated in the nucleus of Xenopus [27], which is consistent with the cyclin E sub-cellular location in Hong Kong oysters. In the present study, cyclin E was repressed under hypo- or hyper-salinity stress and could be induced at a high expression level under appropriate salinity treatment. In sum, it is possible that salinity stress may adversely influence cyclin E expression and cell cycle processing through the activation of the p53/p21 axis to meet the energy needs of osmo-regulation.
Salinity fluctuations are able to change vital physiological and biochemical parameters in bivalves and other aquatic animals. Differentiating proteins in the gills of C. gigas have mainly been attributed to cellular components [50], but RNA/DNA ratio is significantly reduced during salinity stress [51], implying the inhibition of the growth of aquatic animals under salinity stress. Lower hemocyanin in plasma occurs in oysters exposed to high salinity stress [52], which may weaken the resilience of oysters to environmental stress. In addition, salinity stress may trigger host microflora imbalance and immune dysregulation in pathogen infected oysters [53]. The off-bottom farming exposes oysters to complex environments, and the potential impacts of salinity stress on oyster resources should be given more attention to support the long-term sustainability of oyster farming.

5. Conclusions

In this study, the CCNE cDNA sequence was cloned from a gill cDNA library of Hong Kong oysters for the first time. The CCNE cDNA encoded a 440 amino acid protein, which showed high homology with the CCNEs from other invertebrates. The CCNE mRNA was distributed in all tissues examined and particularly highly expressed in the gonad. The recombinant CCNE protein was purified from the prokaryotic expression system and exhibited good immunogenicity in inducing high-titer antibodies in mice. The antiserum against CCNE protein was successfully generated, and we found that the CCNE protein could be repressed by hypo- or hyper-salinity stress. We also found that the CCNE protein was distributed in the nucleus and highly expressed in cylindrical cells near the frontal cilia area of the gill. This study contributes to a better understanding of the molecular mechanisms underlying oyster responses to salinity stresses.

Author Contributions

Methodology, H.Q., X.Y., Y.H. and Y.Y.; formal analysis, H.Q. and L.H.; data curation, H.Q., H.W. and X.Y.; writing-original draft, H.Q. and H.W. All authors have read and agreed to the published version of the manuscript.

Funding

Guangxi Science and Technology Base and Talent Special Project (No. Guike AD21075012); Guangxi Natural Science Foundation (2020GXNSFAA297250); Open Fund of Key Laboratory of Environment Change and Resources Use in Beibu Gulf Ministry of Education (Nanning Normal University) (KLOP-X1910).

Institutional Review Board Statement

All experiment protocols were approved by the Institute of Animal Care and Use Committee of Nanning Normal University (Permission No. NNNU-2022-12).

Informed Consent Statement

Not applicable.

Data Availability Statement

The data presented in this study are available on request from the corresponding author. The data are not publicly available due to privacy.

Conflicts of Interest

The authors declare no conflicts of interest.

References

  1. Ibrahim, S.; Yang, C.; Yue, C.; Song, X.; Deng, Y.; Li, Q.; Lü, W. Whole Transcriptome Analysis Reveals the Global Molecular Responses of mRNAs, lncRNAs, miRNAs, circRNAs, and Their ceRNA Networks to Salinity Stress in Hong Kong Oysters Crassostrea hongkongensis. Mar. Biotechnol. 2023, 25, 624–641. [Google Scholar] [CrossRef]
  2. Peng, D.; Zhang, S.; Zhang, H.; Pang, D.; Yang, Q.; Jiang, R.; Lin, Y.; Mu, Y.; Zhu, Y. The oyster fishery in China: Trend, concerns and solutions. Mar. Policy 2021, 129, 104524. [Google Scholar] [CrossRef]
  3. Xiao, S.; Wong, N.K.; Li, J.; Lin, Y.; Zhang, Y.; Ma, H.; Mo, R.; Zhang, Y.; Yu, Z. Analysis of in situ Transcriptomes Reveals Divergent Adaptive Response to Hyper- and Hypo-Salinity in the Hong Kong Oyster Crassostrea hongkongensis. Front. Physiol. 2018, 9, 1491. [Google Scholar] [CrossRef]
  4. Xie, Z.; Li, Y.; Xiong, K.; Tu, Z.; Waiho, K.; Yang, C.; Deng, Y.; Li, S.; Fang, J.K.H.; Hu, M.; et al. Combined effect of salinity and hypoxia on digestive enzymes and intestinal microbiota in the oyster Crassostrea hongkongensis. Environ. Pollut. 2023, 331, 121921. [Google Scholar] [CrossRef]
  5. Deng, Y.; Cao, Y.; Xu, Y.; Wen, G.; Su, H.; Hu, X.; Xu, W.; Lu, J.; Yu, Z. Study on purification effect of shellfish and algae coupling on intensive aquaculture tailwater. South China Fish. Sci. 2023, 19, 113–122. [Google Scholar]
  6. Li, W.; Zhang, L.; Peng, J.; He, P.; Wei, P.; Zhang, X.; Guan, L.; Zhao, W.; Zheng, H.; Li, Q. Investigation and analysis of death of Qinzhou oyster in Spring in Guangxi. J. Aquacult. 2020, 41, 7–13. [Google Scholar]
  7. Zhao, X.; Yu, H.; Kong, L.; Li, Q. Transcriptomic Responses to Salinity Stress in the Pacific Oyster Crassostrea gigas. PLoS ONE 2012, 7, e46244. [Google Scholar] [CrossRef] [PubMed]
  8. Schröder, M.; Sondermann, M.; Sures, B.; Hering, D. Effects of salinity gradients on benthic invertebrate and diatom communities in a German lowland river. Ecol. Indic. 2015, 57, 236–248. [Google Scholar] [CrossRef]
  9. Waterkeyn, A.; Grillas, P.; Vanschoenwinkel, B.; Brendonck, L. Invertebrate community patterns in Mediterranean temporary wetlands along hydroperiod and salinity gradients. Freshw. Biol. 2008, 53, 1808–1822. [Google Scholar] [CrossRef]
  10. Tao, G.Z.; Rott, L.S.; Lowe, A.W.; Omary, M.B. Hyposmotic Stress Induces Cell Growth Arrest via Proteasome Activation and Cyclin/Cyclin-dependent Kinase Degradation. J. Biol. Chem. 2002, 277, 19295–19303. [Google Scholar] [CrossRef]
  11. Bodenstein, S.; Casas, S.M.; Tiersch, T.R.; La Peyre, J.F. Energetic budget of diploid and triploid eastern oysters during a summer die-off. Front. Mar. Sci. 2023, 10, 1194296. [Google Scholar] [CrossRef]
  12. Moroney, D.A.; Walker, R.L. The effects of tidal and bottom placement on the growth, survival and fouling of the Eastern oyster Crassostrea virginica. J. World Aquacult. Soc. 1999, 30, 433–442. [Google Scholar] [CrossRef]
  13. Żuryń, A.; Opacka, A.; Krajewski, A.; Zielińska, W.; Grzanka, A. The Less Known Cyclins-Uncovered. Appl. Sci. 2021, 11, 2320. [Google Scholar] [CrossRef]
  14. Evans, T.; Rosenthal, E.T.; Youngblom, J.; Distel, D.; Hunt, T. Cyclin: A protein specified by maternal mRNA in sea urchin eggs that is destroyed at each cleavage division. Cell 1983, 33, 389–396. [Google Scholar] [CrossRef]
  15. Koff, A.; Cross, F.; Fisher, A.; Schumacher, J.; Leguellec, K.; Philippe, M.; Roberts, J.M. Human cyclin E, a new cyclin that interacts with two members of the CDC2 gene family. Cell 1991, 66, 1217–1228. [Google Scholar] [CrossRef]
  16. Lew, D.J.; Dulić, V.; Reed, S.I. Isolation of three novel human cyclins by rescue of G1 cyclin (Cln) function in yeast. Cell 1991, 66, 1197–1206. [Google Scholar] [CrossRef]
  17. Mazumder, S.; Gong, B.; Almasan, A. Cyclin E induction by genotoxic stress leads to apoptosis of hematopoietic cells. Oncogene 2000, 19, 2828–2835. [Google Scholar] [CrossRef]
  18. Ma, T.; Van Tine, B.A.; Wei, Y.; Garrett, M.D.; Nelson, D.; Adams, P.D.; Wang, J.; Qin, J.; Chow, L.T.; Harper, J.W. Cell cycle-regulated phosphorylation of p220NPAT by cyclin E/Cdk2 in Cajal bodies promotes histone gene transcription. Genes Dev. 2000, 14, 2298–2313. [Google Scholar] [CrossRef] [PubMed]
  19. Zhao, C.; Fu, M.J.; Qiu, L.H. Molecular cloning and functional characterization of cyclin E and CDK2 from Penaeus monodon. Genet. Mol. Res. 2016, 15, gmr.15038716. [Google Scholar] [CrossRef] [PubMed]
  20. Feng, S.; Li, X.; Chen, Y.; Liu, R.; Bai, Z.; Li, W. Screening and expression of cyclins gene in Hyriopsis cumingii. Acta Agric. Zhejiangensis 2021, 33, 2041–2050. [Google Scholar]
  21. Yarden, A.; Geiger, B. Zebrafish cyclin E regulation during early embryogenesis. Dev. Dyn. 1996, 206, 1–11. [Google Scholar] [CrossRef]
  22. Kurokawa, D.; Akasaka, K.; IVIitsunaga-Nakatsubo, K.; Shimada, H. Cloning of Cyclin E cDNA of the Sea Urchin, Hernicentrotus pulcherrimus. Zool. Sci. 1997, 14, 791–794. [Google Scholar] [CrossRef]
  23. Gil, H.W.; Lee, T.H.; Han, H.J.; Park, I. Comparative Analysis of Tissue and Cell Cycle on the Far Eastern Catfish, Silurus asotus between Diploid and Triploid. Dev. Reprod. 2017, 21, 193–204. [Google Scholar] [CrossRef] [PubMed]
  24. Alzohairy, A.M. BioEdit: An important software for molecular biology. GERF Bull. Biosci. 2011, 2, 60–61. [Google Scholar]
  25. Kumar, S.; Stecher, G.; Tamura, K. MEGA7: Molecular evolutionary genetics analysis version 7.0 for bigger datasets. Mol. Biol. Evol. 2016, 33, 1870–1874. [Google Scholar] [CrossRef] [PubMed]
  26. Kenneth, J.; Livak, T.D. Analysis of relative gene expression data using realtime quantitative PCR and the 2−ΔΔCT method. Methods 2001, 25, 402–408. [Google Scholar]
  27. Moore, J.D.; Kornbluth, S.; Hunt, T. Identification of the nuclear localization signal in Xenopus cyclin E and analysis of its role in replication and mitosis. Mol. Biol. Cell 2002, 13, 4388–4400. [Google Scholar] [CrossRef]
  28. Honda, R.; Lowe, E.D.; Dubinina, E.; Skamnaki, V.; Cook, A.; Brown, N.R.; Johnson, L.N. The structure of cyclin E1/CDK2: Implications for CDK2 activation and CDK2-independent roles. EMBO J. 2005, 24, 452–463. [Google Scholar] [CrossRef]
  29. Wang, X.F.; Liu, J.X.; Ma, Z.Y.; Shen, Y.; Zhang, H.R.; Zhou, Z.Z.; Suzuki, E.; Liu, Q.X.; Hirose, S. Evolutionarily conserved roles for Apontic in induction and subsequent decline of Cyclin E expression. iScience 2020, 23, 101369. [Google Scholar] [CrossRef]
  30. Pok, S.; Barn, V.A.; Wong, H.J.; Blackburn, A.C.; Board, P.; Farrell, G.C.; Teoh, N.C. Testosterone regulation of cyclin E kinase: A key factor in determining gender differences in hepatocarcinogenesis. J. Gastroenterol. Hepatol. 2016, 31, 1210–1219. [Google Scholar] [CrossRef]
  31. Zhang, S.; Pang, Z.; Gao, J.; Dai, Q.; Liu, X.; Shen, Y.; Baloch, W.A.; Noonari, S.; Wang, P.; Gao, H. Functional analysis of the cell cycle protein E gene (ccne) in ovarian development of the white ridgetail prawn, Exopalaemon carinicauda. Aquacult. Rep. 2023, 32, 101716. [Google Scholar] [CrossRef]
  32. Yoshida, N.; Yamashita, M. Non-dependence of cyclin E/Cdk2 kinase activity on the initiation of oocyte maturation in goldfish. Dev. Growth Differ. 2001, 42, 285–294. [Google Scholar] [CrossRef]
  33. Zilli, L.; Schiavone, R.; Zonno, V.; Rossano, R.; Storelli, C.; Vilella, S. Effect of cryopreservation on sea bass sperm proteins. Biol. Reprod. 2005, 72, 1262–1267. [Google Scholar] [CrossRef]
  34. Pang, Z.; Zhao, Z.; Gao, J.; Deng, D.; Deng, K.; Xu, J.; Gao, H. Effects of salinity on growth and related indicators of gonadal development in Exopalaemon carinicauda (Decapoda, Caridea, Palaemonidae). Crustaceana 2023, 96, 565–581. [Google Scholar] [CrossRef]
  35. Ituarte, R.B.; Spivak, E.D.; Camiolo, M.; Anger, K. Effects of Salinity on the Reproductive Cycle of Female Freshwater Shrimp, Palaemonetes Argentinus. J. Crustacean Biol. 2010, 30, 186–193. [Google Scholar] [CrossRef]
  36. Ables, E.T.; Drummond-Barbosa, D. Cyclin E controls Drosophila female germline stem cell maintenance independently of its role in proliferation by modulating responsiveness to niche signals. Development 2013, 140, 530–540. [Google Scholar] [CrossRef] [PubMed]
  37. Maynard, A.; Bible, J.M.; Pespeni, M.H.; Sanford, E.; Evans, T.G. Transcriptomic responses to extreme low salinity among locally adapted populations of Olympia oyster (Ostrea lurida). Mol. Ecol. 2018, 27, 4225–4240. [Google Scholar] [CrossRef] [PubMed]
  38. Li, Z.; Lin, T.; Yao, Z.; Lai, Q.; Lu, J.; Wang, H.; Zhou, K. Effects of water salinity on the antioxidant enzyme activities and growth of clam Cyclina sinensis. Chin. J. Ecol. 2012, 31, 2625–2630. [Google Scholar]
  39. Li, C.; Wang, H.; Guo, X. Regulation of the Cell Cycle, Apoptosis, and Proline Accumulation Plays an Important Role in the Stress Response of the Eastern Oyster Crassostrea virginica. Front. Mar. Sci. 2022, 9, 921877. [Google Scholar] [CrossRef]
  40. Wu, K.; Xin, H.; Yuan, Y.; Zhao, Y.; Song, W.; Wang, C.; Mu, C.; Li, R. Physiological, biochemical and molecular responses of Sepia pharaonis juveniles to low salinity. Aquacult. Res. 2021, 52, 4317–4324. [Google Scholar] [CrossRef]
  41. Sardella, B.A.; Matey, V.; Cooper, J.; Gonzalez, R.J.; Brauner, C.J. Physiological, biochemical and morphological indicators of osmoregulatory stress in ‘California’ Mozambique tilapia (Oreochromis mossambicus × O. urolepis hornorum) exposed to hypersaline water. J. Exp. Biol. 2004, 207, 1399–1413. [Google Scholar] [CrossRef] [PubMed]
  42. Xuan, L.; Qiu, X.; Yu, H.; Chu, J.; Guo, J.; Chang, Y. Albicanol modulates oxidative stress and the p53 axis to suppress profenofos induced genotoxicity in grass carp hepatocytes. Fish Shellfish. Immunol. 2022, 122, 325–333. [Google Scholar]
  43. Khan, I.; Bahuguna, A.; Krishnan, M.; Shukla, S.; Lee, H.; Min, S.H.; Choi, D.K.; Cho, Y.; Bajpai, V.K.; Huh, Y.S.; et al. The effect of biogenic manufactured silver nanoparticles on human endothelial cells and zebrafish model. Sci. Total Environ. 2019, 679, 365–377. [Google Scholar] [CrossRef]
  44. Gao, P.; Zou, X.; Sun, X.; Zhang, C. Cellular senescence in metabolic-associated kidney disease: An update. Cells 2022, 11, 3443. [Google Scholar] [CrossRef]
  45. Lezina, L.; Purmessur, N.; Antonov, A.V.; Ivanova, T.; Karpova, E.; Tentler, D.; Garabadgiu, A.V.; Krishan, K.; Ivan, M.; Aksenova, V.; et al. miR-16 and miR-26a target checkpoint kinases WEE1 and CHK1 in response to p53 activation by genotoxic stress. Cell Death Dis. 2013, 4, e953. [Google Scholar] [CrossRef]
  46. Zhang, Y.T.; Huang, S.; Qiu, H.T.; Li, Z.; Mao, Y.; Hong, W.S.; Chen, S.X. Optimal salinity for rearing Chinese black sleeper (Bostrychus sinensis) fry. Aquaculture 2017, 476, 37–43. [Google Scholar] [CrossRef]
  47. Canosa, L.F.; Bertucci, J.I. The effect of environmental stressors on growth in fish and its endocrine control. Front. Endocrinol. 2023, 14, 1109461. [Google Scholar] [CrossRef]
  48. Sewing, A.; Rönicke, V.; Bürger, C.; Funk, M.; Müller, R. Alternative splicing of human cyclin E. J. Cell Sci. 1994, 107, 581–588. [Google Scholar] [CrossRef]
  49. Minella, A.C.; Loeb, K.R.; Knecht, A.; Welcker, M.; Varnum-Finney, B.J.; Bernstein, I.D.; Roberts, J.M.; Bruce, E.C. Cyclin E phosphorylation regulates cell proliferation in hematopoietic and epithelial lineages in vivo. Genes Dev. 2008, 22, 1677–1689. [Google Scholar] [CrossRef]
  50. Chen, L.; Zhang, X.; Wang, Z.; Li, Z.; Yu, F.; Shi, H.; Xue, C.; Xue, Y.; Zhang, H. Proteomics analysis of Pacific oyster (Crassostrea gigas) under acute and longer-term chronic salinity stress treatment as examined by label-free mass spectrometry. Aquaculture 2022, 551, 37868. [Google Scholar] [CrossRef]
  51. Ai, C.X.; Chen, X.; Zhong, Z.; Jiang, Y. Physiological responses to salinity stress in the Managua Cichlid, Cichlasoma managuense. Aquacult. Res. 2020, 51, 4387–4396. [Google Scholar] [CrossRef]
  52. Pérez-Velasco, R.; Manzano-Sarabia, M.; Hurtado-Oliva, M.A. Effect of hypo-and hypersaline stress conditions on physiological, metabolic, and immune responses in the oyster Crassostrea corteziensis (Bivalvia: Ostreidae). Fish Shellfish Immunol. 2022, 120, 252–260. [Google Scholar] [CrossRef] [PubMed]
  53. Li, X.; Yang, B.; Shi, C.; Wang, H.; Yu, R.; Li, Q.; Liu, S. Synergistic Interaction of Low Salinity Stress with Vibrio Infection Causes Mass Mortalities in the Oyster by Inducing Host Microflora Imbalance and Immune Dysregulation. Front. Immunol. 2022, 13, 859975. [Google Scholar] [CrossRef] [PubMed]
Figure 1. Phylogenetic analysis of cyclin E using MEGA 7 with the neighbor-joining method and 1000 replications of bootstrap. Cyclin E of C. hongkongensis is highlighted with a box.
Fishes 09 00102 g001
Figure 2. Alignment and comparison of the deduced amino acid sequences of CCNE with different species. The NLS, N-terminal cyclin box, C-terminal cyclin box, and α-helix domains are indicated by specific color underlines. Unique amino acid differences of C. hongkongenesis with other Crassostrea species are highlighted with boxes. Residues that are identical in over half of the sequences are shaded red. Those that are identical are shaded light red.
Fishes 09 00102 g002
Figure 3. Tissue distribution of cyclin E in C. hongkongensis. The levels of cyclin E mRNA were determined using qPCR and normalized to the internal housekeeping gene β actin. The results are expressed as mean ± SEM (n = 6). Columns with different letters have significant differences from each other (p < 0.05, one-way ANOVA followed by Tukey’s test).
Fishes 09 00102 g003
Figure 4. SDS-PAGE analysis of the expressed and purified recombinant ChCCNE in E. coli. Lanes: 1, total protein extracts from E. coli BL21(DE3) cells; 2, total protein extracts from E. coli BL21(DE3) cells harboring pET32a(+)-CCNE induced by 1.0 mM IPTG at 37 °C for 4 h; 3, supernatant component; 4, inclusion body; 5, purified rCCNE protein; M, molecular weight markers. Protein bands were visualized by staining with Coomassie brilliant blue, and the purified rCCNE protein was indicated by an arrow.
Fishes 09 00102 g004
Figure 5. Determination of titers of polyclonal antiserums by ELISA. The X-axis shows the dilution ratios of the antiserums from 6 mice increased from 1:2000 to 1:64,000, and y-axis shows the absorbance at 450 nm. (−) 1:1000: negative serum diluted 1000 times; blank: blocking buffer control.
Fishes 09 00102 g005
Figure 6. Western blot analysis of cyclin E protein expression in the gill under different salinity treatments. (A) Western blotting was performed on the gill lysates under the salinities of 5, 15, 25, and 35 ppt for 0, 2, 4, 6, 8, and 10 days, respectively, using anti-cyclin E polyclonal mouse antiserums and α-tubulin mouse monoclonal antibody (Beyotime AF2827), respectively. The nitrocellulose membrane was visualized using DAB staining. (B) Graph shows relative expression levels of cyclin E protein. Band intensities were quantitatively analyzed by ImageJ and normalized to α-tubulin. The results are expressed as mean ± SEM (n = 3). Columns with different letters are significantly different from each other (p < 0.05, one-way ANOVA followed by Tukey’s test).
Fishes 09 00102 g006
Figure 7. The immunolocalization of cyclin E in the gill. Cyclin E was detected using the immunofluorescence method. (A) DAPI staining (blue) showed nuclei; (B) immunostaining (red) showed cyclin E protein. (C) Overlay image of DAPI and immunofluorescence double staining. Scale bar represents 100 μm. GF: gill filaments; CE: cylindrical epithelium cell.
Fishes 09 00102 g007
Table 1. The primers for gene amplification, expression vector construction, and RT-qPCR in this study.
GenesPrimer NameSequence (5′-3′)Experiment
cyclin EOuter FCCACCCGAAAATCGTTGGCGGGNested PCR
Outer RTTCATAGAATTGTTCATCAGTATCNested PCR
Inner FCACCTTATTACGCTACGGTCTGCNested PCR
Inner RTTCAACTCCATATTTAAAATGCACNested PCR
PE FgatccgaattcATGTCGAGAAAAAGTGCACGATTGExpression vector construction
PE RgcttgtcgacTTATTTGAACTCTTCATTTTCCTTExpression vector construction
Rt FCCTCTCGGTCGACAACTATGTCRT-qPCR
Rt RCGAGTCGGGAGACAATGGTTCACRT-qPCR
β actinRt FATATTGCAGCTTTAGTCGTAGACRT-qPCR
Rt RGGTGAGGATACCTCTCTTGCTCRT-qPCR
Disclaimer/Publisher’s Note: The statements, opinions and data contained in all publications are solely those of the individual author(s) and contributor(s) and not of MDPI and/or the editor(s). MDPI and/or the editor(s) disclaim responsibility for any injury to people or property resulting from any ideas, methods, instructions or products referred to in the content.

