
Diet and Feeding Ecology of the Whitespotted Eagle Ray (Aetobatus narinari) from Florida Coastal Waters Revealed via DNA Barcoding
 ,
,
Abstract
:1. Introduction
2. Materials and Methods
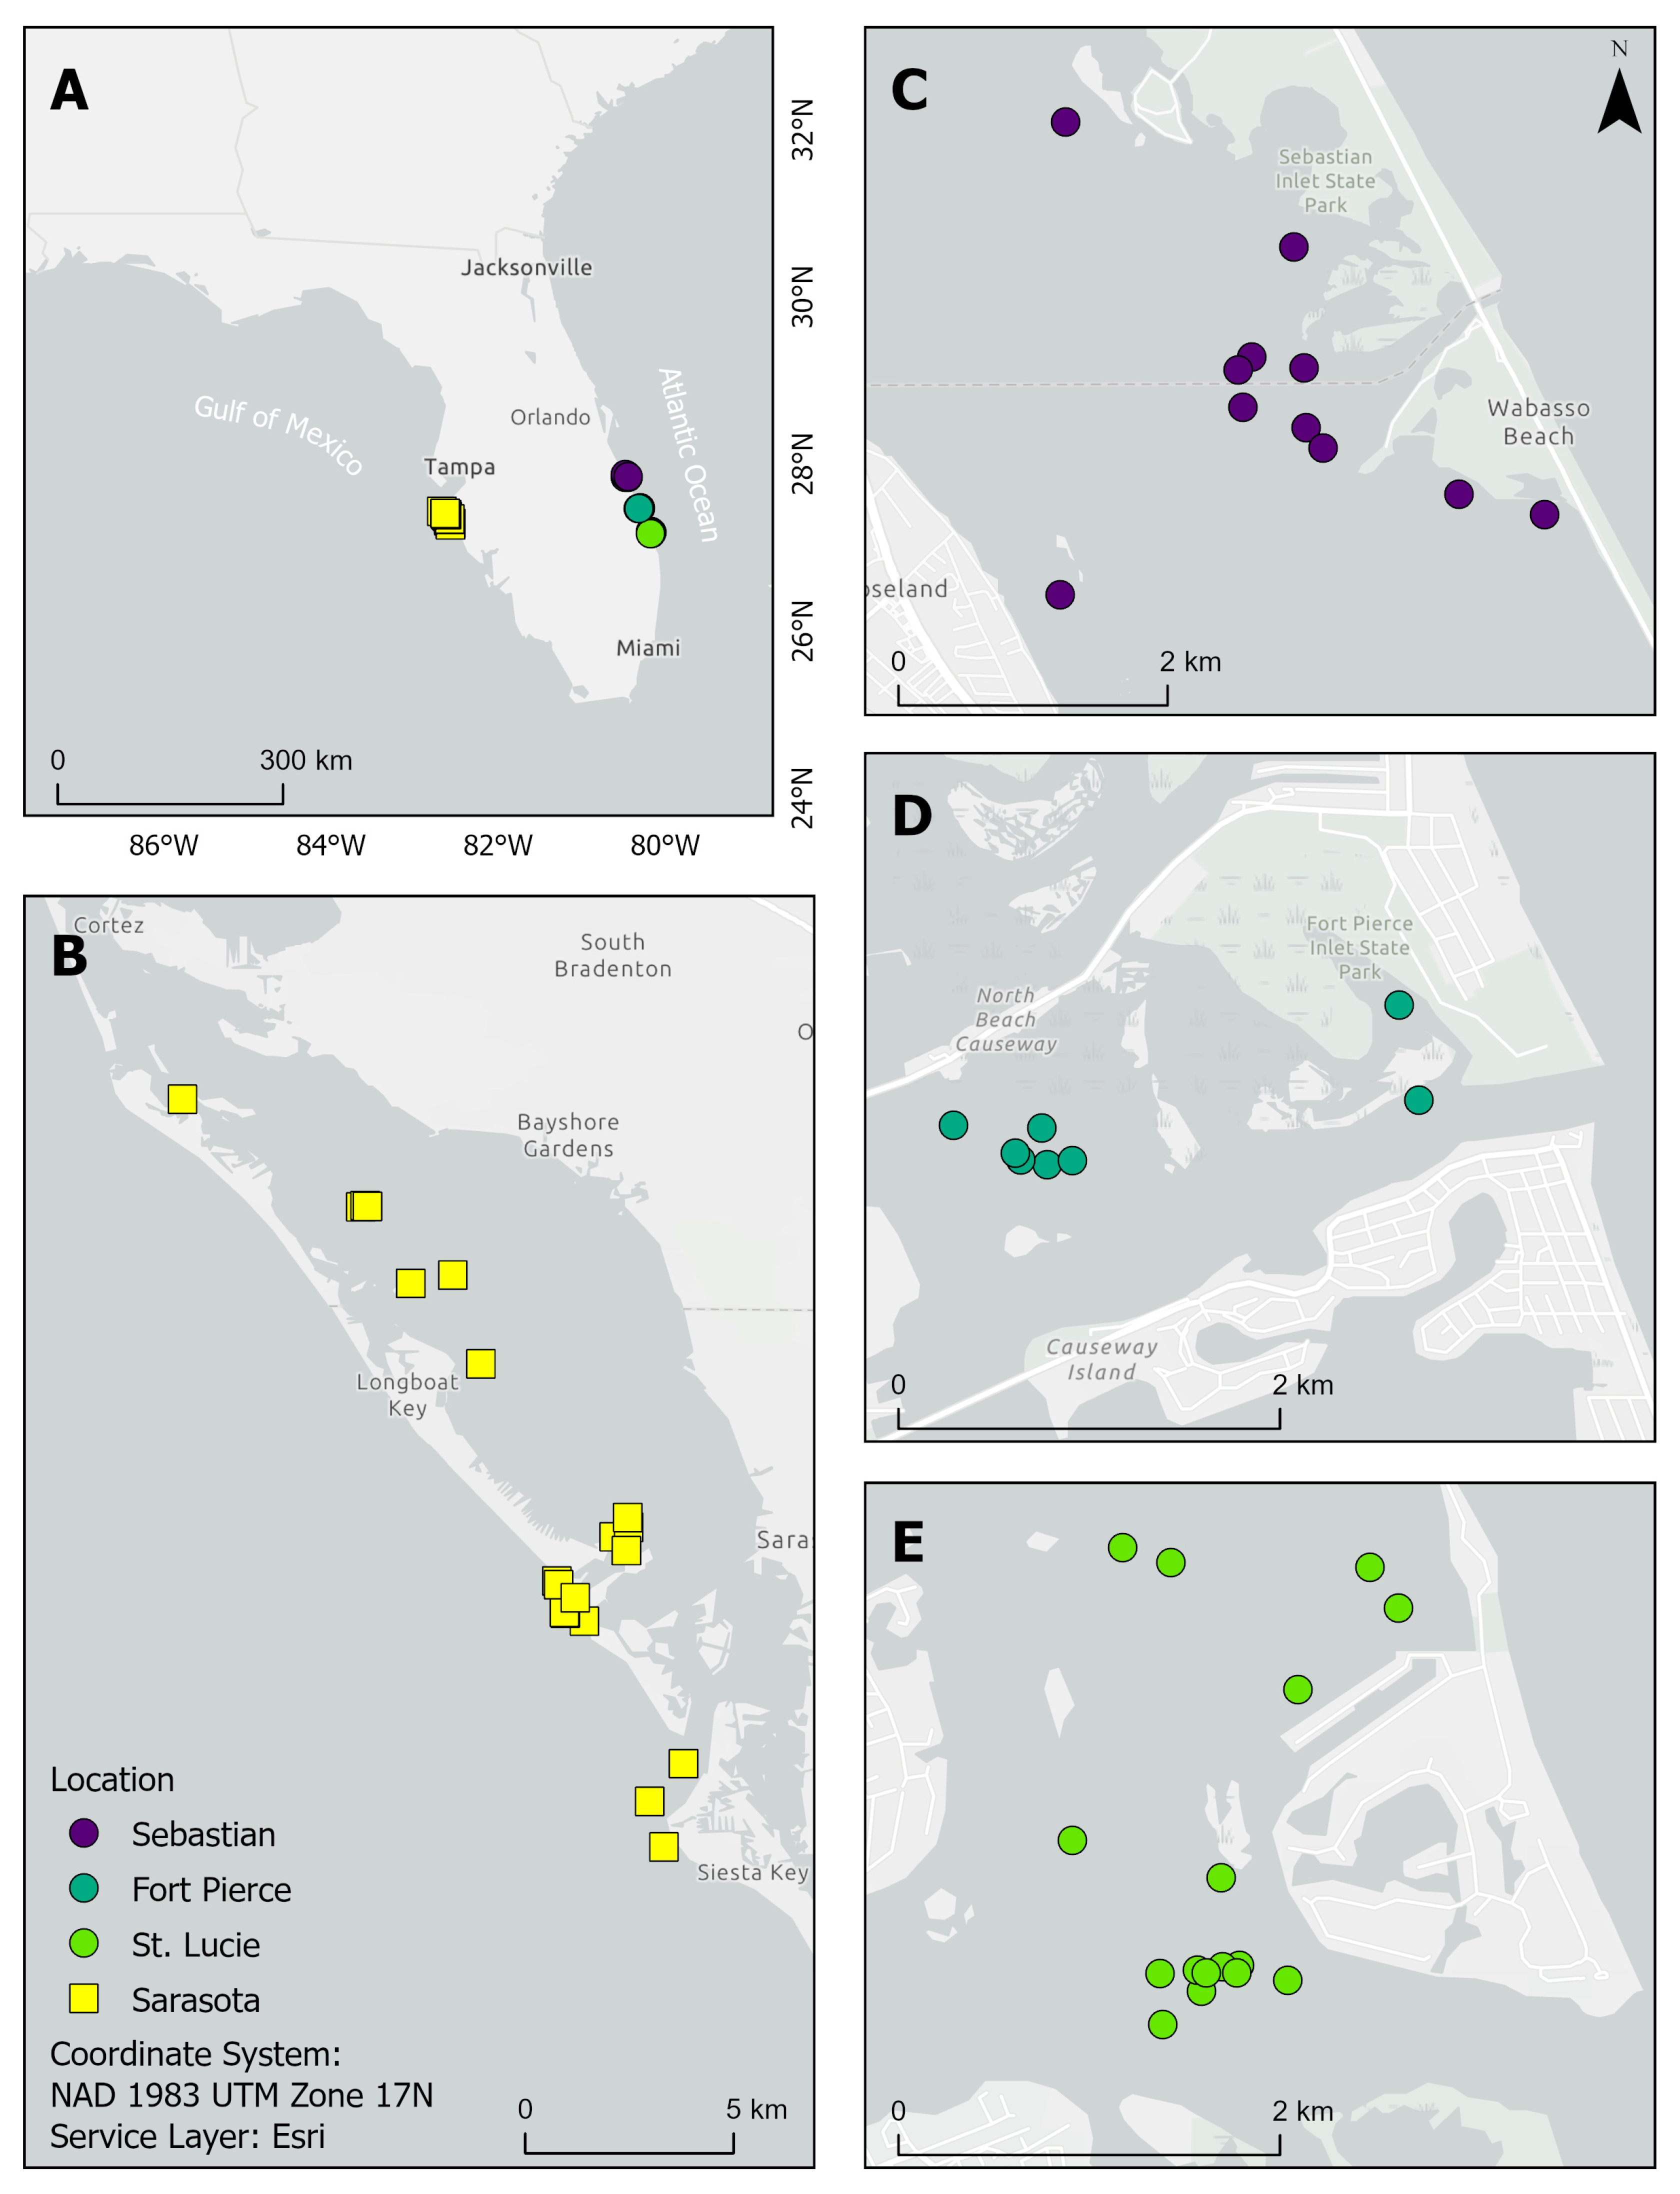
2.1. Invertebrate Collection
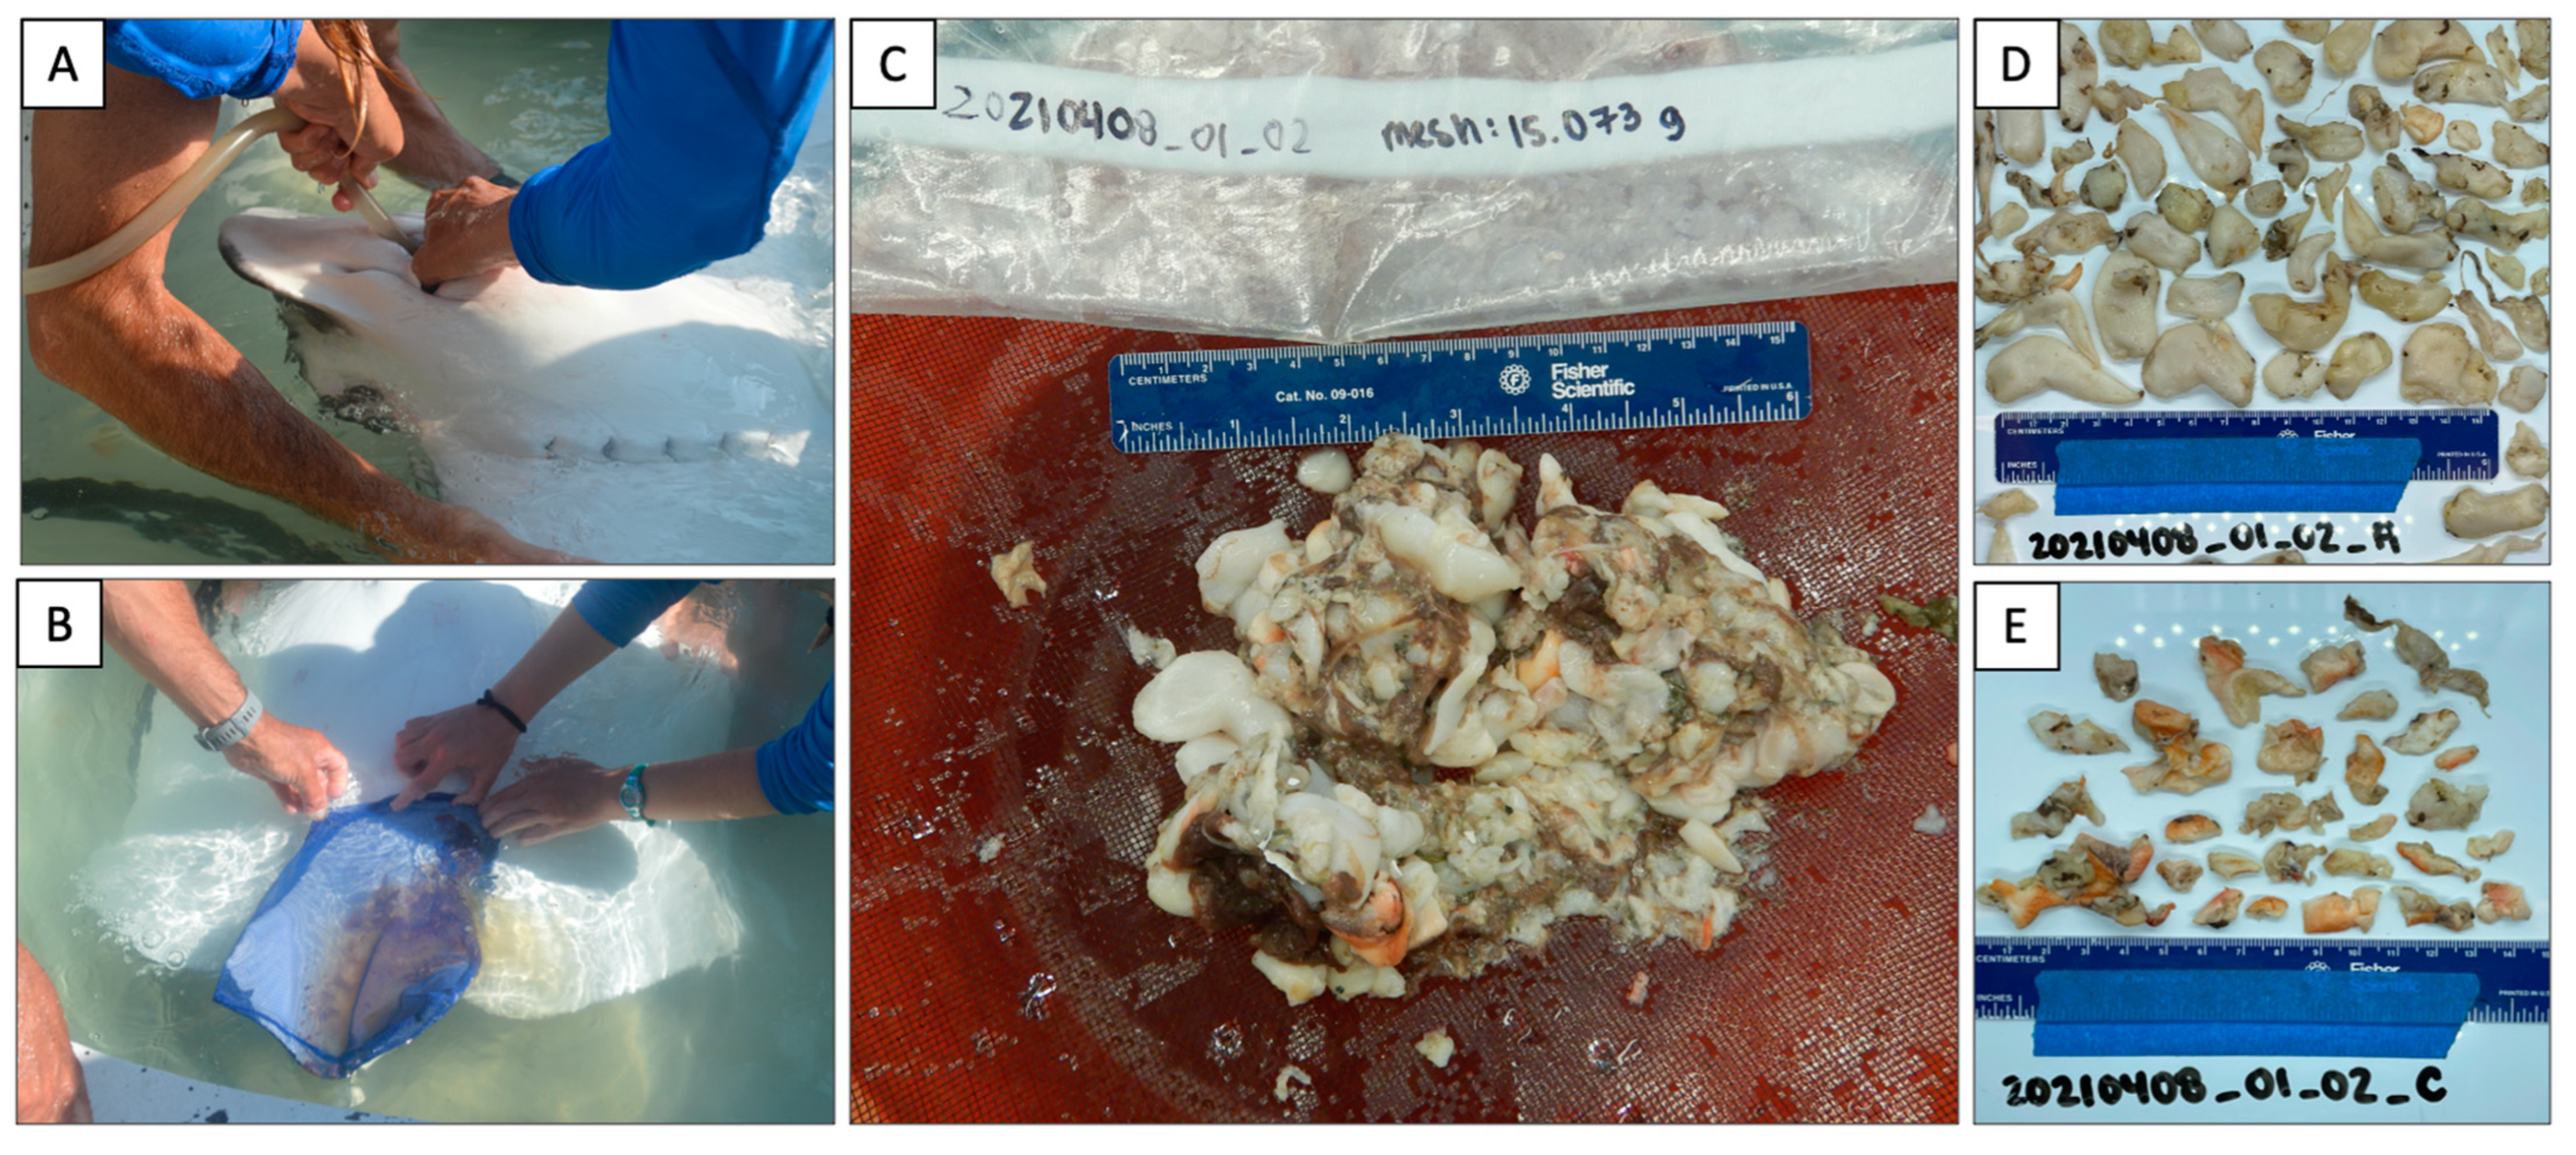
2.2. Gut Content Collection
2.3. DNA Barcoding Preparation
2.4. Data Analyses
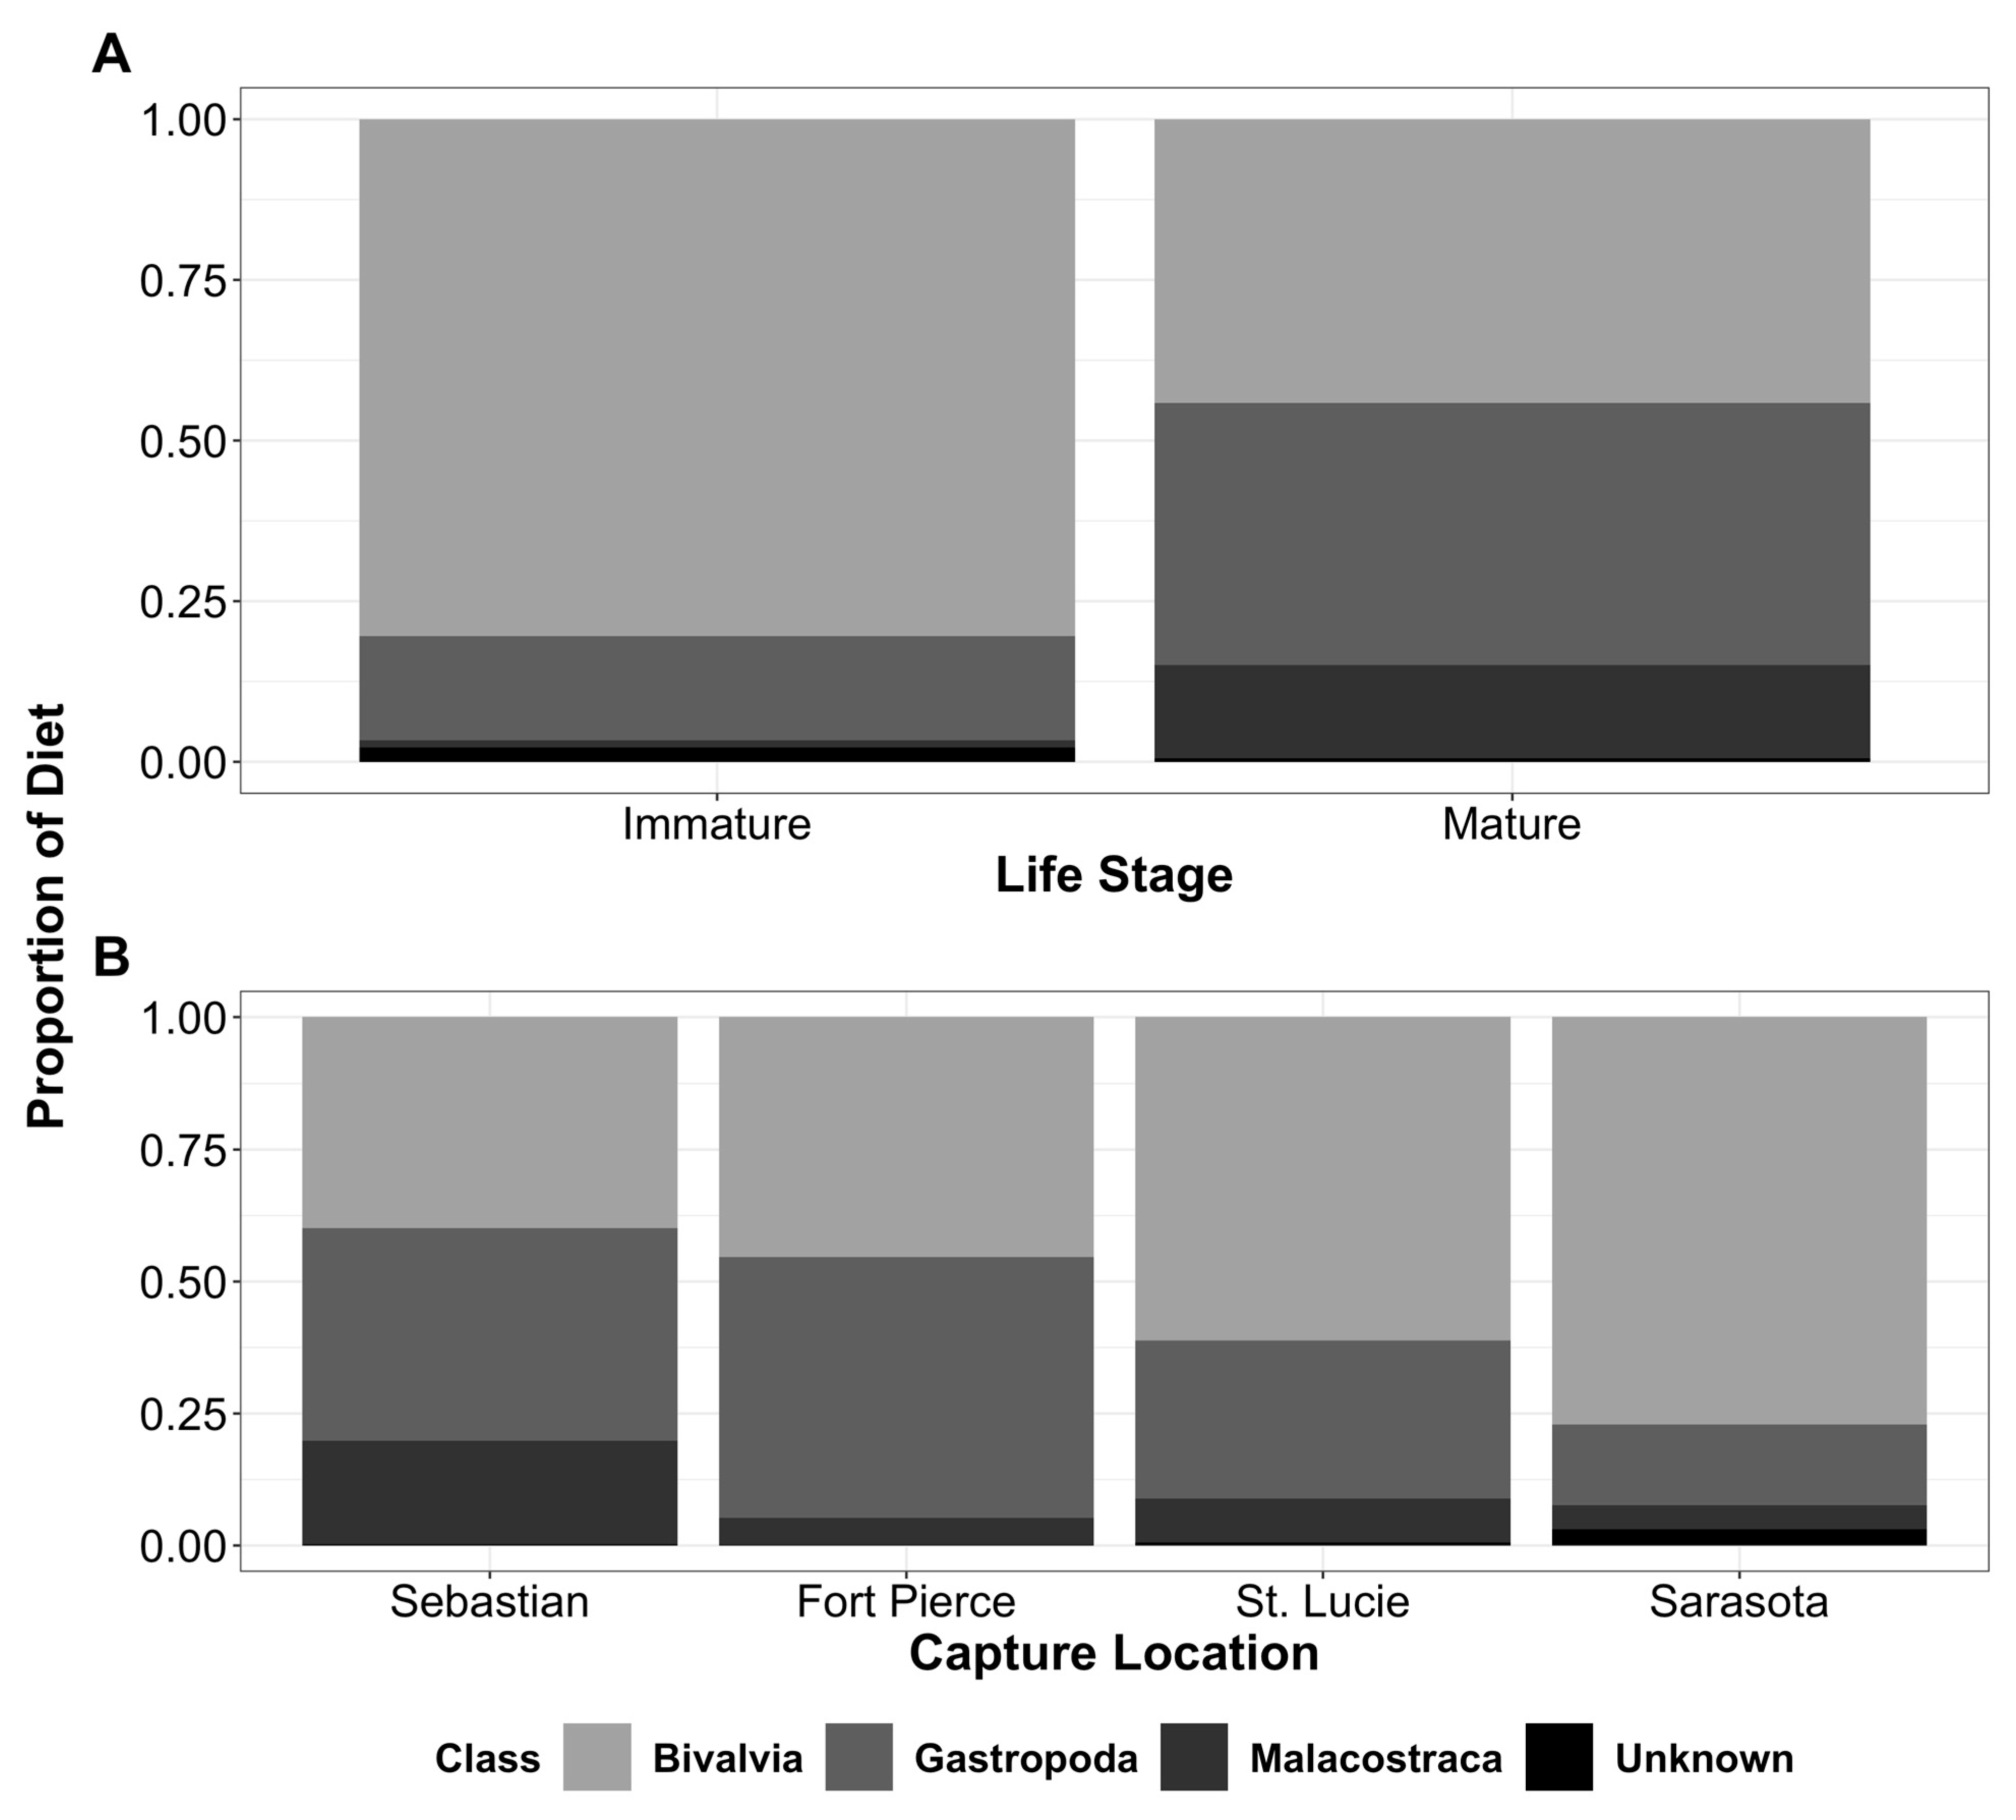
3. Results
4. Discussion
5. Conclusions
Supplementary Materials
Author Contributions
Funding
Institutional Review Board Statement
Data Availability Statement
Acknowledgments
Conflicts of Interest
References
- Last, P.R.; White, W.T.; de Carvalho, M.R.; Séret, B.; Stehmann, M.F.W.; Naylor, G.J.P. (Eds.) Rays of the World; CSIRO Publishing: Melbourne, Australia, 2016. [Google Scholar]
- Frisk, M.G. Life history strategies of batoids. In Sharks and Their Relatives. II. Biodiversity, Adaptive Physiology, and Conservation; CRC Press: Boca Raton, FL, USA, 2010; pp. 283–316. [Google Scholar] [CrossRef]
- Cuevas-Zimbrón, E.; Pérez-Jiménez, J.C.; Méndez-Loeza, I. Spatial and seasonal variation in a target fishery for spotted eagle ray Aetobatus narinari in the southern Gulf of Mexico. Fish. Sci. 2011, 77, 723–730. [Google Scholar] [CrossRef]
- Brewster, L.R.; Dale, J.J.; Guttridge, T.L.; Gruber, S.H.; Hansell, A.C.; Elliott, M.; Cowx, I.G.; Whitney, N.M.; Gleiss, A.C. Development and application of a machine learning algorithm for classification of elasmobranch behaviour from accelerometry data. Mar. Biol. 2018, 165, 62. [Google Scholar] [CrossRef] [PubMed] [Green Version]
- Bassos-Hull, K.; Wilkinson, K.A.; Hull, P.T.; Dougherty, D.A.; Omori, K.L.; Ailloud, L.E.; Morris, J.J.; Hueter, R.E. Life history and seasonal occurrence of the spotted eagle ray, Aetobatus narinari, in the eastern Gulf of Mexico. Environ. Biol. Fishes 2014, 97, 1039–1056. [Google Scholar] [CrossRef]
- Dulvy, N.K.; Carlson, J.; Charvet, P.; Ajemian, M.J.; Bassos-Hull, K.; Blanco-Parra, M.P.; Chartrain, E.; Derrick, D.; Dia, M.; Diop, M.; et al. Aetobatus narinari (amended version of 2021 assessment). In IUCN Red List Threatened Species 2021; IUCN Red List: Cambridge, UK, 2021; pp. 1–19. [Google Scholar] [CrossRef]
- Coles, R.J. Observations on the habits and distribution of certain fishes taken on the coast of North Carolina. Bull. Am. Mus. Nat. Hist. 1910, 28, 338–341. [Google Scholar]
- Gudger, E.W. Notes on Some Beaufort Fishes-1909. Am. Nat. 1910, 44, 395–403. [Google Scholar] [CrossRef]
- Summers, A.P. Stiffening the stingray skeleton—An investigation of durophagy in myliobatid stingrays (Chondrichthyes, Batoidea, Myliobatidae). J. Morphol. 2000, 243, 113–126. [Google Scholar] [CrossRef]
- Randall, J.E. Contributions to the biology of the queen conch, Strombus gigas. Bull. Mar. Sci. 1964, 14, 246–295. [Google Scholar]
- Iversen, E.S.; Jory, D.E.; Bannerot, S.P. Predation on queen conchs, Strombus gigas, in the Bahamas. Bull. Mar. Sci. 1986, 39, 61–75. [Google Scholar]
- Ajemian, M.J.; Powers, S.P.; Murdoch, T.J.T. Estimating the potential impacts of large mesopredators on benthic resources: Integrative assessment of spotted eagle ray foraging ecology in Bermuda. PLoS ONE 2012, 7, e40227. [Google Scholar] [CrossRef]
- Serrano-Flores, F.; Pérez-Jiménez, J.C.; Méndez-Loeza, I.; Bassos-Hull, K.; Ajemian, M.J. Comparison between the feeding habits of spotted eagle ray (Aetobatus narinari) and their potential prey in the southern Gulf of Mexico. J. Mar. Biol. Assoc. UK 2019, 99, 661–672. [Google Scholar] [CrossRef]
- Schluessel, V.; Bennett, M.B.; Collin, S.P. Diet and reproduction in the white-spotted eagle ray Aetobatus narinari from Queensland, Australia and the Penghu Islands, Taiwan. Mar. Freshw. Res. 2010, 61, 1278–1289. [Google Scholar] [CrossRef]
- Nielsen, J.M.; Clare, E.L.; Hayden, B.; Brett, M.T.; Kratina, P. Diet tracing in ecology: Method comparison and selection. Methods Ecol. Evol. 2018, 9, 278–291. [Google Scholar] [CrossRef]
- Bade, L.M.; Balakrishnan, C.N.; Pilgrim, E.M.; McRae, S.B.; Luczkovich, J.J. A genetic technique to identify the diet of cownose rays, Rhinoptera bonasus: Analysis of shellfish prey items from North Carolina and Virginia. Environ. Biol. Fishes 2014, 97, 999–1012. [Google Scholar] [CrossRef]
- Kress, W.J.; Erickson, D.L. DNA barcodes: Genes, genomics, and bioinformatics. Proc. Natl. Acad. Sci. USA 2008, 105, 2761–2762. [Google Scholar] [PubMed]
- Hebert, P.D.N.; Cywinska, A.; Ball, S.L.; DeWaard, J.R. Biological identifications through DNA barcodes. Proc. R. Soc. B Biol. Sci. 2003, 270, 313–321. [Google Scholar] [CrossRef]
- Mikkelsen, N.T.; Schander, C.; Willassen, E. Local scale DNA barcoding of bivalves (Mollusca): A case study. Zool. Scr. 2007, 36, 455–463. [Google Scholar] [CrossRef]
- Arnold, W.S.; Marelli, D.C.; Parker, M.; Hoffman, P.; Frischer, M.; Scarpa, J. Enhancing hard clam (Mercenaria spp.) population density in the Indian River Lagoon, Florida: A comparison of strategies to maintain the commercial fishery. J. Shellfish Res. 2002, 21, 659–672. [Google Scholar] [CrossRef]
- Hurley, B.; O’Connell, T. State by State Summary of Shellfish Aquaculture Leasing/Permitting Requirements (2021); NOAA Fisheries: Silver Spring, MD, USA, 2021; pp. 77–88. Available online: https://media.fisheries.noaa.gov/2021-09/Report-State-by-State-Summary-of-Shellfish-Aquaculture-Leasing-Permitting-Requirements-2021.pdf (accessed on 27 June 2023).
- Online Resource Guide for Florida Shellfish Aquaculture: About the Industry. Available online: https://shellfish.ifas.ufl.edu/industry-2019/ (accessed on 27 June 2023).
- Cahill, B.V.; McCulloch, K.L.; DeGroot, B.C.; Bassos-Hull, K.; Ajemian, M.J. Breaking bags and crunching clams: Assessing whitespotted eagle ray interactions with hard clam aquaculture gear. Aquac. Environ. Interact. 2023, 15, 59–71. [Google Scholar] [CrossRef]
- Cahill, B.V.; DeGroot, B.C.; Brewster, L.R.; Lombardo, S.M.; Bangley, C.W.; Ogburn, M.B.; Ajemian, M.J. Visitation patterns of two ray mesopredators at shellfish aquaculture leases in the Indian River Lagoon, Florida. PLoS ONE 2023, 18, e0285390. [Google Scholar] [CrossRef]
- Boggio-Pasqua, A.; Bassos-Hull, K.; Aeberhard, W.H.; Hoopes, L.A.; Swider, D.A.; Wilkinson, K.A.; Dureuil, M. Whitespotted eagle ray (Aetobatus narinari) age and growth in wild (in situ) versus aquarium-housed (ex situ) individuals: Implications for conservation and management. Front. Mar. Sci. 2022, 9, 960822. [Google Scholar]
- Sturm, A. Montastraea cavernosa DNA Extraction with Dispersion Buffer, Version 1.0; Zenodo: Geneva, Switzerland, 2020. [CrossRef]
- Geller, J.; Meyer, C.; Parker, M.; Hawk, H. Redesign of PCR primers for mitochondrial cytochrome c oxidase subunit I for marine invertebrates and application in all-taxa biotic surveys. Mol. Ecol. Resour. 2013, 13, 851–861. [Google Scholar] [CrossRef] [PubMed]
- Oksanen, J.; Simpson, G.L.; Blanchet, F.G.; Kindt, R.; Legendre, P.; Minchin, P.R.; O’Hara, R.B.; Solymos, P.; Stevens, M.H.H.; Szoecs, E.; et al. Package “vegan” 2022. Available online: https://cran.r-project.org/web/packages/vegan/vegan.pdf (accessed on 27 June 2023).
- Muñoz, R.C.; Currin, C.A.; Whitfield, P.E. Diet of invasive lionfish on hard bottom reefs of the Southeast USA: Insights from stomach contents and stable isotopes. Mar. Ecol. Prog. Ser. 2011, 432, 181–193. [Google Scholar] [CrossRef] [Green Version]
- Bornatowski, H.; Wosnick, N.; Do Carmo, W.P.D.; Corrêa, M.F.M.; Abilhoa, V. Feeding comparisons of four batoids (Elasmobranchii) in coastal waters of southern Brazil. J. Mar. Biol. Assoc. UK 2014, 94, 1491–1499. [Google Scholar] [CrossRef]
- Bizarro, J.J.; Robinson, H.J.; Rinewalt, C.S.; Ebert, D.A. Comparative feeding ecology of four sympatric skate species off central California, USA. In Biology of Skates. Developments in Environmental Biology of Fishes 27; Ebert, D.A., Sulikowski, J.A., Eds.; Springer: Dordrecht, The Netherland, 2009; Volume 27, pp. 197–220. [Google Scholar] [CrossRef]
- Gray, A.E.; Mulligan, T.J.; Hannah, R.W. Food habits, occurrence, and population structure of the bat ray, Myliobatis californica, in Humboldt Bay, California. Environ. Biol. Fishes 1997, 49, 227–238. [Google Scholar] [CrossRef]
- Clarke, K.R.; Warwick, R.M. Change in Marine Communities: An Approach to Statistical Analysis and Interpretation, 2nd ed.; PRIMER-E Ltd.: Plymouth, UK, 2014. [Google Scholar]
- Martinez Arbizu, P. Package “pairwiseAdonis” 2020. Available online: https://github.com/pmartinezarbizu/pairwiseAdonis (accessed on 27 June 2023).
- Ajemian, M.J.; Powers, S.P. Habitat-specific feeding by cownose rays (Rhinoptera bonasus) of the northern Gulf of Mexico. Environ. Biol. Fishes 2012, 95, 79–97. [Google Scholar] [CrossRef]
- DeGroot, B.C.; Bassos-Hull, K.; Wilkinson, K.A.; Lowerre-Barbieri, S.; Poulakis, G.R.; Ajemian, M.J. Variable migration patterns of whitespotted eagle rays Aetobatus narinari along Florida’s coastlines. Mar. Biol. 2021, 168, 18. [Google Scholar] [CrossRef]
- Cutter, J. A Novel Interaction: The Thin Stripe Hermit Crab, Clibanarius vittatus, Kills the Florida Crown Conch, Melongna corona, for Its Shell [sic]. Mater’s Thesis, Florida Atlantic University, Boca Rato, FL, USA, 2017. Available online: https://www.proquest.com/docview/1987556291/abstract/7A05A5937C65423FPQ/1 (accessed on 27 June 2023).
- Lowery, W.A.; Nelson, W.G. Population ecology of the hermit crab Clibanarius vittatus (Decapoda: Diogenidae) at Sebastian Inlet, Florida. J. Crustac. Biol. 1988, 8, 548–556. [Google Scholar] [CrossRef]
- Kelly, C.J.; Turner, R.L. Distribution of the hermit crabs Clibanarius vittatus and Pagurus maclaughlinae in the northern Indian River Lagoon, Florida: A reassessment after 30 years. J. Crustac. Biol. 2011, 31, 296–303. [Google Scholar] [CrossRef] [Green Version]
- Szczepanski, J.A.; Bengtson, D.A. Quantitative food habits of the bullnose ray, Myliobatis freminvillii, in Delaware Bay. Environ. Biol. Fishes 2014, 97, 981–997. [Google Scholar] [CrossRef]
- Ajemian, M.J.; Powers, S.P. Seasonality and ontogenetic habitat partitioning of cownose rays in the northern Gulf of Mexico. Estuaries Coasts 2016, 39, 1234–1248. [Google Scholar] [CrossRef]
- Kolmann, M.A.; Huber, D.R.; Motta, P.J.; Grubbs, R.D. Feeding biomechanics of the cownose ray, Rhinoptera bonasus, over ontogeny. J. Anat. 2015, 227, 341–351. [Google Scholar] [CrossRef] [PubMed] [Green Version]
- Merriner, J.V.; Smith, J.W. A Report to the Oyster Industry of Virginia on the Biology and Management of the Cownose ray (Rhinoptera bonasus, Mitchill) in Lower Chesapeake Bay; Virginia Institute of Marine Science, College of William and Mary: Williamsburg, VA, USA, 1979. [Google Scholar] [CrossRef]
- Smith, J.W.T. The Life History of the Cownose ray, Rhinoptera bonasus (Mitchill 1815), in Lower Chesapeake Bay with Notes on the Management of the Species; Virginia Institute of Marine Science, College of William and Mary: Williamsburg, VA, USA, 1980. [Google Scholar] [CrossRef]
- Heslinga, G.A.; Perron, F.E.; Orak, O. Mass culture of giant clams (F. Tridacnidae) in Palau. Aquaculture 1984, 39, 197–215. [Google Scholar] [CrossRef]
- Peterson, C.H.; Fodrie, J.F.; Summerson, H.C.; Powers, S.P. Site-specific and density-dependent extinction of prey by schooling rays: Generation of a population sink in top-quality habitat for bay scallops. Oecologia 2001, 129, 349–356. [Google Scholar] [CrossRef]
- Grubbs, R.D.; Carlson, J.K.; Romine, J.G.; Curtis, T.H.; McElroy, W.D.; McCandless, C.T.; Cotton, C.F.; Musick, J.A. Critical assessment and ramifications of a purported marine trophic cascade. Sci. Rep. 2016, 6, 20970. [Google Scholar] [CrossRef] [Green Version]
- Scarpa, J.; Sturmer, L.N.; Adams, C.M.; Creswell, R.L.; Nuñez, J. Sunray Venus clam: A New Species to Diversify the Florida Aquaculture Hard Clam Industry; Florida Sea Grant Program: Gainesville, FL, USA, 2009; pp. 1–23. [Google Scholar]
- Sturmer, L.N.; Nuñez, J.M.; LeRoy Creswell, R.; Baker, S.M. The Potential of Blood Ark and Ponderous Ark Aquaculture in Florida: Results of Spawning, Larval Rearing, Nursery and Growout Trials; Florida Sea Grant Program: Gainesville, FL, USA, 2009; p. 81. [Google Scholar]
- Sturmer, L.N.; Scarpa, J.; Adams, C.M.; Creswell, R.L. Species Diversification in Florida Shellfish Aquaculture: Nursery and Growout Culture of the Sunray Venus Clam; Florida Sea Grant Program: Gainesville, FL, USA, 2011; pp. 1–38. [Google Scholar]
- Paine, R.T. Trophic relationships of 8 sympatric predatory gastropods. Ecology 1963, 44, 63–73. [Google Scholar] [CrossRef]
- Bowling, C. Habitat and size of the Florida crown conch (Melongena corona Gmelin): Why big snails hang out at bars. J. Exp. Mar. Biol. Ecol. 1994, 175, 181–195. [Google Scholar] [CrossRef]
- Sokolov, E.P. An improved method for DNA isolation from mucopolysaccharide-rich molluscan tissues. J. Molluscan Stud. 2000, 66, 573–575. [Google Scholar] [CrossRef]
- Yeates, C.; Gillings, M.R.; Davison, A.D.; Altavilla, N.; Veal, D.A. Methods for microbial DNA extraction from soil for PCR amplification. Biol. Proced. Online 1998, 1, 40–47. [Google Scholar] [CrossRef] [PubMed] [Green Version]
- Creer, S.; Deiner, K.; Frey, S.; Porazinska, D.; Taberlet, P.; Thomas, W.K.; Potter, C.; Bik, H.M. The ecologist’s field guide to sequence-based identification of biodiversity. Methods Ecol. Evol. 2016, 7, 1008–1018. [Google Scholar] [CrossRef] [Green Version]
- Van Zinnicq Bergmann, M.P.M.; Postaire, B.D.; Gastrich, K.; Heithaus, M.R.; Hoopes, L.A.; Lyons, K.; Papastamatiou, Y.P.; Schneider, E.V.C.; Strickland, B.A.; Talwar, B.S.; et al. Elucidating shark diets with DNA metabarcoding from cloacal swabs. Mol. Ecol. Resour. 2021, 21, 1056–1067. [Google Scholar] [CrossRef] [PubMed]
- Littleford-Colquhoun, B.L.; Sackett, V.I.; Tulloss, C.V.; Kartzinel, T.R. Evidence-based strategies to navigate complexity in dietary DNA metabarcoding: A reply. Mol. Ecol. 2022, 31, 5660–5665. [Google Scholar] [CrossRef] [PubMed]
- McCutchan, J.H., Jr.; Lewis, W.M., Jr.; Kendall, C.; McGrath, C.C. Variation in trophic shift for stable isotope ratios of carbon, nitrogen, and sulfur. Oikos 2003, 102, 378–390. [Google Scholar] [CrossRef]
- Shiffman, D.S.; Gallagher, A.J.; Boyle, M.D.; Hammerschlag-Peyer, C.M.; Hammerschlag, N. Stable isotope analysis as a tool for elasmobranch conservation research: A primer for non-specialists. Mar. Freshw. Res. 2012, 63, 635–643. [Google Scholar] [CrossRef] [Green Version]
- Neves, R.A.F.; Nascimento, S.M.; Santos, L.N. Harmful algal blooms and shellfish in the marine environment: An overview of the main molluscan responses, toxin dynamics, and risks for human health. Environ. Sci. Pollut. Res. 2021, 28, 55846–55868. [Google Scholar] [CrossRef]
- Bricelj, V.M.; Haubois, A.-G.; Sengco, M.R.; Pierce, R.H.; Culter, J.K.; Anderson, D.M. Trophic transfer of brevetoxins to the benthic macrofaunal community during a bloom of the harmful dinoflagellate Karenia brevis in Sarasota Bay, Florida. Harmful Algae 2012, 16, 27–34. [Google Scholar] [CrossRef]
- Abraham, A.; Flewelling, L.J.; El Said, K.R.; Odom, W.; Geiger, S.P.; Granholm, A.A.; Jackson, J.T.; Bodager, D. An occurrence of neurotoxic shellfish poisoning by consumption of gastropods contaminated with brevetoxins. Toxicon 2021, 191, 9–17. [Google Scholar] [CrossRef] [PubMed]


| ID | Date | Coast | Location | Sex | Life Stage | DW (cm) | SER Weight (kg) | GC Weight (g) | Unique Taxa |
|---|---|---|---|---|---|---|---|---|---|
| SER1 | 22 May 2020 | Gulf | Sarasota | F | Mature | 165.4 | 66.6 | 14.3 | 2 |
| SER2 | 27 May 2020 | Atlantic | Fort Pierce | F | Mature | 135.6 | 35.9 | 0.6 | 2 |
| SER3 | 28 May 2020 | Gulf | Sarasota | F | Mature | 157.8 | 64.4 | 22.8 | 1 |
| SER4 | 28 May 2020 | Gulf | Sarasota | F | Mature | 184.2 | 91.2 | 18.6 | 4 |
| SER5 | 29 May 2020 | Gulf | Sarasota | F | Mature | 179.0 | 96.1 | 7.4 | 2 |
| SER6 | 29 May 2020 | Gulf | Sarasota | F | Mature | 164.0 | 73.0 | 2.2 | 1 |
| SER7 | 9 June 2020 | Atlantic | Sebastian | M | Mature | 134.6 | 32.3 | 18.2 | 3 |
| SER8 | 22 June 2020 | Atlantic | Sebastian | M | Mature | 141.8 | 42.1 | 3.2 | 3 |
| SER9 | 23 June 2020 | Atlantic | St. Lucie | M | Juvenile | 120.8 | 26.1 | 8.2 | 4 |
| SER10 | 9 July 2020 | Atlantic | Fort Pierce | F | Juvenile | 126.2 | 30 | 115.5 | 6 |
| SER11 | 9 July 2020 | Atlantic | Fort Pierce | F | Juvenile | 125.0 | 27.9 | 14.9 | 4 |
| SER12 | 21 July 2020 | Atlantic | Sebastian | M | Mature | 133.5 | 37.2 | 20.2 | 3 |
| SER13 | 6 August 2020 | Atlantic | Sebastian | M | Juvenile | 126.0 | 30.3 | 9.5 | 7 |
| SER14 | 6 August 2020 | Atlantic | Sebastian | M | Mature | 128.0 | 31.6 | 8.3 | 2 |
| SER15 | 20 August 2020 | Gulf | Sarasota | M | Juvenile | 114.8 | 18.9 | 0.7 | 2 |
| SER16 | 28 September 2020 | Gulf | Sarasota | M | Juvenile | 106.2 | 20.2 | 8.1 | 1 |
| SER17 | 28 September 2020 | Gulf | Sarasota | M | Juvenile | 112.0 | 19.3 | 9.4 | 2 |
| SER18 | 26 October 2020 | Gulf | Sarasota | F | Juvenile | 111.2 | 22.0 | 1.5 | 1 |
| SER19 | 16 December 2020 | Atlantic | Sebastian | M | YOY | 66.8 | 4.1 | 9.2 | 4 |
| SER20 | 16 December 2020 | Atlantic | Sebastian | F | Mature | 182.2 | 94.1 | 15.2 | 2 |
| SER21 | 17 December 2020 | Atlantic | Fort Pierce | F | Mature | 187.4 | 102.4 | 40.4 | 4 |
| SER22 | 17 December 2020 | Atlantic | Fort Pierce | F | Mature | 172.4 | 79.6 | 18.2 | 3 |
| SER23 | 16 February 2021 | Atlantic | Fort Pierce | M | Mature | 128.6 | 31.3 | 6.9 | 3 |
| SER24 | 17 February 2021 | Atlantic | St. Lucie | M | Mature | 140.8 | 36.1 | 11.4 | 6 |
| SER25 | 17 February 2021 | Atlantic | St. Lucie | M | Mature | 137.6 | 37.6 | 36.8 | 5 |
| SER26 | 17 February 2021 | Atlantic | St. Lucie | M | Mature | 138.4 | 36.8 | 26.3 | 4 |
| SER27 | 17 February 2021 | Atlantic | St. Lucie | M | Juvenile | 124.6 | 25.7 | 26.8 | 5 |
| SER28 | 17 March 2021 | Atlantic | St. Lucie | M | Mature | 133.4 | 36.4 | 23.0 | 2 |
| SER29 | 17 March 2021 | Atlantic | St. Lucie | F | Juvenile | 123.2 | 27.4 | 11.7 | 1 |
| SER30 | 18 March 2021 | Atlantic | St. Lucie | M | Mature | 143.8 | 43.7 | 8.0 | 3 |
| SER31 | 18 March 2021 | Atlantic | St. Lucie | F | Juvenile | 123.0 | 29.6 | 8.7 | 1 |
| SER32 | 18 March 2021 | Atlantic | St. Lucie | F | Mature | 166.0 | 68.9 | 30.1 | 4 |
| SER33 | 29 March 2021 | Atlantic | Sebastian | M | Mature | 139.0 | 39.4 | 105.0 | 4 |
| SER34 | 29 March 2021 | Atlantic | Sebastian | M | Juvenile | 110.8 | 18.6 | 6.8 | 2 |
| SER35 | 7 April 2021 | Gulf | Sarasota | F | Juvenile | 122.0 | 27.9 | 11.1 | 1 |
| SER36 | 8 April 2021 | Gulf | Sarasota | F | Juvenile | 118.0 | 26.5 | 3.7 | 1 |
| SER37 | 8 April 2021 | Gulf | Sarasota | F | Mature | 137.2 | 38.9 | 150.2 | 3 |
| SER38 | 8 April 2021 | Gulf | Sarasota | M | Juvenile | 105.4 | 17.8 | 54.1 | 2 |
| SER39 | 22 April 2021 | Gulf | Sarasota | F | Juvenile | 84.9 | 8.9 | 16.1 | 2 |
| SER40 | 22 April 2021 | Gulf | Sarasota | M | Juvenile | 124.5 | 31.7 | 67.4 | 2 |
| SER41 | 22 April 2021 | Gulf | Sarasota | F | YOY | 54.9 | 2.5 | 11.4 | 2 |
| SER42 | 23 April 2021 | Gulf | Sarasota | F | YOY | 54.0 | 2.5 | 9.5 | 3 |
| SER43 | 13 July 2021 | Atlantic | Sebastian | F | Mature | 165.8 | 69.25 | 32.6 | 4 |
| SER44 | 15 July 2021 | Atlantic | St. Lucie | M | Mature | 128.8 | 41.2 | 12.1 | 5 |
| SER45 | 15 July 2021 | Atlantic | St. Lucie | M | Mature | 149.8 | 50.3 | 95.4 | 4 |
| SER46 | 15 July 2021 | Atlantic | St. Lucie | F | Mature | 140.0 | 41.15 | 4.9 | 1 |
| SER47 | 15 July 2021 | Atlantic | St. Lucie | F | Juvenile | 112.2 | 22.8 | 5.6 | 3 |
| SER48 | 15 July 2021 | Atlantic | St. Lucie | M | Juvenile | 99.2 | 13.5 | 2.8 | 1 |
| SER49 | 25 August 2021 | Atlantic | Fort Pierce | F | Mature | 160.4 | 59.5 | 20.5 | 3 |
| SER50 | 25 August 2021 | Atlantic | Fort Pierce | F | Mature | 132.8 | 35.6 | 21.6 | 7 |
| Life Stage | Sebastian | Fort Pierce | St. Lucie | Sarasota | Total | % Vacuity |
|---|---|---|---|---|---|---|
| YOY | 1 | 0 | 0 | 2 | 4 [1] | 25.0% |
| Juvenile | 2 | 2 | 6 | 9 | 21 [2] | 9.5% |
| Mature | 7 | 6 | 10 | 6 | 36 [8] | 22.2% |
| Total | 11 [1] | 9 [1] | 17 [2] | 24 [7] | 61 [11] | |
| % Vacuity | 9.1% | 11.1% | 11.8% | 29.2% |
| Location | Life Stage | ||||||
|---|---|---|---|---|---|---|---|
| Class | Family | Sebastian | Fort Pierce | St. Lucie | Sarasota | Immature | Mature |
| Bivalvia | 70.0 | 100 | 87.5 | 82.4 | 90.9 | 79.3 | |
| Arcidae | 30.0 | 0.0 | 0.0 | 0.0 | 9.1 | 3.4 | |
| Cardiidae | 40.0 | 12.5 | 62.5 | 64.7 | 63.6 | 41.4 | |
| Donacidae | 10.0 | 25.0 | 43.8 | 5.9 | 31.8 | 13.8 | |
| Lucinidae | 20.0 | 62.5 | 0.0 | 0.0 | 4.5 | 20.7 | |
| Noetiidae | 30.0 | 12.5 | 0.0 | 0.0 | 9.1 | 6.9 | |
| Pinnidae | 10.0 | 12.5 | 6.2 | 5.9 | 4.5 | 10.3 | |
| Semelidae | 10.0 | 0.0 | 12.5 | 0.0 | 9.1 | 3.4 | |
| Veneridae | 20.0 | 0.0 | 6.2 | 29.4 | 18.2 | 13.8 | |
| Gastropoda | 70.0 | 100 | 75 | 41.2 | 50.0 | 79.3 | |
| Aplysiidae | 0.0 | 12.5 | 0.0 | 0.0 | 4.5 | 0.0 | |
| Busyconidae | 40.0 | 50.0 | 31.2 | 5.9 | 13.6 | 37.9 | |
| Cerithiidae | 0.0 | 37.5 | 6.2 | 0.0 | 9.1 | 6.9 | |
| Fasciolariidae | 10.0 | 12.5 | 0.0 | 29.4 | 22.7 | 6.9 | |
| Melongenidae | 40.0 | 12.5 | 6.2 | 0.0 | 4.5 | 17.2 | |
| Muricidae | 0.0 | 12.5 | 0.0 | 0.0 | 4.5 | 0.0 | |
| Naticidae | 0.0 | 12.5 | 25.0 | 11.8 | 9.1 | 17.2 | |
| Olividae | 0.0 | 12.5 | 6.2 | 0.0 | 0.0 | 6.9 | |
| Strombidae | 0.0 | 12.5 | 18.8 | 0.0 | 0.0 | 13.8 | |
| Tonnidae | 0.0 | 0.0 | 6.2 | 0.0 | 0.0 | 3.4 | |
| Turbinidae | 0.0 | 0.0 | 12.5 | 0.0 | 4.5 | 3.4 | |
| Malacostraca | 40.0 | 62.5 | 31.2 | 17.6 | 4.5 | 55.2 | |
| Diogenidae | 30.0 | 50.0 | 31.2 | 17.6 | 4.5 | 48.3 | |
| Paguridae | 10.0 | 12.5 | 0.0 | 0.0 | 0.0 | 6.9 | |
| Unknown | 20.0 | 12.5 | 18.8 | 0.0 | 18.2 | 17.2 | |
| Class | Family | Prey Species | %FO | %W | %IOI |
|---|---|---|---|---|---|
| Bivalvia | Arcidae | Anadara ovalis | 6.00 | 0.18 | 0.11 |
| Cardiidae | Dinocardium robustum | 28.00 | 24.56 | 68.76 | |
| Dallocardia muricata | 22.00 | 2.34 | 5.14 | ||
| Donacidae | Iphigenia brasiliana | 22.00 | 8.59 | 18.90 | |
| Lucinidae | Phacoides pectinatus | 14.00 | 4.89 | 6.85 | |
| Noetiidae | Noetia ponderosa | 8.00 | 0.60 | 0.48 | |
| Pinnidae | Atrina rigida | 8.00 | 0.27 | 0.22 | |
| Semelidae | Semele purpurascens | 6.00 | 0.67 | 0.40 | |
| Veneridae | Macrocallista nimbosa | 6.00 | 6.97 | 4.18 | |
| Chione cancellata | 4.00 | 0.67 | 0.27 | ||
| Pitar fulminatus | 4.00 | 0.65 | 0.26 | ||
| Veneridae spp. | 4.00 | 0.44 | 0.18 | ||
| Unidentified | Unidentified bivalve | 4.00 | 0.25 | 0.10 | |
| Gastropoda | Aplysiidae | Aplysia fasciata | 2.00 | 0.04 | 0.01 |
| Busyconidae | Fulguropsis pyruloides | 24.00 | 16.04 | 38.50 | |
| Busycon sinistrum | 8.00 | 3.55 | 2.84 | ||
| Cerithiidae | Cerithium atratum | 8.00 | 0.18 | 0.14 | |
| Fasciolariidae | Cinctura hunteria | 14.00 | 3.16 | 4.42 | |
| Melongenidae | Melongena corona | 12.00 | 10.23 | 12.28 | |
| Muricidae | Stramonita canaliculata | 2.00 | 0.02 | 0.00 | |
| Naticidae | Neverita duplicata | 6.00 | 0.83 | 0.50 | |
| Naticidae spp. | 2.00 | 0.33 | 0.07 | ||
| Polinices uber | 2.00 | 0.24 | 0.05 | ||
| Polinices spp. | 2.00 | 0.13 | 0.03 | ||
| Polinices lacteus | 2.00 | 0.04 | 0.01 | ||
| Olividae | Oliva sayana | 4.00 | 2.36 | 0.94 | |
| Strombidae | Strombus alatus | 6.00 | 1.23 | 0.74 | |
| Tonnidae | Tonna galea | 2.00 | 0.27 | 0.05 | |
| Turbinidae | Turbo castanea | 4.00 | 0.02 | 0.01 | |
| Unidentified | Unidentified gastropod | 2.00 | 0.24 | 0.05 | |
| Malacostraca | Diogenidae | Diogenidae spp. | 20.00 | 3.34 | 6.69 |
| Clibanarius vittatus | 6.00 | 3.38 | 2.03 | ||
| Petrochirus diogenes | 4.00 | 2.30 | 0.92 | ||
| Paguridae | Pagurus pollicaris | 4.00 | 0.45 | 0.18 | |
| Unidentified | Unidentified | Unidentified | 16.00 | 0.55 | 0.88 |
| (A) | ||||||
| Average dissimilarity | Sarasota | Fort Pierce | ||||
| Taxon | Av. Abund. | Av. Abund. | Av. Diss. | Diss/SD | Cum.% | p |
| D. robustum | 79.2 | 0.0 | 31.4 | 32.1 | 31.6 | 0.021 |
| P. pectinatus | 0.0 | 8.6 | 10.9 | 18.8 | 54.5 | 0.017 |
| (B) | ||||||
| Average dissimilarity | Sarasota | Sebastian | ||||
| Taxon | Av. Abund. | Av. Abund. | Av. Diss. | Diss/SD | Cum.% | p |
| D. robustum | 79.2 | 5.8 | 30.0 | 30.0 | 30.5 | 0.023 |
| C. cancellata | 0.0 | 7.9 | 5.5 | 15.0 | 61.3 | 0.023 |
| N. ponderosa | 0.0 | 2.0 | 1.9 | 4.8 | 91.7 | 0.020 |
| A. ovalis | 0.0 | 2.3 | 1.1 | 2.2 | 96.3 | 0.006 |
| (C) | ||||||
| Average dissimilarity | Sarasota | St. Lucie | ||||
| Taxon | Av. Abund. | Av. Abund. | Av. Diss. | Diss/SD | Cum.% | p |
| D. robustum | 79.2 | 3.0 | 30.7 | 29.8 | 31.4 | 0.001 |
| I. brasiliana | 0.1 | 18.5 | 17.3 | 25.0 | 49.2 | 0.022 |
| D. muricata | 0.0 | 5.2 | 7.5 | 14.2 | 75.8 | 0.011 |
| C. hunteria | 18.2 | 0.0 | 4.7 | 8.0 | 80.5 | 0.017 |
| (D) | ||||||
| Average dissimilarity | Fort Pierce | St. Lucie | ||||
| Taxon | Av. Abund. | Av. Abund. | Av. Diss. | Diss/SD | Cum.% | p |
| I. brasiliana | 4.4 | 18.5 | 20.4 | 24.5 | 22.1 | 0.020 |
| P. pectinatus | 8.8 | 0.0 | 11.2 | 16.7 | 50.9 | 0.031 |
| D. muricata | 1.0 | 5.2 | 8.5 | 14.0 | 70.1 | 0.035 |
| (E) | ||||||
| Average dissimilarity | Sebastian | St. Lucie | ||||
| Taxon | Av. Abund. | Av. Abund. | Av. Diss. | Diss/SD | Cum.% | p |
| I. brasiliana | 1.0 | 18.5 | 18.3 | 22.9 | 19.1 | 0.031 |
| C. cancellata | 7.9 | 0.0 | 6.0 | 14.0 | 63.0 | 0.017 |
| P. fulminatus | 14.9 | 0.3 | 6.0 | 16.7 | 69.3 | 0.035 |
| N. ponderosa | 2.0 | 0.0 | 2.0 | 4.3 | 89.6 | 0.008 |
| A. ovalis | 2.3 | 0.0 | 1.3 | 2.2 | 93.9 | 0.003 |
Disclaimer/Publisher’s Note: The statements, opinions and data contained in all publications are solely those of the individual author(s) and contributor(s) and not of MDPI and/or the editor(s). MDPI and/or the editor(s) disclaim responsibility for any injury to people or property resulting from any ideas, methods, instructions or products referred to in the content. |
© 2023 by the authors. Licensee MDPI, Basel, Switzerland. This article is an open access article distributed under the terms and conditions of the Creative Commons Attribution (CC BY) license (https://creativecommons.org/licenses/by/4.0/).
Share and Cite
Cahill, B.V.; Eckert, R.J.; Bassos-Hull, K.; Ostendorf, T.J.; Voss, J.D.; DeGroot, B.C.; Ajemian, M.J. Diet and Feeding Ecology of the Whitespotted Eagle Ray (Aetobatus narinari) from Florida Coastal Waters Revealed via DNA Barcoding. Fishes 2023, 8, 388. https://doi.org/10.3390/fishes8080388
Cahill BV, Eckert RJ, Bassos-Hull K, Ostendorf TJ, Voss JD, DeGroot BC, Ajemian MJ. Diet and Feeding Ecology of the Whitespotted Eagle Ray (Aetobatus narinari) from Florida Coastal Waters Revealed via DNA Barcoding. Fishes. 2023; 8(8):388. https://doi.org/10.3390/fishes8080388
Chicago/Turabian StyleCahill, Brianna V., Ryan J. Eckert, Kim Bassos-Hull, Thomas J. Ostendorf, Joshua D. Voss, Breanna C. DeGroot, and Matthew J. Ajemian. 2023. "Diet and Feeding Ecology of the Whitespotted Eagle Ray (Aetobatus narinari) from Florida Coastal Waters Revealed via DNA Barcoding" Fishes 8, no. 8: 388. https://doi.org/10.3390/fishes8080388